Abstract
Poly(ether ether ketone)/carbon-fiber (PEEK/CF) composites possess excellent mechanical and thermal stability but exhibit inadequate friction and wear resistance for demanding tribological applications. In this study, femtosecond laser texturing was used to generate sinusoidal–circular hybrid microtextures on PEEK/CF surfaces, and the effects of laser power and geometric parameters were systematically evaluated through a Taguchi L9 design. The optimal laser power of 0.85 W produced the highest machining quality factor (MQF = 0.968). The textures caused a hydrophilic-to-hydrophobic transition, increasing the static contact angle from 43° to 96.2°. Under boundary lubrication, all textured specimens exhibited reduced steady-state friction compared with the untreated surface. Among them, specimen L7—corresponding to the largest amplitude (A) and wavelength (B) levels in the orthogonal design—achieved the lowest average coefficient of friction (≈0.12) and generated the narrowest wear track. These results demonstrate that femtosecond-laser-fabricated hybrid microtextures effectively enhance lubricant retention and improve the tribological performance of PEEK/CF composites.
1. Introduction
Poly(ether ether ketone) (PEEK) is a high-performance thermoplastic polymer with outstanding mechanical properties, high-temperature capability, chemical resistance, and biocompatibility. Owing to these attributes, it has been widely adopted in aerospace, automotive, electrical and electronics, and biomedical applications. Compared with conventional metals, PEEK offers significant advantages such as low density, good processability, and excellent electrical insulation, and thus delivers reliable performance in demanding environments [1,2,3,4,5]. Nevertheless, despite its promise as a structural and functional material, pristine PEEK exhibits inherently unfavorable tribological behavior—namely a relatively high coefficient of friction and a high wear rate—which limits its further use in tribology without surface treatment.
One of the primary factors governing the frictional response of PEEK is its surface characteristics [6,7,8,9,10]. The polymer backbone contains abundant aromatic rings and ketone groups, which result in a comparatively low surface energy and weak adhesion to counterfaces; this makes it difficult to form and sustain a stable lubricating film during sliding. In addition, the low thermal conductivity of PEEK can lead to localized heat accumulation at the interface, promoting surface softening and aggravating wear. To mitigate these shortcomings, various surface-modification strategies have been proposed in recent years [11,12,13,14,15], including filler reinforcement, thin-film/coating deposition, and surface micro-texturing.
Among these, surface micro-texturing has emerged as an effective and versatile approach to tailor tribological performance. By introducing textures with designed morphologies and scales—such as grooves, dimples, or grid-like patterns—on the PEEK surface, one can regulate the real contact state, enhance lubricant retention, and reduce the true contact area, thereby markedly lowering the coefficient of friction and wear rate [16,17,18,19,20]. Micro-textures can also facilitate debris evacuation, act as oil reservoirs, and trap abrasive particles, delivering benefits under both dry and boundary-lubrication conditions. Consequently, micro-texturing PEEK not only compensates for the poor intrinsic surface tribology of the neat polymer but also opens avenues for its deployment in precision machinery, medical devices, and other wear-resistant components.
In summary, rational design and fabrication of surface micro-textures provide a high-efficiency, controllable route to significantly improve the tribological performance of PEEK without altering its bulk properties. Properly engineered texture geometries and parameters can reduce energy losses and wear, laying a solid foundation for the broader application of PEEK in high-precision and biomedical scenarios.
2. Materials and Methods
2.1. Materials and Pre-Treatment
Poly(ether ether ketone) (PEEK) is a semi-crystalline aromatic polymer within the poly(aryl ether ketone) (PAEK) family. Its backbone comprises aromatic rings, ether linkages, and ketone groups, imparting excellent thermal stability and mechanical performance. PEEK combines high strength, heat resistance, chemical resistance, and dimensional stability, making it one of the most capable high-performance engineering plastics. In this study, PEEK/carbon-fiber (PEEK/CF) specimens with dimensions 20 mm × 20 mm × 10 mm were prepared. Surfaces were sequentially abraded with 800–2000 grit SiC papers and polished to a surface roughness of Ra < 0.8 μm (see note), ultrasonically cleaned in 99 vol% anhydrous ethanol for 5 min, and air-dried.
During laser processing, understanding the basic physical properties of PEEK is essential for selecting appropriate energy-input parameters [21,22,23]. PEEK exhibits a relatively high melting point, low thermal conductivity, and limited absorption in the infrared range [24]. Excessive laser power can therefore cause surface carbonization and melt collapse, whereas insufficient power fails to achieve effective ablation and texture formation. Accordingly, the laser power window was determined with full consideration of the material’s thermo-physical properties. The relevant properties are summarized in Table 1.

Table 1.
Physical properties of PEEK.
2.2. Determination of Laser Power Window and Experimental Setup
Based on the physical properties of PEEK (Table 1)—a relatively high melting point (≈343 °C), low thermal conductivity (0.25–0.29 W m−1 K−1), and comparatively large specific heat capacity (1.3–1.6 J g−1 K−1)—pronounced heat accumulation can occur during laser processing. Excessive local energy density tends to induce surface carbonization, vaporization, and melt collapse; conversely, insufficient energy fails to ablate the surface effectively, making it difficult to form clear and regular micro-textures. Therefore, rational control of laser power is critical to achieving the desired microstructural quality [25,26,27,28,29].
Accordingly, preliminary trials were conducted using an LR-femt1030-30 femtosecond laser system (LR-femto1030-30, Shengzi LaserRush Co., Ltd., Nanjing, China) at 25 °C to fabricate micro-textures on PEEK/CF (Figure 1). Five laser-power levels were selected for comparative experiments within 0.55–1.30 W; the specific values are listed in Table 2.
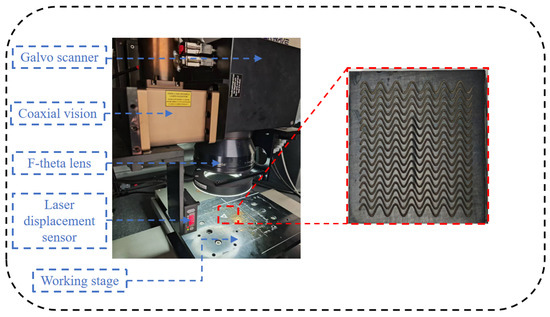
Figure 1.
Femtosecond-laser micro-texturing system and representative post-process surface morphology of PEEK/CF.
Table 2.
Laser processing parameters and values.
Figure 1 illustrates the laser processing setup for surface micro-texturing of PEEK and a representative textured morphology. The system comprises a galvo scanner, coaxial vision module, F-theta telecentric field lens, laser displacement sensor, and a high-precision working stage. The galvo scanner enables precise beam deflection and high-speed scanning; the coaxial vision module provides real-time monitoring of focus and toolpath; the F-theta lens maintains uniform focal distance and energy density across the scan field; the displacement sensor tracks focal offsets to ensure consistent machining depth; and the working stage secures the PEEK specimens and provides three-axis positioning.
On the right, a post-process image shows the sinusoidal micro-texture produced on the PEEK surface, demonstrating that, under the selected parameters, periodic and well-defined groove structures can be achieved. This configuration delivers high repeatability, precision, and uniformity in microstructure fabrication, providing stable specimens for subsequent friction and wear testing.
During micro-texturing, a single period of the texture was fabricated while keeping the scan speed, pulse repetition rate, and focal position constant, so that laser power was the only varying factor. After processing, surface profiles at multiple sites on each specimen were measured using confocal microscopy, as shown in Figure 2.
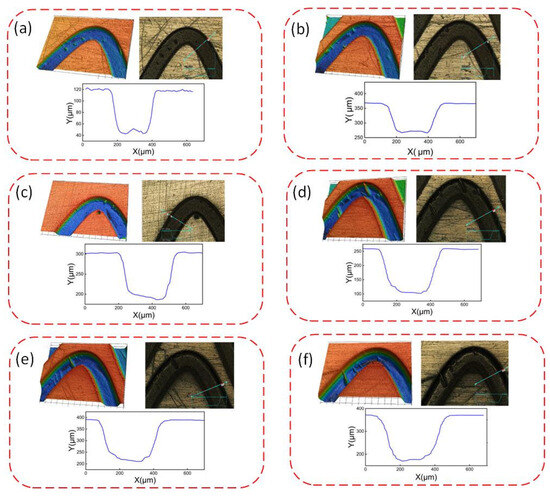
Figure 2.
Confocal surface morphologies and cross-sectional line profiles of PEEK/CF after femtosecond-laser texturing at different powers: (a) 0.55 W, (b) 0.70 W, (c) 0.85 W, (d) 1.00 W, (e) 1.15 W, and (f) 1.30 W. Scan speed, repetition rate, and focal position were kept constant.
Applying this procedure across all sample groups produced surfaces with different amplitudes, wavelengths, groove widths, and circular-pit diameters. The resulting confocal images (Figure 2) provide the experimental basis for analyzing how texture geometry affects the coefficient of friction, wear behavior, and static water contact angle in subsequent sections.
To quantitatively evaluate the machining quality of PEEK micro-textures at different laser powers, a machining quality factor (MQF) is proposed. MQF is defined from the geometric deviations of the groove and reflects the combined influence of energy input on removal uniformity, morphological integrity, and dimensional accuracy:
The closer MQF is to 1, the closer the machined geometry is to the design and the higher the machining quality. The target values h0 = 100 μm and w0 = 280 μm correspond to the intended design geometry in the Taguchi L9 array. These values were selected based on preliminary machining trials, which showed that (i) groove depths below approximately 80 µm provided insufficient lubricant storage, (ii) depths above 150 µm frequently caused melt collapse due to excessive thermal accumulation, and (iii) widths in the range of 250–300 µm yielded stable machining with minimal thermal distortion. Therefore, the chosen target geometry represents a balance between lubrication functionality and manufacturability, making it an appropriate reference for evaluating dimensional fidelity through MQF.
For each textured specimen, profiles were measured at the crest, quarter-wavelength, trough, and three-quarter-wavelength positions; the average was taken as the final value. The results are summarized in Table 3.
Table 3.
Geometric parameters and MQF at different laser powers.
Trend analysis: The observed depth evolution can be explained qualitatively by heat-diffusion behavior during femtosecond irradiation. Although no numerical simulation is performed, the temperature rise may be conceptually understood using a classical heat-diffusion framework that describes the accumulation and redistribution of heat within the laser-affected zone. Because PEEK exhibits low thermal conductivity and moderate heat capacity, heat tends to localize during repeated pulse exposure. At low power, the temperature does not reach the uniform ablation threshold, while excessive power promotes carbonization and melt-collapse, consistent with the experimentally observed deformation. The optimal power (0.85 W) represents a balance between effective ablation and minimized thermal damage.
It is worth noting that two-temperature or ultrafast ablation models are typically required for metals and crystalline solids where electron–phonon nonequilibrium dominates. In contrast, for semi-crystalline polymers such as PEEK under high-repetition-rate femtosecond irradiation (100 kHz), previous studies indicate that heat accumulation and thermal softening govern the ablation morphology. Therefore, a qualitative thermal-diffusion description is more appropriate for interpreting the experimental results in this study.
It should be emphasized that no analytical or numerical thermal simulation is performed in this work. The following discussion is intended only as a qualitative interpretation to contextualize the experimentally observed trends and does not constitute a quantitative thermal model.
2.3. Surface Micro-Texture Design and Orthogonal Experiment
To improve the tribological performance of PEEK and to systematically elucidate how geometric features affect frictional behavior, micro-texture design and an orthogonal experiment were conducted after optimizing the laser power to 0.85 W. A sine-wave texture was selected because its periodic undulations regulate the interfacial contact state, promote lubricant film formation, and reduce the real contact area—thereby lowering the coefficient of friction and frictional noise.
The sine-wave hybrid texture is parameterized by four primary factors:
A (Amplitude): height difference between crest and trough.
B (Wavelength): periodicity of surface undulation.
C (Track width): governs texture density per unit area.
D (Circular-pit diameter): combined with the sine track to enhance oil storage and buffering.
In this design, the sine track primarily modulates the sliding contact interface, whereas the circular pits act as local oil reservoirs and debris traps; the combination achieves synergistic friction reduction under varying operating conditions. To ensure machining fidelity and consistent comparisons, the sine-track depth was fixed at E = 100 μm, the circular-pit depth at F = 50 μm, and the laser scan speed and hatch spacing were kept constant throughout.
For efficient evaluation of multi-parameter effects, a Taguchi L9 orthogonal design (34) was employed, treating A, B, C, D as independent variables, each at three levels. The orthogonal design enables estimation of main effects (and indicative interactions) with a compact number of trials, providing a statistically reliable basis for parameter optimization [30,31,32]. The factor levels used in this study are summarized in Table 4, determined from preliminary trials and the machinability of PEEK/CF.
Table 4.
Factors and levels for the Taguchi L9 design.
According to the Taguchi L9 orthogonal array, nine parameter combinations were obtained; the correspondence between run IDs and factor settings is given in Table 5.
Table 5.
Parameter combinations for the Taguchi L9 design.
Using the nine parameter combinations defined by the Taguchi L9 design—and the previously determined optimal laser condition (0.85 W power with scan speed and focal position held constant)—laser micro-texturing was performed on the surfaces of nine PEEK specimens. During processing, the energy density and scan path were tightly controlled to ensure good repeatability and consistency of microstructure formation across all parameter sets.
2.4. Friction Testing and Characterization
To evaluate the effect of laser micro-texturing on the tribological performance of PEEK, friction and wear tests were conducted on nine textured specimens (L1–L9) and one untextured control. Experiments were performed at room temperature using a Bruker (CETR) UMT-2 Universal Mechanical Tester, to examine how surface micro-textures influence the coefficient of friction (COF) and wear characteristics.
Test apparatus: The friction and wear tests were conducted using a Bruker UMT-5 tribometer in a ball-on-flat configuration, as illustrated in Figure 3. The counter body was a polished AISI 52100 steel ball (diameter: 6 mm; hardness: HRC 58–62; grade: G10; surface roughness Ra: 0.02–0.05 μm). The ball was mounted on the upper holder and slid against the textured PEEK/CF specimens under boundary-lubrication conditions. The central module of the UMT-5 integrates loading and measurement functions, enabling precise COF acquisition under controlled normal load, sliding speed, and test duration. Each specimen was mounted on a high-precision reciprocating stage, while the upper loading head formed the counterface contact with the lower specimen to realize the sliding pair. Both the pre-polishing lay and the laser-textured grooves were oriented parallel to the sliding direction to eliminate frictional variations associated with surface lay misalignment.

Figure 3.
Friction and wear test apparatus.
- (1)
- Test conditions and setup
Friction tests were conducted in a high-speed steady sliding mode; the parameters are listed in Table 6. The normal load was 20 N, stroke was 10 mm, and frequency was 5.0 Hz, giving an average linear speed of 100 mm·s−1. Under these conditions the sliding pair reached a stable regime without stick–slip, ensuring good stability and repeatability. The lubricant was ISO VG 68 guideway oil, simulating a boundary-lubrication environment representative of engineering practice.
Table 6.
Parameters for the friction and wear tests.
- (2)
- Experimental procedure
Sample preparation: Nine textured specimens (L1–L9) and one untextured control (UT) were ultrasonically cleaned to remove surface contaminants and oils, ensuring consistent initial surface states.
Contact angle measurement: Before friction tests, static water contact angles were measured to compare wettability among UT and L1–L9. Specimens were ultrasonically cleaned with anhydrous ethanol, blow-dried, and equilibrated at room temperature (~25 °C) for ≥30 min. Measurements were taken on a Dataphysics OCA20 in sessile-drop mode using deionized water (drop volume ≈ 2 µL). Images were captured 2 s after deposition; left/right angles were fitted automatically and averaged for each point. At least three locations per specimen were tested; the arithmetic mean is reported as the specimen’s contact angle, with standard deviation shown as error bars.
SEM pre-inspection: Initial surface morphology was examined by SEM to verify texture quality and geometric integrity.
Friction and wear testing: On the UMT-2, load, stroke, and frequency were set as in Table 6. Sliding tests were run while continuously recording the coefficient of friction (COF)–time curves.
Post-analysis: After testing, the wear tracks were observed by SEM and compared with pre-test images to analyze texture evolution and stability during wear.
- (3)
- Experimental objective
The tribological tests systematically evaluate how different micro-texture parameters affect PEEK’s COF, wear morphology, and frictional noise. Results obtained under ISO VG 68 oil validate the effectiveness of laser-induced micro-textures in improving lubrication, reducing frictional resistance, and enhancing anti-wear performance.
3. Results
3.1. Wear Morphology and Surface Element Distribution
To examine the influence of laser micro-texturing on the surface morphology of PEEK, untextured and textured specimens were observed by scanning electron microscopy (SEM) at multiple magnifications, as shown in Figure 4.
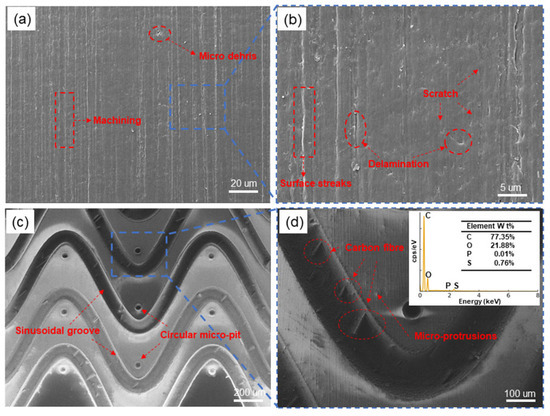
Figure 4.
SEM morphologies and EDS spectrum of PEEK/CF specimens before sliding: (a,b) untextured surface; (c,d) composite sinusoidal–circular micro-textured surface.
- (1)
- Surface morphology of untextured PEEK/CF.
Before tribological tests, the untextured PEEK/CF specimens were inspected, see Figure 4a,b. At low magnification (Figure 4a), numerous machining marks aligned with the sliding direction are visible, indicating that the surface largely retains polishing/abrading traces; a few fine debris particles appear locally, suggesting slight residue or micro-spallation. The high-magnification view (Figure 4b), taken from the boxed region in Figure 4a, reveals clearer striations with identifiable scratches and limited micro-peeling. Overall, these defects are sparse and unlikely to induce pronounced abrasive ploughing or adhesion damage during testing.
- (2)
- Surface morphology of hybrid micro-textured PEEK/CF.
In the low-magnification images (Figure 4c,d), the laser-processed specimens clearly exhibit a hybrid array composed of periodically repeated sinusoidal grooves and circular micro-pits. The sinusoidal grooves repeat regularly along the horizontal direction with nearly uniform amplitude and wavelength; the groove contours are continuous with smooth transitions, reflecting stable toolpath control. Circular micro-pits arranged near the crests/troughs have nearly uniform diameter and form a one-dimensional periodic array, demonstrating good repeatability and array uniformity consistent with the design. This indicates that the adopted process yields geometrically regular hybrid textures suitable for subsequent lubricant storage and debris trapping.
The local high-magnification image (Figure 4d) shows slight ridges along the groove sidewalls and pit rims, together with locally exposed carbon fibers. These regions may act as micro-asperities that carry load and experience shear during the initial sliding stage. No macroscopic cracks, obvious clusters of micro-voids, or extensive melt-collapse zones are observed, indicating that the present parameter set produces textures of overall good quality. The embedded EDS spectrum indicates C and O as the main elements with minor P and S, consistent with the PEEK/CF matrix and additives in the lubricant, suggesting no significant contamination introduced by the texturing process.
Compared with the largely linear polishing marks on the untextured surface, appropriate laser parameters transform the PEEK surface into a periodic, functionalized topography, markedly increasing roughness and specific surface area. The sinusoidal grooves provide continuous reservoirs and flow channels for the lubricant, facilitating a stable oil film during reciprocating sliding and mitigating dry contact and localized hot spots. The circular pits near each crest/trough serve as local oil pockets and debris traps, storing the lubricant and capturing loose particles to suppress three-body abrasion. Together, this hybrid micro-texture is expected to enhance load-carrying capacity while reducing friction and wear.
Post-test wear morphology: After friction testing, PEEK/CF specimens with different surface states and texture parameters exhibited pronounced differences; representative morphologies are shown in Figure 5. For the untextured specimen (Figure 5a,b), a wide and deep continuous wear track is observed, featuring distinct ploughing grooves and large areas of delamination, locally accompanied by bright adhesive films and smeared regions. This indicates that the dominant wear mechanisms are severe abrasive wear together with adhesive/fatigue delamination. Owing to the lack of oil-storage and buffering features, initial processing defects rapidly propagate under cyclic loading, causing large-scale material spallation from the surface.
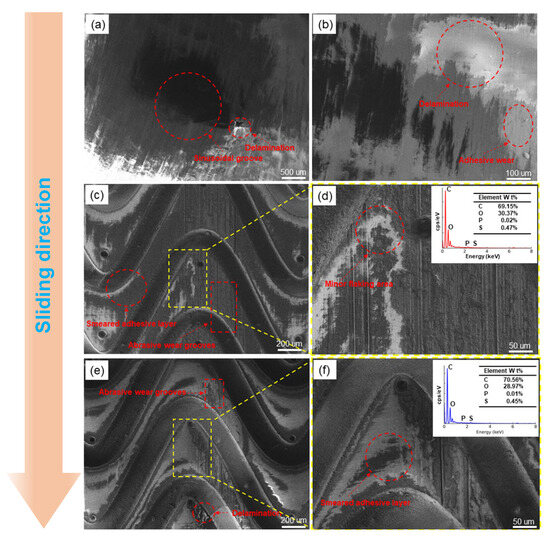
Figure 5.
Wear morphologies and EDS spectra of PEEK/CF specimens after sliding: (a,b) untextured surface; (c,d) composite micro-textured surface L6; (e,f) composite micro-textured surface L7 with larger texture amplitude.
For the specimen textured with the sinusoidal–circular hybrid pattern (L6; Figure 5c,d), the contours of the sinusoidal grooves and circular pits remain clear after sliding. Wear is mainly confined to the plateau regions between grooves and parts of the side slopes, manifested as localized adhesive smearing and moderate ploughing; only slight flaking is observed in isolated areas, and the wear-track width is markedly smaller than that of the untextured sample. EDS shows that, relative to the pre-test state, surface C decreases notably while O increases significantly, with P and S remaining at trace levels. This suggests the formation of an oxygen-rich C–O mixed transfer film and oxide layer on the textured surface during sliding, which helps reduce direct polymer/counterface contact and mitigates wear.
When the texture amplitude is increased (L7; Figure 5e,f), wear remains largely restricted to the plateaus and crest regions, and the groove interiors are mostly intact. However, ploughing grooves become more prominent, local delamination is slightly aggravated, and a thicker adhesive smear forms at pit–groove junctions, indicating more concentrated contact stresses at crests and on slopes. The corresponding EDS shows C ≈ 70 wt% and O ≈ 29 wt% (with P/S at trace levels), i.e., a somewhat more carbon-rich adhesive transfer film than in L6, while still exhibiting a C–O–dominated composition.
Synthesis of SEM/EDS findings: The untextured PEEK/CF suffers from numerous initial processing defects and lacks oil-storage/buffering units; under combined load and shear it readily evolves into extensive ploughing and delamination damage. In contrast, the laser-fabricated sinusoidal–circular hybrid texture preserves overall surface integrity to a considerable extent and demonstrates better wear and anti-fatigue performance than the untextured surface. The introduction of regular geometric units (i) reduces the sensitivity of wear behavior to initial defects by confining real contact and wear to limited plateau/crest areas, and (ii) promotes the formation of a C–O transfer film on the textured surface, shifting the surface composition from a “high-C, low-O” matrix signature toward a film with elevated O and comparable C and O contents, thereby lubricating and protecting the interface. Increasing amplitude from L6 to L7 further decreases the local real contact area and fosters a more carbon-rich adhesive film, but also intensifies contact stresses at crests/slopes, leading to more pronounced ploughing and localized delamination. This points to an optimum amplitude window for the hybrid texture that balances friction reduction with wear resistance.
Although SEM/EDS results support the formation of an oxygen-rich transfer film, detailed chemical-state identification using Raman or XPS spectroscopy was not performed here and will be incorporated in future studies to further clarify the tribo-film composition.
3.2. Contact Angle Analysis
Figure 6 presents the static water contact angles (with error bars) for the untextured specimen (UT) and the nine orthogonally designed textured specimens (L1–L9). The UT specimen shows a contact angle of only ≈42.9°, indicating a distinctly hydrophilic surface. In contrast, introducing the sinusoidal–circular hybrid micro-texture markedly increases the contact angle: values for L1–L9 fall within 72.6–96.2°. This suggests that the texture effectively reduces the real contact area between the droplet and the PEEK/CF substrate and traps air within grooves and pits, promoting a transition from a Wenzel-like to a Cassie–Baxter state and shifting the surface from hydrophilic to hydrophobic. The errors for all samples are <≈1.5°, indicating good repeatability and reliability.
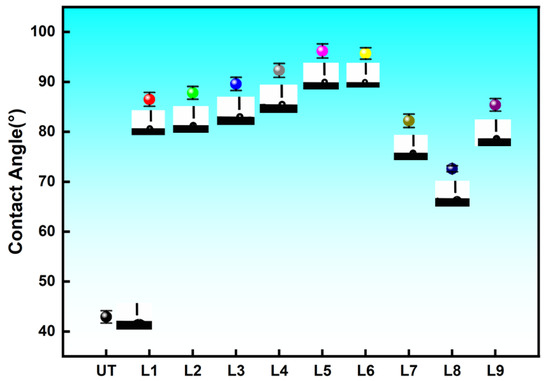
Figure 6.
Contact angles of PEEK/CF specimens with different sinusoidal–circular composite textures (UT and L1–L9).
The amplitude (A) exerts the most pronounced influence. With A = 600 um (L1–L3), the contact angle is ≈86.5–89.6°; increasing to A = 800 um (L4–L6) further raises it to ≈92.3–96.2°, with L5 (A = 800 um, B = 2500 um, C = 300 um, D = 40 um) reaching the maximum 96.2°. This indicates that a moderate amplitude favors the formation of a stable air cushion and a composite wetting interface. When A = 1000 um (L7–L9), the contact angle decreases to ≈72.6–85.4°, implying that excessive macroscopic undulation allows partial penetration of the droplet into the grooves and locally reverts the interface toward a Wenzel-like state, thereby lowering the apparent angle. Therefore, amplitude exhibits a “first increase then decrease” trend, with ≈800 um being optimal under the present conditions. Although the enhanced contact angle suggests a predominantly Cassie–Baxter wetting regime, localized Wenzel transitions may occur at groove sidewalls or pit rims, resulting in mixed wetting behavior commonly observed on multi-scale textured surfaces.
The effects of track width (C), wavelength (B), and pit diameter (D) are secondary but show discernible tendencies. Based on the orthogonal-analysis means, increasing C from 200 μm to 300 μm generally raises the contact angle, suggesting that a wider groove increases surface roughness and the air fraction. The ranges of B and D are small, indicating that within the tested levels their roles in tuning wettability are limited to fine adjustments. Overall, the influence ranking of geometric parameters on contact angle can be approximated as: Amplitude A > Track width C > Wavelength B≈Pit diameter D.
3.3. Friction and Wear Analysis
To assess how texture size influences the tribological performance of PEEK, friction–wear tests were conducted on 10 specimens (nine textured plus one untextured control) under a load of 20 N, frequency 5 Hz, and duration 1800 s. The COF–time curves for all samples are shown in Figure 7.
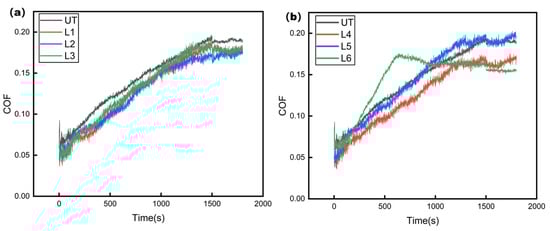
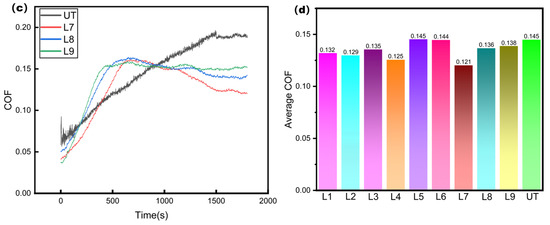
Figure 7.
COF–time curves from friction and wear tests: (a) COF–time: UT vs. L1–L3; (b) COF–time: UT vs. L4–L6; (c) COF–time: UT vs. L7–L9; (d) Mean COF comparison: UT and L1–L9.
From Figure 7, laser micro-texturing markedly improves the frictional performance of PEEK. Compared with the untextured surface, all textured specimens exhibit lower overall COF, smaller fluctuations, and higher stability during sliding. Among them, Specimens 1–4 rise rapidly at the beginning and then level off, showing good friction-reduction behavior; Specimens 5 and 6 maintain low COF in the mid-to-late stage, with Specimen 6 being more stable; and Specimens 7–9 remain at consistently low COF levels, clearly below the untextured control. Overall, Specimen 7 performs best, combining the lowest COF with minimal fluctuation, demonstrating that a well-designed surface texture can effectively reduce friction, lower energy loss, and enhance the wear resistance of PEEK.
To preliminarily assess the relative influence of the four geometric factors on the friction behavior, a range analysis was conducted based on the L9 orthogonal design. As summarized in Table 7, factor B (sine-wave wavelength) exhibited the largest range value (R = 0.013), indicating that it is the most sensitive parameter affecting the steady-state COF. The wavelength determines the global periodicity of the hybrid sinusoidal–circular texture and strongly influences lubricant entrainment and redistribution across the sliding interface. Therefore, variations in wavelength result in noticeable differences in friction performance.
Table 7.
Analysis of variance (ANOVA) for the effect of texture parameters on the steady-state COF.
Factor D (pit diameter) showed a moderate effect (R = 0.007), suggesting that the size of the lubricant reservoirs influences local shear behavior and contributes measurably to friction reduction. In contrast, factors A (amplitude) and C (track width) exhibited relatively small ranges (R = 0.006 for both), indicating minor influence on COF within the tested levels.
Overall, the range analysis reveals that the wavelength is the primary geometric factor governing friction behavior, followed by pit diameter, whereas amplitude and track width exhibit comparatively weaker effects. These findings are consistent with the lubrication mechanism of textured polymer composites under boundary and mixed lubrication conditions.
Based on the COF measurements and the Taguchi/ANOVA results, the following mechanistic insights can be drawn:Among the four geometric factors, the wavelength (factor B) shows the most pronounced influence on friction behavior. Increasing the wavelength from 2000 to 3000 μm results in smoother sinusoidal transitions along the sliding direction, which enhances lubricant entrainment and stabilizes the micro-hydrodynamic pressure field. This mechanism is consistent with the dominant contribution of factor B observed in the variance analysis (45.6%).
The pit diameter (factor D) exhibits a secondary level of influence. Larger pits provide greater lubricant storage capacity but also modify the local shear characteristics at the contact interface. This dual effect explains the moderate yet noticeable variation in COF among the tested pit sizes and aligns with the 17.3% variance contribution of factor D.
In comparison, the amplitude (factor A) and track width (factor C) exert relatively minor effects within the tested ranges. Variations in amplitude between 600 and 1000 μm do not significantly alter the load-bearing characteristics of the sinusoidal grooves, and changes in track width from 200 to 300 μm influence lubricant replenishment only marginally. Their low range values (R = 0.006) and limited ANOVA contributions confirm that these parameters play a subordinate role in determining friction performance.
Overall, these trends indicate that the global periodicity of the hybrid texture—primarily governed by the wavelength—dominates the lubrication and contact mechanics, while pit diameter provides a secondary tuning effect. Amplitude and track width contribute only weakly to friction reduction under the present boundary/mixed lubrication conditions.
It should be noted that the mechanistic explanation provided in this study is qualitative. Direct measurements of lubricant film thickness, real contact area, and flash temperature were not performed, and future work will incorporate these quantitative characterizations to further validate the proposed lubrication mechanism.
4. Conclusions
- (1)
- Laser-power effects on groove formation.
Laser-power gradients revealed that groove depth increased approximately linearly with power, whereas groove width changed only marginally. Insufficient ablation occurred below 0.7 W, producing shallow grooves with blurred edges, while powers above 1.0 W caused pronounced carbonization and melt collapse. Based on the machining quality factor (MQF), a power of ≈0.85 W yielded the most regular profile and a depth-to-width ratio closest to the intended design, representing the optimal processing window for fabricating sinusoidal–circular hybrid textures on PEEK/CF.
- (2)
- Wear mechanisms from SEM observations.
Untextured PEEK/CF exhibited continuous deep ploughing, adhesive smearing, fiber pull-out, and extensive delamination, indicative of severe adhesive–abrasive wear. In contrast, the textured specimens maintained much of their structural integrity, with wear primarily confined to plateau regions and local slopes. Among the designs, the sinusoidal-plus-circular hybrid textures—particularly L7—retained clear groove and pit contours, showed shallow wear scars, and limited plastic deformation. These features demonstrate that the hybrid texture redistributes contact stresses, suppresses local stress concentrations, delays wear propagation, and enhances anti-wear capacity under boundary lubrication.
- (3)
- Wettability and contact-angle behavior.
Laser texturing substantially increased the apparent contact angle, shifting the surface from hydrophilic (≈43° for UT) to hydrophobic (≈73–96° for L1–L9). Orthogonal analysis revealed that amplitude (A) has the dominant influence, followed by track width (C), whereas wavelength (B) and pit diameter (D) play secondary roles. A moderate amplitude (~800 μm) and suitable groove width promote stable air entrapment and reduce liquid–solid contact area, supporting a predominantly Cassie–Baxter wetting regime while allowing localized Wenzel transitions at groove sidewalls. This mixed-state wetting facilitates lubricant retention and subsequent friction reduction.
- (4)
- Friction reduction and tribological performance.
Micro-texturing significantly reduced the steady-state COF and improved sliding stability. Compared with the untextured surface (average COF ≈ 0.145), all textured specimens exhibited lower COF values in the range 0.121–0.138, corresponding to reductions of approximately 5–17%. The sinusoidal–circular hybrid design with A ≈ 800 μm, B ≈ 3000 um, C ≈ 250 um, and D ≈ 40 um (specimen L7) achieved the lowest average COF (≈0.121). This geometry promotes a stable lubricant film, reduces the real contact area, and facilitates lubricant replenishment and debris removal, thereby enhancing friction reduction and wear resistance under boundary-lubrication conditions. (5) Limitations and future work.
The present study evaluates tribological performance only for composite sinusoidal–circular textures. Because single-feature textures (sinusoidal-only and pit-only) were not fabricated, a strict demonstration of synergistic enhancement cannot yet be quantitatively established. Future work will prepare and compare single-feature textures to isolate the respective contributions of grooves and pits and to verify whether the hybrid design provides measurable synergistic benefits beyond those of individual texture types.
Author Contributions
Experiment, Y.C. and P.X.; experimental data curation, Y.C. and P.X.; writing—original draft, Y.C.; validation, Y.Y.; funding acquisition, Y.C.. and J.S.; supervision, Y.Y. and P.X.; writing—review and editing, J.S. and Y.Y. All authors have read and agreed to the published version of the manuscript.
Funding
Liaoning Provincial Department of Education Project (LJ212410147032).
Data Availability Statement
The data that support the findings of this study are available from the corresponding author upon reasonable request.
Conflicts of Interest
The authors declare no conflict of interest.
References
- Díaz, L.; Uriarte, X.; Landázuri, A.; Marāo, H.F.; Urrutia, P.; Torres, A.; Fan, S. The Use of PEEK Barriers in Bone Regeneration Procedures: A Scoping Review. Prosthesis 2025, 7, 101. [Google Scholar] [CrossRef]
- Kurtz, S.M.; Devine, J.N. PEEK Biomaterials in Trauma, Orthopedic, and Spinal Implants. Biomaterials 2007, 28, 4845–4869. [Google Scholar] [CrossRef]
- Lin, L.; Zhong, J.; Zhu, S.; Lu, J. Sampled-Data General Partial Synchronization of Boolean Control Networks. J. Frankl. Inst. 2022, 359, 1–11. [Google Scholar] [CrossRef]
- Hassan, E.A.M.; Ge, D.; Yang, L.; Zhou, J.; Liu, M.; Yu, M.; Zhu, S. Highly Boosting the Interlaminar Shear Strength of CF/PEEK Composites via Introduction of PEKK onto Activated CF. Compos. Part A Appl. Sci. Manuf. 2018, 112, 155–160. [Google Scholar] [CrossRef]
- Sun, W.; Chen, T.; Chen, T.; Liu, X.; Ye, J. Shear Localization in Ultralow Wear of PEEK/UPE Composites. Compos. Part A Appl. Sci. Manuf. 2024, 187, 108484. [Google Scholar] [CrossRef]
- Padhan, M.; Marathe, U.; Bijwe, J. Tribology of Poly(etherketone) Composites Based on Nano-Particles of Solid Lubricants. Compos. Part B Eng. 2020, 201, 108323. [Google Scholar] [CrossRef]
- Friedrich, K. Polymer Composites for Tribological Applications. Adv. Ind. Eng. Polym. Res. 2018, 1, 3–39. [Google Scholar] [CrossRef]
- Zhao, Y.; Lin, L. U-Net Segmentation with Bayesian-Optimized Weight Voting for Worn Surface Analysis of a PEEK-Based Tribological Composite. Lubricants 2025, 13, 324. [Google Scholar] [CrossRef]
- Federl, D.J.; Al-Rjoub, A. Influence of 3D-Printed PEEK on the Tribo-Corrosion Performance of Ti6Al4V Biomedical Alloy. Lubricants 2025, 13, 283. [Google Scholar] [CrossRef]
- do Vale, J.L.; Santana, A.C. Tribological Behavior Evaluation of Poly-Ether-Ether-Ketone (PEEK) in Dry Journal Bearing on Shaft Wear Test. Wear 2024, 556, 205447. [Google Scholar] [CrossRef]
- Ji, Z.; Ji, M.; Lv, Q.; Liang, M.; Xu, C. Potassium Titanate Whisker/Graphene Multi-Dimensional Fillers to Improve the Wear Resistance of Poly(Ether Ether Ketone) Composite. Lubricants 2025, 13, 211. [Google Scholar] [CrossRef]
- Yang, K.; Zhao, Y. Interfacial Crystallization Behavior and Properties of T1100-Grade Carbon Fiber Reinforced PEEK Composites. Compos. Commun. 2024, 52, 102133. [Google Scholar] [CrossRef]
- Pérez-Martín, H.; Mackenzie, P.; Baidak, A.; Ó Brádaigh, C.M.; Ray, D. Microstructural and Micromechanical Property Characterisation of CF/PEKK Composites Using Nanoindentation. Mater. Des. 2023, 234, 112359. [Google Scholar] [CrossRef]
- Maslavi, A.; Unal, H.; Olabi, M.N. Determination of “Tribological Performance Working Fields” for Pure PEEK and PEEK Composites under Dry Sliding Conditions. Wear 2024, 554–555, 205464. [Google Scholar] [CrossRef]
- Zhu, S.; Yan, S.; Gao, Y.; Qu, M.; Li, Y.; Zhou, J.; Dong, Y.; Zhang, W. Enhancing the Electromagnetic Shielding and Mechanical Properties of CF/PEEK Composites via Low-Concentration Fluff and Ni–Co Alloy Plating. Thin-Walled Struct. 2024, 205, 112563. [Google Scholar] [CrossRef]
- Xiao, L.; Zhang, X.; Wu, L.; Tao, Y.; Kang, X. Friction Performance Optimization Based on Sinusoidal Microtexture–DLC Coating Coupling: Effect of Circular Frequency on Reciprocating Friction Mechanism. Diam. Relat. Mater. 2025, 159, 112719. [Google Scholar] [CrossRef]
- Liu, C.; Liu, C.; Hu, X.; Yuan, W. The Effect of Bionic Scallop Microtexture Protrusions on the Tribological Performance of Shot-Peened 65Mn Steel Plow Surface. Ind. Lubr. Tribol. 2025, 77, 802–809. [Google Scholar] [CrossRef]
- Zhang, H.; Huang, H.; Yan, J. Simultaneous Laser Nitriding and Biomimetic Texturing: A Synergistic Strategy for Enhancing Mechanical Properties and Corrosion Resistance of Ti6Al4V Alloy. J. Mater. Process. Technol. 2025, 345, 119074. [Google Scholar] [CrossRef]
- Shimizu, J.; Nakayama, T.; Watanabe, K.; Yamamoto, T.; Onuki, T.; Ojima, H.; Zhou, L. Friction Characteristics of Mechanically Microtextured Metal Surface in Dry Sliding. Tribol. Int. 2020, 149, 105634. [Google Scholar] [CrossRef]
- Zhang, X.; Yang, H.; Li, J. Mechanisms of Synergistic Regulation on Friction and Wear Performance of SUS304 Stainless Steel by DLC Coatings and Laser-Textured Dimple Morphologies. Surf. Coat. Technol. 2025, 516, 132718. [Google Scholar] [CrossRef]
- Niu, C.; Shen, H.; Luan, C.; Ding, Z.; Dong, N.; Ji, Y.; Xu, G.; Fu, J. Optimization and Assessment of CF/PEEK–PEEK Composite Shell Manufactured by the Laser-Assisted In Situ Consolidation Integrated with Material Extrusion Process. J. Manuf. Process. 2024, 119, 452–462. [Google Scholar] [CrossRef]
- Zhang, S.; Tang, H.; Tang, D.; Liu, T.; Liao, W. Effect of Fabrication Process on the Microstructure and Mechanical Performance of Carbon Fiber Reinforced PEEK Composites via Selective Laser Sintering. Compos. Sci. Technol. 2024, 246, 110396. [Google Scholar] [CrossRef]
- Berretta, S.; Ghita, O.; Evans, K.E. Morphology of Polymeric Powders in Laser Sintering (LS): From Polyamide to New PEEK Powders. Eur. Polym. J. 2014, 59, 218–229. [Google Scholar] [CrossRef]
- Tang, H.; Yang, Y.; Zhang, S.; Chen, Z.; Liu, T. Laser Powder Bed Fusion of High-Performance Carbon Fiber Reinforced PEEK Composites: Process Design and Orthotropic Behavior Analysis. Compos. Part A Appl. Sci. Manuf. 2025, 196, 109013. [Google Scholar] [CrossRef]
- Ji, Y.; Luan, C.; Yao, X.; Ding, Z.; Niu, C.; Dong, N.; Fu, J. Mechanism and Behavior of Laser Irradiation on Carbon Fiber Reinforced Polyetheretherketone (CF/PEEK) during the Laser-Assisted In-Situ Consolidation Additive Manufacturing Process. Addit. Manuf. 2023, 74, 103713. [Google Scholar] [CrossRef]
- Berretta, S.; Evans, K.E.; Ghita, O. Processability of PEEK, a New Polymer for High Temperature Laser Sintering (HT-LS). Eur. Polym. J. 2015, 68, 243–266. [Google Scholar] [CrossRef]
- Han, P.; Tofangchi, A.; Zhang, S.; Desphande, A.; Hsu, K. Effect of In-Process Laser Interface Heating on Strength Isotropy of Extrusion-Based Additively Manufactured PEEK. Procedia Manuf. 2020, 48, 737–742. [Google Scholar] [CrossRef]
- Zhang, C.; Zhang, G.; Ji, V.; Liao, H.; Costil, S.; Coddet, C. Microstructure and Mechanical Properties of Flame-Sprayed PEEK Coating Remelted by Laser Process. Prog. Org. Coat. 2009, 66, 248–253. [Google Scholar] [CrossRef]
- Stokes-Griffin, C.M.; Compston, P. The Effect of Processing Temperature and Placement Rate on the Short Beam Strength of Carbon Fibre–PEEK Manufactured Using a Laser Tape Placement Process. Compos. Part A Appl. Sci. Manuf. 2015, 78, 274–283. [Google Scholar] [CrossRef]
- Zhang, Y.; Bai, P.; Li, Z.; Zhang, J. Rapid Optimization of Iron-Based Alloy Laser Cladding Process Based on Orthogonal Experiment and Machine Learning for Q345. Opt. Laser Technol. 2025, 182, 112086. [Google Scholar] [CrossRef]
- Fu, C.; Guo, T.; Sui, Y.; Zhu, T.; Huang, B. Working Condition Sensitivity Analysis and Optimal Structure Parameter Determination of IVT Based on CFD and Orthogonal Experiment. Case Stud. Therm. Eng. 2024, 64, 105479. [Google Scholar] [CrossRef]
- Jiao, H.; Wu, Y.; Guo, X.; Wang, S.; Jiang, L.; Wang, S.; Hao, L.; Tan, G. Optimization of V-Ti-Fe Hydrogen Storage Alloy Based on Orthogonal Experiments. J. Alloys Compd. 2024, 1002, 175262. [Google Scholar] [CrossRef]
Disclaimer/Publisher’s Note: The statements, opinions and data contained in all publications are solely those of the individual author(s) and contributor(s) and not of MDPI and/or the editor(s). MDPI and/or the editor(s) disclaim responsibility for any injury to people or property resulting from any ideas, methods, instructions or products referred to in the content. |
© 2025 by the authors. Licensee MDPI, Basel, Switzerland. This article is an open access article distributed under the terms and conditions of the Creative Commons Attribution (CC BY) license (https://creativecommons.org/licenses/by/4.0/).