Abstract
This study aims to identify the most suitable slag waste-filled polymer composite for automotive braking applications. It employs a hybrid multi-criteria decision-making (MCDM) model that integrates the “method based on the removal effects of criteria” (MEREC) and the “root assessment method” (RAM) method. Eight slag waste-filled polymer composites, evaluated using seven performance-defining criteria, were considered in the MCDM analysis. The performance evaluation criteria included the friction coefficient, wear, friction fluctuations, friction stability, fade-recovery aspects, and rise in disk temperature. The criteria were weighted through the MEREC approach, which identified fade% (0.2890) and wear (0.2829) as the most important attributes in the assessment. The RAM was employed to rank the alternatives and suggested that the composite alternative with 60 wt.% slag waste and 5 wt.% coir fiber proved to be the best composition for automotive braking applications. The results were validated using nine MCDM models and Spearman correlation coefficients, which showed that the ranking of alternatives was consistent and stable even when the normalization steps of MEREC were swapped. Statistical validation demonstrated a strong predictive accuracy (p < 0.05) with a strong correlation coefficient (>0.8) alongside a minimal mean absolute error. Furthermore, sensitivity analysis was performed by examining several weight situations to determine whether the priority weights influenced the ranking of the composite alternatives. The findings from both the correlation and sensitivity analyses confirm the proposed hybrid MEREC-RAM model’s consistency and effectiveness.
1. Introduction
Designing high-performance composite materials for automotive braking applications is a critical challenge in materials engineering [1]. The formulation design not only requires the careful selection and combination of raw materials but also demands the development of composites with superior tribological properties. These include a stable and high coefficient of friction (COF), excellent recovery characteristics, minimal vibrations, low wear, and high fade resistance under a wide range of operating conditions [1,2]. Polymer-based brake friction composites are designed using a combination of reinforcing fibers, binders, friction modifiers, and fillers [1,2,3]. While meeting the desired tribological performance remains a primary objective, compliance with stringent environmental and regulatory standards, such as the Euro 7 regulation, has become increasingly important [4]. These evolving standards are steering material scientists toward more sustainable approaches in the design and fabrication of brake friction materials [5,6]. To address these environmental regulations without compromising performance, researchers are replacing traditional ingredients with sustainable alternatives. Materials such as bio-based resins [7], natural fibers [8,9], and various wastes [7,10] have already demonstrated successful integration into brake friction composites, offering a promising route towards environmentally responsible and high-performance braking systems.
Waste management has emerged as a critical global issue, particularly in developing and rapidly industrializing nations [11]. Accelerated industrial growth and urbanization have significantly increased the generation of waste materials, posing serious environmental and sustainability challenges [11,12]. The utilization of waste materials not only supports the principles of a circular economy but also contributes to cleaner and more sustainable manufacturing practices [13]. Using waste materials in friction composites offers two primary advantages: cost-effectiveness and environmental benefits. As a result, readily available and cost-effective reinforcements, such as agricultural and industrial waste, are being increasingly explored for the development of brake friction composite materials. The research by Straffelini et al. [14] highlights the potential of aluminum anodizing waste in friction materials by integrating it at weights of 6% and 12% into a commercial formulation. 12 wt.% waste-added composites were reported to exhibit good COF and wear performance. Kanagaraj et al. [15] developed friction composite materials using ground granulated blast furnace slag ranging from 5 wt.% to 15 wt.%. The study concluded that the composite with 5 wt.% slag waste exhibited minimal frictional fluctuations and enhanced COF performance at elevated temperatures. Conversely, the composite with 15 wt.% slag waste exhibited enhanced wear resistance compared to composites with a lower slag waste content (≤10 wt.%). Waste foundry sand from 0 to 20 wt.% was also evaluated for its braking performance by Zheng et al. [16]. The study concluded that the friction stability remained higher for 20 wt.% waste-filled composites, while the wear performance was optimal for 5 wt.% filled composites. Overall, the brake material containing 10 wt.% to 15 wt.% waste sand showed excellent heat-fade resistance characteristics. Jayashree et al. [17] investigated the wear, friction, and emissions characteristics of formulations which included three types of slag with 6 wt.%. Braking results revealed that the addition of slag led to reduced or comparable emissions and wear compared to the reference formulation. The COF for the slag specimens was higher (0.49–0.51) compared to the reference composition, which had a COF of 0.45. Sugözü et al. [18] investigated the potential of fly ash (36 wt.% to 46 wt.%) in automotive brake friction materials. The formulation with 36 wt.% addition of fly ash showed better wear resistance while COF remained highest for 46 wt.% fly ash-loaded composites. Kılıç [19] investigated the tribological performance of fly ash-filled and hybrid flax/basalt fiber-reinforced polymer composites. The addition of fly ash and flax fiber was reported to enhance the COF and fade resistance but resulted in limited recovery performance and increased wear. Conversely, higher basalt fiber content improved recovery response and wear resistance. The study concluded that the composite with 6% fly ash, 10% basalt fiber, and 4% flax fiber met the best tribological performance criteria. The impact of agricultural waste, such as rice husks (0 to 12 wt.%), on the tribological performance of brake friction materials was investigated by Gehlen et al. [20]. At lower temperatures (300 °C), 12 wt.% rice husk-loaded composites exhibited the lowest wear, the lowest fade resistance, and the highest recovery with a comparable COF. At a higher temperature (550 °C), the composite with 6 wt.% rice husk exhibited the highest COF and recovery performance, along with the lowest wear. Unal and Demirdalmis [21] investigated the tribological properties of apricot kernel shell (0 to 10 wt.%)-filled friction materials. The study revealed that composites containing 5 wt.% agricultural waste exhibited the lowest wear, while those with 10 wt.% agricultural waste demonstrated the highest COFs.
The literature highlights that the primary challenge in designing friction composites is finding the optimal composition, as the amount of waste material directly affects the composite’s tribological properties. To achieve the best performance for automotive braking, a composite material must meet the desired tribological properties under various driving conditions. Therefore, selecting the ideal composite for brake applications requires a systematic and logical approach, rather than relying on experience, literature reviews, or trial and error. This process involves different material alternatives based on these multiple and often competing criteria. Therefore, using multi-criteria decision-making (MCDM) techniques is crucial for selecting the optimal brake friction composite. Over the past few years, numerous studies have investigated various MCDM methodologies to address the challenge of decision-making in different areas, including formulation optimization [19,22]. Some of the MCDM techniques commonly used include AHP, MOORA, VIKOR, TOPSIS, MARCOS, EDAS, and GRA [19,22,23,24]. Sotoudeh-Anvari [25] developed the root assessment method (RAM) approach, which is an outranking strategy for ranking and selecting a finite number of alternatives based on often conflicting criteria. Meanwhile, RAM is a very straightforward ranking approach in conception and implementation compared to the other methods, as indicated by its expanding use in diverse areas for multi-criteria analysis [26,27]. The MEREC method, which determines the objective weights of the criteria, was developed by Keshavarz-Ghorabaei et al. [28]. MEREC represents a novel objective weighting method within the MCDM framework, designed to determine the importance of criteria by evaluating their influence on the overall performance of alternatives when each criterion is systematically excluded. Because of its computational simplicity, the MEREC technique has been employed with and without modifications to boost its resilience, dependability, and application across multiple decision-making domains [29,30].
The literature highlights that MEREC and RAM MCDM models are available for decision-making; however, their application in optimizing the tribological properties of automotive brake friction materials has not yet been reported. Additionally, a vital aspect of any MCDM problem involves assessing the relative significance of various criteria. It has been shown that in a given MCDM problem, any change in the criterion weight might result in a different ranking order, highlighting that the weighting method used in the MCDM problem may also contribute to the inconsistency of the output [31]. Therefore, sensitivity analysis becomes crucial for assessing the robustness and reliability of MCDM outcomes [32]. Different approaches to sensitivity analysis are reported in the literature, including weight exchange scenarios, the impact of criteria or alternative removal on output, and single-dimensional weight sensitivity analysis. To date, a comparative study using various approaches for sensitivity analysis to optimize automotive brake friction materials has hardly been reported. Therefore, this paper focuses on optimizing tribological properties of slag waste-filled automotive brake friction materials using hybrid MEREC-RAM-based MCDM models. By utilizing data from previous research [33,34], the MEREC method was employed to assess the criterion weights, while alternative preferences were analyzed using the RAM approach. To determine the impact of different possible changes to the weights of the criteria on the ranking output of the alternatives, a sensitivity analysis was also conducted. The study presents significant contributions as follows:
- The study uses the MEREC-weighted RAM technique to design a sustainable polymer composite material for automotive braking applications.
- The ranking findings of the MEREC-RAM technique were compared to nine MCDM (MACBETH, MOORA, VIKOR, PSI, MAIRCA, MARCOS, RAWEC, PIV, and CoCoSo) models and validated using the Spearman correlation coefficient, mean absolute error, and p-value.
- A series of sensitivity analyses were conducted, including the MEREC method with swapping normalization steps, criterion weight exchange scenarios, alternative removal scenarios, criterion removal scenarios, and single dimensional sensitivity analysis, to evaluate the robustness and consistency of the proposed MEREC-RAM approach.
This paper is structured as follows: In Section 2, the implementation steps of the proposed hybrid MEREC-RAM approach are outlined, along with the formulation of the case study, which includes the definition of alternatives and criteria utilized in the selection process. In Section 3, the procedure of the proposed MEREC-RAM approach is carried out to achieve the best composite alternative, along with validation and sensitivity analysis. Section 4 presents a summary of key conclusions.
2. Methods
2.1. Hybrid MEREC-RAM Approach
This paper proposes a hybrid MEREC-RAM MCDM model to rank the alternatives. Figure 1 shows the relevant schematic design for the suggested optimization approach. The MEREC technique, developed by Keshavarz-Ghorabaee et al. [28], aims to determine objective weights of criterion importance in MCDM problems. MEREC is an innovative approach that gradually removes criteria from the assessment process to systematically analyze their influence on the alternatives. RAM, a recently introduced MCDM method by Sotoudeh-Anvari [25], establishes the ranking of alternatives subsequent to the assessment of their utility values. The core of the RAM is its aggregating function, which is designed to directly account for beneficial criteria while inversely considering cost-related criteria.
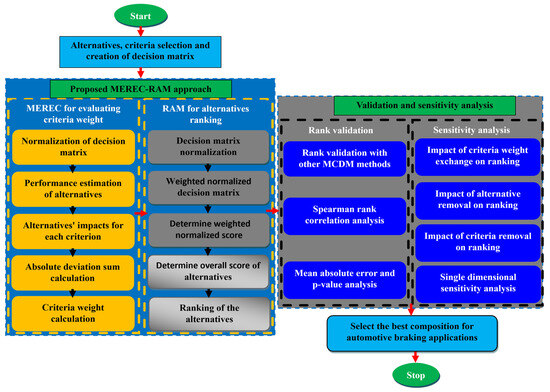
Figure 1.
The proposed MEREC-RAM framework.
2.1.1. MEREC Method for Criterion Weight Calculation
The MEREC method is a model for weight determination in MCDM, which uses an initial decision matrix to establish criterion weight using the following steps [28,29,30].
Step 1: First, a decision matrix is constructed which displays the values of each alternative with respect to each criterion. Suppose that there are
alternatives used in the assessment and
are the criteria employed for ranking these alternatives. The decision matrix is constructed using following equation.
Here, the element
in the decision matrix signifies the entity of the i-th alternative concerning the j-th criterion.
Step 2: For MEREC calculation the decision matrix in Equation (1) is normalized using the following equation.
where, for beneficial criteria,
, and for cost criteria,
.
Step 3: After decision matrix normalization, the overall performance of the alternatives is determined using the following formula.
Step 4: In this step, the performance of alternatives is analyzed by eliminating the impact of every criterion using the following equation.
Step 5: Following Equation (5), the sum of the absolute deviation resulting from the effects of removing criteria is computed using the following equation.
Step 6: Finally, the weights for the considered criteria are computed using the following Equation (6).
2.1.2. RAM for Alternative Ranking
The RAM consists of the subsequent steps [25,26,27]:
Step 1: The decision matrix is structured as presented in Equation (1).
Step 2: In this step the decision matrix is normalized using the following equation.
Step 3: The weighted normalized matrix is calculated using Equation (8) as follows.
In Equation (8), the weight of the criteria is determined using the MEREC method using Equation (6).
Step 4: This step involves calculating the total of the weighted normalized scores for both the beneficial and cost criteria of the alternatives, utilizing the following formula.
Step 5: This step involves calculating the overall score for each alternative using the following equation.
Step 6: Alternatives are arranged in descending order based on the value of
, with the most favorable choice being the one that has the highest
value.
2.2. Selection of Alternatives and Evaluation Criteria
2.2.1. Alternative Selection
The hybrid MEREC-RAM model relies on data collected from published sources. Slag waste-filled brake friction composites were selected as alternatives. The details of the used materials and the fabrication process followed for the development of composites can be found in the literature [33,34]. In total eight friction composites were selected as alternatives, with composition as described in Table 1.

Table 1.
Composition of the selected alternatives.
2.2.2. Criterion Selection
For assessment and ranking of friction composites, seven performance indicators were considered as criteria. The considered criteria included the COF (C-1), wear (C-2), friction stability coefficient (C-3), friction fluctuation (C-4), fade performance (C-5), recovery performance (C-6), and temperature rise of disk (C-7). The performance indicators were evaluated by analyzing the braking performance of the slag waste-filled composites using a Krauss tester in accordance with Economic Commission for Europe (ECE) regulation (R-90) procedure. The R-90 procedure includes, in total, 100 brakes, with 30 brakes for the bedding cycle and 70 brakes for the actual test cycle. The 70 brakes consisted of 10 brakes for cold runs, 50 brakes for fade runs, and 10 brakes for recovery runs. The comprehensive ECE R-90 protocol and test conditions have been documented in the literature [33,34]. A detailed description of the selected criteria is provided in Table 2.
Table 2.
Criteria used in the selection process.
3. Results
3.1. Criteria Results
The MCDM problem addressed in this study is formulated using experimental data sourced from the existing literature, with the primary objective being to evaluate the influence of variations in phenolic resin slag waste and coir fiber slag waste on the tribological properties of automotive brake friction composites [33,34]. The tribological results for the selected eight alternatives and seven criteria are summarized in Table 3. For a general vehicle such as a passenger car, it is better when criteria C-1 (COF), C-3 (friction stability coefficient), and C-6 (recovery performance) are higher (i.e., beneficial criteria), whereas it is better when C-2 (wear), C-4 (friction fluctuation), C-5 (fade performance), and C-7 (temperature rise of disk) are lower (i.e., cost criteria).
Table 3.
Criterion results.
Table 4 illustrates a single-factor optimization of the alternatives, systematically organizing them according to the performance of individual criteria listed in Table 3. An important finding from Table 4 is the lack of identical rankings in any two rows. This disparity reveals a notable degree of criterion conflict, emphasizing the need for a comprehensive, weighted MCDM approach to determine the best brake friction composite with enhanced tribological properties. Consequently, a hybrid MEREC-RAM approach is proposed to identify the most suitable alternative by considering all criteria simultaneously.
Table 4.
Priority of alternatives on the basis of individual criteria.
3.2. Calculation of Criterion Weight and Ranking of the Composite Alternatives
Equation (1) was used to organize the values of the decision matrix for the selected slag waste-filled friction composites that were assessed against the criteria as presented in Table 2. The normalization of the decision matrix was conducted using Equation (2), in accordance with beneficial and cost-related criteria. The normalized matrix is presented in Table 5. The overall performances () of the alternatives were also listed in Table 5 as computed using Equation (3). The performance of alternative () values determined by removing each criterion presented in Table 6 were derived through the utilization of Equation (4).
Table 5.
Decision matrix normalization for MEREC evaluation.
Table 6.
The values of
.
The sum of absolute deviation () for each criterion was computed using Equation (5), while the weight () of every criterion was calculated by Equation (6). The
and
results are presented in Figure 2. The weight of criterion C-5 (i.e., fade performance) was found to be the highest, with a value of 0.289, followed by criterion C-2 (i.e., wear), with a weight of 0.2829, and criterion C-4 (i.e., friction fluctuations), with a weight of 0.1878, whereas criterion C-3 (i.e., frictional stability coefficient) was found to have the lowest weight, with a value of 0.0431.
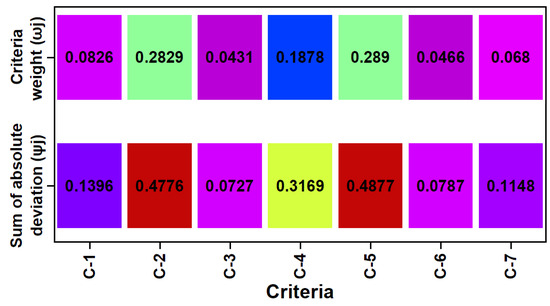
Figure 2.
Results of absolute deviation summation and criterion weight.
Following the determination of the weights of the criteria using the MEREC weighing method (Figure 2), the RAM was used for alternative ranking. This method begins with the establishment of the initial decision matrix comprising the composite alternatives and the different criteria, as presented in Table 3. After that, the decision matrix is normalized using Equation (7) and presented in Table 7. The weight of each criterion, as presented in Figure 2, is multiplied by the normalized decision matrix using Equation (8) to obtain the weighted normalized matrix, as presented in Table 8. Thereafter, Equations (9) and (10) are used to obtain the sum of the weighted normalized scores of the beneficial () and cost-related () criteria of the alternatives. The
and
results are listed in Table 8. The overall score () was calculated using Equation (11) and is depicted in Figure 3. It was observed that option A-5 had the highest
value, 1.4047. It was followed by A-3 ( = 1.4006) and A-4 ( = 1.4005), while option A-8 had the lowest
value, 1.3861. The options are systematically ranked based on their
values, as shown in Figure 3.
Table 7.
Decision matrix normalization for RAM evaluation.
Table 8.
Weighted normalized decision matrix for RAM analysis.
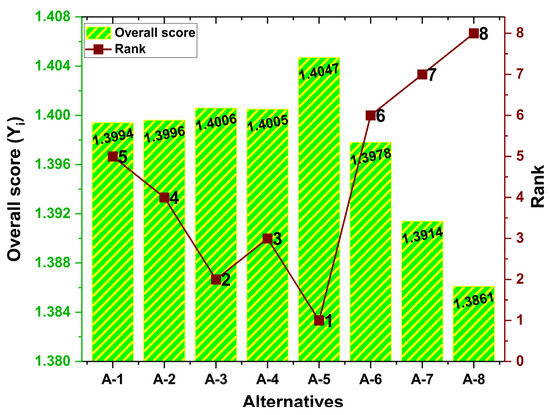
Figure 3.
Overall score (
) and ranking of the alternatives.
Figure 3 illustrates that, among the eight composite alternatives, the one comprising 60 wt.% slag waste filler and 5 wt.% coir fiber, designated as A-5, stands out as the most favorable option. The best ranking of composite A-5 can be attributed to its superior friction stability coefficient, minimal friction fluctuations, and fade%, in addition to its second highest COF performance. Comparable findings for COF, friction fluctuations, and fade performance have been documented in the literature for lower-content natural fiber-based composites. For instance, the highest COF and fade performance were observed with 4 wt.% cow dung fibers [35], 5 wt.% banana fibers [36], and 6 wt.% corn stalk fibers [37]. Higher content of industrial waste materials, such as fly ash, was also reported to increase COF, friction stability, and fade performance [38,39]. Studies have shown that brake composites with 5 wt.% natural fibers demonstrated the least amount of friction fluctuations and the highest levels of friction stability when compared to those with higher natural fiber content (>10 wt.%) [36,40]. Alternatives A-3 and A-4 are positioned as the second and third options, indicating a robust selection for optimal braking composition. The alternatives demonstrated the most wear resistance compared to all composites, while also achieving optimal fade performance. The fade% and wear were the most heavily weighted criteria; therefore, alternatives A-3 and A-4 receive higher rankings in the selection process. Alternatives A-3 and A-4, which contain 50–55 wt.% slag waste, showed noticeably improved wear resistance. This observation is consistent with previously reported findings on slag-filled brake friction composites [41,42]. For example, Sagiroglu and Akdogan [42] evaluated friction materials with varying slag waste contents and determined that the composite incorporating 50 wt.% slag waste exhibited the lowest wear. The primary benefits of the fourth (A-2) and fifth (A-1) ranked alternatives are their higher COF, reduced fade%, enhanced friction stability, and fewer friction fluctuations. However, alternatives A-1 and A-2 exhibited more wear compared to alternatives A-3 and A-4, along with the lowest preferences for recovery% and an increase in disk temperature, which contributed to the diminished ranking of these alternatives. Even these composites showed higher preferences for COF performance. Compositionally, alternatives A-1 and A-2 contained higher slag waste content compared to alternatives A-3 and A-4. Previous studies have shown that composites with higher industrial waste content, such as slag and fly ash, tend to display increased COF and disk temperatures with reduced recovery% [43,44]. For instance, Dadkar et al. [44] observed that their composite containing the highest fly ash content demonstrated the lowest recovery%, the highest rise in disk temperature, and the highest COF. The composite alternatives A-6 to A-8, containing ≤55 wt.% slag waste and ≥10 wt.% coir fiber, were the least favored options. In the comparison of composite alternatives A-6, A-7, and A-8, it was noted that an increase in coir fiber content from 10 wt.% (A-6) to 20 wt.% (A-8) generally led to improvements in disk temperature and recovery performances. In contrast, other tribological aspects of the composites, including wear, coefficient of friction, and fade performance, were diminished. The composite alternative A-8, consisting of 45 wt.% slag waste and 20 wt.% coir fiber, exhibited the poorest performance due to its lowest ratings in COF, wear, friction stability, fade%, and friction fluctuations. The literature reports similar findings regarding decreased wear, COF, fade%, and friction stability and increased friction fluctuations and recovery% with higher concentrations of natural fiber in friction composites [36,40]. Kılıç [19] employed the AHP-VIKOR methodology in the development of agro-waste-reinforced friction composites. The author determined that a composite containing 5 wt.% rice husk was optimal for achieving the specified tribological criteria. Wang et al. [45] used a hybrid AHP-MOORA methodology to enhance the tribological performance of friction materials based on sisal fiber. The findings indicated that a composite containing 6% sisal fiber demonstrated the best tribological performance. Karasulu et al. [46] employed a hybrid AHP-TOPSIS framework for designing brake friction materials utilizing natural fibers derived from the Malva sylvestris L. plant. The findings indicated that the composite containing 5 wt.% natural fiber content reached an ideal equilibrium among wear, coefficient of friction, hardness, density, porosity, and thermal conductivity.
3.3. Validation of Results
For result validation, a comparative analysis of the ranking outcomes produced by the proposed MEREC-RAM is presented in this section. The comparison included various MCDM methods: MOORA [23], VIKOR [47], MARCOS [48], MAIRCA [49], MACBETH [50], RAWEC [51], PIV [52], CoCoSo [53], and PSI [54]. Further, statistical validation through rank correlation analysis was also conducted to ensure reliability and robustness among the derived ranking orders.
3.3.1. Rank Validation Using Other MCDM Models
To ensure validation and benchmarking, the ranking results from the proposed MEREC-RAM approach were systematically compared with those of other popular MCDM techniques, including MACBETH, MOORA, VIKOR, PSI, MAIRCA, MARCOS, RAWEC, PIV, and CoCoSo. The comparative results of all the evaluated MCDM methods are displayed in Figure 4. Figure 4 illustrates that the MEREC-RAM is consistent with other assessed MCDM methods in identifying the optimal composite alternative for automotive braking applications. The evaluated MCDM methods identified alternative A-5 as the best option and validated the results of the MEREC-RAM. The assessment of the MCDM methods yielded remarkably consistent rankings, revealing only slight variations. Notably, all methods successfully identified the same top-performing and bottom-performing options. The consensus observed across different MCDM methods highlights the reliability and robustness of the proposed MEREC-RAM approach, strengthening the validity of its ranking results and increasing confidence in its practical applicability. Furthermore, MACBETH, MAIRCA, MOORA, and RAM yield identical ranking results. The MCDM methods showed strong consistency in ranking the top-ranked (A-5) and bottom-ranked (A-7 and A-8) alternatives. The comparative analysis also demonstrated varying levels of agreement between the second-ranked and fifth-ranked alternatives, displaying notable variations. For instance, alternative A-3 was ranked second by the RAM but was ranked in fourth place in PIV. The fourth-ranked alternative (A-2) in the RAM was ranked in sixth place in the PSI approach. Similarly, alternative A-1 demonstrated notable variation, being ranked in fifth place in the RAM but placed in second and sixth by PIV and CoCoSo, respectively. These variations in the ranking order suggest that the performance evaluation of the evaluated MCDM methods is very sensitive to their methodologies.
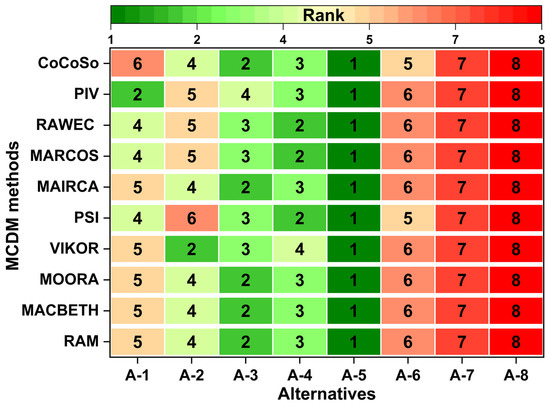
Figure 4.
Rank validation using various decision-making models.
3.3.2. Spearman Rank Correlation Analysis
The extent of the similarity between the ranks generated by various MCDM approaches was analyzed using Spearman’s rank correlation () coefficient. The
coefficient was determined using following equation [55].
In Equation (12),
represents the rank difference between the MEREC-RAM and other evaluated MCDM method for the i-th alternative.
The computed
coefficient between the evaluated MCDM methods is listed in Table 9. A perfect correlation of 1 was noted between MACBETH, MOORA, MAIRCA, and the RAM. Moreover, the comparisons of the different MCDM approaches yielded higher values of
coefficients, such as 0.929 for RAM vs. VIKOR, 0.905 for RAM vs. PSI, 0.833 for RAM vs. PIV, 0.976 for RAM vs. CoCoSo, and 0.952 for RAM vs. MARCOS and RAWEC. The mean
coefficient values for the evaluated MCDM methods were notably high, i.e., >0.8 [56]. This indicates a good correlation between the suggested MEREC-RAM approach and the other MCDM methodologies, proving the robustness of the suggested rankings.
Table 9.
The
coefficients between the evaluated MCDM methods.
3.3.3. Mean Absolute Error (MAE) and p-Value Analysis
The accuracy and consistency of the ranking results were further analyzed by determining the MAE and p-value. The MAE is determined using following equation [57].
Here,
represents the rank difference between the MEREC-RAM and other evaluated MCDM method for the i-th alternative;
is the number of alternatives.
The results of the MAEs across different MCDM methods are presented in Table 10. Lower MAE values indicate higher accuracy and enhanced reliability. The MAE values indicated that the error difference among the alternatives was below 1, demonstrating that the assessed MCDM models were in agreement with one another. The observed variation in ranking was greater for RAM vs. PIV with an MAE value of 0.75, which followed the results of the lowest
coefficient of 0.833, which was obtained for RAM vs. PIV, as presented in Table 9. Additionally, Minitab-15 was employed to calculate the p-value to assess satisfaction of the threshold of significance (i.e., p-value < 0.05) among the ranking outcomes of various MCDM models. Table 10 presents the p-values derived from the comparative analysis. The suggested MEREC-RAM and other assessed MCDM approaches had significant p-values of less than 0.05. The p-value was at its minimum (0.01) for RAM vs. PIV, aligning with the findings of the MAE analysis, which was highest (0.75) for RAM vs. PIV, and the
coefficient, which was lowest (0.833) for RAM vs. PIV.
Table 10.
MAE and p-value for MEREC-RAM with other MCDM methods.
3.4. Sensitivity Analysis
3.4.1. Sensitivity Analysis Using MEREC Method with Swapping Normalization Steps
Generally, for MEREC analysis, the decision matrix is normalized using Equation (2) for beneficial and cost-related criteria. For sensitivity analysis, the decision matrix was normalized by exchanging the equations used for beneficial and cost-related criteria [58]. The new normalized decision matrix (
) can be represented as follows:
where, for beneficial criteria,
, and for cost-related criteria,
.
The criterion weights were determined using the MEREC method, according to the new normalization approach outlined in Equation (14) and Equation (3) to Equation (6). The new criterion weights are shown in Table 11. Following that, a new ranking of the alternatives was calculated using the RAM approach, as shown in Equation (7) to Equation (11). Table 11 presents the overall score of the alternatives along with their corresponding ranks. A comparative analysis of the actual MEREC-RAM, as corroborated in Figure 3, and the modified MEREC-RAM, presented in Table 11, indicates that the ranking results remain consistent. Alternative A-4 was positioned third in the actual MEREC-RAM approach and advanced to second place in the modified MEREC-RAM approach. This does not change the optimal solution, since alternative A-5 was the highest-ranked, and alternative A-8 was rated lowest in both cases.
Table 11.
Criteria weights and alternative rankings after swapping the normalization steps of the MEREC method.
3.4.2. Criterion Weight Exchange Sensitivity Analysis
The stability and robustness of the proposed ranking order can be analyzed by performing sensitivity analysis. Due to the potential impact of criterion weight alterations on alternative rankings, a sensitivity study was performed by swapping the weights of the criteria under consideration. A total of 21 different weight scenarios were created, and the corresponding ranking, as determined using the RAM approach for each scenario, is presented in Figure 5. In all weight exchange scenarios, alternative A-5 held the top position, except in the C-5/C-6 weight exchange scenario, where alternative A-4 became the most preferred alternative by replacing A-5. This can be explained by the fact that the recovery performance of alternative A-5 (109.09%) was lower than that of alternative A-4 (120.63%). Consequently, when the weight of criterion C-5 (0.2890) was swapped with that of criterion C-6 (0.0466), A-5 lost its ranking to A-4 in the hierarchy of composite alternatives. In all weight exchange scenarios, alternatives A-8 and A-7 remained least preferred. Overall, there was some sensitivity seen; however, given that the primary goal was to identify the optimal option, these adjustments had a negligible effect on the ranking outcomes. The results were further validated by analyzing the
coefficient between the ranking order obtained with MEREC-RAM and that derived using various criterion weight exchange scenarios. The results of the
coefficient analysis indicate strong correlations, with the majority of values surpassing 0.9. However, exceptions were noted in the weight exchange scenarios for C-1/C-2 (0.619), C-2/C-3 (0.571), C-2/C-4 (0.833), C-2/C-6 (0.619), and C-2/C-7 (0.619). The analysis indicates that the ranking results were susceptible to change when criterion C-2 (i.e., wear) was substituted with other criteria except C-5. This highlights the importance of the C-2 (wear) criterion in this investigation.
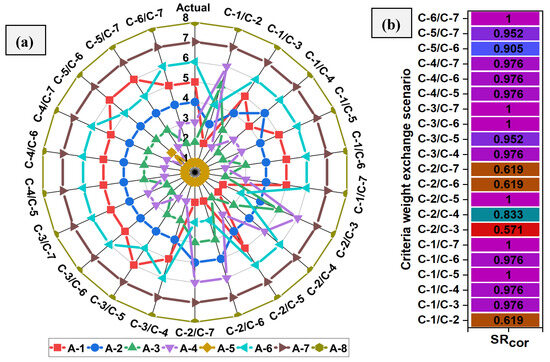
Figure 5.
Analysis of (a) Rank sensitivity, and (b) SRcor coefficient across various scenarios of criterion weight exchange.
Table 12 presents the analysis of descriptive statistics regarding the influence of the criterion weight exchange scenarios on the ranking results of the composite alternatives. The result shows that these scenarios do not cause any significant changes in the overall rankings. The composite alternative A-5 remains the top-ranked option, supported by its mean value of 1.05, a mode of 1.0, and a minimal standard deviation of 0.21. In contrast, composite alternatives A-7 and A-8 remained the least preferred options, with a standard deviation of 0.00, indicating no variability in their rankings. Some minor variability was observed for alternatives A-1, A-3, A-4, and A-6, with standard deviations ranging from 0.92 to 1.56, indicating slight sensitivity to the evaluated weight exchange scenarios. Overall, the results confirm that the weight exchange scenarios have a minimal impact on the ranking results, with all composite alternatives maintaining their relative positions, as indicated by their mean and mode values in Table 12.
Table 12.
Descriptive statistics of alternatives across various criterion weight exchange scenarios.
3.4.3. Sensitivity Analysis Using Alternative Removal Scenarios
Furthermore, a sensitivity analysis was conducted to assess how variations in the initial decision matrix impact the stability of the alternatives’ rankings. In the initial decision matrix for each scenario, modifications were made to the number of alternatives, and the resulting ranks were examined. Various scenarios were created by removing the least preferred alternative from further consideration, while the remaining alternatives were evaluated and ranked. After removing the inferior alternative, the weight of the criteria, again determined using the MEREC approach, and alternatives were ranked according to RAM approach. Figure 6a presents the weight of the actual scenario (S0) and the scenarios (S1 to S6) that were determined using the MEREC after removing the least preferred alternative in the decision matrix. The corresponding rankings of the alternatives in the investigated weight scenarios are illustrated in Figure 6b.
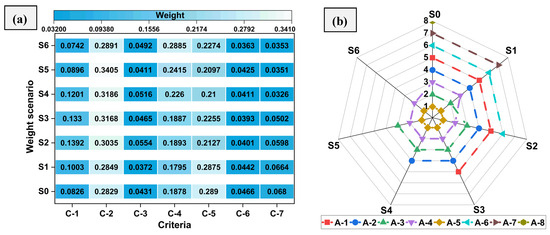
Figure 6.
(a) Criterion weight results, and (b) alternative ranking under dynamic (alternative removal) environment.
In the actual weight scenario (S0), the alternative A-8 was deemed the least favorable and hence excluded from further evaluation. Following the removal of alternative A-8, new weights were produced using the MEREC method, illustrated as scenario S1 in Figure 6a. A new ranking of the alternatives for scenario S1 was subsequently generated using the RAM, as illustrated in Figure 6b. The analysis for scenario S1, as illustrated in Figure 6b, shows that A-5 remained the top alternative, whereas A-7 was identified as the least favorable option. In the scenario (S2), the next least favorable alternative (A-7) was removed, and the other alternatives were subsequently ranked. In scenario S2, alternative A-4 emerged as the second-best option by replacing A-3. A total of six scenarios were developed, as illustrated in Figure 6. According to the data presented in Figure 6b, it is evident that there was no alteration in the top-ranked alternative.
3.4.4. Sensitivity Analysis Using Criterion Removal Scenarios
Given that the elimination of an alternative in the decision matrix led to alterations in the ranking order shown in Figure 6a, it is plausible that the removal of a criterion may similarly affect the final preferences. Consequently, it is essential to evaluate the effectiveness of the proposed model when the most significant criterion is removed from the set of criteria under consideration. In scenario S0, which reflects the actual weight, criterion C-5 is recognized as the most significant, followed by C-2 and C-4, whereas C-3 carries the least importance. Consequently, in scenario S1, criterion C-5 was eliminated, leading to the creation of a new decision matrix. Using this decision matrix, the weights of the criterion were calculated using the MEREC and ranked using the RAM. In scenario S2, the second-best criterion was removed and the MEREC-RAM approach applied to generate the weights and alternative ranking with the generated decision matrix. Figure 7a presents the weights of the actual scenario (S0) and the scenarios (S1 to S7) that were determined using the MEREC method after removal of the most dominating to least dominating criteria in the decision matrix. The corresponding rankings of the alternatives for criterion removal scenarios (S1 to S7) are presented in Figure 7b.
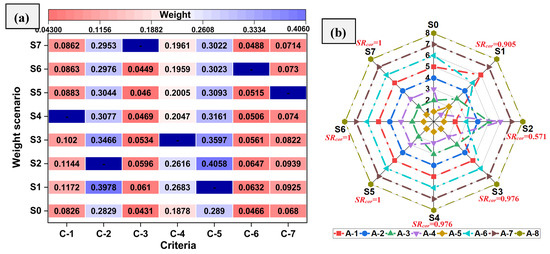
Figure 7.
(a) Criterion weight results and (b) alternative ranking under dynamic (criterion removal) environment.
The ranks of the alternatives presented in Figure 7b prove that alternative A-5 was dominant as it was ranked first in scenarios S2 to S7, with the exception being scenario S1. The elimination of criterion C-5 (fade%) in scenario S1 led to an increased weight for criterion C-2, which pertains to wear. The wear performance of alternative A-4 was notably superior when compared to alternative A-5, as supported by the data presented in Table 4. Furthermore, as illustrated in Figure 7b, it is evident that the ranking of the alternatives exhibited a greater sensitivity to alterations in scenario S2 when criterion C-2 (i.e., wear) was eliminated. Alternatives A-1, A-3, A-4, and A-6 exhibited the highest sensitivity to variations in weight in scenario S2. With the elimination of the C-2 criterion, alternatives A-1 and A-6 climbed three positions in the rankings, securing the second and third places, respectively. The ranking of alternatives A-3 and A-4 was observed to decrease by three positions. The impact of criterion removal on the ranking of alternatives was further analyzed using the
coefficient and results are presented in Figure 7b. The
coefficient was noted to remain >0.9 for all scenarios except scenario S2. The removal of the C-2 criterion resulted in the lowest
coefficient value of 0.571, showing the susceptibility of the rankings to the removal of the C-2 criterion.
3.4.5. Single-Dimensional Sensitivity Analysis
Single-dimension weight sensitivity analysis was also performed to assess the impact of the most important criterion on the final rankings obtained from the proposed MEREC-RAM MCDM. As the C-5 (i.e., fade%) criterion was the highest weighted and the alternative ranking was most susceptible to the change in criterion C-2 (i.e., wear), they were considered the most important criteria. In order to maintain the overall weight sum to be equal to one, the weights of the other criteria were altered proportionately, while the weights of important criteria were changed within a feasible range. This followed the idea of additive weights and made sure that all criterion weights stayed positive. The maximum permissible weight for a specified criterion can be calculated using the following equation [59].
where
and
represent the weights of the least and most important criteria,
is the number of criteria in the decision matrix, and
represents the highest value that the most important criterion can take. The weight of the lowest criterion would become negative if the weight of the most significant criterion was changed beyond
.
The value of
considering C-2 (i.e., wear) as the most important criterion was found to be 0.5415. If its weight was increased beyond 0.5415, the least weighted criterion C1 (0.0431) would turn negative. The weight of the C-2 criterion was varied from 0 to 0.5415 while other criterion weights were adjusted accordingly to ensure the summation of all weights was 1. The newly generated weights for the single-dimensional sensitivity analysis using C-2 as the most important criterion are presented in Figure 8a. The corresponding ranking of the alternatives using the RAM approach is presented in Figure 8b. The alternative A-5 remained the most preferred in scenarios S3 to S7. However, A-4 became the most preferred alternative in scenarios S1 and S2 by replacing A-5, when the weight of C-2 was increased to ≥0.5. This can be ascribed to the superior wear performance of A-4 relative to A-5, as evidenced in Table 4. Alternatives A-6/A-7/A-8 were noted to remain the least preferred alternatives in all scenarios except S6 and S7, where A-6 moved up by three places. The alternative ranking were noted to be most susceptible to change when the weight of the C-2 criterion was decreased from 0.5 to 0. Alternative A-1 was in fifth place in scenario S1 and was ranked second in scenarios S6 and S7. Similarly, A-4 was the first ranked alternative in scenario S1 and was moved to sixth place in scenarios S6 and S7. This was further validated with the
coefficient, which was noted to be greater than 0.9 for scenarios S1-S5. The
coefficient was less than 0.6 for the S6 and S7 scenarios, indicating a moderate correlation.
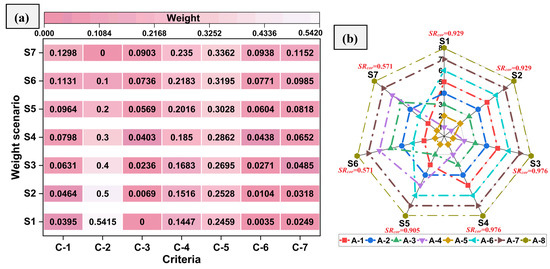
Figure 8.
(a) C-2 (wear) weight variation. (b) Ranking analysis.
Similarly, the value of
using C-5 as the most important criterion with a weight of 0.289 was found to be 0.5476. New criterion weights were generated by varying C-5’s weight in the range of 0 to 0.5476 and are presented in Figure 9a. The corresponding ranking of the alternatives is presented in Figure 9b. In all scenarios (S1 to S7), alternative A-5 remains at the top position. The rankings of the alternatives illustrated in Figure 9b demonstrate that alternative A-5 consistently holds the top position across all scenarios (S1 to S7), while alternatives A-7 and A-8 remain the worst alternatives as they stayed in the bottom two positions in all scenarios (S1 to S7). Some sensitivity was also noted as the alternatives were noted to change positions in the ranking order. For instance, alternative A-1 was ranked second best in scenario S1 and was positioned in sixth place in scenario S7. Similarly, alternative A-4 was ranked fifth in S1 but was ranked second in S7. Nonetheless, these alterations did not substantially influence the ultimate outcomes of the MEREC-RAM model, as evidenced by the
coefficient value, which exceeded 0.8 across all scenarios, signifying a strong correlation. On the basis of the outcomes, it can be concluded that the obtained ranking results are reliable and valid.
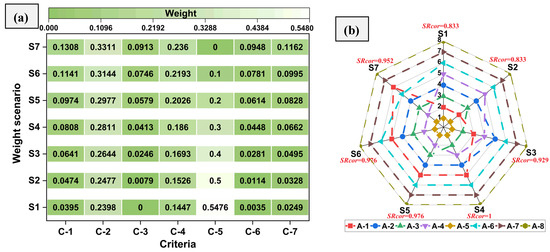
Figure 9.
(a) C-5 (fade%) weight variation. (b) Ranking analysis.
4. Conclusions
This study was carried out to address the lack of MEREC and RAM techniques in optimizing tribological performance as well as the limited use of comprehensive sensitivity analysis in the development of automotive brake friction materials. Therefore, a detailed case study was meticulously designed to evaluate slag waste-filled polymer composites using a hybrid MEREC-RAM-based MCDM framework. The following conclusions can be drawn from the study:
- The MEREC approach quantified the weight of each criterion, with fade% (0.2890) and wear (0.2829) identified as the most significant, followed by friction fluctuations (0.1878). Conversely, recovery% (0.0466) and friction stability (0.0431) were determined to be the least significant criteria.
- By applying the RAM approach, the ranking of different slag waste-filled friction composites were obtained and the alternative with 60 wt.% slag waste and 5 wt.% coir fiber exhibited the optimal tribological properties and emerged as the best option.
- The comparative analysis with nine established MCDM (MACBETH, MOORA, VIKOR, PSI, MAIRCA, MARCOS, RAWEC, PIV, and CoCoSo) models confirmed the optimal choice, supported by a higher (>0.8) Spearman’s rank correlation coefficient, low mean absolute error (<0.75), and significant p-values (<0.05).
- Multiple sensitivity analysis approaches including criterion weight exchange, changing normalization procedure of MEREC, alternative/criterion removal, and single-dimension weight variation demonstrated that the rankings remain stable across varying weight scenarios and decision-making structures.
Overall, the hybrid MEREC-RAM-based MCDM framework provides a rigorous, reliable, and validated decision-making tool for optimizing slag waste-filled automotive brake friction materials. Its strong performance across multiple sensitivity analyses demonstrates its suitability for complex engineering decision problems where criterion weighting uncertainty is significant. Given its flexibility and robustness, the hybrid MEREC-RAM framework can be readily extended to other material-selection tasks and broader multi-criteria engineering applications.
Author Contributions
Conceptualization, T.S., R.K., and L.R.; methodology, T.S., R.K., L.R., Y.S., and G.F.; validation, T.S., A.N., and R.K.; formal analysis, T.S., R.K., Y.S., and G.F.; investigation, T.S., Y.S., A.N., and G.F.; resources, T.S.; data curation, T.S., L.R., and A.N.; writing—original draft, T.S., L.R., and R.K.; writing—review and editing, T.S., L.R., Y.S., A.N., G.F., and R.K.; visualization, T.S. and L.R.; funding acquisition, T.S. All authors have read and agreed to the published version of the manuscript.
Funding
This research received no external funding.
Data Availability Statement
The data are available from the corresponding author upon reasonable request.
Conflicts of Interest
The authors declare no conflicts of interest.
Abbreviations
The following abbreviations are used in this manuscript:
| AHP | Analytic Hierarchy Process |
| CoCoSo | Combined Compromise Solution |
| COF | Coefficient of Friction |
| EDAS | Evaluation Based on Distance from Average Solution |
| GRA | Grey Relation Analysis |
| MACBETH | Measuring Attractiveness by a Categorical Based Evaluation Technique |
| MAE | Mean Absolute Error |
| MAIRCA | Multi-Attributive Ideal-Real Comparative Analysis |
| MARCOS | Measurement of Alternatives and Ranking according to COmpromise Solution |
| MCDM | Multi-Criteria Decision-Making |
| MEREC | Method Based On The Removal Effects Of Criteria |
| MOORA | Multi-Objective Optimization by Ratio Analysis |
| PIV | Proximity Index Value |
| PSI | Preference Selection Index |
| RAM | Root Assessment Method |
| RAWEC | Ranking Alternatives with Weights of Criterion |
| Spearman’s Rank Correlation | |
| TOPSIS | Technique for Order of Preference by Similarity to Ideal Solution |
| VIKOR | VIekriterijumsko KOmpromisno Rangiranje |
References
- Raghunathan, V.; Sathyamoorthy, G.; Ayyappan, V.; Srisuk, R.; Singaravelu, D.L.; Rangappa, S.M.; Siengchin, S. Advances in brake friction materials: A comprehensive review of ingredients, processing methods, and performance characteristics. J. Vinyl Addit. Technol. 2024, 30, 1396–1431. [Google Scholar] [CrossRef]
- Daimon, E.; Ito, Y. Effects of Titanate on Brake Wear Particle Emission Using a Brake Material Friction Test Dynamometer. Lubricants 2024, 12, 387. [Google Scholar] [CrossRef]
- Borawski, A.; Szpica, D.; Mieczkowski, G. Polytetrafluoroethylene and Aluminum Powder as an Alternative to Copper in Car Brakes Composite Friction Materials. Materials 2025, 18, 589. [Google Scholar] [CrossRef]
- Document 52022PC0586: Proposal for a Regulation of the European Parliament and of the Council on Type-Approval of Motor Vehicles and Engines and of Systems, Components and Separate Technical Units Intended for Such Vehicles, with Respect to their Emissions and Battery Durability (Euro 7) and Repealing Regulations (EC) No 715/2007 and (EC) No 595/2009. 2022. Available online: https://eur-lex.europa.eu/legal-content/EN/TXT/?uri=CELEX:52022PC0586 (accessed on 25 August 2025).
- Gautier di Confiengo, G.G.; Faga, M.G. Ecological Transition in the Field of Brake Pad Manufacturing: An Overview of the Potential Green Constituents. Sustainability 2022, 14, 2508. [Google Scholar] [CrossRef]
- Borawski, A.; Szpica, D.; Mieczkowski, G. The Possibility of Using Components of Plant Origin as Reinforcements in Composite Friction Materials-A Simulation-Based Braking Process Study. Materials 2024, 17, 5834. [Google Scholar] [CrossRef] [PubMed]
- Carlevaris, D.; Nogueira, A.P.G.; Rita, D.A.; Candeo, S.; Fambri, L.; Menapace, C.; Straffelini, G. Novel ingredients for sustainable brake pad friction materials: Benzoxazine resins and rice husk. Wear 2025, 564–565, 205698. [Google Scholar] [CrossRef]
- Mehta, V.; Kumar, N.; Algahtani, A.; Tirth, V.; Al-Mughanam, T.; Chau, K.-W. Comparative Study of Chemically Treated Sugarcane and Kevlar Fiber to Develop Brake Resistance Composites. Molecules 2023, 28, 4861. [Google Scholar] [CrossRef]
- Wang, C.; Li, R.; Lin, H.; Yuan, S.; Wang, L.; Ma, Y. Preparation and Properties of Brake Friction Materials Reinforced with Coconut Fiber and Dypsis Lutescens Fiber. Materials 2024, 17, 3926. [Google Scholar] [CrossRef]
- Jayashree, P.; Candeo, S.; Leonardi, M.; Fidelio, C.; Straffelini, G. Effect of the Addition of Waste Generated during the Plasma Cutting of Aluminum Products on the Friction and Emission Properties of a Commercial Friction Material Formulation. Atmosphere 2022, 13, 2056. [Google Scholar] [CrossRef]
- Khoshsepehr, Z.; Alinejad, S.; Alimohammadlou, M. Exploring industrial waste management challenges and smart solutions: An integrated hesitant fuzzy multi-criteria decision-making approach. J. Clean. Prod. 2023, 420, 138327. [Google Scholar] [CrossRef]
- Gotowska, M.; Jakubczak, A. Sustainable Biodegradable Waste Management for Circular Economy: Comparative Assessment of Composting Technologies. Sustainability 2025, 17, 8978. [Google Scholar] [CrossRef]
- Cappelli, M.A.; Cappelli, E.; Cappelli, F. AI-Driven Circular Waste Management Tool for Enhancing Circular Economy Practices in Healthcare Facilities. Environments 2025, 12, 295. [Google Scholar] [CrossRef]
- Straffelini, G.; Jayashree, P.; Barbieri, A.; Masciocchi, R. Tribological Behavior of Friction Materials Containing Aluminum Anodizing Waste Obtained by Different Industrial Drying Processes. Lubricants 2024, 12, 173. [Google Scholar] [CrossRef]
- Kanagaraj, M.; Babu, S.; Raj, S.; Jonah, N.; Fekete, G.; Christy, T.V. Influence of ground granulated blast furnace slag on the tribological characteristics of automotive brake friction materials. Ind. Lubr. Tribol. 2022, 74, 837–843. [Google Scholar] [CrossRef]
- Zheng, K.; Lin, Y.; Lai, T.; Gao, C.; Liu, M.; Ren, Z. Replacing copper in composites with waste foundry sand: A novel approach for Cu-free resin-based braking material. Tribol. Int. 2024, 191, 109110. [Google Scholar] [CrossRef]
- Jayashree, P.; Matějka, V.; Leonardi, M.; Straffelini, G. The influence of the addition of different kinds of slags on the friction and emission behavior of a commercially employed friction material formulation. Wear 2023, 522, 204705. [Google Scholar] [CrossRef]
- Sugözü, B. Tribological properties of brake friction materials containing fly ash Available to Purchase. Ind. Lubr. Tribol. 2018, 70, 902–906. [Google Scholar] [CrossRef]
- Kılıç, H. Tribo-evaluation with multi-criteria decision-making approach of fly ash-filled hybrid flax/basalt fiber reinforced brake friction composites. Polym. Compos. 2025, 46, 14506–14522. [Google Scholar] [CrossRef]
- Gehlen, G.S.; Neis, P.D.; Barros, L.Y.; Poletto, J.C.; Ferreira, N.F.; Amico, S.C. Tribological performance of eco-friendly friction materials with rice husk. Wear 2022, 500–501, 204374. [Google Scholar] [CrossRef]
- Unal, A.; Demirdalmis, O. The effects of using apricot kernel shell, an environmentally friendly material, in composite brake pads on friction performance. Tribol. Int. 2024, 197, 109734. [Google Scholar] [CrossRef]
- Avramova, T.; Peneva, T.; Ivanov, A. Overview of Existing Multi-Criteria Decision-Making (MCDM) Methods Used in Industrial Environments. Technologies 2025, 13, 444. [Google Scholar] [CrossRef]
- Shinde, D.; Öktem, H.; Kalita, K.; Chakraborty, S.; Gao, X.Z. Optimization of process parameters for friction materials using multi-criteria decision making: A comparative analysis. Processes 2021, 9, 1570. [Google Scholar] [CrossRef]
- Singh, T.; Gehlen, G.S.; Singh, V.; Ferreira, N.F.; de Barros, L.Y.; Lasch, G.; Poletto, J.C.; Ali, S.; Neis, P.D. Selection of automotive brake friction composites reinforced by agro-waste and natural fiber: An integrated multi-criteria decision-making approach. Results Eng. 2024, 22, 102030. [Google Scholar] [CrossRef]
- Sotoudeh-Anvari, A. Root Assessment Method (RAM): A novel multi-criteria decision making method and its applications in sustainability challenges. J. Clean. Prod. 2023, 423, 138695. [Google Scholar] [CrossRef]
- Hezam, I.M.; Ali, A.M.; Sallam, K.; Hameed, I.A.; Foul, A.; Abdel-Basset, M. An extension of root assessment method (RAM) under spherical fuzzy framework for optimal selection of electricity production technologies toward sustainability: A case study. Int. J. Energy Res. 2024, 2024, 24. [Google Scholar] [CrossRef]
- Wiȩckowski, J.; Hernes, M.; Sałabun, W. Comparison of multi-criteria decision analysis methods under comprehensive sensitivity analysis. IEEE Access 2025, 13, 128122–128138. [Google Scholar] [CrossRef]
- Keshavarz-Ghorabaee, M.; Amiri, M.; Zavadskas, E.K.; Turskis, Z.; Antucheviciene, J. Determination of Objective Weights Using a New Method Based on the Removal Effects of Criteria (MEREC). Symmetry 2021, 13, 525. [Google Scholar] [CrossRef]
- Pelit, İ.; Avşar, İ.İ. Turkiye’s Carbon Emission Profile: A Global Analysis with the MEREC-PROMETHEE Hybrid Method. Sustainability 2025, 17, 6527. [Google Scholar] [CrossRef]
- Liu, P.; Zhang, T.; Tian, F.; Teng, Y.; Yang, M. Optimized Grid Partitioning and Scheduling in Multi-Energy Systems Using a Hybrid Decision-Making Approach. Energies 2024, 17, 3253. [Google Scholar]
- Maliene, V.; Dixon-Gough, R.; Malys, N. Dispersion of relative importance values contributes to the ranking uncertainty: Sensitivity analysis of multiple criteria decision-making methods. Appl. Soft Comput. 2018, 67, 286–298. [Google Scholar] [CrossRef]
- Więckowski, J.; Sałabun, W. Sensitivity analysis approaches in multi-criteria decision analysis: A systematic review. Appl. Soft Comput. 2023, 148, 110915. [Google Scholar] [CrossRef]
- Rajan, R.; Tyagi, Y.K.; Singh, S. Waste and natural fiber based automotive brake composite materials: Influence of slag and coir on tribological performance. Polym. Compos. 2022, 43, 1508–1517. [Google Scholar] [CrossRef]
- Rajan, R.; Tyagi, Y.K.; Pruncu, C.I.; Kulshreshtha, S.; Ranakoti, L.; Singh, T. Tribological performance evaluation of slag waste filled phenolic composites for automotive braking applications. Polym. Compos. 2022, 43, 7118–7129. [Google Scholar] [CrossRef]
- Ma, Y.; Wu, S.; Zhuang, J.; Tong, J.; Qi, H. Tribological and physio-mechanical characterization of cow dung fibers reinforced friction composites: An effective utilization of cow dung waste. Tribol. Int. 2019, 131, 200–211. [Google Scholar] [CrossRef]
- Zhen-Yu, W.; Jie, W.; Feng-Hong, C.; Yun-Hai, M.; Singh, T.; Fekete, G. Influence of banana fiber on physicomechanical and tribological properties of phenolic based friction composites. Mater. Res. Express 2019, 6, 075103. [Google Scholar] [CrossRef]
- Ma, Y.; Wu, S.; Zhuang, J.; Tong, J.; Xiao, Y.; Qi, H. The evaluation of physio-mechanical and tribological characterization of friction composites reinforced by waste corn stalk. Materials 2018, 11, 901. [Google Scholar] [CrossRef]
- Kus, H.; Altiparmak, D. Effects of fly ash content on the friction-wear performance of bronze-based brake lining materials produced by the hot-pressing method. Ind. Lubr. Tribol. 2015, 67, 612–621. [Google Scholar] [CrossRef]
- Dadkar, N.; Tomar, B.S.; Satapathy, B.K.; Patnaik, A. Performance assessment of hybrid composite friction materials based on flyash–rock fibre combination. Mater. Des. 2010, 31, 723–731. [Google Scholar] [CrossRef]
- Kumar, N.; Singh, T.; Grewal, J.S.; Patnaik, A.; Fekete, G. Experimental investigation on the physical, mechanical and tribological properties of hemp fiber-based non-asbestos organic brake friction composites. Mater. Res. Express 2019, 6, 085710. [Google Scholar] [CrossRef]
- Wang, N.; Hou, G.; Yang, Z.; Jiang, Q.; Zhang, F.; Xie, M.; Yao, Z. Influence of slag weight fraction on mechanical, thermal and tribological properties of polymer based friction materials. Mater. Des. 2016, 90, 76–83. [Google Scholar] [CrossRef]
- Sagiroglu, S.; Akdogan, K. The effect of the addition of blast furnace slag on the wear behavior of heavy transport polymer-based brake pads. Tribol. Int. 2023, 189, 108845. [Google Scholar] [CrossRef]
- Jayashree, P.; Matějka, V.; Leonardi, M.; Straffelini, G. A novel path towards limiting non-exhaust particulate matter emissions of a commercial friction material through the addition of metallurgical slag. Sci. Rep. 2023, 13, 666. [Google Scholar] [CrossRef]
- Dadkar, N.; Tomar, B.S.; Satapathy, B.K. Evaluation of flyash-filled and aramid fibre reinforced hybrid polymer matrix composites (PMC) for friction braking applications. Mater. Des. 2009, 30, 4369–4376. [Google Scholar] [CrossRef]
- Wang, N.; Yin, Z.; Liu, H.; Guo, H. Effects of sisal fiber and fly ash on the mechanical and tribological performances of brake friction composites. Polym. Compos. 2024, 45, 12057–12070. [Google Scholar] [CrossRef]
- Karasulu, D.C.; Öncül, M.; Özcan, O.; Sütçü, M. Performance Evaluation of Lignocellulosic Fiber-Reinforced Brake Pads Using Hybrid Optimization Techniques. Polym. Compos. 2025. [Google Scholar] [CrossRef]
- Afolabi, K.; Babatunde, O.; Ighravwe, D.; Akintayo, B.; Olanrewaju, O.A. A Fuzzy Multi-Criteria Decision-Making Framework for Evaluating Non-Destructive Testing Techniques in Oil and Gas Facility Maintenance Operations. Eng 2025, 6, 214. [Google Scholar] [CrossRef]
- Dinh, V.-T.; Tran, H.-D.; Tran, Q.-H.; Vu, D.-B.; Vu, D.; Vu, N.-P.; Nguyen, T.-T. Multi-Objective Optimization of a Two-Stage Helical Gearbox Using MARCOS Method. Designs 2024, 8, 53. [Google Scholar] [CrossRef]
- Wang, C.-N.; Tran Thi, D.-O.; Nhieu, N.-L.; Hsueh, M.-H. An Integrated Entropy–MAIRCA Approach for Multi-Dimensional Strategic Classification of Agricultural Development in East Africa. Mathematics 2025, 13, 2465. [Google Scholar] [CrossRef]
- Singh, T. Entropy weighted WASPAS and MACBETH approaches for optimizing the performance of solar water heating system. Case Stud. Therm. Eng. 2024, 53, 103922. [Google Scholar] [CrossRef]
- Puška, A.; Štilić, A.; Pamučar, D.; Božanić, D.; Nedeljković, M. Introducing a novel multi-criteria ranking of alternatives with weights of criterion (RAWEC) model. MethodsX 2024, 12, 102628. [Google Scholar] [CrossRef]
- Salmi, A.; Vecchi, G.; Atzeni, E.; Iuliano, L. Hybrid Multi-Criteria Decision Making for Additive or Conventional Process Selection in the Preliminary Design Phase. Designs 2024, 8, 110. [Google Scholar] [CrossRef]
- Anes, V.; Abreu, A. A Hybrid FMEA-ROC-CoCoSo Approach for Improved Risk Assessment and Reduced Complexity in Failure Mode Prioritization. Algorithms 2024, 17, 585. [Google Scholar] [CrossRef]
- Ulutaş, A.; Balo, F.; Topal, A. Identifying the Most Efficient Natural Fibre for Common Commercial Building Insulation Materials with an Integrated PSI, MEREC, LOPCOW and MCRAT Model. Polymers 2023, 15, 1500. [Google Scholar] [CrossRef] [PubMed]
- Kaur, S.; Kumar, R.; Singh, K. Sustainable Component-Level Prioritization of PV Panels, Batteries, and Converters for Solar Technologies in Hybrid Renewable Energy Systems Using Objective-Weighted MCDM Models. Energies 2025, 18, 5410. [Google Scholar] [CrossRef]
- Keshavarz-Ghorabaee, M.M.; Amiri, M.; Hashemi-Tabatabaei, E.K.; Zavadskas, A.; Kaklauskas, A. A new decision-making approach based on fermatean fuzzy sets and WASPAS for green construction supplier evaluation. Mathematics 2020, 8, 2202. [Google Scholar] [CrossRef]
- Hodson, T.O. Root-mean-square error (RMSE) or mean absolute error (MAE): When to use them or not. Geosci. Model Dev. 2022, 15, 5481–5487. [Google Scholar] [CrossRef]
- Puška, A.; Božanić, D.; Mastilo, Z.; Pamučar, D. Extension of MEREC-CRADIS methods with double normalization-case study selection of electric cars. Soft Comput. 2023, 27, 7097–7113. [Google Scholar] [CrossRef]
- Kumari, A.; Acherjee, B. Material selection for milling cutter inserts in High-Speed machining applications using the CARCACS Method. Results Eng. 2025, 26, 105063. [Google Scholar] [CrossRef]
Disclaimer/Publisher’s Note: The statements, opinions and data contained in all publications are solely those of the individual author(s) and contributor(s) and not of MDPI and/or the editor(s). MDPI and/or the editor(s) disclaim responsibility for any injury to people or property resulting from any ideas, methods, instructions or products referred to in the content. |
© 2025 by the authors. Licensee MDPI, Basel, Switzerland. This article is an open access article distributed under the terms and conditions of the Creative Commons Attribution (CC BY) license (https://creativecommons.org/licenses/by/4.0/).