Abstract
This paper proposes a comprehensive framework, Theory–Simulation–Experimental Verification, for the elasto-aerodynamic analysis of elastic foil gas bearings (EFGBs). In contrast to many studies that approximate the foil structure using simplified two-dimensional models, the present work adopts a macro-element beam theory model that incorporates the actual 3D geometry, nonlinear elasticity, and frictional contact effects, and couples it directly with the Reynolds equation. To improve accuracy and robustness, the macro-beam results are validated against a fully coupled fluid–structure interaction (FSI) model developed in COMSOL Multiphysics. Emphasis is placed on quantifying the influence of foil thickness, clearance, and eccentricity, where the pressure distribution, foil deflection, and load capacity are obtained through the coupled solver. The results reveal that increasing foil thickness from 0.1 mm to 0.2 mm elevates the peak gas film pressure from 1.36 × 10⁵ Pa to 1.97 × 10⁵ Pa while simultaneously reducing displacement and pressure fluctuations, thereby enhancing bearing stability. Smaller clearances are shown to increase load capacity but also induce stronger oscillatory flow behavior, indicating a stiffness–stability trade-off. Additionally, prototype experiments with a 0.05 mm clearance confirm practical lift-off at 4300–7000 rpm under 10–30 N external loads, with measured torques of 0.18–0.30 N·m. By combining computational efficiency, 3D fidelity, and experimental validation, the proposed framework provides quantitative guidance for the design and optimization of EFGBs used in high-speed turbomachinery, such as aviation and compact energy systems, including turbine-based air-cycle refrigeration units and small gas-turbine rotors for unmanned aerial vehicles.
1. Introduction
With the continuous pursuit of higher precision and complexity in mechanical systems, bearing technology has become an indispensable component in advanced engineering applications [1,2]. However, rolling and conventional journal bearings exhibit significant limitations under conditions of high speed, heavy load, and stringent precision requirements. Frictional losses, wear debris generation, and lubricant-induced contamination often degrade system stability and shorten service life [3,4]. In contrast, gas bearings employ a self-generated or externally supplied pressurized gas film to support loads without solid contact, thereby eliminating mechanical friction and wear [5,6]. Their non-contact operation, contamination-free characteristics, and extremely low friction enable high-efficiency performance in extreme operating environments [5,7]. Owing to these advantages, gas bearings have been widely applied in aerospace, wind power generation, precision instruments, and micro-electromechanical systems (MEMSs), particularly in devices demanding ultra-high rotational speeds, large load capacities, and near-zero friction [6,8]. This study focuses on EFGBs as core support components in the high-speed turbomachinery typical of aviation and compact energy systems, with particular relevance to turbine-based air-cycle refrigeration units in aircraft environmental control systems and small gas turbine rotors used in unmanned aerial vehicles and related power units. In recent years, these aviation-related turbomachinery applications—especially turbine-based air-cycle refrigeration units and small gas turbine systems for unmanned aerial vehicles—have emerged as a particularly active field of research and industrial development, in which the demand for compact, reliable, oil-free support components makes EFGBs especially attractive. Nevertheless, further improvement in load capacity, dynamic stability, and operational adaptability remains a critical research area in EFGBs, the performance of which is governed by complex coupled interactions between the elastic deformation of the foil structure and the aerodynamic behavior of the gas film [9,10].
In EFGBs, deformation of the compliant foil naturally forms a self-regulating gas film between the foil and the shaft, providing load support while maintaining a contact-free lubricating interface [11,12]. Compared with rigid gas bearings, EFGBs feature a simpler structure, lower manufacturing cost, and superior adaptability. The elasticity of the foil allows real-time geometric compensation under varying loads. Consequently, EFGBs are particularly suitable for high-speed and transient operating conditions. Their self-adjusting and self-lubricating capabilities ensure excellent reliability and operational stability even under harsh environments [13,14].
In terms of theoretical development, Heshmat et al. [15] first explored the structural design, material selection, and clearance optimization of foil bearings. Le et al. [16] proposed a multi-degree-of-freedom model that idealized the corrugated foil as a linear elastic spring system incorporating interfacial friction and inter-wave interactions. Gad et al. [17] extended this model by introducing lateral foil displacement and housing detachment, thereby improving performance prediction. Hassan et al. [18] developed a high-fidelity full-foil model that captured wave interaction and inertial effects, verified by experimental evidence. Arghir et al. [19] formulated a stiffness model based on contact mechanics, distinguishing normal and tangential contact responses. Heinemann et al. [20] systematically compared several modeling strategies for top foils and concluded that curved shell formulations offer superior fidelity over flat-shell models.
Complementary experimental studies have provided crucial validation for these theoretical advances. Andres et al. [21] characterized the nonlinear stiffness and damping properties of EFGB, revealing that stiffness increases with bearing size and exhibits symmetric nonlinearity. Kim et al. [22] experimentally investigated EFGB-supported turbocharger rotors and analyzed vibration responses under conditions such as compressor surge. Feng et al. [23] designed multiple test platforms to evaluate EFGBs fabricated from Inconel X-750, GH4145, and 304 stainless steel, highlighting the critical influence of initial clearance on system performance. Bonello et al. [24] constructed a rotor-dynamic test rig to measure shaft trajectories, showing good agreement with theoretical predictions despite minor discrepancies.
Despite significant advances, EFGB technology continues to face challenges. The intrinsic fluid–structure interaction (FSI) involves strongly nonlinear coupling between film pressure and elastic deformation, complicating accurate predictive modeling. Additionally, the multi-parameter dependence of foil elasticity and contact behavior presents difficulties for structural optimization, as these factors are crucial for load capacity and stiffness [25,26,27]. However, most existing EFGB models either approximate the bump and top foils using simplified two-dimensional spring networks or flat-shell formulations that neglect the realistic three-dimensional corrugated geometry, nonlinear elasticity, and frictional contact effects, or they employ high-fidelity three-dimensional FSI simulations that are too computationally expensive for systematic parametric design. The fluid–structure coupling is often treated in a weakly coupled or loosely integrated manner, and only a few studies directly validate simplified elastic–aerodynamic models against fully coupled 3D simulations and targeted experiments. Consequently, the combined influence of foil thickness, clearance, and eccentricity on film pressure distribution, foil deflection, load capacity, and stability has not yet been quantified within a single, computationally efficient yet high-fidelity framework. Designers, therefore, lack quantitative guidelines for choosing these key parameters in practical EFGB applications.
To address the challenges, this study develops a high-fidelity modeling and simulation framework, combining theoretical, numerical, and experimental approaches. A coupled elastic–aerodynamic (CEA) framework is used to simultaneously solve the Reynolds equation and foil deformation equations, predicting static characteristics such as load capacity, stiffness, and film thickness. A 3D multiphysics CEA model in COMSOL Multiphysics 6.2 simulates internal flow fields and foil deformation, incorporating realistic bearing geometry, nonlinear elasticity, and frictional contact effects. This model provides a deeper understanding of gas foil interactions and their impact on bearing performance under varying design parameters, including foil thickness, eccentricity, and clearance. Simulations reveal how these parameters affect bearing capacity, stability, and performance, emphasizing their role in film pressure distribution, film thickness fluctuations, and friction-induced instability. To verify the system-level performance of the CEA-based design, a prototype EFGB and two test rigs static stiffness test apparatus, and a high-speed rotor-dynamics test rig were designed and fabricated. Static stiffness tests benchmark the predicted bearing capacity and stiffness, confirming radial clearance adequacy. Rotor-dynamics tests assess lift-off behavior, vibration response, and stability under high-speed conditions, ensuring the safe implementation of optimized parameter combinations. This combined experimental validation verifies the accuracy and robustness of the modeling framework, providing insights for optimizing EFGB design and balancing stability and capacity across different operating conditions.
This study is guided by the following questions: (1) How can a CEA framework be developed to capture the nonlinear interaction between pressure and foil deformation while maintaining computational efficiency for design-oriented parametric studies of EFGBs? (2) How do geometric and operating parameters—foil thickness, clearance, and eccentricity–jointly affect gas film pressure distribution, foil displacement, film thickness fluctuation, and load capacity, and what trade-offs do they present between stiffness and stability? (3) To what extent can predictions from the CEA framework and the 3D multiphysics model be validated against experimental measurements of a prototype EFGB with the same geometric parameters and target load? Based on the analyses, this study advances the following hypotheses: (H1) A macro-element beam-Reynolds CEA model, validated against a 3D FSI model incorporating realistic foil geometry, nonlinear elasticity, and frictional contact, can predict the static performance of EFGBs (pressure distribution, film thickness, and load capacity) with sufficient accuracy for engineering design. (H2) Increasing foil thickness within a practical range enhances system stiffness, increases peak gas film pressure, and reduces excessive film thickness and pressure fluctuations, improving load capacity and static stability compared to thinner foils. (H3) Reducing radial clearance and increasing eccentricity strengthen the hydrodynamic effect and improve load capacity, but also amplify CEA-induced oscillations and frictional effects; thus, an optimal combination of foil thickness, clearance, and eccentricity is required to balance capacity and stability for a given design load. These hypotheses are examined through a unified Theory–Simulation–Experimental Verification approach.
Although the present CEA framework adopts an isothermal compressible-gas formulation, thermo-elasto-hydrodynamic (TEHD) effects can further influence EFGB performance by coupling heat generation in the gas film, temperature-dependent gas viscosity and density, and thermal expansion or stiffness variation in the compliant foils. In this work, we intentionally focus on isothermal elasto-aerodynamic and frictional contact mechanisms as a first step, to clearly isolate the roles of foil thickness, clearance, and eccentricity within a unified Theory–Simulation–Experimental Verification framework. The present methodology, however, is designed to be extendable to fully coupled TEHD analyses, in which the energy equation and temperature-dependent material properties will be incorporated to quantify thermal effects on EFGB performance.
Although the qualitative influence of clearance, structural stiffness, and eccentricity on foil bearing performance has been reported previously, most existing models either rely on strongly simplified spring network representations of the foil structure or employ purely numerical 3D FSI simulations that are difficult to use in routine design. In this context, the present work aims not to re-state known monotonic trends, but to provide a consistent, quantitatively validated framework that links detailed CEA modeling to practical design and testing. Specifically, the contributions of this study are as follows:
(1) This study develops a coupled macro-beam-Reynolds CEA model for EFGBs that reconstructs the realistic bump-foil geometry from macro-element beam subsystems while explicitly considering nonlinear contact and friction between the foils and the sleeve. This achieves high fidelity in predicting gas film pressure, foil deformation, and load capacity at a computational cost suitable for parametric studies. (2) This study constructs a fully coupled 3D CEA model in COMSOL Multiphysics, incorporating the same geometric and material details, and systematically benchmarks the macro-beam model against this reference. The predicted film thickness, pressure distribution, and capacity agree within 3–8% over a wide range of eccentricities and clearances, thereby quantifying the accuracy and robustness of the reduced CEA formulation. (3) Using the validated models, this study performs a comprehensive parametric analysis of foil thickness, clearance, eccentricity and interprets the results in terms of flexibility-dominated versus stiffness-dominated CEA modes. Together with static stiffness and high-speed rotor tests, we identify the main instability mechanisms (contact-induced friction, pressure/velocity non-uniformity, and flow-field asymmetry) and propose CEA-based design guidelines for selecting foil thickness and clearance combinations that balance load capacity and dynamic stability in high-speed EFGB applications.
2. EFGB Model, Working Principle, and Solid Mechanics Model
Before calculating bearing performance, it is necessary to determine the pressure distribution and resulting deformation within the foil structure. To this end, a top foil beam model is used to discretize the gas film and foil structure. Because frictional contact behavior significantly influences the performance of EFGB, this part will focus on modeling the foil structure and frictional contact.
2.1. EFGB Model and Hydrodynamic Lubrication
The EFGB uses hydrodynamic lubrication. In Figure 1a,b, the journal moves eccentrically, creating a gap between its surface and the inner surface of the top foil. When the rotor operates in the rotational speed range considered in this study, gas flows from the larger gap to the smaller one, generating a pressure effect between the surfaces [28,29]. Higher speed increases gas film pressure until enough lift force separates the journal from the top foil surface, achieving near-frictionless hydrodynamic lubrication [30]. The foil structure is shown in Figure 1c,d illustrates the integrated EFGB assembly.
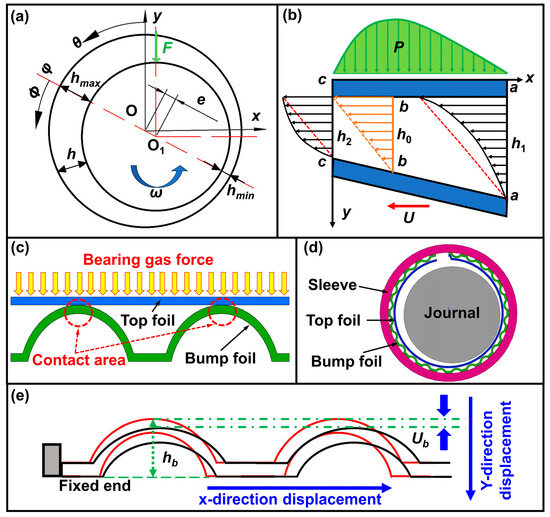
Figure 1.
(a) Model and theory of EFGB equilibrium position, (b) principle of EFGB hydrodynamic lubrication, (c) foil model, (d) EFGB model, and (e) EFGB foil displacement.
2.2. Analysis of Contact Between the Bump Foil and Top Foil
To achieve an effective solution to foil deformation and friction contact, the solid mechanics beam model elements are used. The plane beam element model, the foil beam modeling, and the top foil beam model forces analysis are presented in Appendix A. The negative pressure in the top foil beam model may be caused by the bending of the foil and the film effect. Contact state evaluations are necessary for beam model-based foil displacement calculations. The film pressure acting on the top foil is discretized into nodal forces at the bump support positions, which govern the determination of contact states. When the film force opposes and exceeds the preloading force, the foils are considered separated, resulting in zero support and friction forces. The gas film force must be positive and below the maximum reaction force of the bump foil for persistent foil contact. Support and friction forces are determined from the normal displacement of the bump foil. A penalty function method is used to calculate the resulting support and friction forces. The top foil displacement is then obtained according to the contact states. The procedure is illustrated in Figure 2.
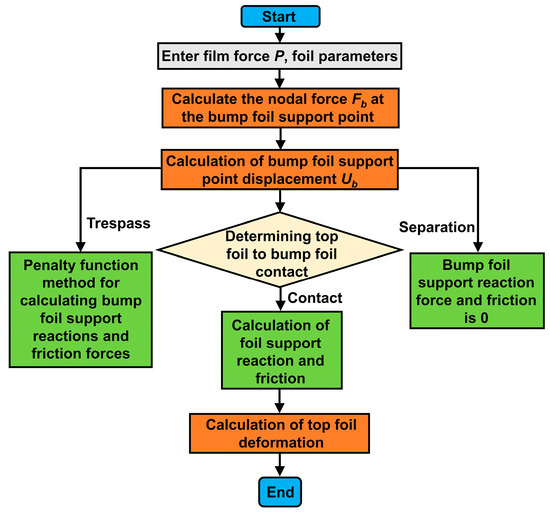
Figure 2.
Foil structural displacement calculations.
3. Derivation and Calculation of the Reynolds Equation for EFGB
After building the mechanics beam model of the foil, its deformation must be coupled to the film thickness equation. This part adopts a fully CEA numerical solution to solve the Reynolds equation, ensuring computational efficiency and result reliability. In this work, the CEA framework is formulated as an isothermal elasto-aerodynamic model. The gas film is described by a compressible Reynolds equation with constant viscosity evaluated at the nominal supply temperature, and the gas properties are assumed to be weakly temperature-dependent within the considered operating range. The foil structure is modeled by a nonlinear elastic beam with frictional contact, but thermal expansion of the foils and temperature-dependent material properties are not yet included. Consequently, the present CEA formulation focuses on capturing the strong coupling between gas film pressure, clearance variation, and nonlinear elastic deformation.
3.1. The Reynolds Equation
Performance analysis of plain bearings necessitates the solution of the Reynolds equation. The governing equation for gas lubrication, applicable to steady-state gas bearing systems, is derived through rigorous conjunction of the gas momentum equation (Navier–Stokes equations). The continuity gas state equation [31,32]:
to enhance computational robustness and facilitate generalized analysis, the governing equations are transformed into dimensionless form:
where z denotes the axial length, h denotes the axial length gas film thickness, C is the bearing clearance, p is the gas film pressure, Λ denotes the bearing number, R denotes bearing radius, θ denotes the circumferential angle, η denotes the gas viscosity coefficient, rotor angular velocity (ω), and gas density (ρ), and further simplified to obtain the expression of the dimensionless Reynolds equation:
The bearing geometric configuration is defined by bearing center (o), journal center (o1), journal radius (r), eccentricity (e), and the gas film thickness corresponding to any point (characterized as M) on the inner surface. Given that the eccentricity distance is significantly smaller than r and R, and angle oMo1 is negligible, the cos (oMo1) asymptotically approaches 1. The gas film thickness is:
during EFGB operation, the gas film force induces dynamically modulating gas film thickness, resulting in foil elastodynamic deformation. The actual thickness of the gas film needs to include the displacement amount of the foil in the above equation. Thus, the actual gas film thickness of the foil gas bearing is given in the following formula:
where e is eccentricity, φ is the rotor attitude angle, hδ is the deformation of the foil.
3.2. Discretization of the Reynolds Equation and Solution Region
The difference method is used to solve the Reynolds equation. The details of the difference and solution of the Reynolds equation are shown in Appendix B. The following provides a comprehensive explanation of the solution area. The inner surface of the bearing (the inner surface of the top foil) is unwrapped circumferentially into a rectangular domain, upon which a coordinate system is established for finite difference mesh discretization, as illustrated in Figure 3. The θ-axis represents the circumferential direction. At the same time, the z-axis denotes the axial direction. The entire circumferential domain is uniformly divided into m elements, with the corresponding node indices denoted by i. Similarly, half of the axial extent is evenly divided into n elements, with node indices represented by j. The foil is exposed to the atmosphere on both sides and features significant gaps at the leading and trailing edges. The nodes located along the lateral and end boundaries are defined as atmospheric boundaries and are excluded from the computational domain.
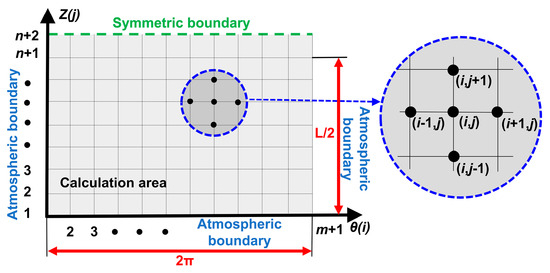
Figure 3.
Schematic diagram of grid area division.
During the iterative solution process, the gas film pressure value is continuously updated at each step. To avoid oscillations and ensure stable convergence, a relaxation factor (kp) is applied. This relaxation factor helps to stabilize the iterative process, preventing excessive fluctuations in the pressure distribution and ensuring accurate predictions of the gas film behavior. The iterative equation for the gas film pressure is:
3.3. Boundary Conditions and Convergence Conditions
In accordance with the solution area, this section is responsible for establishing the solution boundary conditions. The atmospheric boundaries are applied at the sides of the foil and the head/tail. When expressed in nodal coordinates, the gas film pressure equates to ambient pressure. The pressure boundary conditions are:
throughout the iterative process, convergence of the film pressure field is achieved when the updated values of both pressure and thickness at every grid point exhibit negligible difference from preceding counterparts. The convergence are defined as follows:
3.4. Balance of Gas Film Force and Foil Force-Aeroelastic Interaction Calculation
Foil deformation and friction must be considered. When the rotor operates in the rotational speed range considered in this study, a dynamic pressure film forms between the journal and the top foil. This film force acts on the top foil. Contact between the top and bump foils compresses and deforms the foils. During stable operation, the film force and the reaction force from foil displacement are in a dynamic equilibrium. This section will delineate the computational workflow. Figure 4 shows the calculation process for CEA.
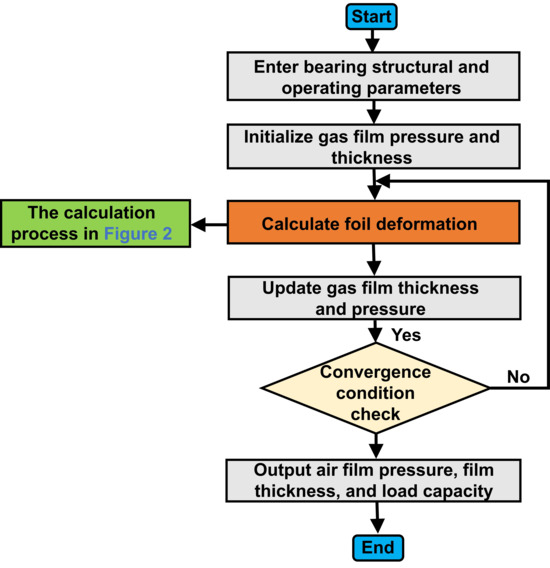
Figure 4.
Aeroelastic interaction calculation process.
In the coupled calculation, the film thickness is continuously iterated. The thickness at the nth iteration is
, and the new film thickness calculated from the film force is
. To prevent oscillation during the film iteration, a relaxation factor kh is introduced (generally 0.1–0.5). The film thickness after the n + 1th iteration is expressed as:
After the calculation converges, the gas film pressure distribution is integrated along the coordinate axis direction, and the load integral formulas are obtained as follows:
the overall dimensionless load and deflection angle φ of the bearing are expressed as:
3.5. Theoretical Model Reliability Verification
In accordance with the aforementioned theoretical model, this section verifies it to ensure accuracy. To verify the correctness of the theoretical calculation model for EFGBs established in this paper, the calculation parameters in Ref. [33] are implemented in the present theoretical model. The bearing parameters are in Table 1. The calculation results are benchmarked against reference data, as exhibited in Figure 5.

Table 1.
Data for the bearing in the reference [33].
In Figure 5a,b, the calculated pressure and film thickness distributions closely align with reference data. The red curve denotes the present results, while the black curve depicts the reference values. In Figure 5c, both profiles demonstrate near-perfect correspondence, exhibiting a maximum deviation of merely 3.56% at 60 krpm, confirming the theoretical model accuracy. Notably, the capacity in this study shows a marginally steeper increase with rotational speed. This discrepancy likely stems from differences in foil stiffness modeling. Unlike the approach in Ref. [33], which neglects foil friction, the present work utilizes a multi-element beam model accounting for friction effects and foil contact states, with foil displacement derived through finite element analysis. As established in prior research, foil friction could enhance capacity to some extent, which is likely responsible for the observed deviation. This benchmark thus confirms the correctness of the theoretical EFGB model for a well-documented bearing configuration, while Section 5.4 further examines the model for an independently designed EFGB geometry through detailed comparison with a fully coupled COMSOL FSI model.

Figure 5.
Theoretical calculation results and comparison: (a1,a2) dimensionless gas film pressure calculation results of the model proposed herein, (b) dimensionless gas film pressure, and (c) bearing capacity comparison between Ref. [33] and this model, respectively.
Figure 5.
Theoretical calculation results and comparison: (a1,a2) dimensionless gas film pressure calculation results of the model proposed herein, (b) dimensionless gas film pressure, and (c) bearing capacity comparison between Ref. [33] and this model, respectively.

4. Finite Element Modeling
After the completion of theoretical modeling, it is necessary to undertake finite element analysis of this component. This part utilizes the finite element method to implement a 3D model within COMSOL using FSI, while undertaking pre-processing and mesh generation. The Reynolds equation is solved via the finite element method in COMSOL to analyze the pressure. Post-processing evaluates capacity [34,35]. The equation is solved to compute the film pressure, while solid mechanics governs structural deformations. The pressure loads the foil, whose deformation in turn modifies the film thickness. This coupling is resolved iteratively until convergence. The contact model and the fully CEA model used in COMSOL are shown in Appendix C.
The model is used for preprocessing, simulation, and performance evaluation. Key structural parameters affect capacity. A 25 N capacity is achieved using parameters from Table 2. The target bearing capacity of 25 N, is a project-specific requirement. This value was set to ensure that EFGBs meet the load support needs of high-speed machinery in practical application environments. The project mandates that the bearing should be capable of handling loads greater than 25 N to guarantee reliable and efficient operation. This design criterion is consistent with the expectations set by the project stakeholders, aiming to optimize the bearing’s performance under realistic operational conditions. These parameters were obtained in a preliminary design phase by iteratively adjusting the shaft radius, bearing length, foil thickness, bump geometry, and number of bumps using the coupled macro-beam–Reynolds model and the 3D CEA model in COMSOL until a static load capacity and sufficient stiffness were achieved. In this study, the bearing configuration in Table 2 is pre-given to illustrate the modeling procedure; it is obtained as an optimal result from a series of coupled theoretical and numerical simulations, and then used as the reference EFGB for the subsequent static stiffness and lubrication analyses. Table 3 shows that finer meshing increases computational cost but reduces error, leading to the adoption of Mesh IV for minimal discretization error. The film region uses a structured mesh, while other areas use free tetrahedral elements and local refinement near contacts. Geometry, boundaries, and mesh are shown in Figure 6.
Table 2.
Basic parameters of independently designed EFGB.
Table 3.
The influence of the number of grid divisions on calculation time and accuracy.

Figure 6.
Modeling and pre-processing: (a) sleeve, (b) bump foil, (c) top foil, (d) foil fixing end, (e,f) details of each component, (g) finite element model, (h) boundary conditions, and (i) mesh results.
Figure 6.
Modeling and pre-processing: (a) sleeve, (b) bump foil, (c) top foil, (d) foil fixing end, (e,f) details of each component, (g) finite element model, (h) boundary conditions, and (i) mesh results.

5. Results and Discussion
In this part, the parameters of the independently designed EFGB in Table 2 are analyzed using the 3D CEA model developed in COMSOL. All simulations in Section 5.1, Section 5.2 and Section 5.3 are performed with this COMSOL CEA model and the parameters listed in Table 2. The resulting film pressure, foil deformation, film thickness, and bearing capacity are discussed to reveal the influence of foil thickness, eccentricity, clearance, and material. Section 5.4 then uses the macro-beam theoretical model introduced in Section 2 and Section 3, applies it to the same Table 2 configuration, and compares its predictions with the COMSOL results to verify the consistency and accuracy of the theoretical formulation.
This part presents the results and systematically examines the influence of parameters and materials on film pressure, deformation, and capacity, with comparisons to theoretical predictions. To investigate load capacity and stability, this study calculates film pressure and bearing capacity, using top-foil displacement, film thickness distribution uniformity, and pressure fluctuations as indicators of stability.
5.1. Static Simulation Results for a Foil Thickness of 0.1 mm
5.1.1. Effect of Eccentricity on Gas Film Thickness, Foil Displacement, and Pressure
After the simulation, the thickness of the gas film, the displacement of the foil, and the pressure results under different eccentricities are extracted for analysis. When e = 0.7, tb = 0.1 mm, and 30 krpm rotational speed, the simulation results are shown in Figure 7. The displacement variations in the bump foil, the gas film thickness, and the gas film pressure under different eccentricities are exhibited in Figure 8.
As indicated in Figure 7a–d, under e = 0.7, the pressure, film thickness, and displacement of the foils exhibit pronounced spatial distributions and periodic responses. In Figure 7(a1,a2), the film pressure reaches its peak value of approximately 1.36 × 10⁵ Pa in the region of minimum clearance. The negative pressure phenomenon, defined as the local pressure below ambient, primarily arises from rotor eccentricity, which induces uneven film thickness and local gas acceleration, leading to suction effects or rarefaction within specific regions. In Figure 7(b1,b2), the film thickness varies from 3.13 × 10⁻³ mm to 1.74 × 10⁻² mm, exhibiting a pronounced periodic fluctuation pattern governed jointly by rotor eccentricity and the corrugated sub-foil structure. Figure 7(c1,c2) indicates that the wave foil deformation under gas film pressure reaches a maximum of 9.02 × 10⁻⁷ m, and its deformation mode corresponds closely to the pressure distribution profile. The periodic geometry of the wave foil provides compliant support for the top foil. In Figure 7(d1,d2), the maximum displacement of the top foil is approximately 4.88 × 10⁻⁶ m, which is significantly larger than that of the wave foil.
From Figure 8a, when the eccentricity e = 0.1, the maximum top foil displacement is about 0.0004 mm, whereas at e = 0.7, it increases markedly to 0.00488 mm. The displacement grows with increasing eccentricity, and the effect becomes particularly pronounced under conditions of large eccentricity. As shown in Figure 8b, when e = 0.1, the film thickness varies smoothly between 0.009 mm and 0.011 mm. However, at e = 0.7, severe oscillations occur, with the maximum film thickness reaching 0.0174 mm and the minimum reducing to 0.00313 mm. Figure 8c demonstrates that for e = 0.7, the peak pressure reaches 1.36 × 10⁵ Pa, and the pressure fluctuation amplitude increases significantly, especially in regions of reduced film thickness where pressure concentration is evident.
With increasing eccentricity, the interaction between the gas film and the compliant foils intensifies. The gas film pressure acting on the top foil promotes contact with the underlying wave foil, leading to larger top foil displacements and enhanced fluctuations in film thickness, thereby forming localized pressure concentrations. This bidirectional feedback mechanism among gas film pressure, foil deformation, and film thickness is a typical manifestation of CEA. The nonlinear characteristics of this coupling are strongly influenced by foil geometry and compliance, becoming more pronounced at higher eccentricities.
At large eccentricities, certain regions of the gas film may become extremely thin or even experience intermittent contact, thereby amplifying frictional effects. Such contact friction alters the boundary conditions of the gas film, resulting in deviations in both thickness and pressure distributions and further magnifying discrepancies in high-pressure concentration zones. This effect not only introduces additional energy dissipation but also improves the numerical fidelity, making the simulation results more representative of the actual operating conditions and better reflecting the complex nonlinear dynamics of EFGB.

Figure 7.
Simulation results under e = 0.7 and tb = 0.1 mm: (a1,a2) gas film pressure, (b1,b2) gas film thickness, (c1,c2) bump foil deformation, and (d1,d2) top foil deformation, respectively.
Figure 7.
Simulation results under e = 0.7 and tb = 0.1 mm: (a1,a2) gas film pressure, (b1,b2) gas film thickness, (c1,c2) bump foil deformation, and (d1,d2) top foil deformation, respectively.


Figure 8.
Simulation results under different eccentricities: (a1) the top foil displacement distribution, (a2–a7) top foil cloud graph; (b1) the gas film thickness distribution, (b2–b7) film thickness cloud graph; (c1) the gas film pressure distribution, (c2–c7) gas film pressure cloud graph, respectively.

5.1.2. Effect of Clearance on Gas Film Thickness, Foil Displacement, and Pressure
In this study, the range of bearing clearances from 5 to 20 µm was selected to investigate how small variations in clearance affect the bearing performance. It is important to note that the focus of this analysis is on identifying trends in performance, rather than on exact values. The clearances presented in Table 1 (25 µm) and Table 2 (65 µm) represent typical or maximum clearance values, which are much larger and reflective of the operational conditions and manufacturing tolerances found in real-world bearings. These values serve as a benchmark for typical operational clearance ranges.
The 5 to 20 µm clearance range was chosen to study the bearing behavior within a smaller window of precision, aiming to assess how slight adjustments in clearance influence performance. This range accounts for natural variations in clearance arising from manufacturing processes, where deviations in precision can occur. Even with precise design specifications, machining processes, surface finishes, tool wear, and material inconsistencies can cause slight variations in the actual clearance. These unavoidable manufacturing tolerances can affect bearing behavior, making this range essential for understanding the sensitivity of performance to minor clearance changes, given that manufacturing tolerances inherently introduce some uncertainty in precise values.
After the simulation, the results under different clearances are extracted for analysis. As shown in Figure 9a, when the bearing clearance c increases, the maximum displacement of the top foil decreases from approximately 0.004 mm to 0.0018 mm, indicating that a larger clearance reduces the influence of gas film pressure on the foil deformation. Figure 9b shows that an increase in clearance leads to a thicker gas film with fewer minor fluctuations. In the non-load regions, the variation in film thickness becomes insignificant, suggesting that the influence of gas pressure is weakened. As illustrated in Figure 9c, both the peak pressure and its fluctuation amplitude decrease with increasing clearance. When c = 0.005 mm, the peak gas film pressure reaches 1.4 × 10⁵ Pa, whereas it drops to 4 × 10⁴ Pa when c = 0.02 mm.
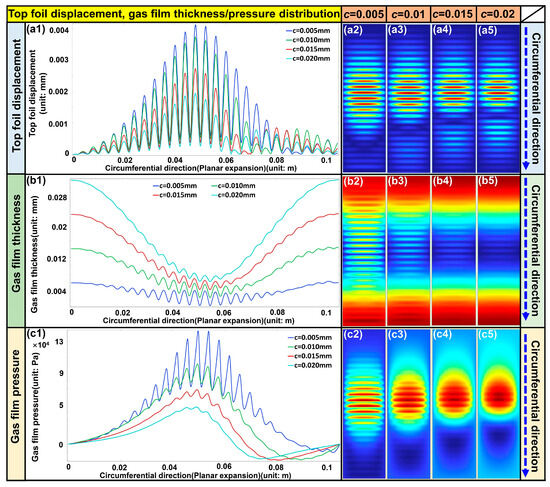
Figure 9.
Simulation results under different clearances: (a1) the top foil displacement distribution, (a2–a5) cloud graph; (b1) the gas film thickness distribution, (b2–b5) gas film thickness cloud graph; (c1) the gas film pressure distribution, (c2–c5) gas film pressure cloud graph, respectively.
When the clearance decreases, the gas film pressure rises, causing greater top foil displacement and stronger film thickness oscillations. The bidirectional feedback between the gas field and foil deformation enhances pressure concentration, which further amplifies film thickness undulations and displacement amplitudes, a characteristic behavior of CEA. Conversely, as the clearance increases, the coupling effect is weakened, resulting in reduced pressure, smoother gas film distribution, and less foil deformation.
Under small clearance conditions, the local gas film may become extremely thin or even experience intermittent contact, leading to enhanced frictional effects. The introduction of contact friction alters the local boundary conditions. It introduces additional energy dissipation, thereby increasing the complexity of the pressure distribution and accentuating the deviation from the idealized fluid model. With larger clearances, the gas film thickness increases, effectively avoiding contact-induced friction. As a result, the pressure field becomes more uniform, and the structural response of the foil is significantly attenuated.
5.1.3. Effects of Eccentricity and Clearance on Average Flow Velocity on the Top Foil
After the simulation, average flow velocity results on the top foil surface under different eccentricities and clearances are extracted for analysis. Eccentricity and clearance primarily influence the average flow velocity by modifying the gas film geometry. Higher eccentricity and reduced clearance notably increase the average gas flow velocity across the top foil. Velocity variations under different eccentricities and clearances are shown in Figure 10 and Figure 11, respectively.
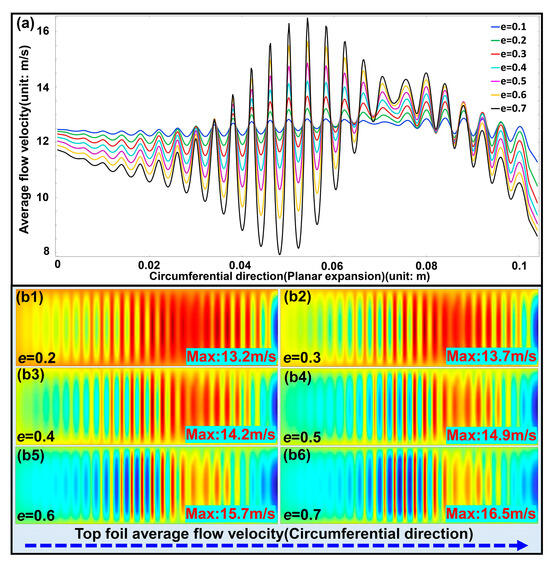
Figure 10.
Simulation results under different eccentricities: (a) average gas velocity variation on the top foil, (b1–b6) cloud graph of average gas velocity variation on the top foil.
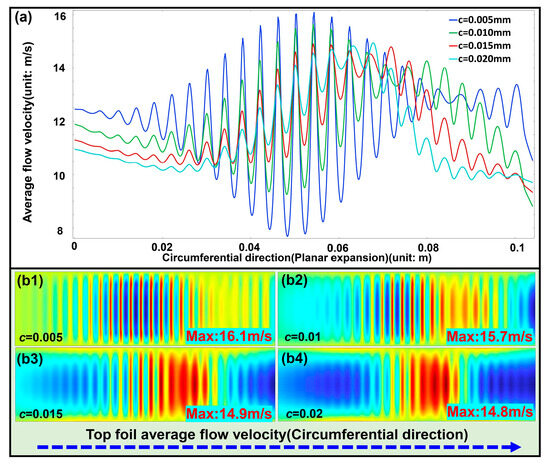
Figure 11.
Simulation results under different clearances: (a) average gas velocity variation on the top foil, (b1–b4) cloud graph of average gas velocity variation on the top foil.
As shown in Figure 10, when the eccentricity e increases from 0.2 to 0.7, both the mean flow velocity and the local peak velocity rise significantly, with the maximum velocity increasing from 13.2 m/s to 16.5 m/s. The velocity profiles exhibit increasingly pronounced oscillations along the circumferential direction. At low eccentricities (e = 0.2–0.3), the flow field remains relatively uniform with weak fluctuations, whereas at higher eccentricities (e = 0.6–0.7), the oscillations become much stronger, showing distinct alternation between high and low speed regions and a pronounced enhancement of flow field asymmetry.
The eccentricity increases, the bidirectional interaction between pressure and foil elasticity intensifies, giving rise to a significant CEA effect. Foil deformation strengthens the dynamic pressure in the minimum film thickness region, resulting in a noticeable local acceleration of the gas flow. Both the mean and peak velocities increase monotonically with eccentricity, and the circumferential oscillation amplitude of the velocity profile grows progressively. The aeroelastic coupling amplifies the flow field sensitivity to eccentricity variation. It aggravates flow nonuniformity, leading to more concentrated high-speed zones and more distinct differences between high and low speed regions.
At large eccentricities, the local clearance between the rotor and the elastic foil becomes smaller, promoting intermittent contact and friction, which introduces additional energy dissipation and disturbs the flow field. The presence of contact friction intensifies the velocity fluctuations, resulting in alternating high and low speed regions and further enhancing flow asymmetry. The frictional effect weakens the stability of the gas film flow, causing deviations from the ideal frictionless model and thereby increasing the complexity of the flow behavior.
As shown in Figure 11, under small clearance conditions (c = 0.005 mm), the mean velocity reaches its highest value, and the flow exhibits dense alternations of high and low speed regions along the circumferential direction, indicating strong oscillatory behavior. When the clearance increases to a moderate level (c = 0.01–0.015 mm), the mean velocity gradually decreases, the oscillation amplitude weakens markedly, and the flow field becomes more uniform. With further clearance enlargement to c = 0.02 mm, the overall velocity decreases, and the flow distribution transitions to a large-scale smooth variation with attenuated local features.
Variation in clearance alters the interaction between the gas film and the foil structure. At smaller clearances, the bidirectional coupling between pressure and foil is more pronounced, leading to alternating high and low speed zones and strong circumferential oscillations. This coupling enhances local dynamic pressure and shear effects, thereby increasing the capacity. However, extreme CEA characteristics may compromise flow uniformity and reduce system stability. As the c increases, the coupling effect weakens, and the flow field becomes progressively smoother, achieving a relative balance between dynamic pressure enhancement and flow resistance.
Under small clearances, contact and frictional effects between the rotor and the foil become more prominent, introducing local flow blockage and perturbations that induce flow asymmetry and complexity. With increasing clearance, the influence of contact friction gradually diminishes, and the flow field tends to become smoother and more uniform. Consequently, the overall flow stability improves, though the dynamic-pressure load capacity is reduced. Frictional contact enhances flow-field variations under small clearance conditions but loses its dominant role at larger clearances, where the results approach those of an ideal lubricating gas film.
5.2. Static Simulation Results for a Foil Thickness of 0.2 mm
5.2.1. Effect of Eccentricity on Gas Film Thickness, Foil Displacement, and Pressure
After the simulation, the thickness of the gas film, the displacement of the foil, and the pressure results under different eccentricities are extracted for analysis. When tb = 0.2 mm, e = 0.7, and speed is 30 krpm, the simulation results are presented in Figure 12. The displacement changes in the bump foil, gas film thickness, and gas film pressure under different eccentricities are shown in Figure 13.
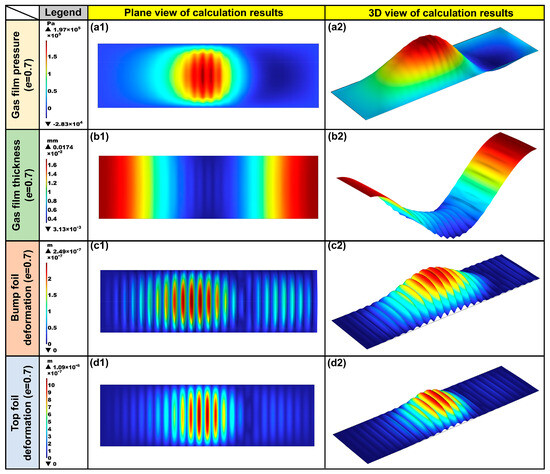
Figure 12.
Simulation results under e = 0.7 and tb = 0.2 mm: (a1,a2) gas film pressure, (b1,b2) gas film thickness, (c1,c2) bump foil deformation, and (d1,d2) top foil deformation, respectively.
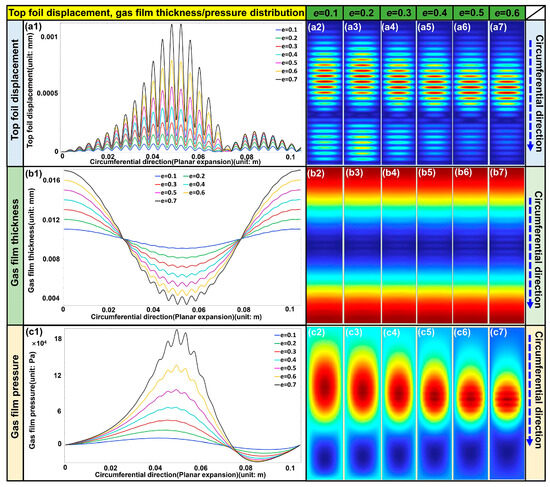
Figure 13.
Simulation results under different eccentricities: (a1) the top foil displacement distribution, (a2–a7) top foil displacement cloud graph; (b1) the gas film thickness distribution, (b2–b7) gas film thickness cloud graph; (c1) the gas film pressure distribution, (c2–c7) gas film pressure cloud graph, respectively.
In Figure 12(a1,a2), the film pressure reaches a peak value of 1.97 × 10⁵ Pa in the region of minimum clearance, where pressure fluctuations are significantly attenuated. In Figure 12(b1,b2), the gas film thickness is smallest at the center, about 0.0031 mm, and gradually increases toward both sides to about 0.0171 mm. The foil with a thickness of 0.2 mm exhibits a more uniform film thickness distribution. As illustrated in Figure 12(c1,c2) and (d1,d2), the maximum displacements of the bump foil and the top foil are 2.49 × 10⁻⁷ m and 1.09 × 10⁻⁶ m, respectively, with minor deformations observed at the edges. By comparing Figure 7 and Figure 12, it can be observed that the maximum pressure increases from 1.36 × 10⁵ Pa for the 0.1 mm foil to 1.97 × 10⁵ Pa for the 0.2 mm foil. The thinner foil exhibits larger fluctuations in film thickness, while the thicker foil yields a more uniform gas film. Correspondingly, the maximum top foil displacement decreases from 4.88 × 10⁻⁶ m (0.1 mm foil) to 1.09 × 10⁻⁶ m (0.2 mm foil).
When e = 0.7, increasing the foil thickness markedly alters the CEA characteristics between the gas film and the foils. For the thinner foil (0.1 mm), significant fluctuations in film thickness and large elastic deformation occur near the central region, leading to highly non-uniform pressure and thickness distributions and a stronger CEA interaction. When the thickness increases to 0.2 mm, the structural stiffness of the foil improves substantially, the deformation amplitudes of both the top and bump foils are significantly reduced, the film thickness becomes more uniform, and pressure fluctuations are effectively suppressed. Therefore, a thicker foil weakens excessive CEA, enhances the capacity, and improves system stability.
The effect of foil thickness on contact friction behavior is also significant. For the 0.1 mm foil, the larger central displacement under minimum clearance conditions promotes local contact and friction, generating additional flow disturbances and energy dissipation. In contrast, the 0.2 mm foil exhibits markedly reduced overall displacement, a more uniform gas film profile, and a substantially lower probability of local contact and friction. Hence, increasing foil thickness effectively mitigates contact friction, suppresses friction-induced instability, and enhances operational reliability.
In Figure 13a, when e = 0.1, the top foil displacement is minimal, whereas at e = 0.7, the displacement reaches 1.09 × 10⁻⁶ m. Figure 13b,c show that the film distribution becomes increasingly non-uniform with rising eccentricities, accompanied by higher peak pressure and larger pressure fluctuations. By comparing Figure 8 and Figure 13, it can be observed that increasing the foil thickness from 0.1 mm to 0.2 mm consistently affects gas film pressure, film thickness, and displacement under different eccentricities, as shown in the results mentioned above. For the 0.1 mm foil at e = 0.7, the gas film pressure peak is 1.36 × 10⁵ Pa, with pronounced film thickness oscillations and large top foil displacement. In contrast, the 0.2 mm foil exhibits a higher peak pressure of 1.97 × 10⁵ Pa, minor film thickness fluctuations, and reduced foil displacement.
As eccentricity increases, the pressure in the minimum clearance region intensifies significantly, leading to larger foil displacements and a more prominent CEA. For the 0.1 mm foil, higher flexibility results in greater deformation at large eccentricities, leading to evident fluctuations in film thickness and aggravated pressure concentration, thereby amplifying the CEA. When the thickness is 0.2 mm, the structural stiffness is enhanced, foil displacement is reduced, the film thickness distribution becomes more uniform, and pressure fluctuations are mitigated. A thicker foil effectively alleviates the excessive CEA phenomenon, increases capacity, and improves stability.
Under high eccentricities, the thinner foil undergoes larger deformation, causing the minimum clearance region to shrink further. This increases the likelihood of local contact and friction, leading to system instability. In contrast, the thicker foil with enhanced stiffness effectively suppresses displacement and clearance fluctuations, reduces the risk of local contact and friction, and yields flow characteristics closer to those of an ideal gas film.
5.2.2. Effect of Clearance on Gas Film Thickness, Foil Displacement, and Pressure
After the simulation, the thickness of the gas film, the displacement of the foil, and the pressure results under different clearances are extracted for analysis.
As shown in Figure 14a, when c = 0.005 mm, the maximum displacement of the top foil is 1.0 × 10⁻⁶ m. In Figure 14b, the gas film thickness exhibits minor fluctuations, and in Figure 14c, the film pressure reaches a peak value of 2.1 × 10⁵ Pa. When c = 0.02 mm, the peak film pressure decreases to 5.25 × 10⁴ Pa, the film thickness fluctuation increases, and the maximum top foil displacement decreases to 3.0 × 10⁻⁷ m. By comparing Figure 9 and Figure 14, it can be observed that for the 0.1 mm foil, at c = 0.005 mm, the film pressure peak is higher and exhibits more pronounced fluctuation. At a larger clearance (c = 0.02 mm), the pressure decreases and becomes more stable, while the top foil displacement remains at a relatively low level. For the 0.2 mm foil, the film pressure remains at a relatively high level under both clearance conditions.
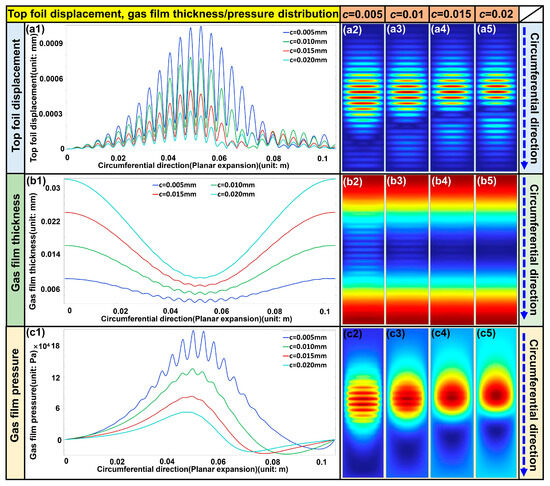
Figure 14.
Simulation results under different clearances: (a1) the top foil displacement, (a2–a5) cloud graph, (b1) the gas film thickness distribution, (b2–b5) gas film thickness cloud graph; (c1) the gas film pressure distribution, (c2–c5) gas film pressure cloud graph, respectively.
For the thinner foil, a smaller clearance leads to an increase in film pressure and top foil displacement, resulting in an intensified CEA effect, greater pressure concentration, and larger local deformation. As the clearance increases, the film thickness grows, the pressure decreases, and the top foil displacement is reduced. The pressure distribution becomes smoother, and the system stability is improved, although the load capacity declines accordingly. The thicker foil provides higher structural stiffness under the same conditions, effectively suppressing deformation, promoting a more uniform film distribution, and maintaining a higher-pressure level. This mitigates excessive CEA effect, thereby enhancing both the load capacity and the operational stability.
When the clearance is small, the high flexibility of the thin foil may cause excessive deformation, which can induce gas film oscillations and contact, leading to frictional dissipation and flow disturbance. The thicker foil exhibits limited displacement and higher stiffness, thereby reducing the likelihood of local contact and friction. As the clearance increases, the gas film pressure decreases, the top foil displacement diminishes, and contact friction weakens. A proper combination of increased foil thickness and moderate clearance can enhance load capacity and system reliability.
5.2.3. Effects of Eccentricity and Clearance on Average Flow Velocity on the Top Foil
After the simulation, average flow velocity results on the top foil surface under different eccentricities and clearances are extracted for analysis. As shown in Figure 15, when the e increases from 0.2 to 0.7, both the average and local maximum gas velocities rise progressively, with the maximum velocity increasing from 13 m/s to 14.3 m/s. From Figure 10 and Figure 15, it can be observed that as the eccentricity increases from 0.2 to 0.7, the average gas velocity for both foil thicknesses (0.1 mm and 0.2 mm) first increases and then decreases, reaching a peak when e is between 0.4 and 0.5.
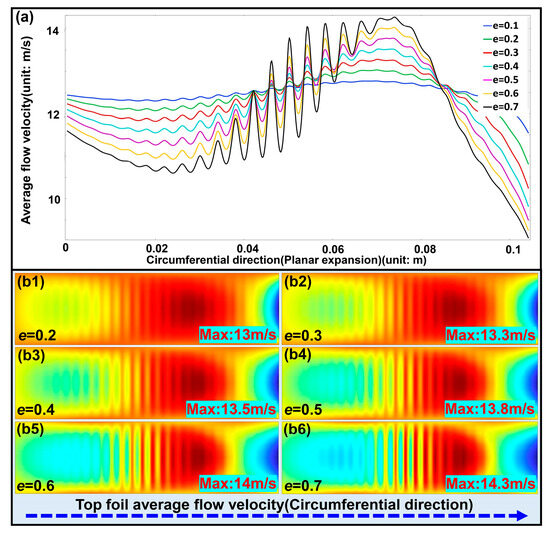
Figure 15.
Simulation results under different eccentricities: (a) average gas velocity variation on the top foil, (b1–b6) cloud graph of average gas velocity variation on the top foil, respectively.
As eccentricities increase, the film thickness distribution becomes more non-uniform, and a pronounced wedge effect forms in the minimum clearance region, thereby strengthening the hydrodynamic pressure effect and significantly increasing the flow velocity. A larger pressure gradient acts on the foil, inducing noticeable top foil deformation and intensifying the CEA effect. At moderate eccentricity levels, this coupling effect effectively enhances the load capacity and optimizes the flow distribution. However, when the eccentricity becomes excessively high, excessive foil deformation causes local over-constriction of the flow channel, which increases flow resistance and leads to a reduction in the average velocity. Hence, the CEA can improve load capacity; when overly intensified, it may also induce flow instability. The 0.2 mm foil limits deformation to some extent, mitigating the adverse influence of excessive coupling.
At low eccentricities, the clearance distribution between the rotor and the foil remains uniform, resulting in a low risk of contact and friction and a stable flow field. As the eccentricity increases, the severe contraction of the minimum clearance region raises the likelihood of local contact and friction. This causes energy dissipation and flow disturbance, thereby aggravating flow asymmetry and reducing flow stability. 0.1 mm foil, higher flexibility leads to more pronounced deformation, and contact friction become particularly evident at high eccentricity. 0.2 mm foil, with greater stiffness, effectively suppresses displacement and reduces the interference of friction with the flow field.
As shown in Figure 16, when c increases from 0.005 mm to 0.02 mm, the gas velocity exhibits a nonlinear variation. At c = 0.005 mm, the velocity distribution is relatively uniform, with a maximum velocity of 13.9 m/s. As the clearance increases, the velocity peak rises and reaches its maximum value of 14.9 m/s at c = 0.015 mm. Under small clearance conditions, the gas flow shows a streak-like distribution, whereas larger clearances lead to the emergence of localized high velocity regions and non-uniform patterns. The non-uniform velocity distribution mainly arises from intensified flow disturbances and pressure gradient variations caused by increased clearance. Local high-speed jet regions formed under large clearance conditions influence both the dynamic characteristics and the system stability. A velocity peak region appears at a circumferential position of approximately 0.06 m, which results from the combined effect of the structural configuration and the applied load.
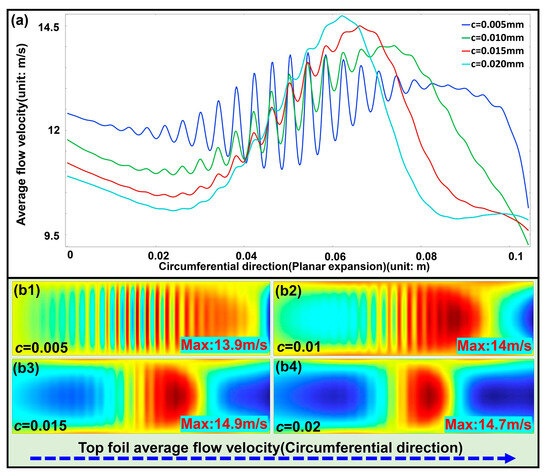
Figure 16.
Simulation results under different clearances: (a) average gas velocity variation on the top foil, (b1–b4) cloud graph of average gas velocity variation on the top foil, respectively.
In Figure 11 and Figure 16, the 0.1 mm foil, due to its lower stiffness, shows significant deformation as the clearance increases. The “passive adjustment” of the foil leads to local contraction of the flow channel, thereby increasing flow resistance and reducing the average velocity. This behavior reflects a flexibility-dominated CEA, characterized by foil deformation exerting a leading influence on the flow-path geometry. When the foil thickness is increased to 0.2 mm, the structural stiffness is enhanced, suppressing excessive deformation. As the clearance enlarges, the effective flow-channel area increases, and the gas velocity rises, indicating a stiffness-dominated CEA effect. Therefore, foil thickness determines the dominant mode of the coupling effect: flexibility controlled for thin foils and stiffness controlled for thick foils.
At small clearances, insufficient gas film thickness may lead to local contraction, particularly for thin foils, where larger deformation can promote local contact and friction, aggravating flow field non-uniformity. As the clearance increases, contact friction effects weaken; however, for thin foils, excessive deformation may still cause local channel contraction and elevate friction risk. Under the same conditions, the thicker foil with higher stiffness effectively limits local displacement and contact, reducing the influence of friction on the flow field disturbance. Hence, increasing foil thickness not only improves the mode of CEA but also suppresses contact friction effects, thereby enhancing the operational reliability and stability of the bearing.
In summary, variations in the design parameters-namely, the eccentricity, clearance, and foil thickness-affect the non-uniformity of gas film pressure and flow field distribution, which in turn influence the overall system stability. The specific instability phenomena can be summarized as follows:
- (1)
- Increase in maximum top foil displacement: Under conditions of large eccentricity, small clearance, or thin foil, intensified CEA results in greater top foil displacement, which increases the risk of friction and contact and may trigger rotor-system instability.
- (2)
- Enhanced film thickness fluctuation: At large eccentricity, small clearance, and with thin foils, significant volatility in gas film thickness occurs, producing fragile local regions and non-uniform load-carrying surfaces that promote contact and frictional.
- (3)
- Non-uniform pressure and flow field distribution: Under large eccentricity, small clearance, or thin-foil conditions, both the pressure and velocity fields become highly non-uniform, with intensified pressure concentration and shear effects. These lead to gas flow instability, vibration, and friction-induced instability.
- (4)
- Local frictional and contact-induced instability: For thin foils and at high eccentricity, the non-uniform gas film distribution causes excessive local pressure, increasing frictional forces and potentially inducing contact or frictional instability.
- (5)
- Vibration caused by flow field asymmetry: At small eccentricity and with thin foils, asymmetry in the flow field leads to pressure fluctuations and vibration. Non-uniform velocity distribution further aggravates the dynamic instability of the system.
Overall, the observed instability arises from the combined effects of elasto-aerodynamic feedback, film thickness distribution, and frictional interaction. Therefore, in bearing design, a careful balance must be achieved between load capacity and operational stability. From a TEHD perspective, increasing rotational speed and load would be accompanied by additional viscous dissipation in the film and by temperature-dependent changes in gas properties and foil stiffness. For the operating range considered in this study (simulations up to 30,000 rpm and experiments with lift-off between 4300 and 7000 rpm under 10–30 N loads), the resulting temperature rise in the gas foil bearing is typically moderate, and the isothermal assumption provides a reasonable first approximation to the static performance trends reported here. Nevertheless, under more severe thermal conditions-such as higher inlet temperatures or prolonged operation near the upper speed limit-TEHD coupling is expected to reduce effective gas viscosity and minimum film thickness, slightly lower the absolute load capacity, and shift the optimal combinations of clearance and foil thickness identified in this work. Quantifying these effects within the present CEA framework will be an important subject of future research.
5.3. Effect of Bearing Clearance and Eccentricity on Loading Capacity
After analyzing film pressure, foil displacement, film thickness, and average flow velocity under different eccentricities and clearances, this section explores the changes in bearing capacity corresponding to these parameters. The calculations are based on the independently designed EFGB listed in Table 2. In the EFGB, a small clearance and high eccentricity enhance the load capacity but reduce system stability, whereas an ample clearance and low eccentricity improve stability at the expense of capacity. The influence of parameters on the performance is illustrated in Figure 17.
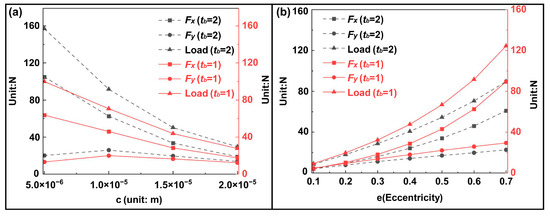
Figure 17.
(a) The relationship between bearing clearance and bearing capacity, and (b) the relationship between eccentricity and bearing capacity, respectively.
As shown in Figure 17a, when the foil thickness is 0.1 mm, the load capacity decreases as the clearance increases. The maximum load capacity, approximately 99 N, occurs at c = 5 × 10⁻⁶ m. As the clearance increases, the capacity decreases accordingly. When the foil thickness is 0.2 mm, the load capacity decreases with increasing clearance; however, it remains higher than that of the 0.1 mm foil. Under the same clearance conditions, the 0.2 mm foil exhibits a significantly greater load capacity than the 0.1 mm foil. This result is consistent with the previous analysis, indicating that increasing foil thickness enhances system stiffness. Moreover, reducing the clearance simultaneously increases film pressure, thereby improving capacity.
In Figure 17b, the capacity increases with increasing eccentricity. The rate of increase is more pronounced for the 0.2 mm foil, suggesting that a thicker foil can effectively enhance load support under high eccentricity conditions. With decreasing clearance and increasing foil thickness, the film pressure rises, the film becomes thinner, and the capacity improves, all of which collectively contribute to higher stiffness and better support capability. The choice of foil thickness should be determined based on application requirements: thicker foils are suitable for systems demanding higher capacity and improved stability. In comparison, thinner foils are advantageous for systems requiring flexibility or rapid dynamic response. Bearing design should balance load capacity, stability, and flexibility to determine the optimal foil thickness and clearance. Although a small clearance and thin foil can substantially increase capacity, the accompanying displacement growth and film thickness fluctuations indicate reduced stability. Conversely, larger clearances and thicker foils improve stability at the cost of reduced capacity, reflecting the inherent trade-off between load and stability.
The CEA and contact friction behavior are jointly influenced by foil thickness, clearance, and eccentricity. Reducing clearance or increasing eccentricity raises the gas film dynamic pressure and strengthens the coupling effect. For thinner foils, greater compliance leads to significant bending deformation under small clearance and high eccentricity conditions. Although capacity is enhanced, strong coupling reduces stability, and the minimum film thickness decreases sharply, increasing the risk of rubbing or transient impact, which results in noticeable frictional loss and wear. Under the same conditions, a thicker foil achieves higher capacity and a more uniform gas film distribution. The coupling behavior approaches a rigid-body response with film pressurization, leading to increased stiffness and critical speed and reduced probability of contact and friction. Conversely, increasing clearance or reducing eccentricity weakens the coupling and lowers the likelihood of contact, though the load capacity decreases correspondingly.
From an engineering perspective, for high-load operating conditions, it is recommended to use a combination of a thicker foil and a small clearance, along with an enhanced wear-resistant design. When stability and service life are of greater concern, adopting a larger clearance, moderate eccentricity, and thicker foil is more appropriate. In this study, the target design bearing load capacity is 25 N. According to the calculated results shown in Figure 17, the bearing load capacity under these design parameters satisfies the required performance specifications.
5.4. Comparative Verification of Theoretical Calculations and Simulation Models
After completing the theoretical calculations and the COMSOL CEA simulations, the validity and accuracy of the theoretical model need to be verified in this section. The beam element model was used to calculate gas film pressure and capacity using Table 2 and MATLAB R2024b. The results were compared with COMSOL simulations to validate the model. The MATLAB model uses the beam element assumption to solve for elastic deformation under gas film pressure to obtain film thickness and pressure distribution. Both the MATLAB-based macro-beam model and the 3D COMSOL FSI model are solved using nonlinear iterative schemes that account for geometric nonlinearity, contact and friction, and the nonlinear coupling between gas film pressure and foil deformation, while the foil material itself is represented by an isotropic linear-elastic law.
This comparison assesses the consistency between the theoretical and simulation models, confirming their applicability and reliability for analyzing elastic foil gas bearings. As shown in Figure 18, the MATLAB and COMSOL results exhibit strong agreement in gas film thickness, pressure distribution, and capacity. Figure 18a shows that both models yield consistent film thickness trends, validating the accuracy of the MATLAB model. In Figure 18b, the dimensionless gas film pressure results confirm the model’s ability to capture pressure concentration and distribution, with an error small compared with the maximum gas film pressure of 1.36 × 10⁵ Pa in Figure 7a. Figure 18c further demonstrates the consistency of gas film pressure predictions, with only minor deviations. Figure 18d presents the capacity and error analysis, showing that although the error slightly increases with eccentricity, it remains below 8%, indicating reliable performance. The error is calculated by taking the absolute difference between the simulated bearing capacity and the theoretical bearing capacity, dividing that difference by the theoretical bearing capacity, and then multiplying the result by 100 to express the error as a percentage. Although the error increases slightly with eccentricity due to the more complex gas film pressure distribution and foil deformation, it remains below 8%, confirming the model’s reliability for practical applications. As observed in Figure 18d, the peak negative pressure in the negative pressure region deviates significantly from the expected value, being nearly three times higher than anticipated. The discrepancy can be attributed to limitations in the model, including boundary conditions and mesh resolution, particularly under extreme eccentricity conditions where pressure concentrations are more pronounced. Although this discrepancy is notable, it does not significantly affect the overall performance trends of bearing capacity and load-bearing stability. The pressure distribution in the majority of the gas film remains consistent with the model’s predictions, and the conclusions regarding bearing capacity and performance trends are valid. This study acknowledges the discrepancy and suggests that it should be considered when evaluating the model’s predictive accuracy in extreme pressure regions. The comparison shows that the simplified macro-beam CEA model can reproduce key features of the high-fidelity FSI solution for the current bearing configuration while maintaining significantly lower computational cost. Combined with the verification against the reference bearing in Section 3.5, which yields a maximum deviation of 3.56% in capacity, and the prototype experiments in Section 6, this work provides multi-geometry and multi-dataset validation of the proposed framework: (i) a literature-based benchmark for a well-documented bearing, (ii) cross-validation between the macro-beam model and a fully coupled COMSOL FSI model for an independently designed EFGB, and (iii) experimental confirmation of load capacity, stiffness, and lift-off characteristics for the same bearing design. While extending the cross-validation to additional geometries and operating conditions would broaden the framework’s applicability, the existing results already demonstrate that the proposed CEA methodology reliably predicts performance indicators for EFGBs within the studied design space.
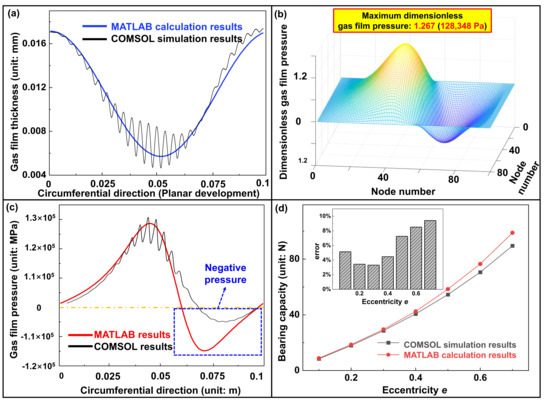
Figure 18.
Simulation and theoretical comparison of (a) gas film thickness, e = 0.7, c = 10 µm, (b) dimensionless gas film pressure obtained by substituting bearing parameters, (c) comparison of gas film pressure, e = 0.7, c = 10 µm, and (d) bearing capacity, respectively.
Collectively, the MATLAB-based beam element model exhibits exceptional accuracy and constitutes a robust computational framework for the design, analysis, and optimization of gas bearings in practical engineering applications.
5.5. Effect of Foil Material on Bearing Capacity
Following the analysis of the aforementioned structural parameters, this section will examine the materials that directly impact the bearing load and lubrication performance. Foil bearings provide the rotor with elastic support and friction damping, offering excellent capacity and vibration suppression even under extreme conditions. Consequently, foil materials must satisfy stringent requirements, including high strength, wear resistance, anti-galling properties, temperature adaptability, machinability, and resistance to corrosion and magnetization, the latter being critical for rotor stability. Commonly used materials include Inconel X-750 [36,37], Inconel 718 [38], Rene 41 [39], CrMo alloy steel [40], and beryllium copper [41]. Although the foil material does not directly contribute to gas film pressure generation, it indirectly determines maximum bearing capacity by maintaining the geometric integrity and dynamic stability of the film. The influence of different materials on bearing performance is illustrated in Figure 19.
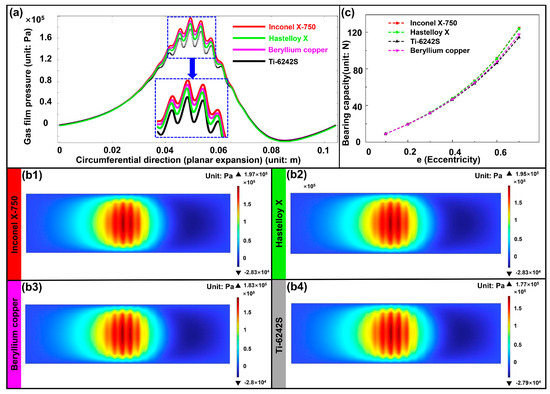
Figure 19.
The effects of different bearing materials on bearing performance: (a) comparison of gas film pressure for various materials, (b1–b4) cloud graph of gas film pressure for other materials, (c) variations in bearing capacity with eccentricity, respectively.
For tb = 0.1 mm, e = 0.7, and a clearance of 0.005 mm, the gas film pressure distribution is generally consistent across foil materials. However, differences exist in peak values and local fluctuation amplitudes (Figure 19a). Inconel X-750 and Hastelloy X exhibit slightly higher peak pressures compared to Ti-6242S and beryllium copper, suggesting that materials with higher stiffness and elastic recovery promote more stable gas film formation. Three-dimensional pressure contours reveal elliptical high-pressure zones in the loading direction for all materials, yet with varying peak intensities (Figure 19(b1–b4)). Capacity increases nonlinearly with eccentricity. While differences among materials are minor at low eccentricity (e = 0.1–0.3), they become pronounced at high eccentricity (e = 0.6–0.7) (Figure 19c). Inconel X-750 (124.44 MPa) and Hastelloy X (123.67 MPa) demonstrate the highest capacity, followed by beryllium copper (117.48 MPa), and Ti-6242S (114.37 MPa).
The results show that material properties are key to bearing capacity under high eccentricity conditions. Inconel X-750 offers a higher load-bearing advantage, while more flexible materials such as Ti-6242S and beryllium copper are better suited for low to medium loads and high compliance requirements. Based on heat-treatment behavior, processability, availability, and cost, this study selects Inconel X-750 as the foil material. Inconel X-750 offers high strength, good wear resistance, and excellent temperature adaptability, making it widely used in high-temperature turbomachinery applications. It should be noted that, despite the linear-elastic material law, the global response of the bearing remains strongly nonlinear due to large deflections, contact and friction between the foils and the sleeve, and the fluid–structure interaction with the gas film.
The material properties of the foil play a decisive role in the CEA of EFGB. Materials with higher stiffness favor a stiffness-dominated coupling mode with enhanced load capacity but reduced damping. In contrast, compliant or high-damping materials promote a flexibility-dominated response that suppresses vibration but sacrifices load capacity. Therefore, an appropriate selection of foil material-balancing stiffness, damping, and thermal conductivity-is essential to achieving optimal performance and stability in EFGB.
6. EFGB Static and Rotor Dynamics Experimental Validation
After analyzing the capacity and lubrication performance under the considered parameters, the test specimen was manufactured using machining, heat treatment, and coating processes. To validate the proposed design methodology and assess the practical feasibility of the EFGB, a prototype rotor-bearing system was fabricated based on the independently designed configuration in Table 2. This part presents experimental validation of whether the CEA-designed EFGBs can provide the required load capacity and acceptable operating performance. Static stiffness is assessed via axial load-unload force-displacement measurements, which are used to confirm that the prototype offers the predicted nonlinear stiffness behavior and adequate radial clearance. The test setup is illustrated in Figure 20a, and the high-speed test rig is shown in Figure 20b–d. The static load–displacement and stiffness–displacement curves showing the average results of six repeated tests under the same conditions are shown in Figure 21. The results from the high-speed bearing test rig are shown in Figure 22. In this study, the rotor dynamics test rig was operated at shaft speeds up to 15,000 rpm. This speed range is moderate compared with the ultra-high rotational speeds reported for some advanced foil-bearing applications, but it is still significantly higher than typical operating speeds of conventional hydrodynamic journal bearings and is sufficient to characterize the lift-off and torque behavior of the EFGB prototype designed in this study.
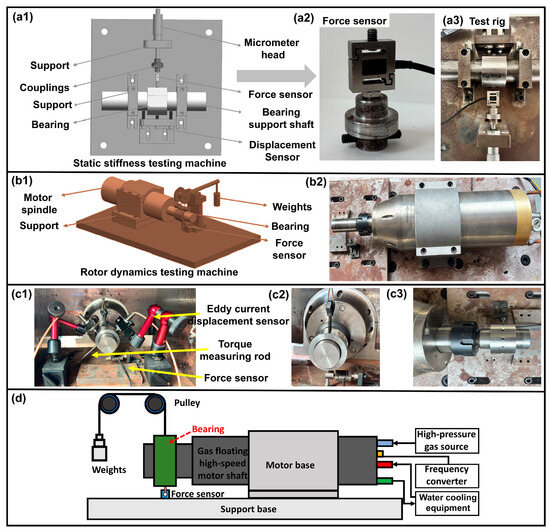
Figure 20.
Gas bearing testing machine: (a1–a3) static stiffness test apparatus, (b1,b2) rotor dynamics test setup, (c1–c3) eddy current sensor and bearing installation, and (d) bearing high-speed testing machine structure diagram, respectively.
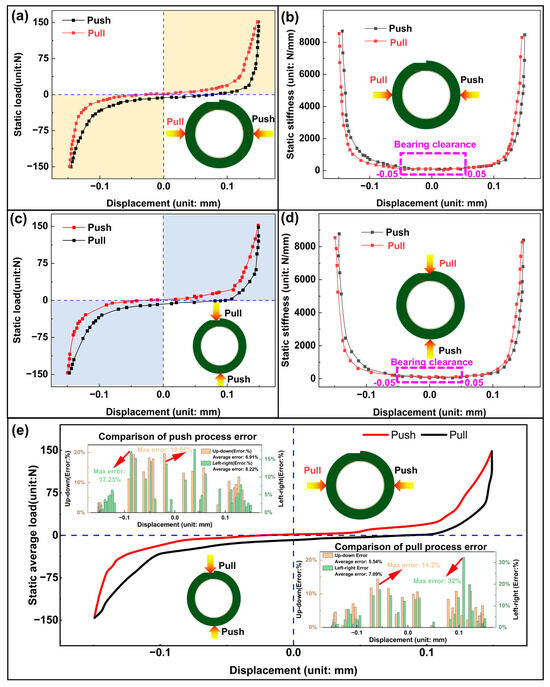
Figure 21.
(a,c) Bearing static load deformation curve, (b,d) load stiffness curve under left-right and up-down loading conditions, respectively, and (e) comparison of errors between static load–displacement curves and sample average values in the left-right and up-down directions.
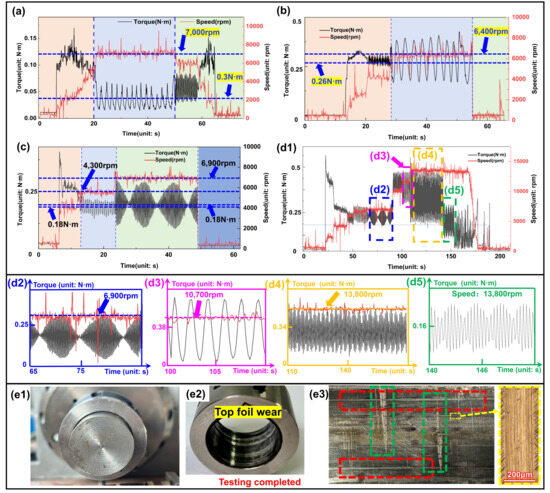
Figure 22.
High-speed bearing test results: (a) lift-off test results with a load of 30 N, (b) takeoff test results with a load of 20 N, (c) takeoff test results with a load of 10 N, (d1) test results of one cycle of acceleration and deceleration with a load of 10 N, (d2–d5) detailed enlargement of (d1), (e1) bearing under test, and (e2,e3) bearing wear, respectively.
As shown in Figure 21a–d, the experimental results indicate consistent stiffness in both horizontal and vertical directions, demonstrating excellent isotropy in radial capacity. Hysteresis loops observed in both orientations confirm substantial energy dissipation through friction and elastic deformation, with the enclosed area quantifying energy loss. The stiffness response exhibits three distinct nonlinear stages: (1) an initial low-stiffness region due to radial clearance, (2) a progressive increase as bump foils deform, and (3) a sharp rise exceeding 8000 N/mm under full compression. The consistency in hysteresis and stiffness across directions suggests uniform energy dissipation mechanisms, though minor variations may result from gravitational effects or assembly asymmetry. At small displacements, the structure shows high compliance and cushioning, primarily provided by the bump foil. Under large deformations, compression of foils leads to sharply increased stiffness, highlighting high capacity and structural stability. This combination of consistent damping and high ultimate stiffness offers effective vibration isolation under light loads and stability under extreme conditions or rotating machinery with multidirectional loading requirements. Figure 21e summarizes the static average load- displacement responses for the push and pull processes, and quantitatively compares the directional errors with respect to the sample-average curves. For each displacement step, the static loads measured in the left-right and up-down directions were averaged to obtain a sample-average load Faverage. The deviation of the load in a given direction from Fd was then normalized by Faverage and expressed as a percentage error. The upper inset (Comparison of push process error) shows that, for the push process, the up-down error has an average value of 6.91% with a maximum of 19.65%, whereas the left-right error has an average value of 8.22% with a maximum of 17.23%. The lower inset (Comparison of pull process error) indicates that, for the pull process, the average errors are 5.54% (up-down) and 7.09% (left-right). Most data points remain below about 20%, although a few local peaks appear, with maximum errors of 14.2% in the up-down direction. The largest error of 32% occurs in the pull process at a displacement where the load–displacement curve becomes very steep and the sample-average load is relatively small. In this region, even a modest absolute difference in load between repeated measurements (for example, due to slight stick–slip behavior at the foil-shaft interface, micro re-seating of the bump foils, or small alignment changes during loading) is magnified when normalized by the small average value, leading to a high percentage error. This peak, therefore, reflects a local amplification of system-level measurement jitter rather than a systematic directional bias. Overall, the average error levels (about 5–8%) demonstrate that the static load- displacement measurements are highly repeatable and that the bearing exhibits good isotropy between the left-right and up-down directions.
Figure 22a–c illustrates that the applied load exerts a significant influence on the lift-off characteristics of the EFGB. As the load decreases from 30 N to 10 N, the lift-off speed reduces from 7000 rpm to 6400 rpm, and then to 4300 rpm, while the corresponding lift-off torque decreases from 0.3 N·m to 0.26 N·m, and then to 0.18 N·m. This can be attributed to the fact that a larger load causes more severe pre-compression of the foils. This requires higher rotational speeds to generate sufficient aerodynamic pressure to overcome both the foil elastic force and the external load, enabling the journal to achieve complete levitation. Before lift-off, the increase in torque with speed is primarily attributed to dry friction between the journal and the foils. The sudden drop in torque at the lift-off point indicates the transition from solid friction to gas film shear. After lift-off, the torque stabilizes at a lower level, signifying the establishment of pure gas film lubrication.
In the results under a 10 N load shown in Figure 22c, the light-green region exhibits sinusoidal-like periodic torque fluctuations, reflecting the complex dynamic behavior of the EFGB system. This phenomenon arises from the strong coupling between the structural dynamic response of the elastic foils at high rotational speed and the gas film flow field. Under light load conditions, the gas film stiffness is relatively low, leading to pronounced sensitivity to external disturbances. The foils undergo periodic elastic deformation under the combined excitation of centrifugal force and unsteady aerodynamic forces, which directly modify the gas film clearance distribution and induce periodic fluctuations in shear stress. Furthermore, this speed range may be close to one of the system’s critical speeds, where the journal is prone to subsynchronous whirl or other forms of dynamic instability. The nonlinear characteristics of foil preload distribution and the periodic variation in capacity further intensify the torque oscillations. Such CEA vibrations are inherent to EFGB, with oscillation features closely related to foil modal parameters, gas film dynamics, and operating conditions, thereby providing crucial experimental evidence for dynamic design and vibration suppression strategies.
Based on the speed-up/slow-down test results in Figure 22(d1) (test time of 200 s), the torque response of the EFGB exhibits a pronounced hysteresis behavior, with a variation range of 0–0.5 N·m. The locally magnified results in Figure 22(d2–d5) reveal the mechanisms of lubrication-state transitions at different speed intervals. In the initial acceleration stage (Figure 22(d2)), the bearing transitions from static friction or boundary lubrication to mixed lubrication, where hydrodynamic lift generated by shaft rotation gradually strengthens, but a fully developed gas film has not yet been established, leading to relatively mild torque fluctuations. In the subsequent acceleration stage (Figure 22(d3)), the gas film capacity is significantly enhanced, and the foils undergo periodic elastic deformation under the combined action of aerodynamic pressure and centrifugal forces. This results in nearly sinusoidal torque oscillations, which mainly reflect the elastic responses of the foil but may also include synchronous components induced by rotor imbalance. As the speed approaches its peak (Figure 22(d4)), the bearing enters a dynamically unstable region. This stage is characterized by severe, irregular torque fluctuations, possibly accompanied by intermittent contact between the journal and foils. High-frequency foil vibrations, gas film turbulence, or subsynchronous whirl instabilities drive these fluctuations. During the deceleration stage (Figure 22(d5)), although aerodynamic effects weaken, the coupled inertia of gas film dynamics and the viscoelastic hysteresis of the foils cause the torque trajectory to deviate clearly from the acceleration phase. The foils gradually recover elastically, and a stable gas film is re-established. This speed-torque hysteresis essentially reflects the viscoelastic hysteresis of foil materials, the asymmetry in gas film formation and rupture, and the nonlinear dynamic behavior of EFGBs during acceleration–deceleration cycles, accompanied by inevitable energy dissipation. In addition, in elastic foil gas bearings, as the rotational speed increases, the gas film gradually becomes fully established and separates the rotor from the foils. The friction mechanism shifts from solid contact to gas viscous shear, resulting in a significant torque reduction at very high speeds, as shown in Figure 22(d4,d5). This generally indicates sufficient gas film support and low frictional losses, which are favorable signs of good performance. Under operational load, slight axis offset and visible elastic foil deformation occur (Figure 22(e1)), demonstrating the foil’s compliance and ability to accommodate rotor eccentricity while maintaining stable gas film support. Figure 22(e2,e3) shows wear patterns on the bearing and foil after approximately 100 start-stop cycles. Two distinct wear mechanisms are observed on the top foil: circumferential wear (red frame), caused by speed variation and surface friction during startup and shutdown before stable operation; and axial wear (green frame), resulting from axial bearing movement under varying loads or speeds.
The high-speed bearing tests are conducted with air cooling and under relatively moderate loads (10–30 N) and speeds (4300–7000 rpm). Under these conditions, the temperature increase in both the gas film and the foil structure is limited, and no evidence of thermal softening or significant clearance change is observed in the experiments. Therefore, the isothermal assumption mainly affects higher-order quantitative accuracy but does not alter the qualitative trends in load capacity, stiffness, and stability revealed by the present CEA results. Figure 22 shows that as the applied load decreases from 30 N to 20 N and 10 N, the lift-off speed reduces from 7000 rpm to 6400 rpm and 4300 rpm, and the corresponding torque drops from 0.30 N·m to 0.26 N·m and 0.18 N·m. This agrees with the CEA-based interpretation that larger external load leads to stronger pre-compression of the foils and thus requires higher rotational speed to generate sufficient aerodynamic pressure, whereas lighter load facilitates earlier lift-off and lower friction losses. The sinusoidal-like torque oscillations observed at 10 N load reflect the strong coupling between the elastic foils and the gas film in a low-stiffness regime, consistent with the friction-induced instability and flow-field asymmetry identified in the simulations. Overall, these tests confirm that the CEA-optimized EFGB can safely support loads up to 30 N, exceeding the 25 N design target, and operate with near-zero friction after lift-off, thereby validating the practicality of the proposed CEA-based design methodology.
In summary, lift-off tests under different load conditions further verified the rationality of the EFGB design. The results indicate that stable lift-off can still be achieved under a 30 N load, confirming sufficient capacity and appropriate stiffness design of the foil structure. By establishing the load-speed relationship, a performance prediction was obtained for the design load of 25 N: the expected lift-off speed is approximately 6700 rpm, with a lift-off torque of about 0.28 N·m. The 25 N load corresponds to about 83% of the 30 N maximum load, providing a reasonable safety margin that ensures capacity while preventing foil overloading, thereby contributing to an extended fatigue life of the bearing. Meanwhile, identifying possible periodic torque oscillations at high speeds provides a valuable reference for control system design and operational optimization in practical applications, underscoring the necessity of incorporating vibration suppression measures in the design. Moreover, these wear patterns highlight the significant impact of transient operational phases on foil degradation. Mitigating such wear requires specific design and operational strategies, such as optimizing start-stop rates, reducing transient impact forces, and enhancing interfacial friction properties between materials.
7. Conclusions
This study proposes and validates a CEA framework for the design and evaluation of high-speed EFGBs. The main findings are as follows:
- [1]
- The coupled macro-beam-Reynolds model, incorporating nonlinear elasticity, frictional contact, and realistic foil geometry, provides a computationally efficient yet accurate tool for predicting gas film pressure, foil deformation and load capacity.
- [2]
- Validation against a 3D FSI model in COMSOL, using penalty and augmented Lagrangian methods to model contact and coupling, demonstrated strong predictive capability. Deviations were below 8%, and benchmark errors were 3.56%, confirming the accuracy and efficiency of the proposed framework.
- [3]
- Parametric analyses revealed that increasing foil thickness from 0.1 mm to 0.2 mm raised the peak gas film pressure from 1.36 × 10⁵ Pa to 1.97 × 10⁵ Pa, reducing foil deflection and pressure fluctuations, thereby enhancing stability. Parametric analyses reveal how foil thickness, clearance, eccentricity and material jointly control the transition between flexibility-dominated and stiffness-dominated coupling modes, and quantify the resulting trade-off between capacity and dynamic stability.
- [4]
- Prototype experiments with an EFGB designed using the proposed CEA framework (0.05 mm clearance, Inconel X-750 foils) validated that the bearing meets the required load-carrying capacity and operating performance. Static stiffness and rotor tests demonstrated stable lift-off at 4300–7000 rpm under 10–30 N loads, with torques ranging from 0.18 to 0.30 N·m, surpassing the 25 N design target and confirming near-zero friction in the fully lubricated regime.
In this study, although the experiments are performed in a moderate-speed regime, the unified theory–simulation–experiment framework is formulated in a general manner and provides comprehensive guidance for the holistic analysis and design of high-speed gas bearings. By integrating detailed modeling, parametric CEA simulations and prototype testing within a single study, this work offers a more complete picture of EFGB behavior than is usually available from purely theoretical or purely experimental investigations. This study focuses on the lubrication performance, with key findings related to the bearing load capacity and stability. The numerical results show that the bearing performs effectively in maintaining a stable gas film, which supports the rotor without direct contact under typical operating conditions. Friction effects are considered only in the context of contact between the top foil and bump foil, which influences the bearing’s overall stability. Other phenomena, such as friction-induced instability or dynamic instability, are not modeled in the current study and, therefore, are not part of the conclusions. The results and conclusions presented are consistent with the scope of the study, and no speculative extrapolations are made beyond the model’s assumptions. The main technical approach of this study is summarized in Figure 23.
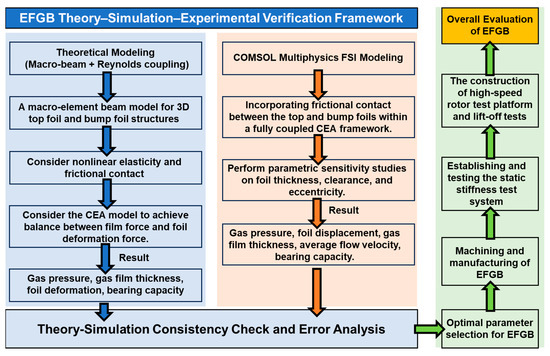
Figure 23.
Summary of the main technical approaches in this study.
Future work will extend the present elasto-aerodynamic framework to a TEHD model. In this extension, the Reynolds equation for the gas film will be coupled with an energy equation and transient heat conduction equations in the journal and foils. The gas viscosity and density will be treated as temperature-dependent, and thermal expansion as well as temperature-dependent elastic–plastic properties of the foil material, will be incorporated into the structural model. This TEHD formulation will enable the prediction of clearance changes, thermal stresses, and temperature fields under high-temperature, high-speed operating conditions, thereby further improving the reliability of EFGB design for advanced aerospace and energy systems. Although the present validation focuses on representative bearing geometries together with prototype experiments, further cross-validation using additional independent datasets and different EFGB geometries will be valuable to fully explore the applicability limits of the framework and will be pursued in future work. Overall, the proposed CEA methodology, validated through both simulation and experiment, provides quantitative design guidance for achieving high capacity and stable operation in advanced gas bearing applications.
Author Contributions
Conceptualization, Q.L. and H.L.; Methodology, Q.L.; Software, Q.L.; Validation, J.N.; Formal analysis, J.N. and M.Y.; Investigation, J.N. and M.Y.; Data curation, Q.L., J.N., H.L. and M.Y.; Writing—original draft, Q.L.; Writing—review & editing, Q.L., J.N., H.L. and M.Y.; Visualization, J.N. and M.Y.; Supervision, H.L.; Funding acquisition, Q.L. and H.L. All authors have read and agreed to the published version of the manuscript.
Funding
This work was financially supported by the Shanghai Alliance Program (Grant No. LM201805), the Natural Science Foundation of Tianjin (No. 23JCQNJC01990), and the Independent Innovation Fund of Tianjin University (No. 2024XQM-0013).
Data Availability Statement
Data will be made available on request.
Conflicts of Interest
The authors declare no conflict of interest.
Correction Statement
This article has been republished with a minor correction to the title. This change does not affect the scientific content of the article.
Appendix A. Plane Beam Unit Model and Modeling of Foil Beams
Appendix A.1. Planar Beam Unit Model
The force and displacement of the planar beam unit under the unit coordinate system are shown schematically in Figure A1a. i and j are the two end nodes of the beam unit. The two end pi(e) nodes are subjected to axial force, shear force, and bending moment, which are expressed as pi(e), qi(e), mi(e), and pj(e), qj(e), mj(e). The displacements and angles generated at the two end nodes are denoted as ui(e), vi(e), si(e), and uj(e), vj(e), sj(e). The relationship between the unit force f (e) and the unit displacement δ(e) of the beam unit is expressed as:
The expression for the beam cell stiffness matrix [k]e is obtained by integrating operations organized according to the principle of minimum potential energy as:
Then the nodal force versus displacement relation equations for nodes i and j are:

Figure A1.
(a) Beam unit and nodes force and displacement of a plane beam unit, (b) single-section corrugated foil beam model, and (c) force and displacement of nodes between multiple corrugations.
Figure A1.
(a) Beam unit and nodes force and displacement of a plane beam unit, (b) single-section corrugated foil beam model, and (c) force and displacement of nodes between multiple corrugations.

Appendix A.2. Foil Beam Model Modeling
The interconnected corrugations of the bump foil experience varying levels of friction, which in turn affect each corrugation’s stiffness and lead to a nonlinear stiffness behavior of the bump foil [42,43]. Conventional full-bump foil modeling via elastic beam formulations is complex, lacks predictive fidelity and hinders solution convergence [44,45]. Conversely, isolating individual corrugations as discrete macro-elements enables simplified stiffness characterization through a nonlinear analysis with a linear-elastic constitutive law at the element level. In the proposed planar beam modeling methodology, each corrugation is abstracted as an independent macro-element whose stiffness matrix is derived by assuming an isotropic linear-elastic material, while allowing for large deflections and changes in contact state. These macro-element stiffness matrices are then assembled to reconstruct the global stiffness tensor of the bump foil. In this way, the strongly nonlinear continuum problem arising from multiple interacting corrugations, contact and friction is reformulated as an assembly of linear-elastic subsystems solved by nonlinear iterative procedures.
A single corrugation of the bump foil is illustrated in Figure A1b, where I is the leading edge of the corrugation, m is the support point, and N is the trailing edge of the corrugation. In the beam model analysis for a single corrugation, the I end is considered as the fixed end, and the support point m experiences loads Qm and Pm, along with displacements Um and Vm. At the N end, internal forces fx, fy, and mN exist, along with displacements UN and VN. The relationship between the loads Qm, Pm, and displacements Um, Vm at the support point m represents the stiffness of the individual corrugation. In contrast, the tangential displacement UN at the N end serves as the displacement boundary condition for the next corrugation macro-element model. Consequently, the beam formulation for individual corrugations is formulated to characterize the functional dependence between displacement components (Um, Vm, UN) and applied loads (Qm, Pm) with internal axial forces (fx). A single corrugated macro cell has three independent state variables (Pm, Qm, fx), and the other quantities are calculated from the internal force balance of the cell and the constraints at each node based on these three variables. For the calculation of a multi-unit beam model consisting of m-1 units (m nodes, m > 2) of interconnected beam structures, a rigorous definition of interfacial force-displacement relationships between the nodes of each beam is essential.
The relationship between nodal force and displacement for the first node is given by:
the relationship between nodal force and displacement for the nth middle node (1 < n < m) is given by:
the relationship between nodal force and displacement for the last node (m node) is given by:
that is, the relationship between nodal force and displacement at each node can be written as follows:
The individual corrugation beam element models are assembled to form the overall beam element model of the bump foil. The n corrugations (n > 1) are arranged in a two-dimensional manner, tiled along the circumferential direction on a flat plate. The nodes I represent the starting nodes of each corrugation, while the nodes N represent the endpoints of the protruding sections of each corrugation. The nodes at the N end of the previous corrugation and the I end of the subsequent corrugation are considered rigidly connected. The force conditions at the nodes between the individual corrugations are exhibited in Figure A1c.
Then, the nodal force relationship of the connected nodes is given in the following equation:
the nodes between the connected corrugations are subjected to the friction force versus support force relationship as in the following equation:
and the initial tangential displacement of the kth corrugation I end node is given as:
Appendix A.3. Top Foil Beam Model Force Analysis
The top foil’s smooth surface is unfolded in the circumferential direction (Figure A1c). Point m is the contact point between the top foil and the bump foil. Several beam units are discretized between the two connected contact points. The top foil beam unit is subjected to the gas film force’s distributed load g. At point m, it is subjected to the concentrated load of the bump foil support force and the friction force. There are interacting internal forces between the beam units’ nodes. Under the resultant action of these coupled loads, beam elements undergo flexural deformation.
The analysis of forces and displacements defines the boundary conditions for the top foil beam element. The rotational angles and displacements of the fixed-end constrained nodes are specified. The normal displacement of the nodes at the bump foil contact points is constrained to match the normal displacement of the corresponding top foil nodes after displacement. The distributed gas film forces acting on the beam elements are converted into concentrated forces at each node, followed by coordinate transformation. Force equilibrium at the nodes where two beam elements are connected balances the internal and external forces at all nodes. The finite element method (FEM) is then applied to solve the top foil beam model, yielding the displacement at each node. The force analysis of the top foil beam unit is schematically revealed in Figure A2.

Figure A2.
(a) Beam unit force analysis of the force and displacement of the top foil beam unit, and (b) top foil beam unit structure diagram.
Figure A2.
(a) Beam unit force analysis of the force and displacement of the top foil beam unit, and (b) top foil beam unit structure diagram.

Appendix B. Difference Solution Process of Reynolds Equation
For the dimensionless Reynolds equation derived above, make a difference between the two sides and define a new functional equation:
Based on the Newton-Raphson iterative formula:
Then the iterative formula for the pressure equation is [31,46,47]:
Expanding the function into a Taylor series gives the following equation:
a first-order derivation of β and letting β = 0 yields the following equation:
To enhance calculation tractability, let:
Expanding the above equation yields the following iterative equation:
Using the center difference method, the difference form of each order is defined as:
The collation yields:
Appendix C. COMSOL Multiphysics Contact Model
Appendix C.1. Contact Model
In this study, the shaft and top foil are assumed to remain in non-contact during steady-state operation, with the gas film providing sufficient support to the rotor. Contact friction between the shaft and top foil is not considered, as this is outside the scope of the steady-state lubrication analysis based on the Reynolds equation. The potential for contact between the shaft and top foil is considered only when the load or eccentricity exceeds a critical threshold, causing the gas film to rupture. Under such extreme conditions, friction could occur, but this effect is not reflected in the presented numerical results, which focus on stable gas film lubrication. Friction is only accounted for in the context of contact between the top foil and bump foil, which influences the bearing’s load capacity and stability. The foil contact phenomenon significantly influences the stiffness and damping of EFGB, so an accurate contact model is essential. COMSOL Multiphysics can be used to simulate and analyze complex contact behavior. In this study, the software was used to analyze the deformation characteristics of EFGBs under various load distributions. COMSOL Multiphysics uses the Lagrange formulation in solid mechanics for deformation analysis. The original position of a material point is denoted as U, and its new position as u. The deformation gradient can then be expressed as [48]:
where
According to the polar decomposition theorem, D can be written as:
where
The three eigenvalues of N are λ1, λ2, and λ3, and their corresponding eigenvectors are the three orthogonal directions of the material coordinate system. The elongation can be defined as the ratio of the current length to the original length:
To obtain the zero-basis deformation of the top foil, we subtract the equivalent tensor I from C to obtain the Green-Lagrange strain tensor S, which is defined as follows:
Boundary conditions are defined in solid mechanics. The bearing housing is defined as a rigid body, and one end of the corrugated foil and the top foil is fixed to the housing. The contact model uses the static Coulomb friction law. In the Coulomb friction law, static friction and sliding friction have the same magnitude. The friction force fν is:
This model uses a penalty function method to establish bearing contact. A “spring” element is added between the contact surfaces to achieve faster and more stable convergence. The global parameter κ is set so that its slope gradually changes from 0 to 1 during the steady-state auxiliary sweep study. The spring stiffness ks is:
Inconel X-750 is chosen for the foils due to its superior mechanical properties [49,50]. The sleeve is rigid, while the bump and top foils are modeled as elastoplastic materials obeying Hooke’s law. Fixed constraints are applied at one end of the foils and sleeve, leaving the opposite ends free. Contact interactions between the top foil and bump foils, and between bump foils and sleeves, are simulated using a penalty method with Coulomb friction (m = 0.1 [48]), significantly influencing film thickness.
The journal and sleeve are rigid. Two contact gaps are defined: (1) sleeve inner surface and bump foil bottom, (2) bump foil top and top foil bottom. The source boundary is the sleeve inner surface for the first contact gap, and the top foil bottom surface for the second. Boundary separation is permitted. COMSOL provides two contact algorithms: the penalty method (stable, less accurate) and the augmented Lagrange method (accurate, more costly). A 26-bump foil structure is analyzed, simplified via circumferential unfolding into a planar geometry. Boundary conditions reflect actual operation: the sleeve is fixed, the left ends of the foils are constrained, and all other components are free.
Appendix C.2. CEA Model
The aeroelastic coupling transforms a “passive” rigid gas bearing into an “adaptive” component. Through the interaction between the gas film and the elastic structure, a dynamic equilibrium is ultimately achieved, enabling the foil bearing to exhibit excellent performance under extreme conditions such as high speed and high temperature. In COMSOL, aeroelastic coupling is essentially realized by constructing a bidirectional FSI model. The process is illustrated in Figure A3.

Figure A3.
Implementation of CEA in COMSOL.
Figure A3.
Implementation of CEA in COMSOL.

References
- Xu, Z.; Li, C.; Du, J. Creep behavior analysis of gas foil bearings at elevated temperature. Int. J. Mech. Sci. 2025, 302, 110593. [Google Scholar] [CrossRef]
- Kim, J.; Lee, Y.D.; Ha, Y.; Lee, Y.B. Accelerated lifetime test considering with optimal surface roughness for gas foil bearings. Mech. Syst. Sig. Process. 2025, 235, 112892. [Google Scholar] [CrossRef]
- Ying, M.; Liu, X. Unbalance Response of a hydrogen fuel cell vehicle air compressor rotor supported by gas foil bearings: Experimental study and analysis. Lubricants 2025, 13, 181. [Google Scholar] [CrossRef]
- Hu, B.; Hou, A.P.; Deng, R.; Yang, X.D.; Wu, Z.Y.; Ni, Q.F.; Li, Z. Optimal design of boundary angle for gas foil thrust bearing thermal performance. Lubricants 2024, 12, 143. [Google Scholar] [CrossRef]
- Zhao, X.; Li, C.; Du, J.; Lu, Y. A nonlinear model for dynamic performance analysis of gas foil bearing-rotor system considering frictional contacts. Nonlinear Dyn. 2024, 112, 5975–5996. [Google Scholar] [CrossRef]
- Samanta, P.; Murmu, N.C.; Khonsari, M.M. The evolution of foil bearing technology. Tribol. Int. 2019, 135, 305–323. [Google Scholar] [CrossRef]
- Shi, T.; Wang, H.; Yang, W.; Peng, X. Mathematical modeling and optimization of gas foil bearings-rotor system in hydrogen fuel cell vehicles. Energy 2024, 290, 130129. [Google Scholar] [CrossRef]
- Wang, Y.P.; Lu, K.T.; Dong, R.Q.; Fan, Y.Q. Review of rolling bearings performance degradation trend prediction. Noise Vib. Worldw. 2024, 55, 585–604. [Google Scholar] [CrossRef]
- Guan, H.; Li, J.; Wei, K.; Zou, H. Rotordynamics of a rotor radially and axially supported by active bump-type foil bearings and bump-type thrust foil bearings. Mech. Syst. Sig. Process. 2024, 208, 110995. [Google Scholar] [CrossRef]
- Chu, J.; Wu, S.; Wang, J.; Wang, Y.D.; Wang, S.T.; Xu, F.C. Analysis of gas foil thrust bearing considering manufacturing errors: Modeling and experiments. Mech. Syst. Sig. Process. 2025, 232, 112698. [Google Scholar] [CrossRef]
- Sarrazin, M.; Liebich, R. Experimental and theoretical analysis of the stability behaviour of a rigid rotor supported by conical gas foil bearings. Tribol. Int. 2025, 204, 110467. [Google Scholar] [CrossRef]
- Xu, F.C.; Zhang, H.; Li, X.L.; Luan, W.L.; Wang, H.M.; Wang, Y.D.; Xie, Z.L. Vibration characteristic of hybrid gas foil bearing-rotor system in space microgravity. Mech. Syst. Sig. Process. 2025, 225, 112311. [Google Scholar] [CrossRef]
- Jiang, Y.; Zhu, Q.; Xu, B.; Huang, Z.; Gao, D. The Influences of Parameters on the Dynamic Characteristics of a Multi-Foil Aerodynamic Journal Bearing with Bump-Backing Foils: Model Predictions. Lubricants 2024, 12, 386. [Google Scholar] [CrossRef]
- Jin, C.; Li, C.; Du, J. A Review on the Dynamic Performance Studies of Gas Foil Bearings. Lubricants 2024, 12, 262. [Google Scholar] [CrossRef]
- Heshmat, H.; Walowit, J.A.; Pinkus, O. Analysis of Gas-Lubricated Foil Journal Bearings. J. Lubr. Technol. 1983, 105, 647–655. [Google Scholar] [CrossRef]
- Le, L.S.; Arghir, M.; Frene, J. A new bump-type foil bearing structure analytical model. J. Eng. Gas Turbines Power 2007, 129, 1047–1057. [Google Scholar] [CrossRef]
- Gad, A.M.; Kaneko, S. A new structural stiffness model for bump-type foil bearings: Application to generation II gas lubricated foil thrust bearing. J. Tribol. 2014, 136, 041701. [Google Scholar] [CrossRef]
- Hassan, M.F.; Bonello, P. A new modal-based approach for modelling the bump foil structure in the simultaneous solution of foil-gas bearing rotor dynamic problems. J. Sound Vib. 2017, 396, 255–273. [Google Scholar] [CrossRef]
- Arghir, M.; Benchekroun, O. A simplified structural model of bump-type foil bearings based on contact mechanics including gaps and friction. Tribol. Int. 2019, 134, 129–144. [Google Scholar] [CrossRef]
- Heinemann, S.T.; Jensen, J.W.; Sebastian, O.V.; Santos, I.F. Numerical modelling of compliant foil structure in gas foil bearings: Comparison of four top foil models with and without radial injection. J. Sound Vib. 2023, 547, 117513. [Google Scholar] [CrossRef]
- Andres, S.L.; Kim, T.H.; Ryu, K. Identification of structural Stiffness and energy dissipation parameters in a second-generation foil bearing: Effect of shaft temperature. J. Eng. Gas Turbines Power 2011, 133, 032501. [Google Scholar] [CrossRef]
- Kim, K.S.; Lee, I. Vibration characteristics of a 75kW turbo machine with gas foil bearings. J. Eng. Gas Turbines Power 2007, 129, 843–849. [Google Scholar] [CrossRef]
- Feng, K.; Zhang, J.; Wang, F.Y. Influence of radial clearance and processing technology on structural properties of gas foil bearing. J. Aerosp. Power 2016, 31, 2773–2780. (In Chinese) [Google Scholar] [CrossRef]
- Bonello, P.; Hassan, M. An experimental and theoretical analysis of a foil-gas bearing rotor system. J. Sound Vib. 2018, 413, 395–420. [Google Scholar] [CrossRef]
- Peng, Z.C.; Khonsari, M.M. Hydrodynamic analysis of compliant foil bearings with compressible gas flow. J. Tribol. 2004, 126, 542–546. [Google Scholar] [CrossRef]
- Shalash, K.; Schiffmann, J. On the manufacturing of compliant foil bearings. J. Manuf. Process. 2017, 25, 357–368. [Google Scholar] [CrossRef]
- Agrawal, G.L. Foil Gas/Gas Bearing Technology-An Overview. In Proceedings of the ASME 1997 International Gas Turbine and Aeroengine Congress and Exhibition, Orlando, FL, USA, 2–5 June 1997; Volume 1. [Google Scholar] [CrossRef]
- Li, S.M.; Xu, H.J.; Shao, C.P.; An, Q. Study of Rotor Dynamics of Micro Gas Turbine Supported by Gas Foil Bearings. Tribol. Trans. 2025, 68, 347–363. [Google Scholar] [CrossRef]
- Gu, Y.P.; Lan, X.D.; Ren, G.X.; Zhou, M. An efficient 3D foil structure model for bump-type gas foil bearings considering friction. Friction 2020, 9, 1450–1463. [Google Scholar] [CrossRef]
- Gan, J.Y.; Liao, Q.; Li, L.J.; Hu, Y.M.; Gan, L. Numerical Simulation of 3D Heat Flow Coupling Model of Aerodynamic Foil Bearing. J. Mech. Eng. 2025, 61, 330–337. (In Chinese) [Google Scholar] [CrossRef]
- Pattnayak, M.R.; Pandey, R.K.; Dutt, J.K. Performance behaviours of a self-acting gas journal bearing with a new bore design. Tribol. Int. 2020, 151, 106418. [Google Scholar] [CrossRef]
- Zhao, Q.; Qiang, M.C.; Hou, Y.; Chen, S.T.; Lai, T.W. Analysis of the Frictional Mechanical Behavior of Bump Foil Bearing. J. Mech. Eng. 2025, 61, 243–252. (In Chinese) [Google Scholar] [CrossRef]
- Shahdhaar, M.A.; Yadawad, S.S.; Khamari, D.S.; Behera, K.S. Numerical investigation of slip flow phenomenon on performance characteristics of gas foil journal bearing. SN Appl. Sci. 2020, 2, 1677. [Google Scholar] [CrossRef]
- Badawi, M.B.; Crosby, W.A.; Fahham, E.I.-I.M.; Alkomy, M.H. Performance analysis of tilting pad journal bearing using COMSOL Multiphysics and Neural Networks. Alex. Eng. J. 2020, 59, 865–881. [Google Scholar] [CrossRef]
- Ren, G.J. Hypo-elastohydrodynamic lubrication of journal bearings with deformable surface. Tribol. Int. 2022, 175, 107787. [Google Scholar] [CrossRef]
- Changizian, P.; Yao, Z.; Long, F.; Topping, M.; Xu, S.X.; Daymond, M.R.; Griffiths, M. Mechanical behavior of cold-worked, precipitation-hardened Inconel X-750 before and after helium-implantation. Mater. Charact. 2023, 199, 112810. [Google Scholar] [CrossRef]
- Liu, J.L.; Liao, R.D.; Liao, B.; Luo, J.; Bao, K. Mechanical and Tribological Properties of CrN Coated Inconel X750. J. Wuhan Univ. Technol. 2019, 34, 804–810. [Google Scholar] [CrossRef]
- Jafarian, F.; Ciaran, I.M.; Umbrello, D.; Arrazola, P.J.; Filice, L.; Amirabadi, H. Finite element simulation of machining Inconel 718 alloy including microstructure changes. Int. J. Mech. Sci. 2014, 88, 110–121. [Google Scholar] [CrossRef]
- Zhang, X.; Han, H.; Tang, P.; Zhou, Y.; Xiao, D.; Fu, J.; Chen, J.; Feng, S.; Zhang, J. Effects of Aging Treatment on the Microstructure and Mechanical Properties of Rene 41 Alloy and the Strengthening Mechanisms. Materials 2025, 18, 1579. [Google Scholar] [CrossRef]
- Cheng, L.; Chen, Z.Y.; Zhang, X.H.; Duan, X.G.; Yu, W. Interface Stress Evolution of High-Strength Titanium-Steel Composite Pipe during Hot Extrusion. J. Mater. Eng. Perform. 2025, 34, 15907–15916. [Google Scholar] [CrossRef]
- Baragetti, S.; Terranova, A.; Vimercati, M. Friction behavior evaluation in beryllium-copper threaded connections. Int. J. Mech. Sci. 2009, 11–12, 790–796. [Google Scholar] [CrossRef]
- Dellacorte, C.; Radil, K.C.; Bruckner, R.J.; Bruckner, R.J.; Howard, S.A. Design, fabrication, and performance of open source generation I and II compliant hydrodynamic gas foil bearings. Tribol. Trans. 2008, 51, 254–264. [Google Scholar] [CrossRef]
- Feng, K.; Kaneko, S. Analytical model of bump-type foil bearings using a link-spring structure and a finite-element shell model. J. Tribol. 2010, 132, 021706. [Google Scholar] [CrossRef]
- He, W.; Feng, M.; Ren, T. A numerical algorithm for gas foil bearing simulation with considering 3D structure. Mech. Syst. Sig. Process. 2024, 212, 111315. [Google Scholar] [CrossRef]
- Swanson, E.E. Bump foil damping using a simplified model. J. Tribol. 2006, 128, 542–550. [Google Scholar] [CrossRef]
- Xu, Z.; Li, C.; Du, J.; Li, J.; Wang, Y. Load-carrying characteristics of bump-type gas foil thrust bearings. Int. J. Mech. Sci. 2023, 244, 108080. [Google Scholar] [CrossRef]
- Bukovnik, S.; Offner, G.; Čaika, V.; Priebsch, H.H.; Bartz, W.J. Thermo-elasto hydrodynamic lubrication model for journal bearing including shear rate dependent viscosity. Lubr. Sci. 2007, 19, 231–245. [Google Scholar] [CrossRef]
- Ding, P.J.; Hu, Y.; Wang, X.J.; Meng, Y.G. Effects of Structure Parameters on Static Performance of Gas Foil Bearings Based on a New Fully Coupled Elastic-Aerodynamic Model. Lubricants 2024, 12, 348. [Google Scholar] [CrossRef]
- Rustamov, I.A.; Cheng, Y.; Kaniev, D.; Wang, B.; Xiang, L.; Sabirova, O.; Wang, Y.M.; Wang, Z.X. Triple heat treatment effects of Inconel X-750 superalloy on its microstructure, hardness, and high-temperature fretting wear characteristics. Wear 2023, 534, 205128. [Google Scholar] [CrossRef]
- Rustamov, I.A.; Sabirova, O.S.; Wang, Z.; Wang, Y. Fretting wear behavior and damage mechanisms of Inconel X-750 alloy in dry contacts. Adv. Mater. Sci. Eng. 2019, 1, 7079819. [Google Scholar] [CrossRef]


Disclaimer/Publisher’s Note: The statements, opinions and data contained in all publications are solely those of the individual author(s) and contributor(s) and not of MDPI and/or the editor(s). MDPI and/or the editor(s) disclaim responsibility for any injury to people or property resulting from any ideas, methods, instructions or products referred to in the content. |
© 2025 by the authors. Licensee MDPI, Basel, Switzerland. This article is an open access article distributed under the terms and conditions of the Creative Commons Attribution (CC BY) license (https://creativecommons.org/licenses/by/4.0/).