Article

Laser Surface Texturing for Ground Surface: Frictional Effect of Plateau Roughness and Surface Textures under Oil Lubrication

1
Institute for Applied Materials—Reliability and Microstructure (IAM-ZM), Karlsruhe Institute of Technology (KIT), 76131 Karlsruhe, Germany
2
Key Laboratory of High Efficiency and Clean Mechanical Manufacture of MOE, School of Mechanical Engineering, Shandong University, Jinan 250061, China
*
Authors to whom correspondence should be addressed.
Lubricants 2024, 12(1), 22; https://doi.org/10.3390/lubricants12010022
Submission received: 20 November 2023 / Revised: 3 January 2024 / Accepted: 7 January 2024 / Published: 11 January 2024
(This article belongs to the Special Issue Tribology of Textured Surfaces)

Abstract

:
Laser surface texturing has proven beneficial in improving tribological performance in different lubrication regimes. However, the interaction between plateau roughness and surface texture remains to be further investigated, even though rough surfaces are common in engineering applications. In the present study, we investigated the frictional influence of surface texturing of ground surfaces under different lubrication conditions. Channel textures with different depths and area ratios were fabricated on ground surfaces, and their friction was tested in reciprocating tests. The experimental findings indicate that the textures caused increased friction for ground surfaces under boundary or mixed lubrication when the interface is well lubricated. Nevertheless, when the oil supply was limited, an up to 40% friction reduction was observed under test conditions.

Graphical Abstract

1. Introduction

Energy saving has become an increasingly important issue due to the high demand for energy and environmental concerns. In many industrial applications, friction is a major contributor to energy waste, leading to high levels of energy consumption and carbon emissions [1]. Therefore, reducing friction can considerably contribute to energy conservation efforts.
Laser surface texturing has been proven effective in reducing friction in different applications [2,3,4]. Theoretical and experimental approaches have been applied to investigate the influences of texture [5,6,7]. It is believed that the main effect of textures is the generation of hydrodynamic lift under full-film or mixed lubrication, while, under boundary or near-boundary mixed lubrication, edge stresses may cause the main negative effects, and the balance between edge stress and hydrodynamic/static pressure should be considered [4]. Studies have been conducted to optimize parameters including texture shape, depth, and area density; however, the interaction between texture and plateau roughness has been investigated to a lesser extent. In most studies, polished surfaces are used, which are mostly assumed to be perfectly smooth in simulation, although rough surfaces are more commonly used in engineering applications.
The surface roughness can dramatically influence the frictional behavior of a surface. Flow factors [8,9] and homogenization [10,11,12] are widely used to analyze the influence of roughness on frictional behavior. When textures are introduced to the rough surface, the interaction between surface roughness and texture may lead to different behavior as the effect of the roughness pattern may be changed. Surface texture and plateau roughness may act as multi-scale textures and have shown potential in improving tribological behavior [13,14].
However, some contradictory results have also been reported in the literature. Brunetiere et al. [15] presented a numerical study on rough-textured surfaces using Reynold’s equation coupled with a mass-conservative cavitation algorithm. Interestingly, they found the interaction of roughness and texture to be more crucial than the texture alone in generating hydrodynamic lift. The effectiveness of texture is highly dependent on the roughness, and, if the initial friction performance of a rough surface is sufficient, the texture may offer little improvement. If the surface is smooth, texture alone cannot produce significant hydrodynamic pressure. Gu et al. [16] conducted a numerical study on a rough-textured ring–liner conjunction and found that the tribological performance improvement realized by surface texturing can also be achieved or hindered by the effects of skewness and kurtosis. Studies by Podgornik and Sedlacek et al. [17,18,19] on rough surfaces showed that the beneficial effects of textures can be affected by skewness and kurtosis parameters. Meylan et al. [20] tested different textures on rough surfaces and found that most of the textures had similar or worse tribological properties than those of the untextured references. This suggests that the frictional behavior of textured rough surfaces remains to be investigated and that their friction mechanisms are poorly understood. This is where our research comes in.
This study focuses on the frictional effects of textures on rough ground surfaces. To this end, grinding traces were fabricated perpendicular to the sliding orientation to maximize their hydroeffect, and channel textures parallel to the grinding traces were chosen to ensure that the texture and grinding traces had a similar shape, minimizing the shape effect. The influences of texture depth and area density were investigated under immerged and limited-lubrication conditions.

2. Materials and Methods

2.1. Sample Preparation

Tribological tests were performed in reciprocating motion with carbon-steel (AISI 1045, Eisen Schmidt, Karlsruhe, Germany) pins on a chromium-steel (AISI 5140, ArcelorMittal Warszawa, Poland) disk. The 8 mm diameter pins were hardened and tempered to a hardness of about HRC 40; then, they were ground to a final roughness ( R q ) of around 0.3 μ m using a cup grinding machine (C&N MPS 2 R300, Erlangen, Germany). The disks were hardened and tempered to a hardness of about HRC 45. The disk surfaces were ground to a base roughness of R q = 0.3 µm with grinding traces quasiperpendicular to the sliding direction. The surface roughness was checked by a tactile roughness measurement device (Hommel T8000, Jenoptic, Jena, Germany). After grinding, laser surface texturing (LST) was conducted to fabricate microchannel patterns on the surfaces using a Piranha II system from Acsys (Kornwestheim, Germany) with a 1064 nm wavelength. The plateau roughness, texture depth, and texture area density were chosen as variables in the test. By adjusting the laser power and channel spacing, the surface textures were designed to vary in depth (1–7 µm) and area density (7.5–30%). The surfaces were named according to the surface textures as US (untextured surface), TS (textured surface), TS-MD (textured surface with medium depth), TS-HD (textured surface with high depth), TS-LA (textured surface with low area ratio) and TS-HA (textured surface with high area ratio), as shown in Table 1. The lasering parameters were as follows: laser pulse length of 10 ns, average power of 2.8–3.6 W, frequency of 290 kHz, and scanning speed of 2 mm/s. Four scans were conducted with 5 µm spacing to form a single texture channel. The texture channel width was set to a constant value of ~30 µm. As the base grinding traces needed to be kept, a short laser pulse of 10 ns was chosen to minimize bulges and burrs. After texturing, the surfaces were cleaned using rubber to remove the debris, then ultrasonically cleaned in isopropanol for 5 min each. The samples were examined by optical, digital, and 3D microscopy using a light microscope (Keyence VHX 600D, Osaka, Japan) and a white-light profilometer (Sensofar Plu neox, Sensofar, Barcelona, Spain), with images recorded before and after processing and tribological testing. The surface roughness parameters of arithmetic average height ( S a ) and root-mean-square height ( S q ), as well as a parameter set developed in our previous report [21] (including the plateau root-mean-square height ( S p q ), the reformed surface-bearing index ( S b i * ), the reformed core fluid retention index ( S c i * ) and the reformed valley fluid retention index S v i * ), were used to characterize the roughness of the surfaces. The algorithms of the parameter set are presented in Appendix A.

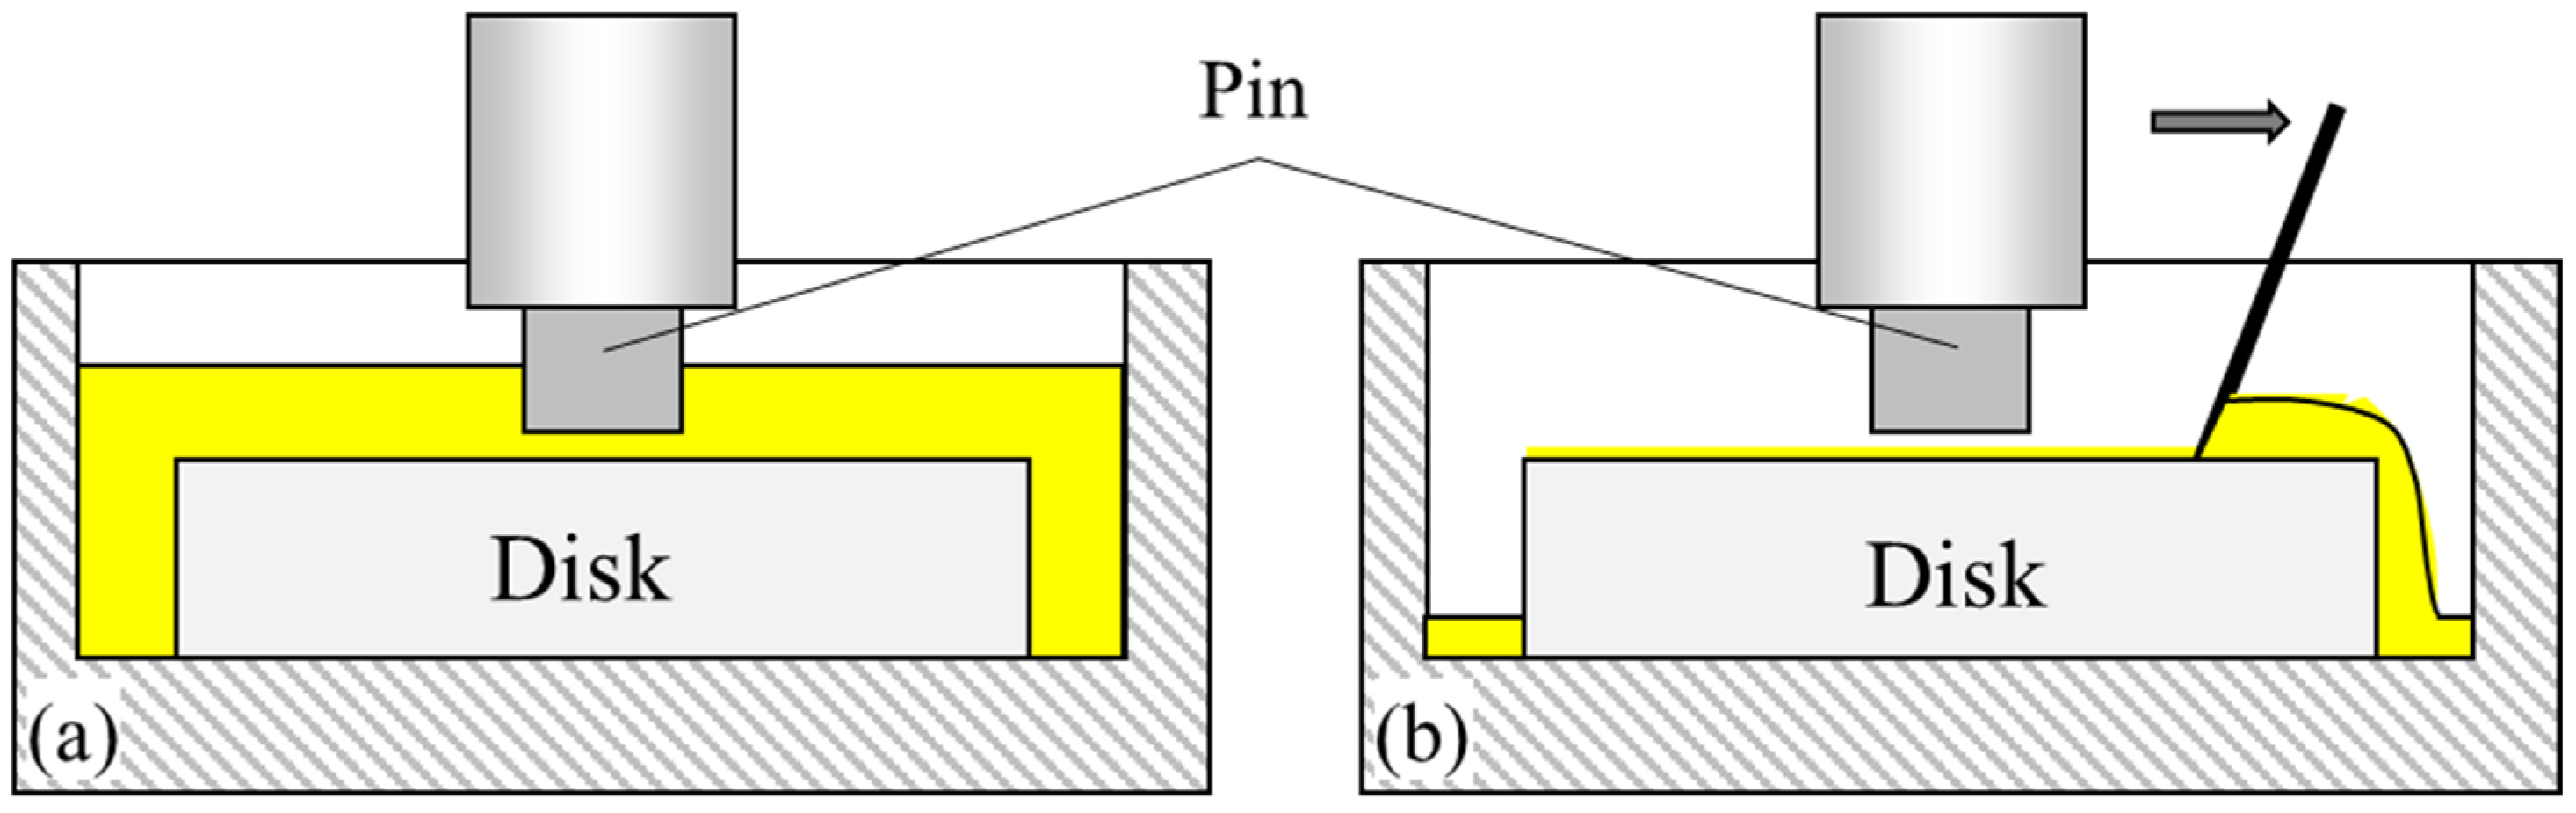
2.2. Tribological Test

The tribological tests were conducted using a UMT-3 tribometer (UMT-3, CETR, Campbell, CA, USA) with a pin-on-disk setup, as shown in Figure 1. The pin was mounted in a self-aligning pin holder to ensure full surface contact. For all tests, the normal force was set as 50 N, corresponding to a nominal contact pressure of 1 MPa. Both the load and friction force sensors had a resolution of 0.01 N. The sliding stroke was 12.5 mm, and the reciprocating frequency ranged from 0.05 to 0.8 Hz, corresponding to the average sliding speed from 1.25 to 20 mm/s. The tests were carried out in a controlled laboratory environment of 25 ± 3 °C and 50 ± 5% RH.
The sliding was firstly run at a low load (10 N) and frequency (1 Hz) for 10 s to ensure proper alignment of the pin and disk. Following this, the sliding was momentarily halted. Subsequently, a 50 N load was applied to the surfaces. When the load reached a steady state, the oscillation frequency was increased stepwise from 0.05 Hz to 0.8 Hz, with each frequency step lasting for 300 s. Each full-frequency ramp was repeated 5 times, and only the last 3 ramps were calculated to relieve the running-in effect. As the sliding speed is not a constant, friction force at the turning-back point would reach a peak and then reverse to the opposite peak. In this study, the average coefficient of friction (COF) was calculated ignoring the highest 10% and lowest 10% of the absolute value to minimize the random error at the turning-back point. Each test was repeated 3 times. The tests utilized commercially available L-G68 oil (SW D68, Castrol, UK) with a kinematic viscosity of approximately 68 mm2/s at 40 °C and 160 mm2/s at 24 °C. Two oil supply conditions (Figure 2) were used: immerged lubrication and limited lubrication. For immerged lubrication, the contact surfaces were immerged in the oil pool, while limited lubrication means the oil on the lower surface was scratched away using a knife edge, representing the engineering situation where the oil is brushed away by the contact edges.

3. Results

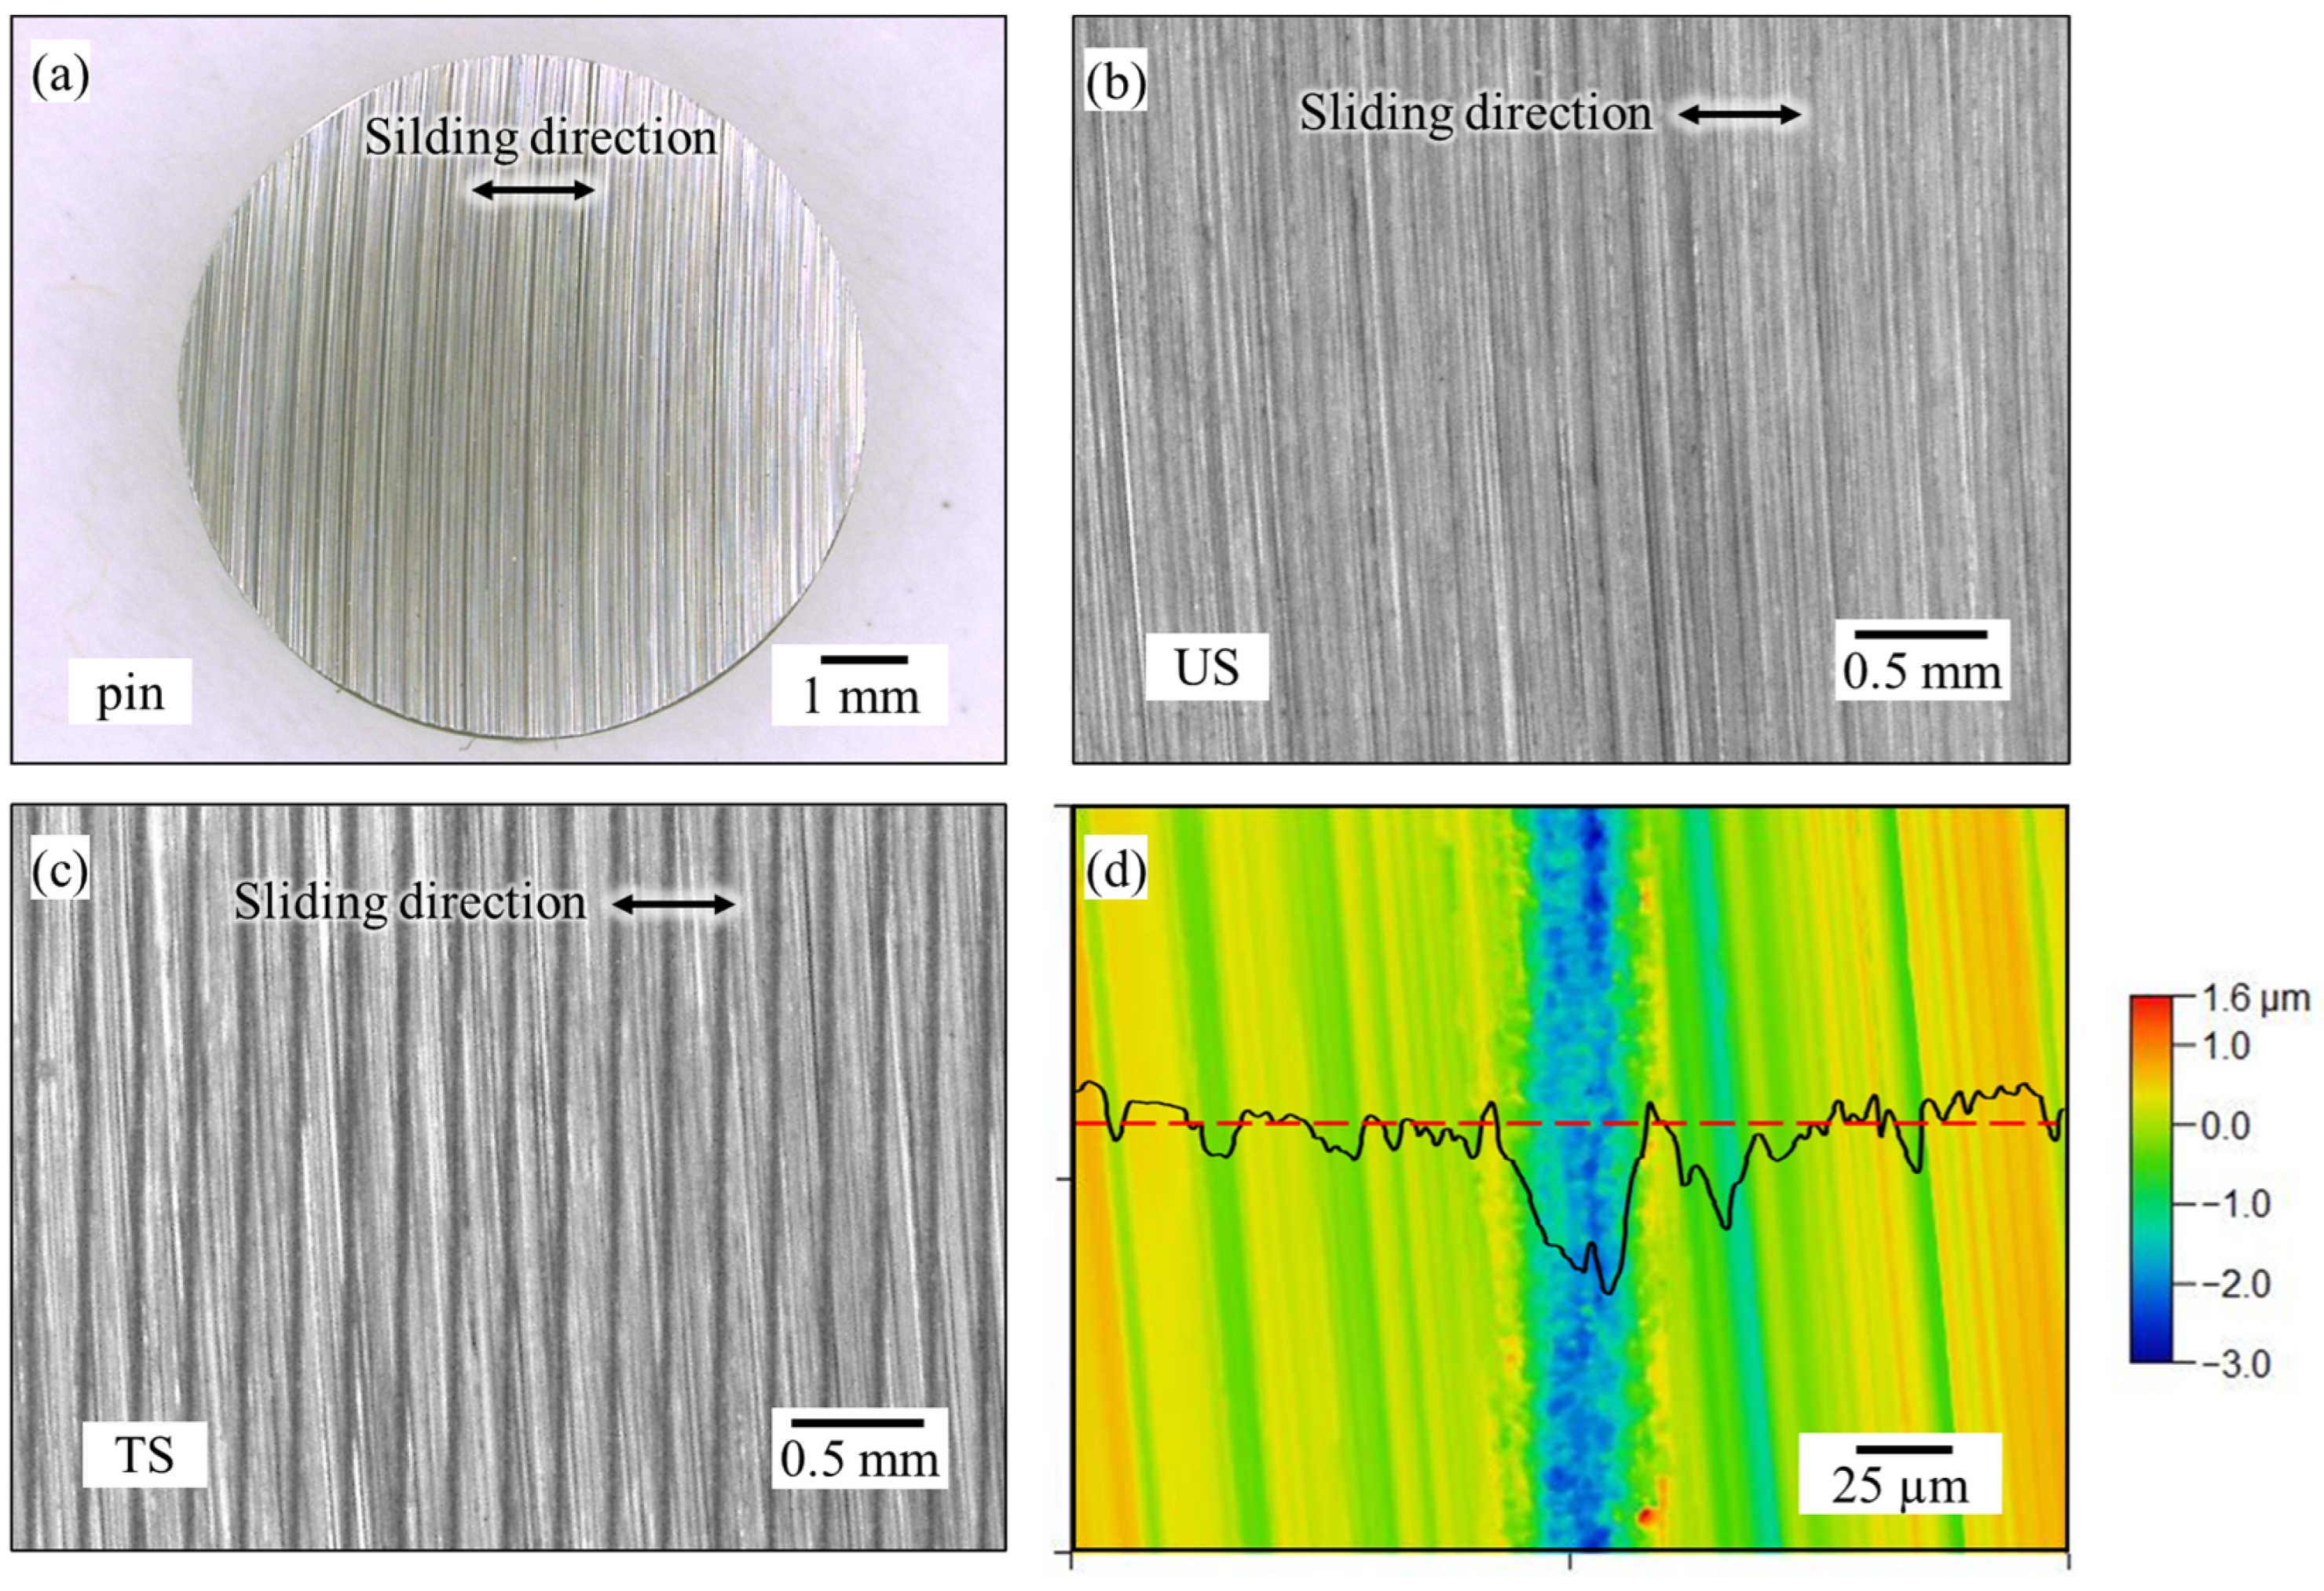
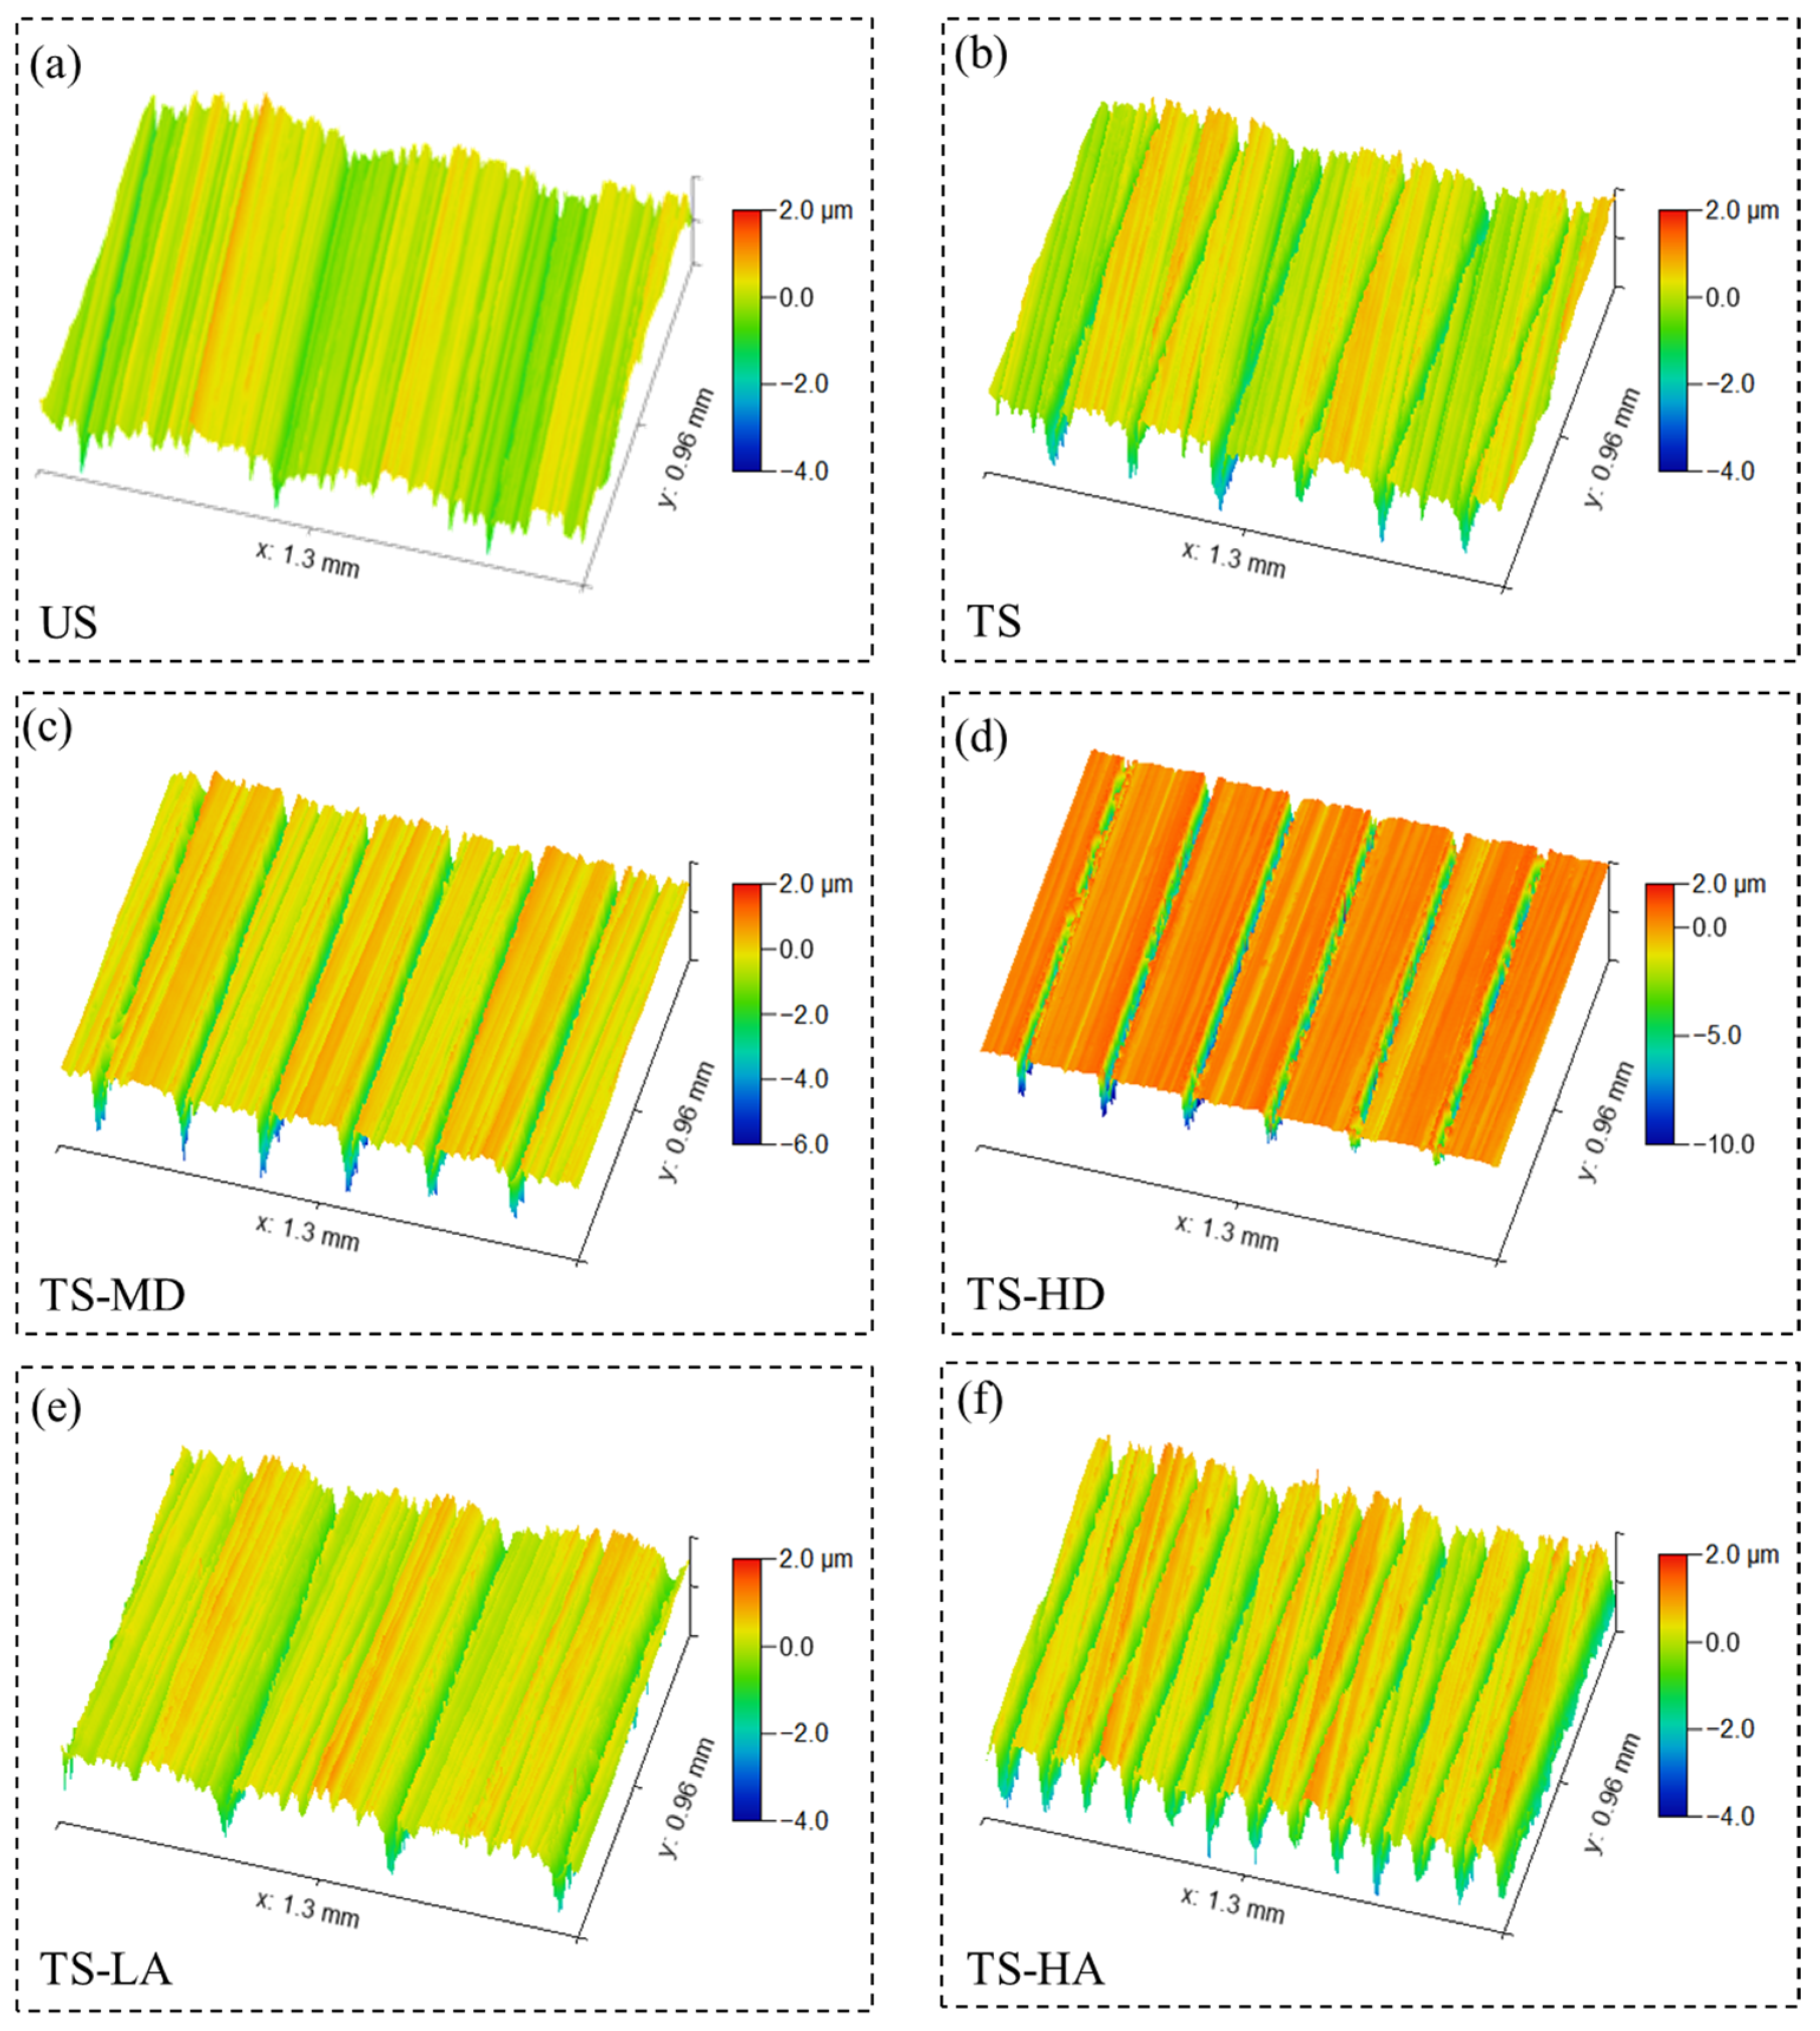
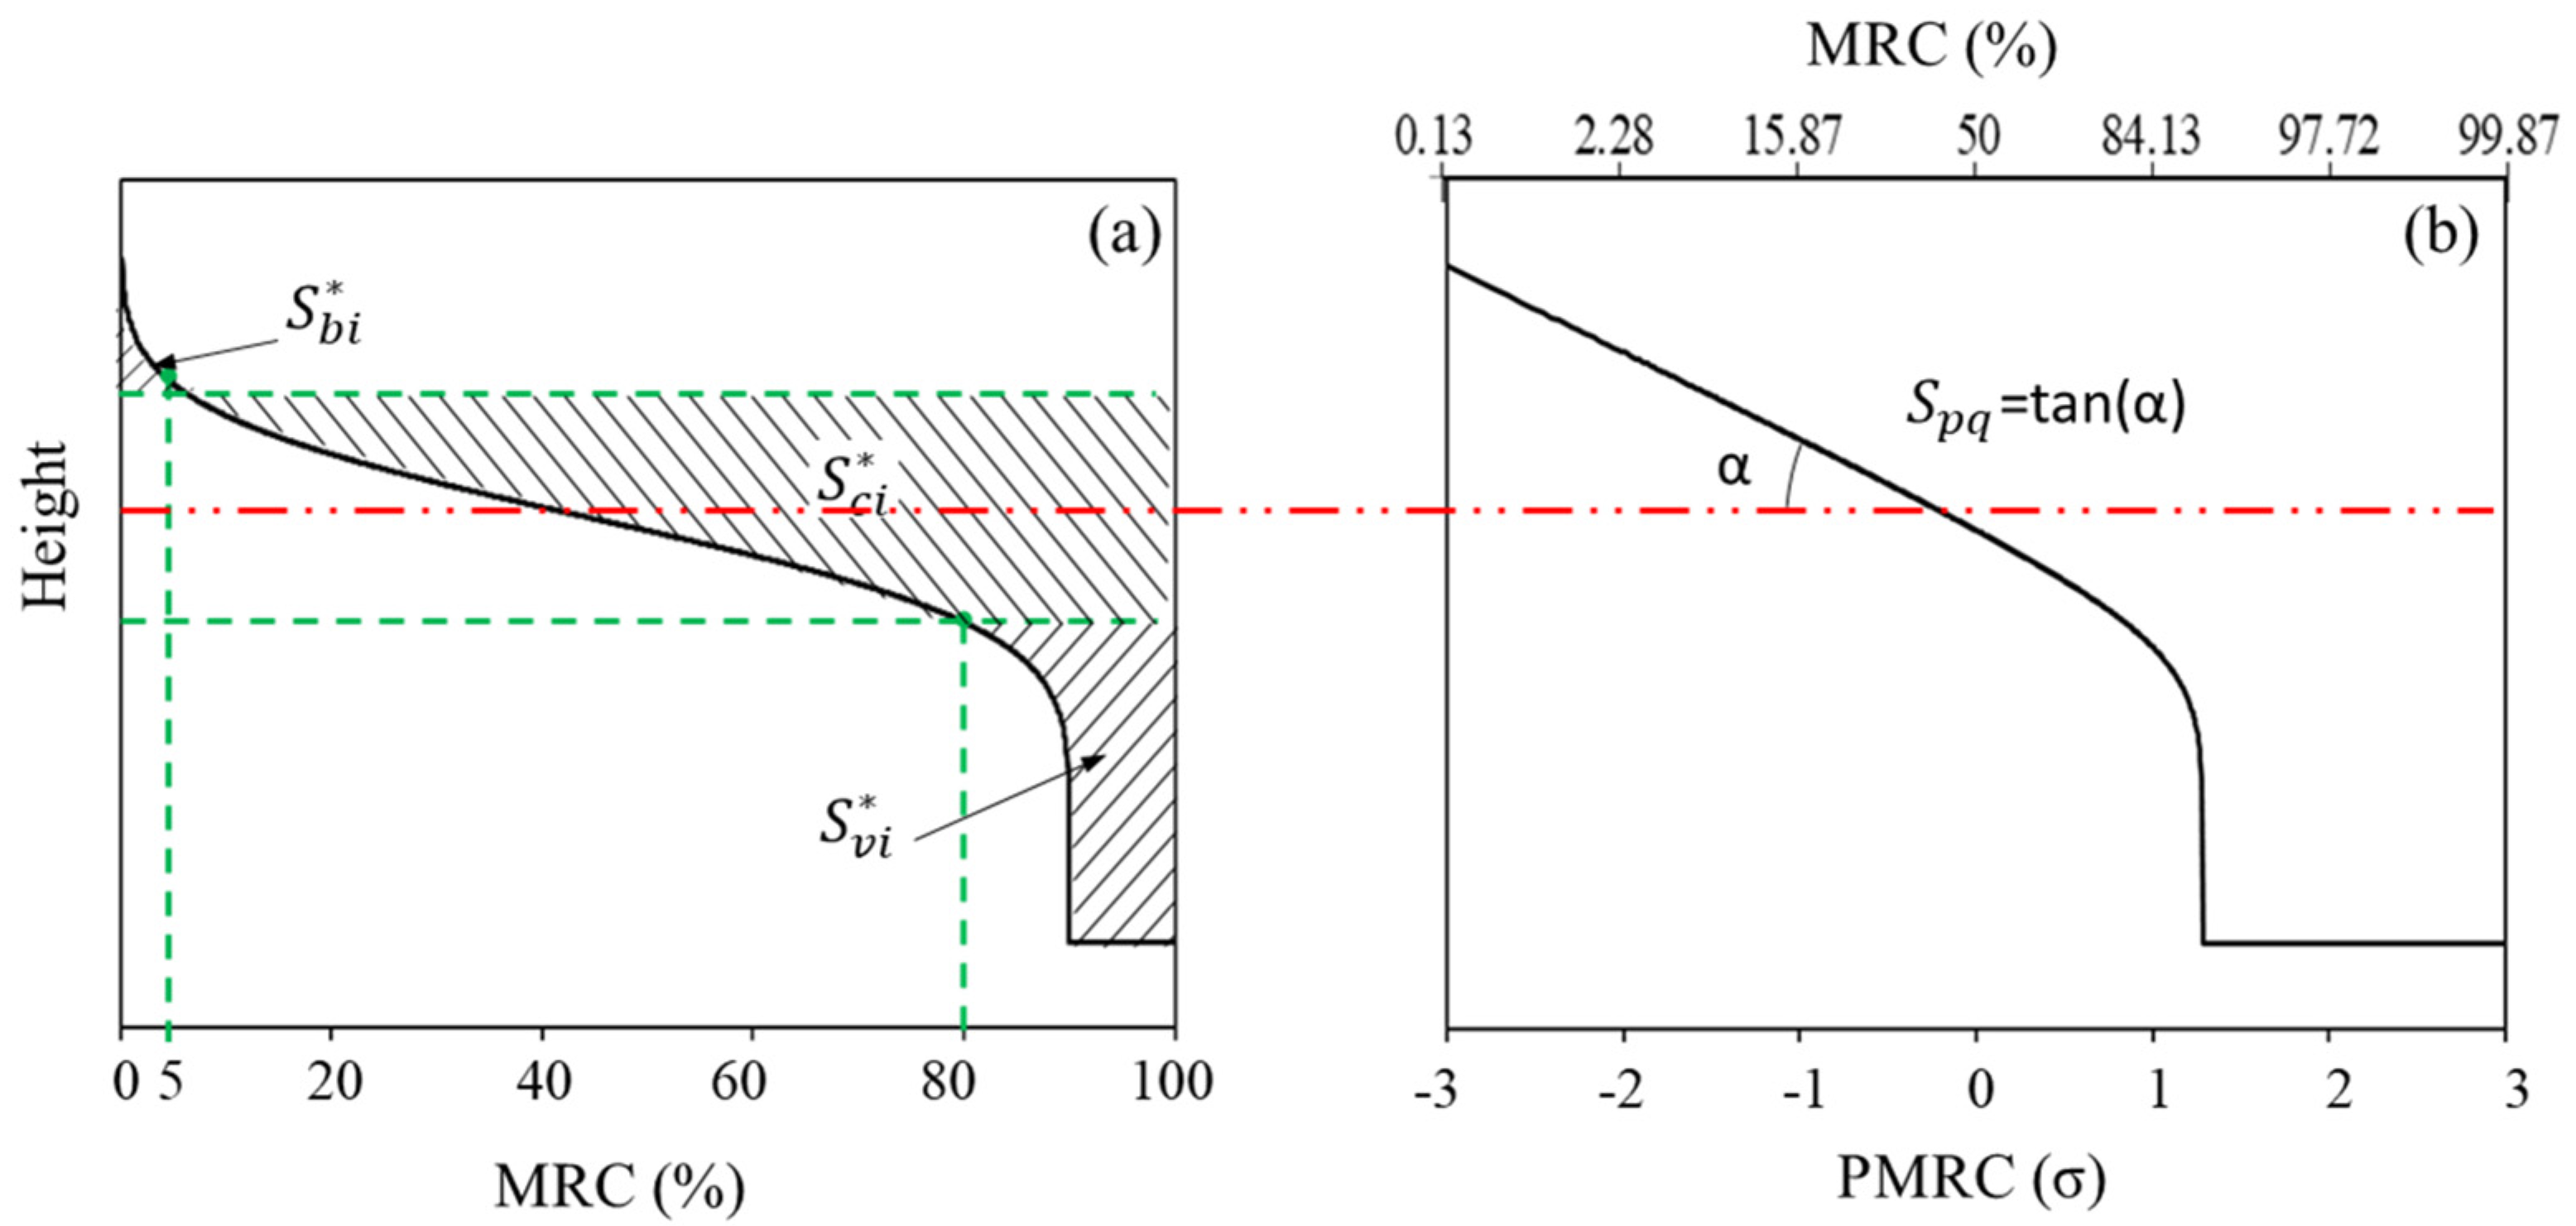
3.1. Surface Characterization

The surfaces were successfully prepared according to the design parameters listed in Table 1. Figure 3 presents the optical micrographs of the pin and disks with untextured (US) and textured (TS) surfaces. The 3D profiles for different disk surfaces are shown in Figure 4. The grinding traces were well maintained, and the bulges or burrs at the channel edge were insignificant compared to the roughness scale. Figure 5 shows the material ratio curve (MRC), i.e., the Abbott–Firestone curve, of different surfaces. Obviously, the upper parts of the curves show high consistency, while the lower parts vary significantly depending on the surface texture parameters.
The surface roughness parameters measured for the surfaces were as shown in Table 2. Compared to the commonly used parameter S a , the parameter set gives information about the influence of textures on plateau roughness and the void/material volume at surface peak, core, and valley regions, as shown in Figure 6. The surface roughness parameter arithmetic average height S a and root-mean-square height S q increased dramatically with the increase in texture depth and area density, while only a minor increase was observed for the plateau root-mean-square height S p q , which gives a quantitative description to the height distribution of an untextured area. No obvious trend was observed for the reformed surface-bearing index S b i * . The reformed core fluid retention index S c i * increased with texture area density but showed low relevance to the texture depth. The reformed valley fluid retention index S v i * increased both with texture area density and texture depth, except for in the case of TS-HA.

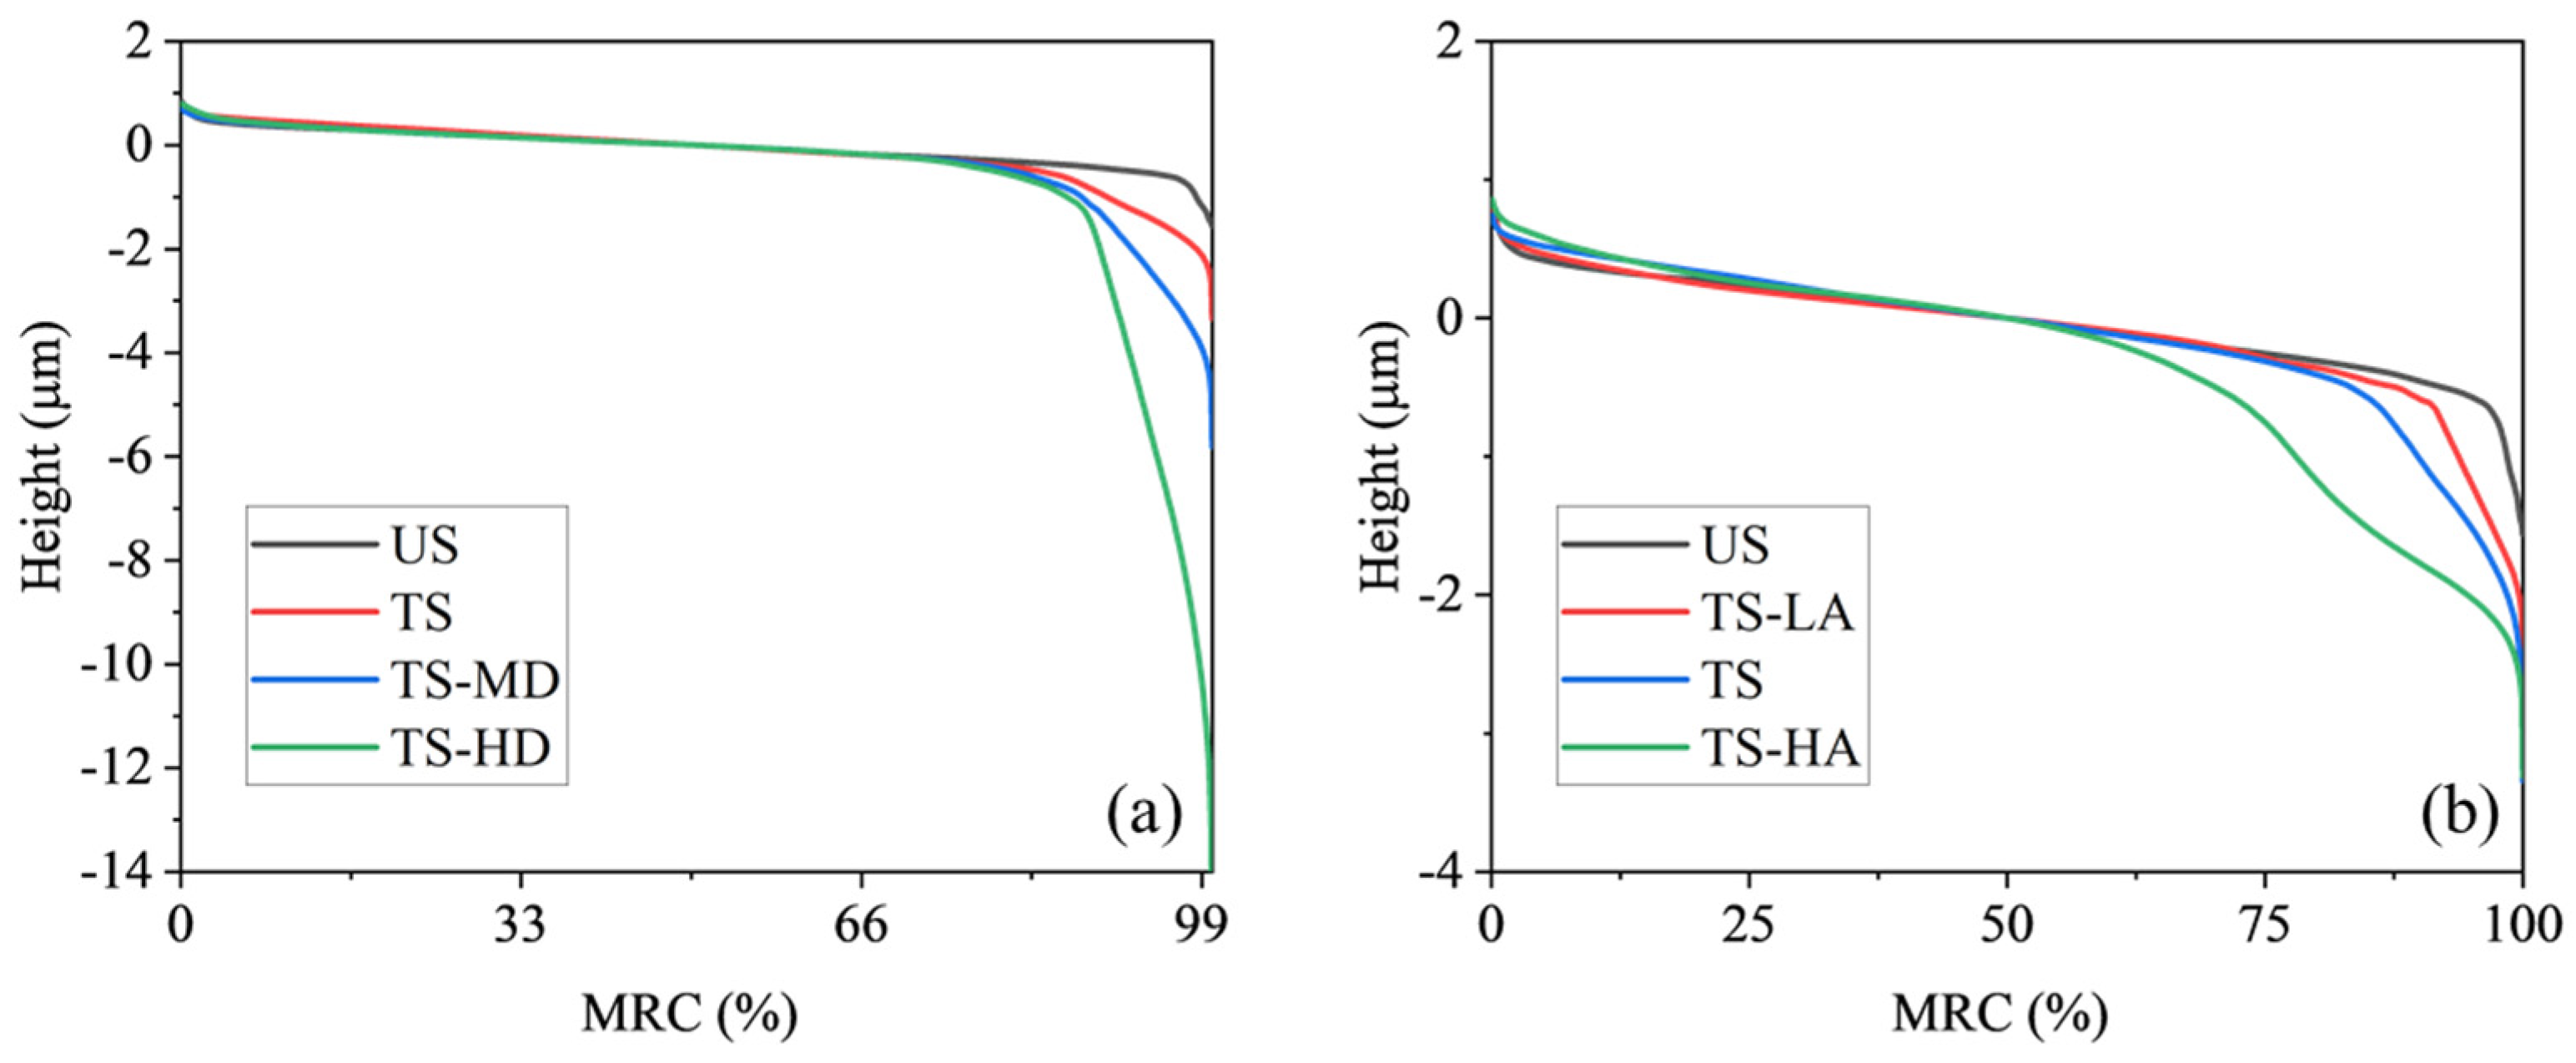
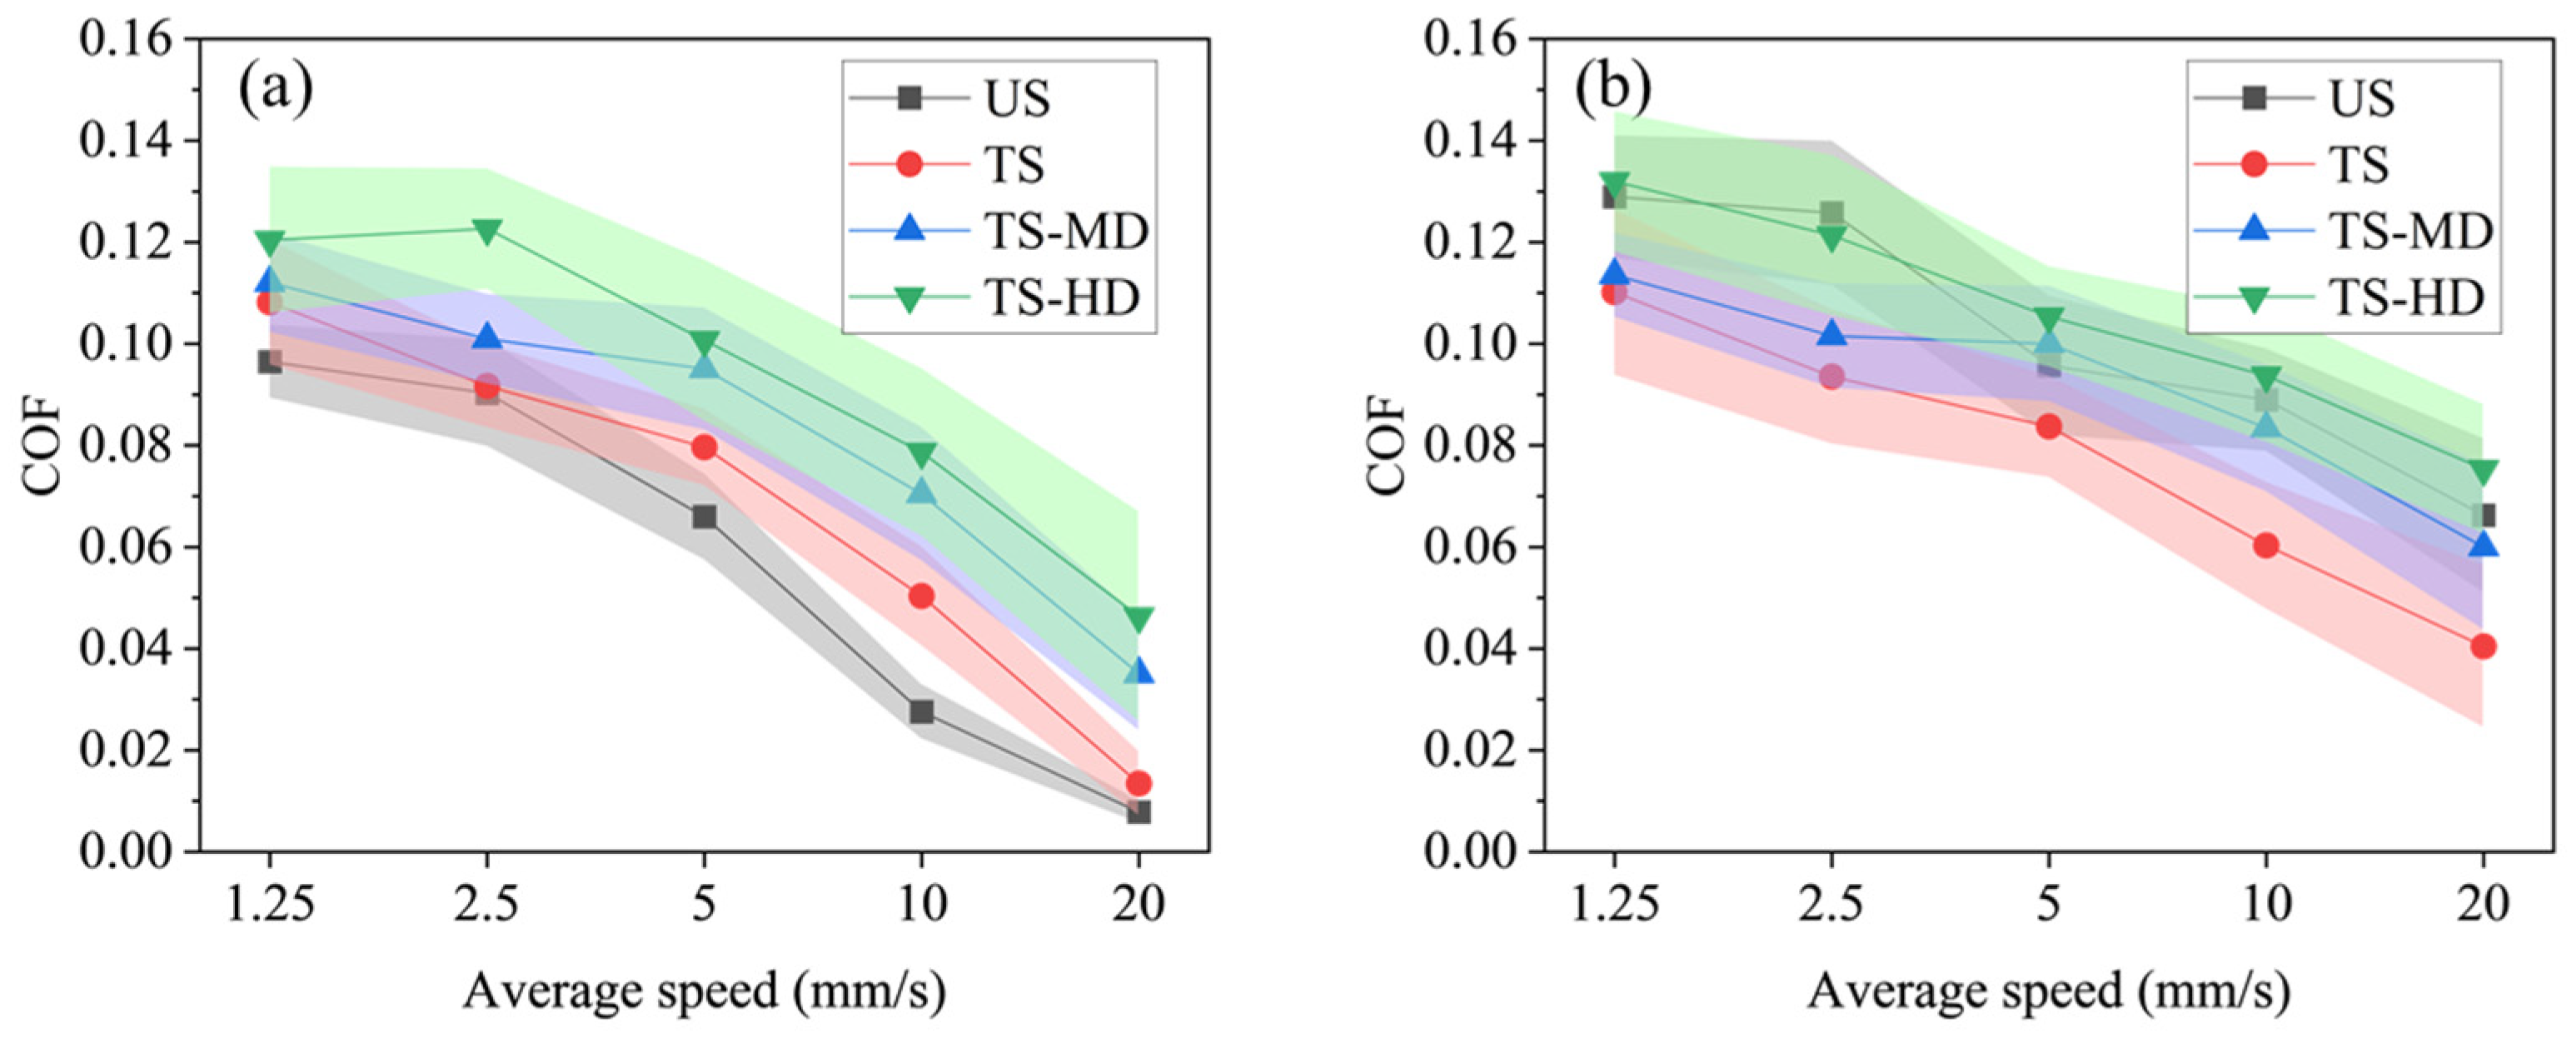
3.2. Influence of the Texture Depth

The following experiments were conducted under a load of 50 N (correspondingly, 1 MPa) and at room temperature. The average texture depth ranged from 1 to 7 um for TS, TS-MD, and TS-HD. Under immerged lubrication (Figure 7a), all textured surfaces, regardless of depth, showed higher friction compared to the untextured reference. Among all the textured surfaces, the TS surface had the lowest friction, with a friction increase from 1.5% to 72%. The detrimental effect intensified with increasing texture depth, reaching an up to 4.9 times friction increase for the TS-HD sample at an average sliding speed of 20 mm/s.
Due to the absence of lubricant oil, friction forces under limited lubrication (Figure 7b) increased for all surfaces compared to under immerged lubrication. However, the magnitude of the increment varied across different surfaces. A lower increment was observed for the TS surface, resulting in a friction reduction of up to 39% at 20 mm/s compared to the US surface. The TS-HD surface still had the highest friction, but its friction coefficient was very close to that of the US surface.

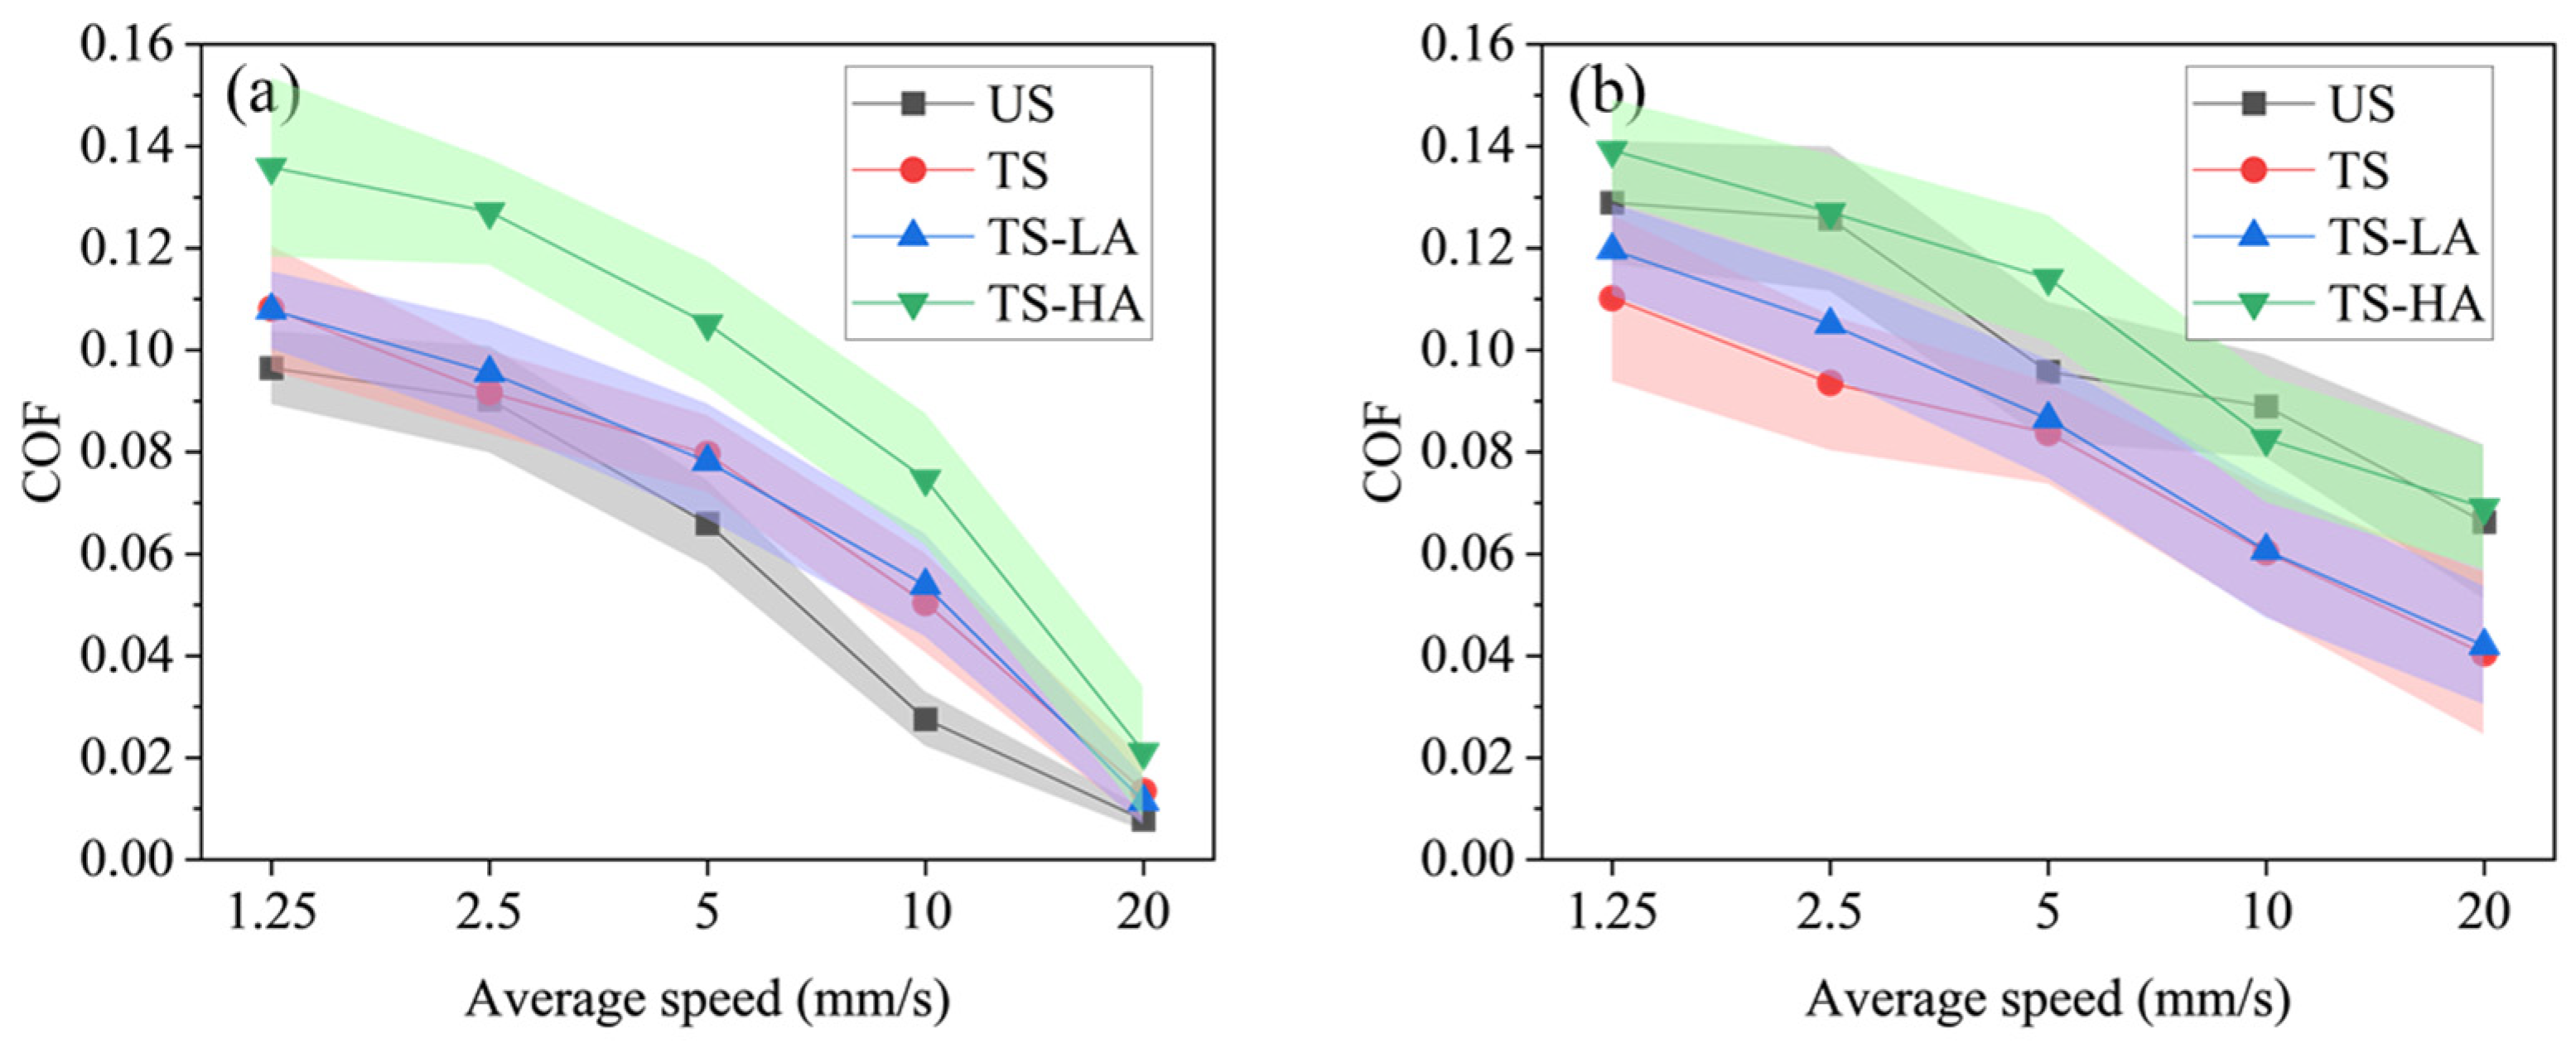
3.3. Influence of the Texture Area Density

The textured area density ranged from 7.5% to 30% for TS-LA, TS and TS-HA. All the textured surfaces with varying texture area density exhibited higher friction compared to the untextured US surface under immerged lubrication (Figure 8a). The TS-HA surface had the highest friction of an up to 169% increment compared to the US surface at 20 mm/s. Under limited lubrication (Figure 8b), both TS-LA and TS surfaces showed, at all speeds, friction reduction compared to the US surface, while the TS surface exhibited better behavior in the low-speed region. The maximum friction reduction was still 39% at 20 mm/s for the TS surface.

4. Discussion

The frictional properties of laser-textured ground surfaces were tested in order to investigate the effect of surface texturing on ground surfaces. The experiments were carried out for different texture depths, area densities and lubricating conditions. All tests were conducted under a 1 MPa load, and commercially available L-G68 oil was used.
In this study, channel textures were used to better compare the size effect between textures and grinding traces. Some researchers have suggested that communicating textures like channels or crossed channels may increase the friction due to a leak of hydrodynamic pressure along the groove [22,23], while some other researches have shown, on the contrary, that channel textures are effective [24,25,26]. Cross hatching, as a special communicating texture, has also been found beneficial in improving hydrodynamic pressure in cylinder–liner/piston–ring contact [13,27]. These examples indicate the effect of channel surface textures is highly dependent on the texture design parameters and test conditions, including surface roughness, lubricating condition, texture depth, texture area density and so on.

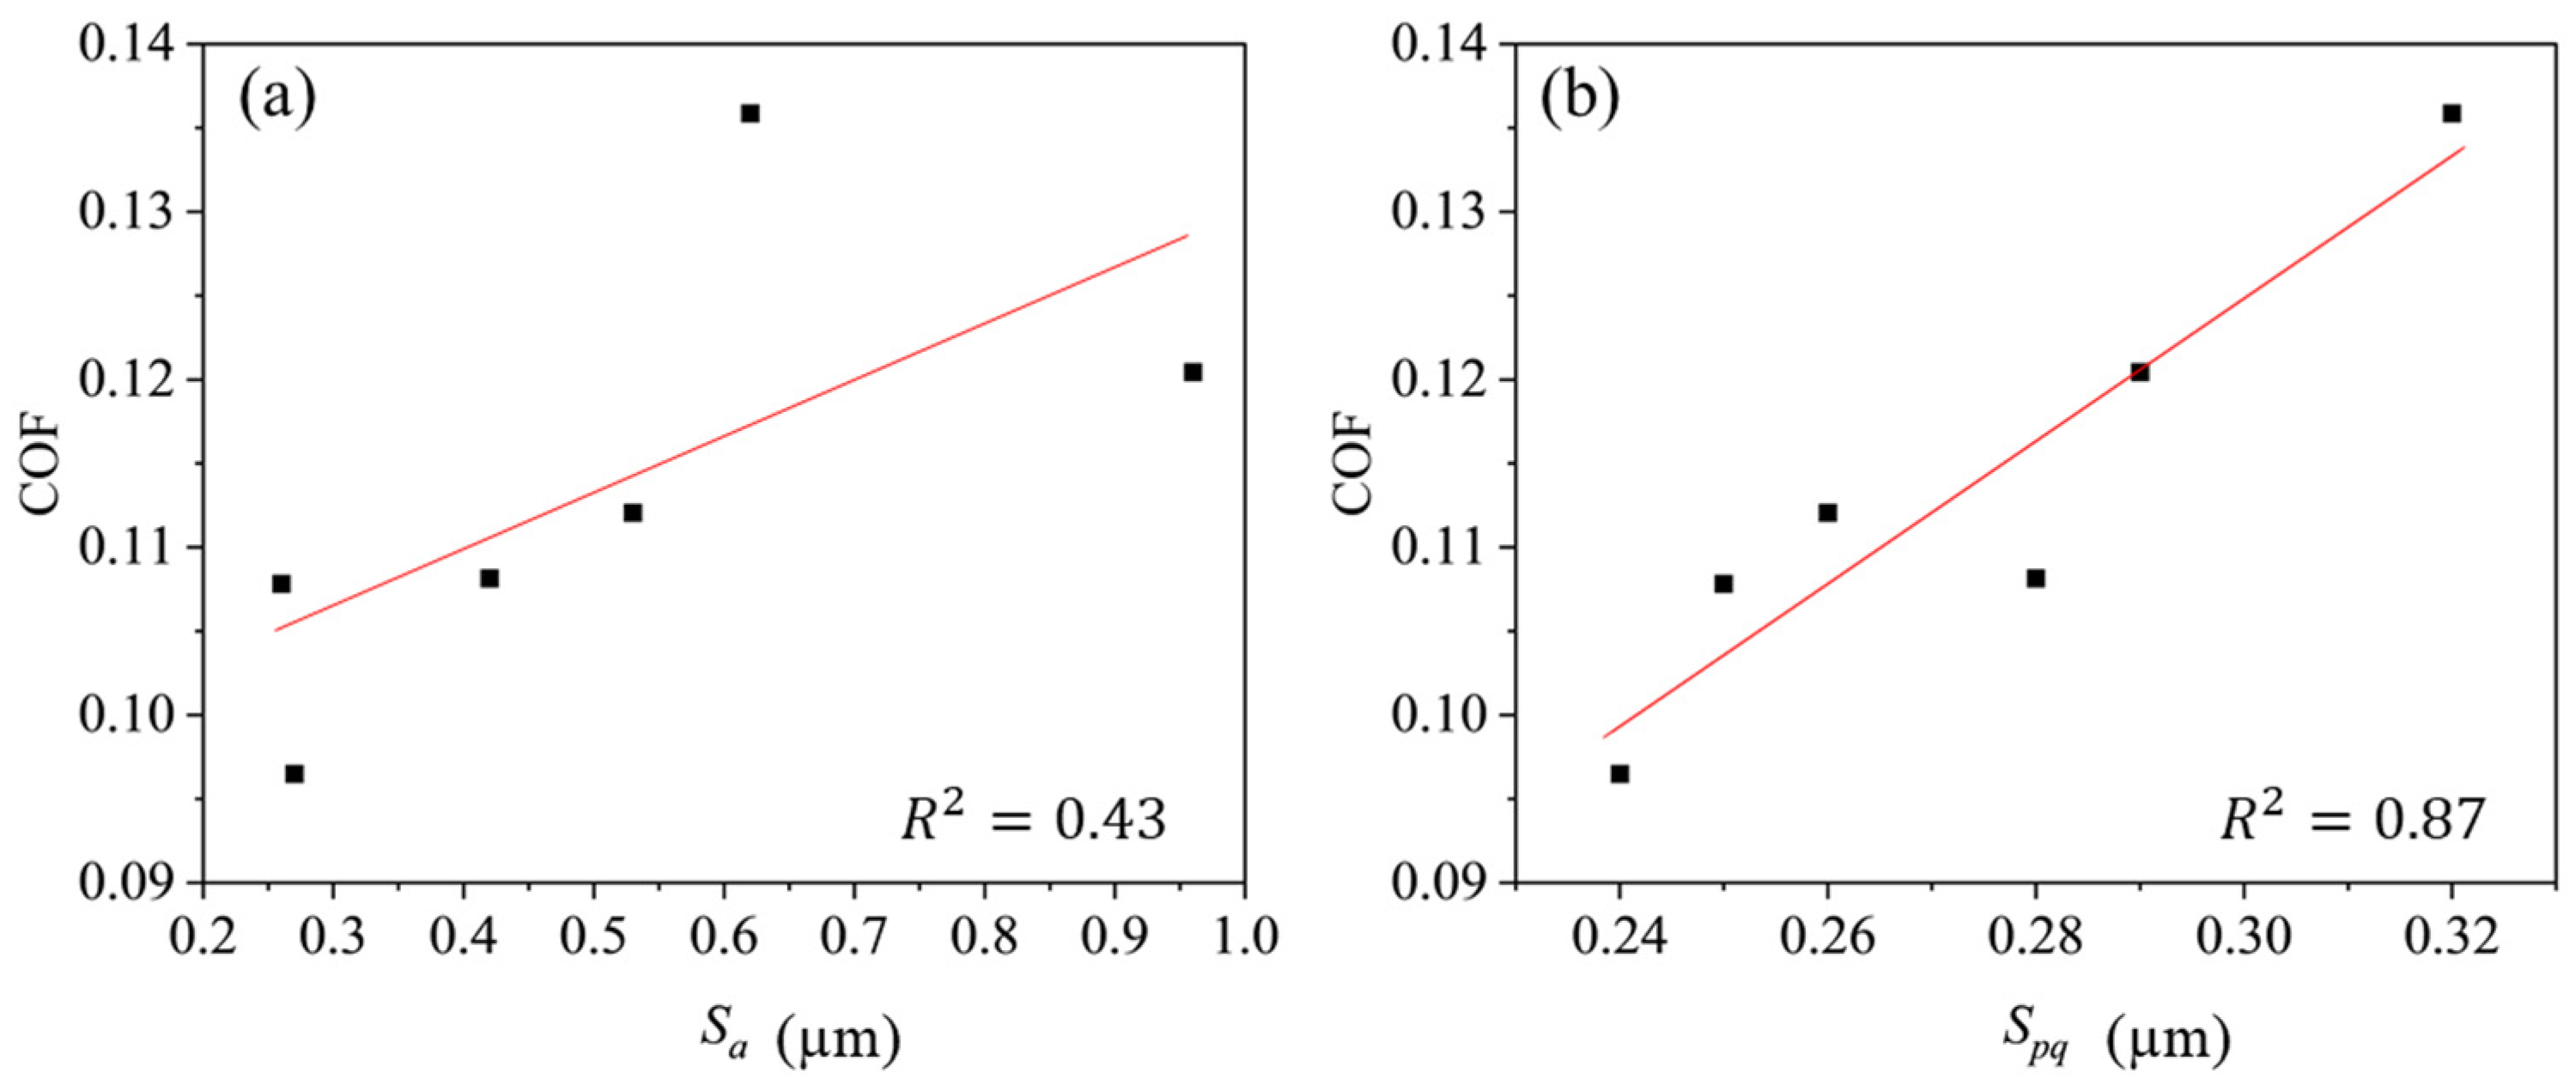
4.1. Surface Roughness

The surface topography plays an important role in tribology. Roughness parameters, as quantitate characterizations of surface topography, are expected to reflect the tribological performance and help understanding of the mechanism of contact, friction and wear, especially under boundary lubrication where the hydrodynamic effect can be ignored. Knowledge about the correlation between roughness parameters and friction is important for surface design and manufacturing control. Figure 9 shows the relation between the friction coefficient and surface roughness parameters S a and S p q under immerged lubrication at an average sliding speed of 1.25 mm/s. Compared to the widely used parameter S a , the newly induced parameter S p q shows better potential in reflecting friction behavior. A quasi-linear relation between the friction coefficient and S p q was observed under such test conditions. As shown in Figure 7 and Figure 8, the friction at this speed falls into a boundary or near-boundary mixed lubrication regime. The hydrodynamic effect is comparatively low, so the friction is dominated by the shear of asperity contact. As analyzed in our previous study [21], the peak root-mean-square roughness S p q characterizes the height distribution of the upper part of a textured surface, which is directly related to the deformation in asperity contact, so it is more correlated to friction. However, due to the limitations of tests, this still needs to be confirmed by a future study.
Some researchers suggest hydro-static pressure and edge effect around the textures might be crucial to tribology in a boundary regime [4]. However, this may not be applicable under the experimental conditions in this work. First, the channel textures will cause a pressure leak along the groove. Second, the edge of the textures varies in height due to roughness, so it is almost impossible to build a closed oil reservoir when contacting a rough counter surface in face-to-face contact even if discrete textures are adopted. Third, considering the roughness, contact only occurs on the top of asperities, the stress concentration around the edge may be relieved compared to the smooth contact. Thus, the roughness increase caused by plateau area reduction or bulges around textures may have greater influence on the friction under such conditions.
It should be emphasized that all textured surfaces showed higher friction than the untextured reference. An explanation, as suggested by Pettersson et al. [28], is that the textures may have little or even a negative effect under boundary lubrication when the supply of lubricant is already sufficient in the untextured case, and the load-bearing area is decreased due to texturing. In this experimental setup, the contacting surfaces were rough enough for the oil supply along the grinding traces under immerged lubrication. When textures are introduced to the surface, the load-bearing capacity will decrease at the same nominal deformation due to contact area reduction. Thus, the asperity deformation will increase under the same load, resulting in higher stress and friction at the contacting area.

4.2. Immerged Lubrication

In contrast to most of the research [7,29,30,31], our results show that surface texturing always leads to higher friction under immerged lubrication. Similar behavior was observed in a few reports [4,16,21]. As shown in Figure 7a and Figure 8a, the friction coefficient increased with texture depth and texture area density. Under mixed lubrication, the friction can be divided into two major components that both may cause friction increase. One of these is the increase in the boundary component. As the surface texturing makes the plateau area rougher, the boundary friction coefficient may increase with it. As discussed in Section 4.1, a quasi-linear relation was observed between the friction coefficient and the plateau root-mean-square roughness S p q at an average sliding speed of 1.25 mm/s. However, with increasing speed, the effect of boundary friction will reduce, and the relation between friction and roughness would be more complex.
The other component is the decrease in hydrodynamic lift. The introduction of textures may undermine the hydrodynamic effect of the previous surface, leading to a friction increase. The main factor responsible for this should be the existence of plateau grinding traces. As shown in Figure 4, the plateau grinding traces were well kept and were arranged perpendicular to the sliding direction. The grinding traces, if regarded as a certain kind of texture, will cause a similar beneficial effect as texture grooves, and the laser textures may undermine the effect. The assumption is reasonable because numerical investigations [5,32] show that the highest hydrodynamic effect can be achieved when the texture depth is close to the average film thickness. The contact between two rough surfaces can be transformed into contact between an equivalent rough surface and a smooth, rigid surface [33]. As shown in Figure 10, under boundary or mixed lubrication, where two surfaces come into contact, the average film thickness h 0 is determined by the peak height of the grinding traces, while the grinding trace depth h r is always of the same size. The texture depth h t , however, can be much larger than h 0 , which will generate lower hydrodynamic lift compared to the texture traces. Thus, the higher the texture depth or area density, the lower the hydrodynamic lift, resulting in higher friction force.
A potentially misleading conclusion would be that the textures are always detrimental for rough surfaces under boundary or mixed lubrication, which is evidently incorrect as many experiments have shown benefits under such conditions. However, textures can still be beneficial since the practical application is much more complex. Firstly, the real film thickness is always larger than the roughness height due to the flatness deviation, waviness, pitch angle or misalignment. As surface roughness decreases, this effect may become more pronounced, potentially making the influence of roughness lower and textures more effective. Secondly, the textures can be improved by optimizing the depth, area density, shape or distribution, while the roughness trace is always uncontrollable, and sometimes it is not even easy to control the trace orientation. In addition, texturing may bring side effects, including changing physical/chemical properties or introducing bulges around the textures, which might be more helpful than the textures themselves. Meanwhile, the textures have other functions, such as trapping debris or reducing wear, which may also be helpful for reducing friction.

4.3. Limited Lubrication

Another interesting result is that, under limited lubrication, the textured surfaces exhibited improved performance compared to their untextured reference. A simple explanation is that the textured surfaces can store more oil, thus maintaining better friction behavior when the oil is scratched away. Figure 11 gives the comparison ratio of friction coefficient R c o f = f l / f m . The f l and f m are the friction coefficient under limited lubrication and immerged lubrication, respectively. Clearly, the textured surfaces are less influenced when the oil level is becoming low. At 1.25 mm/s, the friction coefficient of untextured surface US increased by 34% from immerged lubrication to limited lubrication, while, for all the textured surfaces, the increase was relatively low, with the highest increase of 11% for the low-depth, low-area-ratio surface TS-LA. With the increasing speed, the R c o f ratio increased for all surfaces. At 20 mm/s, the friction coefficient of the US surface under limited lubrication became 8.5 times that under immerged lubrication, while the ratio for the TS surface was only 3.0. Higher texture depth seems beneficial to reduce the ratio. With increasing texture depth, the ratio decreased to 1.7 and 1.6 for TS-MD and TS-HD, respectively. Higher texture depth and area density could be more effective in this; however, due to the poor friction behavior of high-depth and high-area-density textures under immerged lubrication, the TS surface showed the best friction performance under limited lubrication (Figure 8b and Figure 9b).
Although this is a commonly used condition for engineering applications such as sliding guideways, where lubricants are added to the contact surface in a timely fashion and scratched away by the contacting edge, only a few research studies have been reported. A starved lubricating condition is always realized by supplying only a little amount of oil. Zhang et al. [34] conducted tests where the oil was supplied to just wet the Babbitt alloy disk and found the textures could reduce the friction force. Saeidi et al. [35] carried out tests under starved lubrication and observed a lower COF for textured surfaces. Similar to this study, they observed little or a negative effect on friction for textures on a rough surface under boundary or mixed lubrication in another paper [16]. The explanation could be that the textures could store more oil compared to the untextured references.
The oil retention capacity can be described by the reformed core fluid retention index S c i * and the reformed valley fluid retention index S v i * , as shown in Figure 6. As the valley area is defined as the lowest 20% of the surface, it was not feasible for the 30% textured TS-HA surface. Figure 12 shows the comparison ratio of friction coefficient R c o f for different surfaces plotted against the fluid retention indices S c i * and S v i * , respectively. The comparison ratio decreased with the increase in oil retention capacity at the core and valley area, which means greater oil storage will be beneficial for maintaining the frictional behavior when oil is drying out. However, as the oil retention capacity increased, it became less effective. As shown in Figure 12b, the R c o f almost remained the same when S v i * increased from 1.02 for TS-MD to 2.31 for TS-HD.
When the sliding speed was low, the hydrodynamic effect could be ignored. Increasing the oil storage will be beneficial to build more robust boundary films between contacting asperities, but the effect is limited as it always stays in the boundary lubrication regime. The oil retention capacity became more effective at the high speed of 20 mm/s. For the untextured reference with low oil retention capacity, the friction under limited lubrication increased dramatically, up to 8.5 times that under immerged lubrication. However, the friction coefficients under the two lubrication conditions became closer with the increase in oil retention capacity. This suggests the oil retention capacity could contribute to the hydrodynamic effect under limited lubrication.
The effect of surface textures under limited lubrication is summarized in Figure 13. Under boundary lubrication, more oil can be supplied to the contact area to reduce shear, while, under mixed lubrication, oil may also generate local hydrodynamic lift at the same time. Increasing the oil retention capacity will be beneficial to these effects. However, the textures may also cause a roughness increase in the plateau area and reduce the hydrodynamic effect of roughness patterns, leading to a friction increase. The effects of textures are similar to the rough valleys in the honed cylinder liners, as reviewed by Pawlus and Reizer [36]. In fact, surface texturing is a method used to create more controllable valleys on the surface. Hence, they share similar design principles. We should balance the benefits and defects in texture design. In this study, a shallow texture in a moderate area density (1 µm and 15% area density) was found to have the best performance.

5. Conclusions

In this work, channel textures were fabricated on the ground surface, varying in texture depth and area density. The surface roughness was evaluated using different roughness parameters, including the parameter arithmetic average height S a , root-mean-square height S q , the plateau root-mean-square height S p q , the reformed surface-bearing index S b i * , the reformed core fluid retention index S c i * and the reformed valley fluid retention index S v i * . The frictional performance of textured surfaces was investigated under immerged and limited lubricating condition using the reciprocating sliding test.
The experimental results show that surface texturing always leads to higher friction under immerged lubrication. The analysis suggests the textures may cause more severe contact deformation due to lack of contact support at the valley region, presenting a “high roughness” behavior. Compared to the widely used parameter S a or S q , the newly introduced S p q could characterize the roughness of the plateau contact area and show better potential in reflecting friction behavior under boundary or near-boundary mixed lubrication.
The friction increased for all surfaces when it was changed from immerged lubrication to limited lubrication due to lack of lubricants. As the textured surfaces could better maintain their performance under such circumstances, they showed improved performance compared to their untextured reference. Shallow textures in moderate area density (1 µm and 15% area density) were found to have the best performance, causing an up to 40% friction reduction.

Author Contributions

Conceptualization, methodology and investigation, H.Y.; writing—original draft preparation, H.Y.; writing—review and editing, J.S. and J.D.; supervision, J.S. and J.D.; project administration, J.D. All authors have read and agreed to the published version of the manuscript.

Funding

This work is supported by the National Natural Science Foundation of China (52275443). Hongzhi Yue acknowledges the China Scholarship Council for a scholarship (202006220107). We acknowledge support by the KIT-Publication Fund of the Karlsruhe Institute of Technology.

Data Availability Statement

Data are available upon reasonable request from the authors.

Conflicts of Interest

The authors declare no conflicts of interest.

Appendix A

Here the algorithms of reformed parameters are given in reference [21].
Reformed surface bearing index:
S b i = ( 1 δ ) S q η 0.05
where δ is the texture density, η 0.05 is the surface heights at 5% bearing ratio, S q is the reformed RMS deviation of textured surfaces.
S q = u n t e x t u r e d   S q S p q
For a Gaussian surface, the surface-bearing index S b i is about 0.608.
Reformed core fluid retention index:
S c i = V v ( h 0.05 ) V v ( h 0.8 ) S q Δ A
where V v h t means the void volume below the height at t bearing ratio; Δ A is the area of sampling surfaces. For a Gaussian surface, the surface-bearing index S c i is about 1.56.
Reformed valley fluid retention index:
S v i = V v ( h 0.8 ) S q Δ A
For a Gaussian surface, the valley fluid retention index S v i is about 0.11.

References

  1. Holmberg, K.; Erdemir, A. Influence of tribology on global energy consumption, costs and emissions. Friction 2017, 5, 263–284. [Google Scholar] [CrossRef]
  2. Etsion, I.; Kligerman, Y.; Halperin, G. Analytical and experimental investigation of laser-textured mechanical seal faces. Tribol. Trans. 1999, 42, 511–516. [Google Scholar] [CrossRef]
  3. Braun, D.; Greiner, C.; Schneider, J.; Gumbsch, P. Efficiency of laser surface texturing in the reduction of friction under mixed lubrication. Tribol. Int. 2014, 77, 142–147. [Google Scholar] [CrossRef]
  4. Gachot, C.; Rosenkranz, A.; Hsu, S.M.; Costa, H.L. A critical assessment of surface texturing for friction and wear improvement. Wear 2017, 372, 21–41. [Google Scholar] [CrossRef]
  5. Gropper, D.; Wang, L.; Harvey, T.J. Hydrodynamic lubrication of textured surfaces: A review of modeling techniques and key findings. Tribol. Int. 2016, 94, 509–529. [Google Scholar] [CrossRef]
  6. Rosenkranz, A.; Grützmacher, P.G.; Gachot, C.; Costa, H.L. Surface texturing in machine elements- a critical discussion for rolling and sliding contacts. Adv. Eng. Mater. 2019, 21, 1900194. [Google Scholar] [CrossRef]
  7. Marian, M.; Almqvist, A.; Rosenkranz, A.; Fillon, M. Numerical micro-texture optimization for lubricated contacts-a critical discussion. Friction 2022, 10, 1772–1809. [Google Scholar] [CrossRef]
  8. Patir, N.; Cheng, H. An average flow model for determining effects of three- dimensional roughness on partial hydrodynamic lubrication. ASME J. Lubr. Technol. 1978, 100, 12–17. [Google Scholar] [CrossRef]
  9. Patir, N.; Cheng, H. Application of average flow model to lubrication between rough sliding surfaces. ASME J. Lubr. Technol. 1979, 101, 220–229. [Google Scholar] [CrossRef]
  10. Phan-Thien, N. Hydrodynamic lubrication of rough surfaces. Proc. Math. Phys. Eng. Sci. 1982, 383, 439–446. [Google Scholar] [CrossRef]
  11. Allaire, G. Homogenization and two-scale convergence. SIAM J. Math. Anal. 1992, 23, 1482–1518. [Google Scholar] [CrossRef]
  12. Rom, M.; König, F.; Müller, S.; Jacobs, G. Why homogenization should be the averaging method of choice in hydrodynamic lubrication. Appl. Eng. Sci. 2021, 7, 100055. [Google Scholar] [CrossRef]
  13. Grützmacher, P.G.; Profito, F.J.; Rosenkranz, A. Multi-scale surface texturing in tribology-current knowledge and future perspectives. Lubricants 2019, 7, 95. [Google Scholar] [CrossRef]
  14. Spencer, A.; Almqvist, A.; Larsson, R. A semi-deterministic texture-roughness model of the piston ring-cylinder liner contact. Proc. Inst. Mech. Eng. Part J J. Eng. Tribol. 2011, 225, 325–333. [Google Scholar] [CrossRef]
  15. Brunetière, N.; Tournerie, B. Numerical analysis of a surface-textured mechanical seal operating in mixed lubrication regime. Tribol. Int. 2012, 49, 80–89. [Google Scholar] [CrossRef]
  16. Gu, C.; Meng, X.; Wang, S.; Ding, X. Study on the mutual influence of surface roughness and texture features of rough-textured surfaces on the tribological properties. Proc. Inst. Mech. Eng. Part J J. Eng. Tribol. 2021, 235, 256–273. [Google Scholar] [CrossRef]
  17. Podgornik, B.; Vilhena, L.M.; Sedlacek, M.; Rek, Z.; Zun, I. Effectiveness and design of surface texturing for different lubrication regimes. Meccanica 2012, 47, 1613–1622. [Google Scholar] [CrossRef]
  18. Sedlacek, M.; Podgornik, B.; Vizintin, J. Planning surface texturing for reduced friction in lubricated sliding using surface roughness parameters skewness and kurtosis. Proc. Inst. Mech. Eng. Part J J. Eng. Tribol. 2012, 226, 661–667. [Google Scholar] [CrossRef]
  19. Sedlacek, M.; Gregorcic, P.; Podgornik, B. Use of the roughness parameters Ssk and Sku to control friction—A method for designing surface texturing. Tribol. Trans. 2017, 60, 260–266. [Google Scholar] [CrossRef]
  20. Meylan, B.; Saeidi, F.; Wasmer, K. Effect of surface texturing on cast iron reciprocating against steel under cyclic loading in boundary and mixed lubrication conditions. Lubricants 2018, 6, 2. [Google Scholar] [CrossRef]
  21. Yue, H.; Deng, J.; Zhang, Y.; Meng, Y.; Zou, X. Characterization of the textured surfaces under boundary lubrication. Tribol. Int. 2020, 151, 106359. [Google Scholar] [CrossRef]
  22. Zum Gahr, K.H.; Wahl, R.; Wauthier, K. Experimental study of the effect of microtexturing on oil lubricated ceramic/steel friction pairs. Wear 2009, 267, 1241–1251. [Google Scholar] [CrossRef]
  23. Wahl, R.; Schneider, J.; Gumbsch, P. Influence of the real geometry of the protrusions in micro textured surfaces on frictional behaviour. Tribol. Lett. 2012, 47, 447–453. [Google Scholar] [CrossRef]
  24. Stephens, L.; Siripuram, R.; Hayden, M.; McCartt, B. Deterministic micro asperities on bearings and seals using a modified liga process. J. Eng. Gas. Turbines Power 2004, 126, 147–154. [Google Scholar] [CrossRef]
  25. Vlădescu, S.C.; Olver, A.V.; Pegg, I.G.; Reddyhoff, T. Combined friction and wear reduction in a reciprocating contact through laser surface texturing. Wear 2016, 358, 51–61. [Google Scholar] [CrossRef]
  26. Huang, J.; Guan, Y.; Ramakrishna, S. Tribological behavior of femtosecond laser-textured leaded brass. Tribol. Int. 2021, 162, 107115. [Google Scholar] [CrossRef]
  27. Biboulet, N.; Bouassida, H.; Lubrecht, A. Cross hatched texture influence on the load carrying capacity of oil control rings. Tribol. Int. 2015, 82, 12–19. [Google Scholar] [CrossRef]
  28. Pettersson, U.; Jacobson, S. Textured surfaces in sliding boundary lubricated contacts-mechanisms, possibilities and limitations. Tribol.—Mater. Surf. Interfaces 2007, 1, 181–189. [Google Scholar] [CrossRef]
  29. Schneider, J.; Braun, D.; Greiner, C. Laser textured surfaces for mixed lubrication: Influence of aspect ratio, textured area and dimple arrangement. Lubricants 2017, 5, 32. [Google Scholar] [CrossRef]
  30. Kovalchenko, A.; Ajayi, O.; Erdemir, A.; Fenske, G.; Etsion, I. The effect of laser surface texturing on transitions in lubrication regimes during unidirectional sliding contact. Tribol. Int. 2005, 38, 219–225. [Google Scholar] [CrossRef]
  31. Wos, S.; Koszela, W.; Dzierwa, A.; Pawlus, P. Effects of operating conditions and pit area ratio on the coefficient of friction of textured assemblies in lubricated reciprocating sliding. Materials 2022, 15, 7199. [Google Scholar] [CrossRef] [PubMed]
  32. Codrignani, A.; Frohnapfel, B.; Magagnato, F.; Schreiber, P.; Schneider, J.; Gumbsch, P. Numerical and experimental investigation of texture shape and position in the macroscopic contact. Tribol. Int. 2018, 122, 46–57. [Google Scholar] [CrossRef]
  33. Bhushan, B. Introduction to Tribology; John Wiley & Sons: New York, NY, USA, 2013. [Google Scholar] [CrossRef]
  34. Zhang, H.; Zhang, D.; Hua, M.; Dong, G.; Chin, K. A study on the tribological behavior of surface texturing on babbitt alloy under mixed or starved lubrication. Tribol. Lett. 2014, 56, 305–315. [Google Scholar] [CrossRef]
  35. Saeidi, F.; Meylan, B.; Hoffmann, P.; Wasmer, K. Effect of surface texturing on cast iron reciprocating against steel under starved lubrication conditions: A parametric study. Wear 2016, 348, 17–26. [Google Scholar] [CrossRef]
  36. Pawlus, P.; Reizer, R. Functional importance of honed cylinder liner surface texture: A review. Tribol. Int. 2022, 167, 107409. [Google Scholar] [CrossRef]
Figure 1. Experimental setup.
Lubricants 12 00022 g001
Figure 2. Lubricating conditions: (a) immerged lubrication, (b) limited lubrication.
Lubricants 12 00022 g002
Figure 3. Optical images of (a) pin, (b) US disk surface and (c) TS disk surface. (d) White-light profile of a single channel.
Lubricants 12 00022 g003
Figure 4. White-light profilometry images of (a) US, (b) TS, (c) TS-MD, (d) TS-HD, (e) TS-LA, (f) TS-HA.
Lubricants 12 00022 g004
Figure 5. Material ratio curve of surfaces with different (a) texture depth and (b) texture area density.
Lubricants 12 00022 g005
Figure 6. Schematic representation of roughness parameter set in (a) material ratio curve, (b) the probability material ratio curve for textured surface with rectangular cross section.
Lubricants 12 00022 g006
Figure 7. Friction coefficient plotted against the sliding speed for the surfaces with different texture depth under (a) immerged lubrication, (b) limited lubrication.
Lubricants 12 00022 g007
Figure 8. Friction coefficient plotted against the sliding speed for the surfaces with different texture area density under (a) immerged lubrication, (b) limited lubrication.
Lubricants 12 00022 g008
Figure 9. Friction coefficient plotted against the roughness parameters (a) S a and (b) S p q (average sliding speed = 1.25 mm/s, immerged lubrication).
Lubricants 12 00022 g009
Figure 10. Schematic model for contact under boundary or mixed lubrication.
Lubricants 12 00022 g010
Figure 11. The comparison ratio R c o f of friction coefficient plotted against the sliding speed for surfaces with different (a) texture depth and (b) texture area density.
Lubricants 12 00022 g011
Figure 12. The comparison ratio R c o f plotted against (a) the reformed core fluid retention index S c i * and (b) the reformed valley fluid retention index S v i * .
Lubricants 12 00022 g012
Figure 13. Schematic model for frictional effect of textures under limited lubrication. (a) US at low speed, (b) US at high speed, (c) TS at low speed, (d) TS at high speed.
Lubricants 12 00022 g013
Table 1. Texture design parameters.
SurfaceTextureTexture Depth (µm)Texture Area Density (%)
USNo----
TSYes115
TS-MDYes415
TS-HDYes715
TS-LAYes17.5
TS-HAYes130
Table 2. Surface roughness parameters.
Surface S a (µm) S q (µm) S p q (µm) S b i * S c i * S v i *
US0.270.340.240.581.710.18
TS0.420.600.280.551.810.49
TS-MD0.530.950.260.581.851.02
TS-HD0.962.310.290.611.832.31
TS-LA0.260.410.250.581.740.32
TS-HA0.620.840.320.552.460.38
Disclaimer/Publisher’s Note: The statements, opinions and data contained in all publications are solely those of the individual author(s) and contributor(s) and not of MDPI and/or the editor(s). MDPI and/or the editor(s) disclaim responsibility for any injury to people or property resulting from any ideas, methods, instructions or products referred to in the content.

