1. Introduction
Copper alloys are widely used in the manufacture of condenser tubes for ocean platforms due to their good corrosion resistance [
1,
2,
3]. However, corrosion failure often occurs during long-term service, which reduces the service life of the condenser tube [
4]. In order to improve the corrosion resistance of condenser tubes, some surface modification technologies are used to fabricate coatings, such as electroplating and thermal spraying [
5,
6,
7].
In recent decades, laser cladding has been widely used to fabricate coatings due to its advantages of high efficiency and low cost [
8,
9,
10,
11,
12]. As a coating material, a single metal powder or alloy powder plays an indispensable role in laser cladding technology [
13,
14]. During the process of laser cladding, some self-fluxing powders, such as Fe-based, Ni-based and Co-based ones and high-entropy alloys, are widely used [
15,
16,
17,
18,
19,
20]. Of these, Ni-based powder is the most widely used during the process of laser cladding because of its good wear resistance, good corrosion resistance and moderate price [
21]. Many researchers have prepared coatings on the surface of copper alloys via laser cladding technology. Bysakh et al. [
22] used a CO
2 laser to obtain a cladding layer of a Cu-Fe-Al-Si alloy on the surface of a copper alloy; however, this coating had some defects. Li et al. [
23] prepared a Ni60 alloy coating on the surface of aluminum bronze via supersonic flame spraying and then performed laser remelting at a laser power of 3.2 kW with a CO
2 laser. Although a cladding layer with good metallurgical bonding to the substrate was obtained, bubbles still appeared due to the molten pool disturbance. There are many factors affecting the quality of laser cladding, including the laser power, scanning speed, powder feeding rate and preheating temperature [
24,
25,
26,
27]. In addition, the preheating temperature is one of the key factors of laser cladding that has been studied by many scholars [
28,
29,
30,
31]. Although the preheating temperatures of different substrates have been studied, there are few studies about the preheating temperature of copper substrate. Because of the higher thermal conductivity and reflectivity of copper substrate, the selection of the preheating temperature is particularly important to fabricate a good coating using a laser.
In this paper, four different preheating temperatures (100, 200, 300 and 400 °C) were selected to fabricate a coating on a copper substrate. The macroscopic morphology and dilution rate were studied. The phases, microstructure, elemental distribution and properties of the four coatings were investigated using SEM, XRD, EDS, a Vickers microhardness meter, a wear tester and an electrochemical workstation. Meanwhile, the microstructure evolution of the four coatings is discussed.
2. Experimental Conditions
2.1. Materials
Copper alloy is used as the substrate; its size is 50 × 30 × 10 mm and its composition is shown in
Table 1. Ni-based alloy powder is used as the cladding material; its composition is shown in
Table 2. The mass fractions of the Fe, Cr and WC elements are 12.0%, 12.0% and 5.0%, respectively. There are small amounts of the C, B and Si elements.
Figure 1 is an SEM micrograph of the Ni-based alloy powder. It can be seen that the shape of most particles is nearly spherical and the surface is smooth. There are a few irregular particles with the shapes resembling a block or strip. Additionally, some particles with small sizes have tended to gather together.
2.2. Methods
The device was a CO2 laser with a continuous mode and the parameters are as follows: laser power 1.4 kW, laser beam diameter 3.0 mm, scanning speed 2 mm/s and overlapping ratio 30%. The substrate preheating temperatures were 100, 200, 300 and 400 °C, respectively. After laser cladding, the coatings were cut into 10 × 10 × 10 mm samples. After the samples were buffed and polished, a ferric chloride solution was used to etch the cladding coating for 10 s. Then, the samples were observed using optical microscopy and scanning election microscopy (TESCAN MIRA). At the same time, the element distribution was analyzed via EDS. The phases were detected by X-ray diffraction (TD-3500). The microhardness was tested using a Vickers microhardness meter with a load of 50 gf at 15 s. The microhardness was measured from the top of the Ni-based coating to the copper substrate and each point was repeated five times at the same height. The friction and wear properties were tested using a reciprocating fatigue friction and wear tester (MGW-02) with a tip force of 10 N and a friction frequency 2 Hz. An experiment testing the electrochemical corrosion was also carried out to investigate the corrosion resistance of cladding coatings. A 3.5% NaCl solution was used as the electrolyte in a CHI600E electrochemical workstation.
3. Results
3.1. Macroscopic Morphology and Dilution Rate
Figure 2 shows the macroscopic morphology of coatings preheated at four temperatures (100, 200, 300 and 400 °C). The four coatings can be successively fabricated on copper substrate but there are some pores and cracks on the surface.
The dilution rate is an important index to judge the performance of a coating. A low dilution rate is helpful to improve the coating’s properties. The molten pool depth and height of the coating are two parameters to measure dilution rate, as shown in
Figure 3. The dilution rate can be calculated using Equation (1).
In Equation (1), η is the dilution rate, Depth is the average depth of the coating’s molten pool, and Height is the average height of the coating.
Table 3 shows the height, molten pool depth and dilution rate of the four coatings with different preheating temperatures (100, 200, 300 and 400 °C). At the four different preheating temperatures, the coatings’ heights are 0.27, 0.48, 0.39 and 0.27 mm, respectively. The depths of the molten pool are 0.1, 0.12, 0.16 and 0.18 mm, respectively. With the increasing preheating temperature, the coatings’ heights first increase and then decrease. However, the depths of the molten pool increase gradually along with the increase in the preheating temperature. The main reason for this is that higher preheating temperatures make the substrate easier to melt and so it forms a molten pool with higher temperatures, which increases the depths of the molten pool. At the four different preheating temperatures, the dilution rates were 27%, 20%, 29% and 40%, respectively. The coating with a preheating temperature of 200 °C has the lowest dilution rate (20%), which suggests that it can maintain the properties of the coating and reduce the mixing of elements between the substrate and coating.
3.2. Phases
The X-ray diffraction patterns of the coatings preheated at four different temperatures (100, 200, 300 and 400 °C) are shown in
Figure 4. When the preheating temperature was 100 °C, the main phases are γ (Fe, Ni), WC, W
2C, Ni
3B, and M
7C
3 (M=Fe, Cr). When the preheating temperature was 200 °C, the higher preheating temperature increases the heat of the molten pool and prolongs the solidification time of the molten pool. Elements such as Ni, Cr and Fe have enough time to form a reinforced phase. Therefore, a new phase, Cr
0.09Fe
0.7Ni
0.21, appears. When the preheating temperatures are 300 and 400 °C, the amount of some elements decreases gradually due to the higher temperature of molten pool, which results in the decrease in WC, W
2C and boride. At the same time, a large number of substrate elements enter into the coating and form Cu
0.64Zn
0.36 and Ni
2W
4C phases.
3.3. Microstructure
Figure 5 depicts the microstructures of coatings preheated at four temperatures (100, 200, 300 and 400 °C).
Figure 5(a1,b1,c1,d1) shows the microstructure of the coatings’ top regions. When the preheating temperature was 100 °C, there are a large number of equiaxed crystals. When the preheating temperatures were 200, 300 or 400 °C, some cellular crystals appear in the top regions. In addition, the coating preheated at 200 °C has fine cellular crystals. As shown in
Figure 5(a2,b2,c2,d2), the microstructure of the middle position is mainly a dendrite structure. In addition, when the preheating temperature was 200 °C, the dendrite crystals are fine and uniform. With the increase in preheating temperature, the secondary dendrites grow gradually on the primary dendrites, as shown in
Figure 5(c2). When the preheating temperature was 400 °C, the dendrite crystals become larger. At the bottom of the four coatings, when the preheating temperature was 100 °C, some small holes appear in the bonding region, as shown in
Figure 5(a3), which decreases the binding strength between the coating and the substrate. With the increase in preheating temperature, the holes gradually disappear, as shown in
Figure 5(b3,c3,d3).
Table 4 shows the percentage of element atoms at the P1–P4 points in the four coatings with different preheating temperatures (100, 200, 300 and 400 °C). According to the percentage of element atoms at the P1 point, there are large amounts of Fe and Ni in the coating with the preheating temperature of 100 °C that form the supersaturated solid solution of the γ (Fe, Ni) phase. Some C atoms form WC and W
2C and others form the Fe
7C
3 phase. Compared with the P1 point, the percentage of element atoms at the P2 point shows that the content of Cr increases, which becomes Cr
7C
3 phase. At the same time, there are a few borides. The percentage of element atoms at the P3 and P4 points indicates that a large number of Cu and Zn elements appear at P3 and P4, which is mainly the Cu
0.64Zn
0.36 phase. With the increase in preheating temperature, more and more elements from the substrate enter into the molten pool. This is consistent with the results of
Figure 4.
Figure 6 depicts the SEM micrograph and EDS element line scanning results for the four coatings with different preheating temperatures (100, 200, 300 and 400 °C). From the substrate to the coating, the copper element decreases gradually, whereas the Ni element increases gradually. In the diffusion zone, Cu and Ni dissolve each other and form good metallurgical bonding. At the same time, the width of the diffusion zone increases with the increase in preheating temperature. When the preheating temperature was 200 °C, the coating has the least amount of Cu. More of the Cu element appears in the diffusion zone, which also decreases the relative amount of the Ni element. The other elements in the substrate and coating, such as Fe, Al and Cr, also enter into the diffusion zone. When the preheating temperature is higher, more of the Cu element enters into the coating, as shown in
Figure 6c,d.
3.4. Microhardness
Figure 7 shows the microhardnesses of the four coatings’ cross sections. The maximum microhardness values of four the coatings are 680.7, 1069.3, 815.2 and 760.9 HV
0.5, respectively. The values for the average microhardness are 614.3, 941.6, 668.1 and 663.1 HV
0.5, respectively. As a whole, the microhardness in the strengthening layer is stable and the fluctuation is not very large. At the binding region, the microhardness decreases quickly. When the preheating temperature was 200 °C, the coating has the highest average microhardness (941.6 HV
0.5), which is caused by the reinforced phases M
7C
3, WC, Ni
3B and Cr
0.09Fe
0.7Ni
0.21 and the fine crystals in the top region. However, when the preheating temperature was 300 °C, some new phases, Cu
0.64Zn
0.36 and Ni
2W
4C, appear due to entrance of Cu and Zn elements from copper substrate, which decreases the coating’s microhardness.
3.5. Wear Resistance
The friction coefficients of four coatings with different preheating temperatures (100, 200, 300 and 400 °C) are shown in
Figure 8. The coating that had a preheating temperature of 200 °C has the smallest friction coefficient (around 0.1), which only has a small fluctuation, whereas the coating that had a preheating temperature 400 °C has the largest friction coefficient (around 0.3) and fluctuation. The friction coefficients of the coatings preheated at 100 and 300 °C fluctuate around 0.2 and also have large fluctuations. From the above analysis, the smallest friction coefficient (around 0.1) in the 200 °C preheated coating may be due to its lower surface roughness and fine crystals.
Figure 9 shows the wear rates of coatings preheated at different temperatures (100, 200, 300 and 400 °C). The wear rates of coatings preheated at 100, 200, 300 and 400 °C are 9.7, 4.9, 12.5 and 13.3 × 10
−5 mm
3·N−
1·m
−1, respectively. The wear rate of the coating preheated at 200 °C is the lowest, only about one-third of the wear rate of the coating preheated at 400 °C. The wear rate of copper substrate is 4.3 × 10
−3 mm
3·N
−1·m
−1. Compared with the substrate, the wear resistance of the four coatings has an obvious improvement due to the existence of the reinforced phases, such as WC, Ni
3B, M
7C
3 (M=Fe, Cr) and Cr
0.09Fe
0.7Ni
0.21. Additionally, when the preheating temperature was 200 °C, the coating has more fine crystals in the top region.
Figure 10 depicts the morphology of the friction and wear of coatings preheated at different temperatures (100, 200, 300 and 400 °C). It can be seen that the coating that had a preheating temperature 200 °C has the smallest depth and width of grinding crack. More M
7C
3, WC, W
2C and borides improve the coating hardness and reinforced phase content. Meanwhile, the fine and uniform crystals are also helpful to enhance the wear resistance, which forms abrasive wear and makes the wear volume decrease.
3.6. Corrosion Resistance
Figure 11 shows the polarization curves of coatings preheated at four temperatures (100, 200, 300 and 400 °C). The polarization curves of the four coatings present a similar trend and show the certain passivation behavior. When the preheating temperatures were 100, 200, 300 and 400 °C, the free corrosion potentials are −0.708, −0.690, −0.893 and −0.817 V, respectively. The minimum values of corrosion current density are 3.26 × 10
−5, 2.34 × 10
−7, 4.02 × 10
−6 and 4.21 × 10
−6 mA·mm
−2, respectively. Moreover, the corrosion current density of the copper substrate is 1.14 × 10
−6 mA·mm
−2, which is less than that of the coatings preheated at 100, 300 or 400 °C and more than that of the coating preheated at 200 °C. Therefore, the coating preheated at 200 °C has the lowest corrosion current density (2.34 × 10
−7 mA·mm
−2), which indicates that the coating has the best corrosion resistance due to a large amount of Cr
7C
3. This phase improves the corrosion resistance. Although the coatings with preheating temperatures of 300 and 400 °C have a Cr
7C
3 phase, a lot of Cu and Zn elements diffuse into the coating and reduce the corrosion resistance.
4. Discussion
Ni-based alloy coatings with different preheating temperatures (100, 200, 300 and 400 °C) were fabricated on copper substrate. Due to the difference in preheating temperature, the microstructure, quality and properties of the coatings are different. Therefore, the phases, microstructure, microhardness, wear resistance and corrosion resistance were investigated. The microhardnesses of the coatings were 614.3, 941.6, 668.1 and 663.1 HV0.5 under preheating at temperatures of 100, 200, 300 and 400 °C, respectively. The average hardness is highest at the preheating temperature of 200 °C, which is caused by the reinforcing phases such as M7C3, WC, Ni3B and Cr0.09Fe0.7Ni0.21 and the diffusion of fine grains and fewer Cu and Zn elements in the top region. The wear rates of the four coatings were 9.7, 225, 4.9, 12.5 and 13.3 × 10⁻⁵ mm3·N−1·m−1, respectively. The 200 °C preheated coating has the lowest wear rate, which is due to the correct preheating temperature to produce finer and more uniform crystals in the top area of the coating. In the electrochemical test, the coating preheated at 200 °C has the lowest corrosion current density (2.34 × 10⁻⁷ mA·mm−2), which is due to the fact that the coating is less affected by the diffusion of Cu and Zn elements and the presence of a large amount of Cr7C3 in the coating, resulting in the best corrosion resistance.
4.1. Effect of Preheating Temperature on Pore and Crack
During the laser cladding process, if the gas in molten pool does not escape in time, some pores will appear in the coating. The existence of pores will reduce the mechanical and corrosion resistance of a coating. According to the Stocks equation [
32], the gas overflow in the molten pool is mainly related to the viscosity of the liquid metal. With an increase in temperature, the viscosity of the liquid metal decreases and the gas can more easily escape from the molten pool.
Figure 12 shows the schematic diagram of gas overflow in the molten pool during the laser cladding process. At lower preheating temperature, the viscosity is larger, which makes it difficult for the gas to escape and results in some pores being left in the coating, as shown in
Figure 12a. This is in accordance with the result shown in
Figure 5(a3). In contrast, if the preheating temperature is higher, the gas can more easily escape, as shown in
Figure 12b,c. Therefore, no pores appeared in the cladding coating when the preheating temperatures were 200, 300 and 400 °C.
When the preheating temperature was 400 °C, there were some cracks at the bottom of the cladding coating, as shown in
Figure 13. Higher preheating temperatures increase the heat accumulation in the molten pool, which brings larger thermal stress and shrinkage between the different phases. When the thermal stress is higher than the tensile strength of the cladding coating during the cooling of the molten pool, cracks may appear in some places, such as the crack in
Figure 13.
4.2. Effect of Preheating Temperature on Microstructure
The microstructure evolution under four preheating temperatures is shown in
Figure 14. When the preheating temperature is 100 °C, a large number of equiaxed crystals form in the top part of cladding coating, which do not grow due to the lower preheating temperature. With the decrease in preheating temperature, the crystals begin to grow as dendrite crystals in the middle of the cladding coating. When the preheating temperature is 200 °C, because of the increase in preheating temperature, the higher temperature promotes crystals to grow as fine cellular crystals in the top of the coating. When the preheating temperatures are 300 and 400 °C, although the microstructure of top regions is also cellular, the number of cellular crystals is more than that of the coating preheating at 200 °C. Because of the larger cooling rate and mutual inhibition, the cellular crystals are smaller. In the middle regions, a large amount of heat accumulates in the molten pool and the secondary dendrites grow on the basis of the primary dendrites. However, when the preheating temperature is 400 °C, the higher preheating temperature causes more substrate elements into the liquid molten pool and appear in the Cu
0.64Zn
0.36 phase, which destroys the growth of the primary dendrites and secondary dendrites.
5. Conclusions
(1) Four Ni-based alloy coatings with different preheating temperatures were successfully fabricated on the copper substrate. When the preheating temperature is 100 °C, there are some pores at the bottom of coating. When the preheating temperature is 400 °C, the effect of thermal stress is too great and a few cracks appear. At the four different preheating temperatures, the dilution rates were 27%, 20%, 29% and 40%, respectively. The coating with a preheating temperature of 200 °C has the lowest dilution rate (20%), which can maintain the property of the coating and reduces the mix of elements between the substrate and coating.
(2) When the preheating temperature is 100 °C, the main phases are γ (Fe, Ni), WC, W2C, Ni3B and M7C3 (M=Fe, Cr). When the preheating temperature is 200 °C, a new phase Cr0.09Fe0.7Ni0.21 appears. When the preheating temperatures are 300 and 400 °C, a large number of substrate elements enter into the coating and form Cu0.64Zn0.36 and Ni2W4C phases. The microstructure of the cladding coating is mainly composed of cellular, dendrite and planar crystals. The coating preheated at 200 °C has fine and uniform crystals.
(3) At the four different preheating temperatures, the values of average microhardness for the four coatings are 614.3, 941.6, 668.1 and 663.1 HV0.5, respectively. When the preheating temperature is 200 °C, it has the maximum average microhardness, which is caused by the reinforced phases M7C3, WC, Ni3B and Cr0.09Fe0.7Ni0.21 and the fine crystals in the top region. However, when the preheating temperature is 300 °C, some new phases (Cu0.64Zn0.36 and Ni2W4C) appear due to the entrance of Cu and Zn elements from the copper substrate, which decreases the coating’s microhardness.
(4) The friction coefficients of the four coatings are about 0.2, 0.1, 0.2 and 0.3, respectively. The coating with a preheating temperature of 200 °C has the smallest friction coefficient (around 0.1), which also has a small fluctuation, whereas the coating with a preheating temperature of 400 °C has the largest friction coefficient (around 0.3) and fluctuation. The wear rates of the coatings preheated at 100, 200, 300 and 400 °C are 9.7, 4.9, 12.5 and 13.3 × 10⁻⁵ mm3·N−1·m−1, respectively. The wear rate of the coating preheated at 200 °C is the lowest due to the existence of the reinforced phases and fine crystals.
(5) When the preheating temperature is 100, 200, 300 and 400 °C, the corrosion potentials are −0.708, −0.690, −0.893 and −0.817 V, respectively. Moreover, the minimum values for the corrosion current density are 3.26 × 10⁻⁵, 2.34 × 10⁻⁷, 4.02 × 10⁻⁶ and 4.21 × 10⁻⁶ mA·mm−2, respectively. The coating with a preheating temperature of 200 °C has the maximum corrosion potential (−0.69 V) and the lowest corrosion current density (2.34 × 10⁻⁷ mA·mm−2), which represents the best corrosion resistance. This is due to the high amount of Cr7C3 in the coating with a preheating temperature of 200 °C and the diffusion of a smaller amount of Cu and Zn elements into the coating.


 and
and 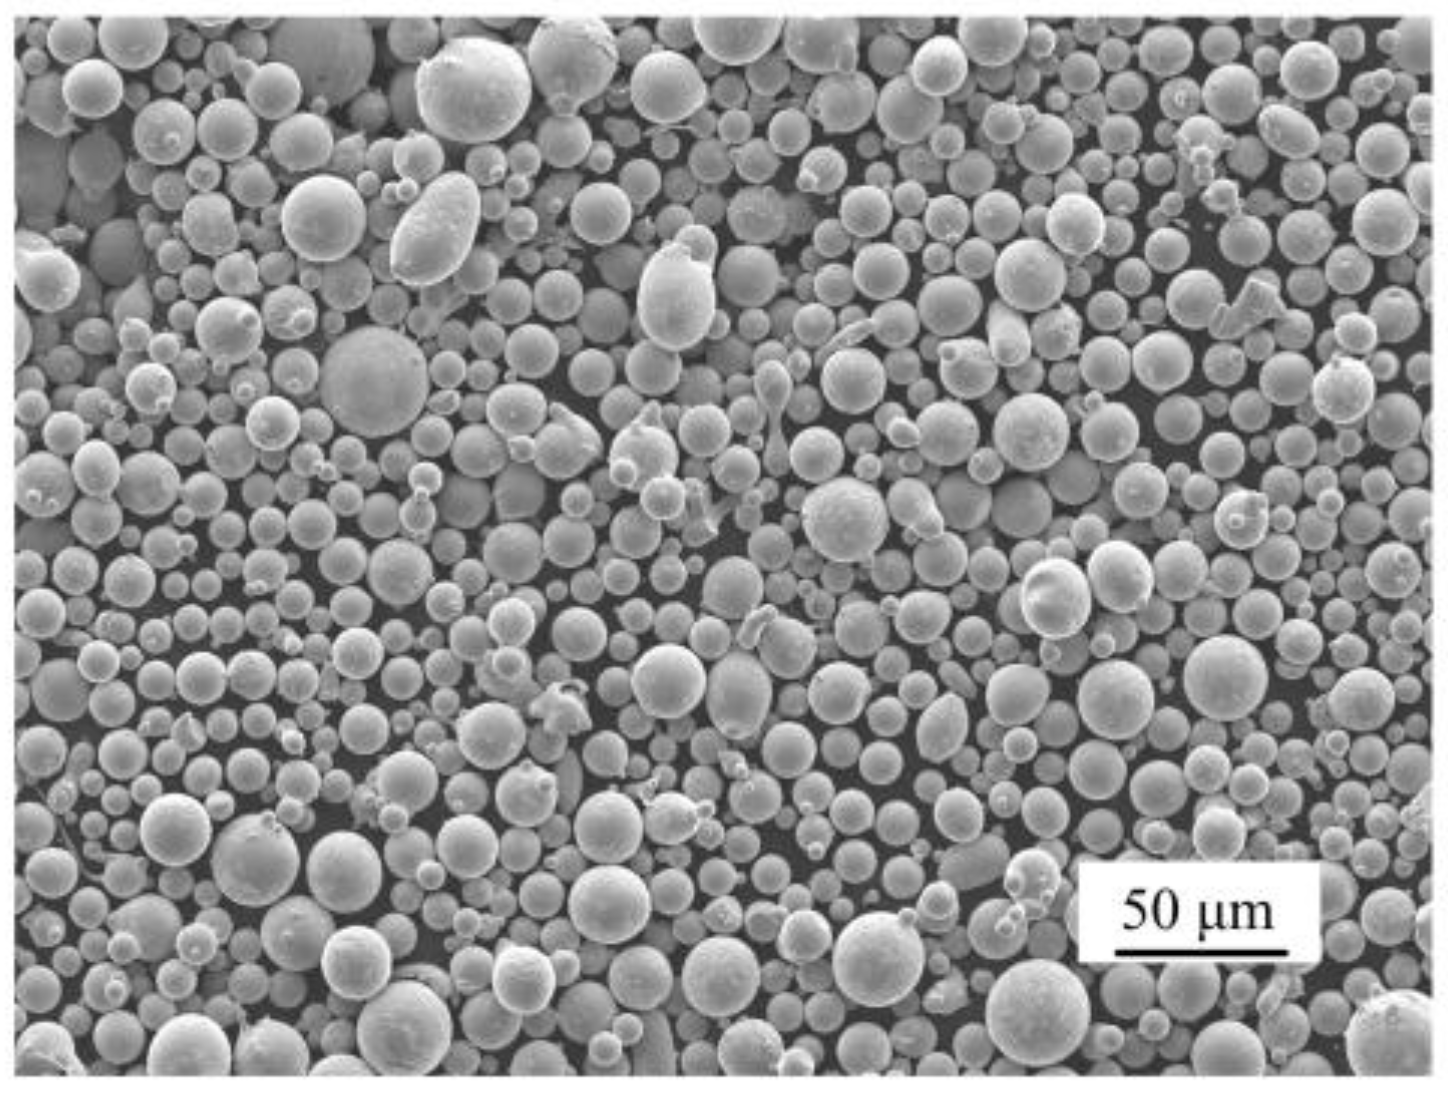


