Article

Modeling Wear and Friction Regimes on Ceramic Materials with Positive and Negative Thermal Expansion

by
Aleksandr S. Grigoriev
,
Evgeny V. Shilko
,
Andrey I. Dmitriev
* and
Sergei Y. Tarasov
Institute of Strength Physics and Materials Science of Siberian Branch Russian Academy of Sciences (ISPMS SB RAS), 2/4, pr. Akademicheskii, 634055 Tomsk, Russia
*
Author to whom correspondence should be addressed.
Lubricants 2023, 11(9), 414; https://doi.org/10.3390/lubricants11090414
Submission received: 11 August 2023 / Revised: 13 September 2023 / Accepted: 18 September 2023 / Published: 21 September 2023
(This article belongs to the Special Issue Tribology and Tribochemistry of Ceramics)

Abstract

:
Computer modeling of rubbing between two surfaces with microasperities capable of expanding or contracting under conditions of frictional heating (i.e., possessing either positive and negative coefficient of thermal expansion (CTE)) allowed for the identification of wear-and-friction regimes on model ceramic materials. Assuming that no adhesion was involved in the interaction between asperities, two wear regimes—i.e., wear-free and continuous wear—have been revealed in both materials as dependent on the applied normal stress level and sliding velocity. The effect of the normal load on wear rate was similar for both positive and negative thermal expansion ceramics. Sliding velocity has a qualitatively different effect on the wear of materials with either positive or negative thermal expansion. The results indicated that the feasibility of reconstructing wear maps was common for both positive and negative CTE ceramics in terms of dimensionless mechanical and thermophysical characteristics.

1. Introduction

Ceramic materials possess high thermal stability, wear resistance and are thus widely used for fabricating components intended for high-temperature loading conditions [1,2,3,4,5] such as sealants, bearings, gaskets, etc., [6]. Ceramics are, as a rule, brittle or quasi-brittle materials of low-surface energy whose shear strength is greatly dependent on contact pressure. In addition, ceramics are commonly characterized by poor thermal conductivity. Such a combination of characteristics must be taken into account when considering their behavior in sliding contact.
First, their ability to relieve high local stresses by nucleation and propagation of crystalline lattice defects is strongly limited. Therefore, no adaptation mechanisms connected with generation of larger scale load-carrying interfacial elements (e.g., prows, wedges, and flakes) [7,8] that would completely separate the interacting surfaces and form the actual relief of the contact zone (a set of spots of local contact of surfaces with interfacial elements) are feasible [9,10]. Correspondingly, both friction and wear of ceramic materials are determined mainly by conditions created in direct contacting between tribologically mated surfaces of the rubbing bodies. Secondly, poor thermal conductivity results in intensive frictional heating of ceramics in sliding with flash temperatures as high as 1000–1500 K [11,12,13]. In its turn, frictional heating is accompanied by thermal expansion and additional increasing of the contact stress on the real contact areas. Thermal stresses arise also at the grain or phase boundaries below the worn surfaces.
Furthermore, it should be noted that problems related to thermal stresses occurring at the interior boundaries have been widely discussed in the corresponding literature for many years, while thermal expansion of the surface asperities in their contacting in sliding and its effect on the contact stress redistribution is usually out of the scope. However, for hard and brittle ceramic materials this effect may be of more importance than for metals or polymers, for instance, whose thermal expansion stress may be compensated by thermal softening and deformation.
The intensity of contact stresses thermally induced on the contact spots is determined by coefficient of thermal expansion (CTE). The higher CTE, the higher the local thermal stress, which may surpass the material fracture toughness and cause failure of surface asperity. Controlling the CTE of materials is required when fabricating advanced ceramic materials intended for tribological applications. Additionally, this is an important task of modern material science. Tuning the CTE is a task that could be resolved by adjusting the composite structure [14] by developing material cellular architecture (metamaterials) that allows for the achievement of zero or even negative thermal expansion [15,16,17,18].
These approaches, however, cannot be efficient for ceramic materials of tribological use because of a necessity for combining low CTE with high toughness. A competitive solution may be developing ceramic composites containing both positive (PTE) and negative (NTE) thermal expansion materials. One of the obvious advantages offered by such a solution is the potential for reducing interface thermal stresses compared to those in composites prepared only from the PTE materials [19,20].
In addition, the majority of the NTE ceramics cannot boast high thermal stability and corresponding stability of their negative thermal expansion behavior at elevated temperatures, especially if taking into account high flash temperatures occurring on the small real contact areas in sliding.
The well-known, easily available, and widely used NTE material ZrW2O8 [21], with CTE = −10−5 K−1, comparable in modulus with that of metals. This NTE material was used for preparing metal matrix [22,23] and ceramic composites [24,25]. However, the thermal stability of ZrW2O8 is not high and α-ZrW208 with high NTE transforms into β-ZrW2O8 with low NTE at ~670 K and then decomposes at ~1050 K [26]. Such an instability may interfere not only with fabricating composites [27,28,29] but also strongly limits its application under conditions of intensive frictional heating [23].
More promising for tribological applications are A2M3O12-based NTE compounds, where A is the transition metal or rare earth and M is either W or Mo [30]. These compounds have higher thermal stability against phase transformations that may occur during preparation of the composites. The most promising compound in this group is Sc2W3O12, which may retain its structural stability and NTE behavior up to 1500 K [31]. Further advantages of this compound are its high stiffness and toughness that are times higher than those of ZrW2O8 and comparable to those of many commercial ceramics, such as ZrO2, SiO2, and Al2O3, that are commonly used at elevated temperatures. Such property uniformity will facilitate reducing the thermal stress in a composite, whose design will include both PTE and NTE components.
Understanding fundamental principles of mechanical contacting between NTE and PTE materials under condition of frictional heating, including micromechanisms that determine the behaviors of coefficient of friction and wear, is an important issue. The key issue here will be studying the effect of the CTE sign on the tribological characteristics under different contact pressures and sliding speeds. While there are a lot of publications devoted to this issue for PTE materials, no such publications were found for the NTE ones, plausibly because of difficulties with preparation of samples and methods of studying the in-situ interaction of asperities.
Computer modeling is widely used specifically for studying the micromechanisms and obtaining both integral characteristics such as coefficient of friction (COF) and wear rate but also the dynamics of thermomechanical processes occurring in the contact zone and related to stress redistribution and evolution of roughness.
Generally, numerical studies of wear and friction are carried out for a wide dimension range spanning from macro to nanoscale. The macromechanisms are traditionally studied using continuum numerical methods such as FEM, BEM, and MDR, as well as phenomenological models [32,33,34,35] which, however, do not allow for the understanding of the above noted micromechanisms. The nanoscale numerical studies are performed with the use of molecular dynamics and allow for the revelation of deformation and fracture mechanisms by the example of single or few surface asperities [36,37,38,39,40,41,42]. A continual approach can also be used for studying wear and deformation of standalone asperities [43,44,45]. Wear and “third body” generation in sliding is analyzed using the discrete element method [46,47]. These approaches can, however, be hardly effective to gain understanding of interacting between ensembles of asperities that represent a part of the worn surface. An alternative approach to be used for direct modeling the thermal expansion is to use the asperity-based contact models [48,49], which treat asperities as elementary units of the surface and serve to describe the interaction between surfaces as interactions between these units. The mechanical and thermal effects of worn surfaces are taken into account by specifying the asperity stiffness and seeking the solution of the thermal conduction equations, respectively. The asperity wear can be modeled with the use of local fracture criteria [50]. The advantage of this approach may be direct modeling of friction and wear on the large surface areas and big time periods in combination with correct description of stress distribution and the dependence of the effective contact area on the load [48,49].
This work utilizes an asperity-based contact model for studying contact interaction, wear, and friction on NTE material with comparison to those on PTE. The focus of this work was on revealing the ranges of applied normal load and sliding velocity, which corresponded to establishing steady friction regimes.

2. Materials and Methods

Here, we numerically studied the tangential contact of two bodies made of materials having the same mechanical and thermophysical characteristics. These materials were represented by PTE and NTE model ceramics with thermophysical and mechanical properties close to those of ZrO2 and scandium tungstate Sc2W3O12, respectively (Table 1). For ZrO2, there is a large amount of experimental data on mechanical properties, though this is not the case for the scandium tungstate. In fact, there are no data on its strength and thermal conductivity. The compressive strength shown in Table 1 is an estimation based on a comparison of the experimental hardness values of ZrO2 and Sc2W3O12. The value of the thermal conductivity was taken from considering the characteristic values of k for various tungstate’s (they vary in the range from 1 to 2) [51].
Data on ceramic material strength, as noted in the literature, refer mainly to macroscopic samples. At the same time, it is known that not only the absolute values of strength but also their ratios (in particular, the value of b) depend on the scale of the samples. Local (meso- or microscale) values of the parameter b can be significantly lower than those of macroscopic samples, since the latter may contain large internal defects. Therefore, Table 1 shows the range of the values of the parameter b from 5 (typical macroscopic strength ratio for many ceramics) to 1 (reasonable lower limit). Since internal defects have the greatest effect on the strength of the material under tensile conditions, the variation of the parameter b was performed by varying the tensile strength σtens (Table 1 shows the corresponding range of values).
The choice of ZrO2 and Sc2W3O12 for the numerical study and comparative analysis is substantiated by the following reasons. First, they are characterized by the stability of their structure and properties over a wide temperature range from the room temperature to 1300 °C. Second, they have rather high values of elastic moduli and strength, which allow using them in highly loaded friction units. These ceramic materials also have close values of specific heat capacity and thermal conductivity, which make them especially promising as components of Sc2W3O12/YSZ composites intended for various high-temperature applications [52]. Finally, the CTE values of these ceramics are close in absolute value but have the opposite sign (Sc2W3O12 is NTE material, while ZrO2 is a traditional PTE material).
Theoretical investigations into wear on PTE and NTE ceramic materials have been performed utilizing a numerical thermomechanical model that can be related to a group of bearing-area (asperity-based) contact models [48,49]. Two bodies were contacting with each other by means of asperities on their surfaces (Figure 1).
Each surface was characterized by the following roughness parameters:
R a = 1 / m i = 1 m Y i Y m e a n ,
R max = max Y i Y j , i , j = 1 m ,
where m is the number of surface asperities in the model, Y i is the position of i-th asperity tip along the Y-axis, Y m e a n = 1 / m i = 1 m Y i is the mean position of asperity tip along the Y-axis.
The initial surfaces were characterized by the same initial values of the statistical roughness. Particular initial values of asperity height ( Y 0 i ) were set out using a stochastic algorithm, which provided prescribed initial values of Ra and Rmax. The initial values of the asperity effective contact area ( S 0 i ) were set out randomly within the ranges limited by prescribed minimum and maximum values [ S 0 min , S 0 max ]. The limits S 0 min and S 0 max were the same for both surfaces.
All asperities had the same width Δx, i.e., the horizontal step of the roughness was kept constant along the X-axes of both surfaces. Each of the asperities was capable of experiencing deformation independently of the other ones and was characterized by the following geometrical parameters: asperity center position along the X-axis; position of the asperity tip along the Y-axis; and effective contact area S. The latter has the meaning of the real contact area as formed between the asperity and plane rigid punch. Note that the instant value of S can change during sliding of the punch along the asperity, and its variation depends on a number of factors, including form-factor of asperity, smaller scale roughness, applied pressure, etc. That is why S would be rather an effective integral parameter to characterize a time average value of the real contact area.
The keystones of the asperity-based thermomechanical model are as follows:
(1) Adhesion between the surfaces was not considered because ceramic materials have low surface energy. An assumption was made that interaction between the asperities was limited to only opposite asperities, which contacted with zero gap between their tips. The force of interaction between two opposite asperities included two components: normal interaction force F N i along the Y-axis (resistance to compression) and tangential interaction force F τ i along the X-axis. The latter is a complex one as it consists of two components: the shear resistance force F s h i limited above dry friction force and the asperity bending resistance force F b e n d i . All the interaction forces are formulated in the approximation of linear elastic materials.
(2) Dry friction of opposite asperities generates heat on the real contact areas so that the asperities experience thermal expansion (including the change in the positions of their tips along the Y-axis). Local heating is accompanied by establishing subsurface thermal gradients. The hear redistribution is computed by seeking a solution to the corresponding heat conductance equation.
(3) Asperities are assumed to be destructible with the fracture criterion in the form of the two-parameter Drucker–Prager criterion [57,58], which is widely used to determine the limiting state of brittle and quasi-brittle materials including ceramics. Fracture of asperity results in removal of a material fragment from the asperity. The height and volume of the asperity fragment removed is determined by overlapping between the asperities.
(4) Wear debris are carried away from the contact zone during relative tangential displacement of the bodies by a distance Δx (surface roughness step) and would have no effect on further course of surface interaction.
Further details on the asperity-based thermomechanical model are provided in Appendix A.
Contact interaction of the surfaces is provided by loading them with external compression force Fload applied to the upper body along the Y-axis (Figure 1). The lower boundary of the lower body is fixed with respect to both axes (X and Y). A periodic boundary condition along the X-axis was applied to the bodies.
Sliding friction was modeled by discretely moving the upper body over the lower one along the X-axis at a constant sliding speed Vsl (Figure 1). The discreteness of the horizontal movement of the upper body implies that each asperity of the upper body is above some asperity of the lower body during the time interval Δtcontact = Δx/Vsl. During the time Δtcontact, the asperity–asperity interaction force and the heat release power are calculated. Additionally, the heat conduction equation is solved. A change in the temperature of asperities leads to a change in their heights. Thus, during Δtcontact, the ensemble of contacts is in a state of dynamic equilibrium. At the end of the time interval Δtcontact, the upper body shifts by Δx along the X-axis so that the whole system of asperity contacts is fully modified.
Vertical movement of the upper body is calculated from its inertia and the static force equilibrium. The static force equilibrium condition means that the magnitude of the applied force Fload is equal to the lower body reaction force Frepulse: F L o a d = F r e p u l s e = F N = i = 1 m F N i , where F N i is the normal interaction force in the pair of i-th opposite asperities. The vertical position of the upper body according to the static force equilibrium condition F L o a d = F N is limiting one, achieved in the absence of tangential movement. During the tangential movement of the upper body, its real vertical position “lags behind” the limiting (equilibrium) value due to inertial effect caused by the finite height and mass of the body. To take into account the inertial effect, the velocity of the vertical displacement of the upper body is calculated as follows: Vy = (YlimitYcur)/tinertia, where Ycur is the current Y-coordinate of the upper surface of the upper body, Ylimit is its equilibrium value corresponding to the condition F L o a d = F N , and tinertia is the time parameter characterizing the inertia of the upper body. The value of tinertia was assumed to be equal to twice the travel time of the longitudinal elastic wave from the lower (contact) surface to the upper surface of the upper body: t i n e r t i a = 2 L u p p e r / V P , where Lupper is the height of the upper body, VP is the velocity of the longitudinal elastic wave in the material of the upper body. The value of Ylimit is determined at each time step to calculate the current value of Vy.
The linear dimensions of each body were 100Δx along the X-axis (the contact surface of each body contains 100 asperities) and 200Δx along the Y-axis. The statistical parameters of the initial roughness of the contact surfaces were also the same: Δx = 25 μm, Rmax ≈ 1.2 μm, Ra ≈ 0.3 μm. The same value of the local COF (coefficient of dry friction of a pair of interacting asperities) μ = 0.1 was used for PTE and NTE ceramics.
The effect of the loading parameters on friction steadiness, wear rate, and COF was studied. The following parameters were varied:
  • The normal pressure σLoad = FLoad/Sext, where Sext = mx)2 is the area of the outer surface of the bodies.
  • The sliding velocity of the upper body is Vsl.
As soon as the wear rate is determined, among others, by the strength characteristics, the tensile strength σtens was considered as a parameter varying in the ranges as shown in Table 1.
The stability of sliding friction was analyzed using the Ymean(t) and COF(t) dependencies for different values of applied normal pressure σLoad and sliding velocity Vsl. Here, Ymean is the mean coordinate of the bottom body asperity tips, and COF is the coefficient of friction COF = F τ / F L o a d = i = 1 m F τ i / F L o a d , were F τ i is the tangential interaction force in the pair of i-th opposite asperities.

3. Results

The study showed that thermally induced change in the linear dimensions (and particularly the height) of asperities significantly affected the process of friction and wear, and this effect was qualitatively different for either PTE or NTE ceramics. Linear dimensions of asperities change as a result of frictional heat release (see Equation (A11) in Appendix A) and following heat removal according to heat flux redistribution (Equation (A12) in Appendix A). Not only does the heat sink from the surface into the contacting bodies but it also redistributes temperature between the asperities; furthermore, an equalization of their temperatures also occurs. The heat flux balance includes components such as (i) heating real contact areas, (ii) heat removal, and (iii) temperature equalization. The balance of these thermal processes determines the mean change of the asperity height Δ Y t h e r m m e a n = 1 / m i = 1 m Δ Y t h e r m i ( Δ Y t h e r m i is the thermally induced asperity height change), as well as the homogeneity of the Δ Y t h e r m i distribution on the worn surface.
The average heat release power is controlled by the values of the applied pressure σLoad and sliding velocity Vsl, while the homogeneity of the worn surface heating is determined by a specific number of local surface contacts (the number of contacts per unit length of the surface) and distribution of contact pressures on the surface. These characteristics depend on both thermal expansion of the asperities and their wear (local failure when the condition (A15) is met). As shown by [50], in which the authors examine classical PTE materials, thermal expansion contributes to enhancing wear by reducing the specific number of contacts and thus increasing the nonuniformity of local contact pressure distribution. For NTE materials, thermal contraction of asperities, on the contrary, suppresses wear due to asperity height leveling, increasing the real contact area and more even distribution of contact pressure. However, the contribution of wear to the worn surface leveling depends on the material characteristics, primarily on the strength properties of the material (in particular, on the parameter b = σ c o m p / σ t e n s ).
Therefore, loading conditions such as σLoad and Vsl, as well as the material properties (including the strength parameter b), may be responsible for the established regime of friction and wear in friction pairs composed of PTE or NTE materials. The numerical study carried out in this work was aimed at revealing the contribution of each of these parameters to the frictional behavior of brittle PTE and NTE materials (including the possibility of implementing a wear-free friction mode).

3.1. Friction and Wear of PTE Material

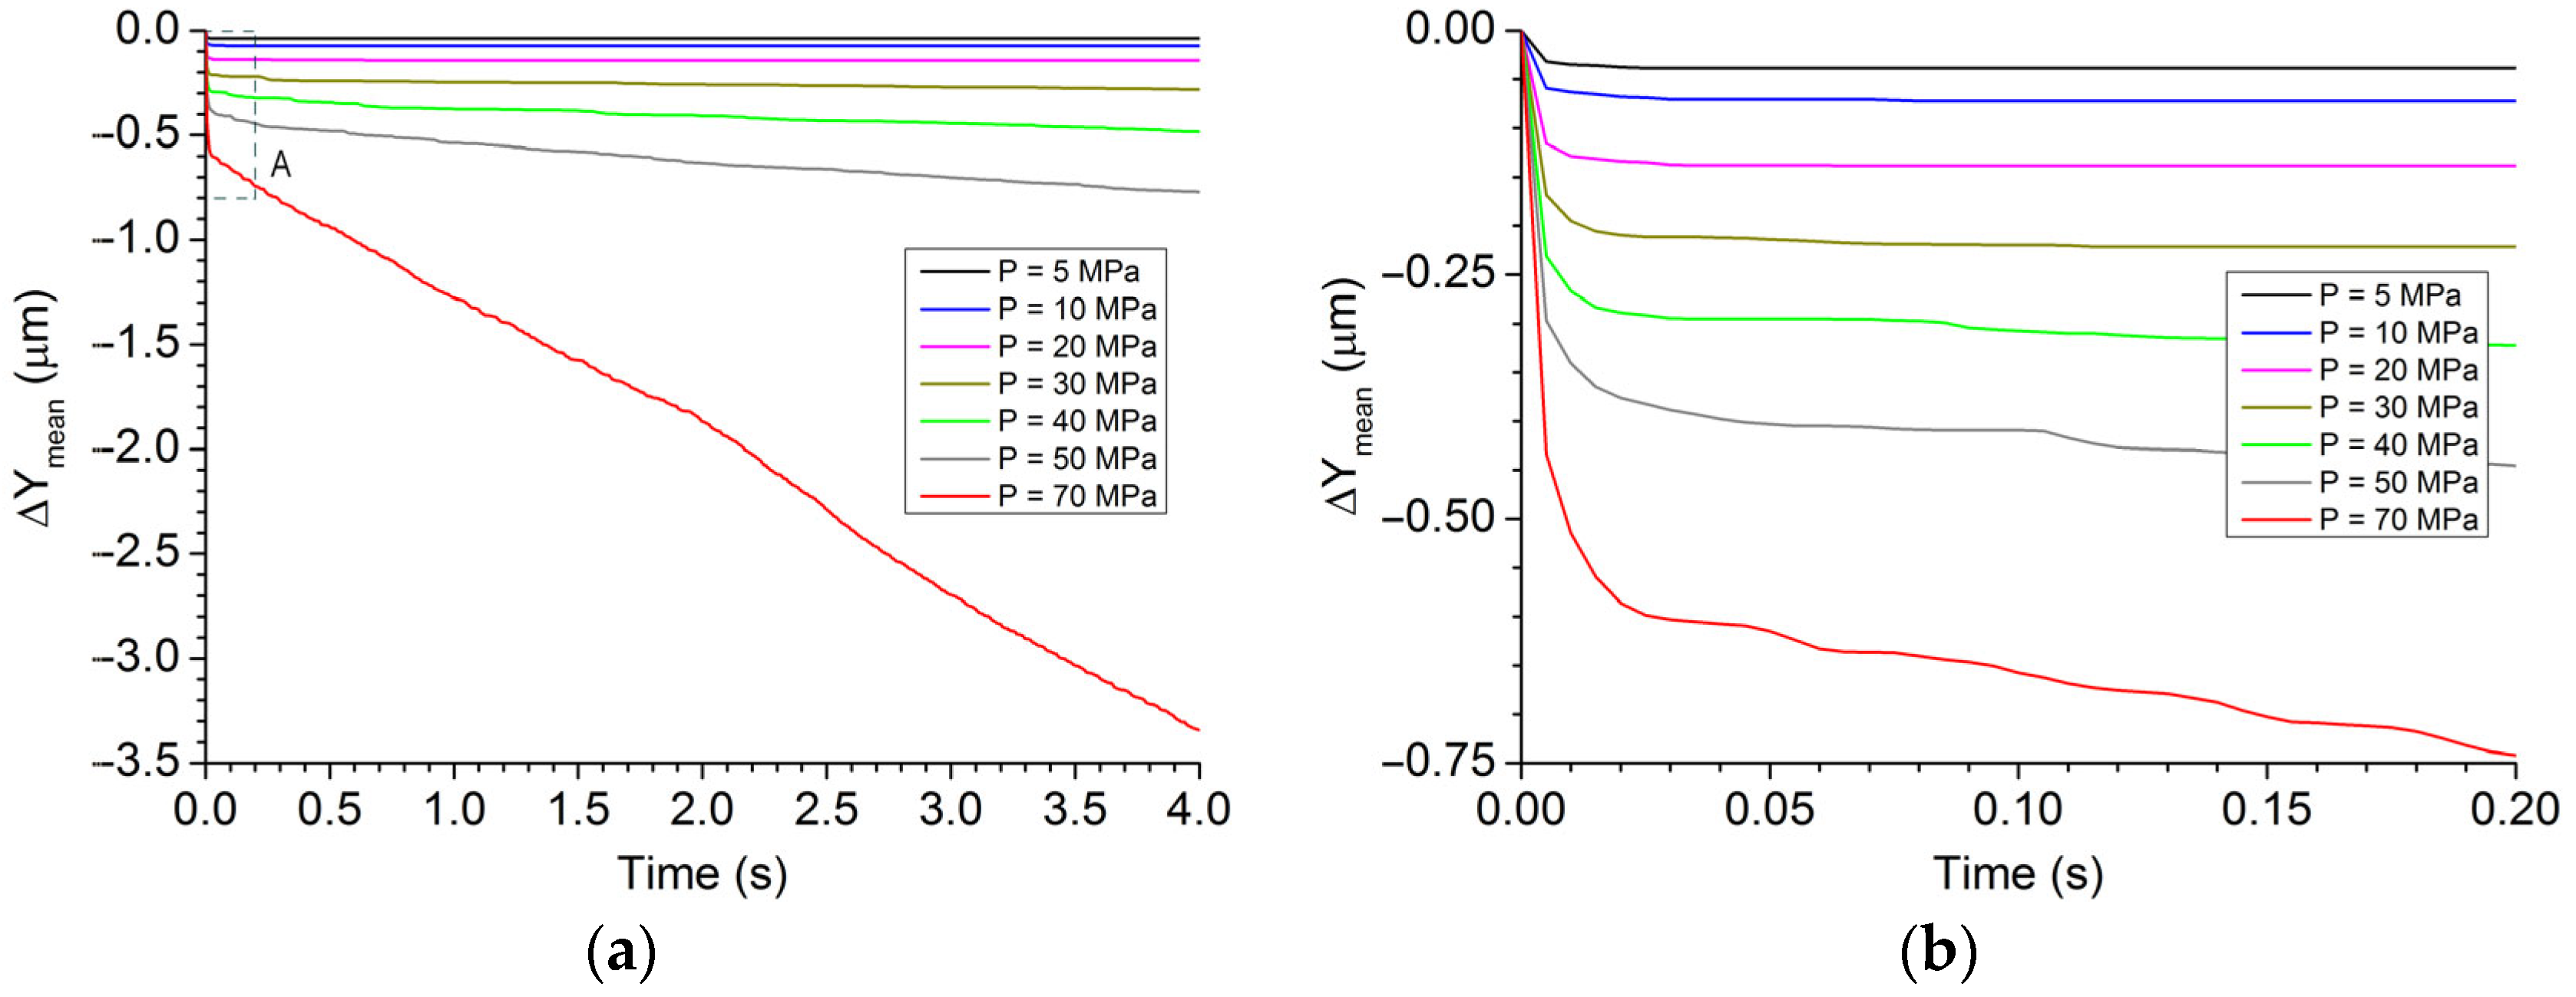
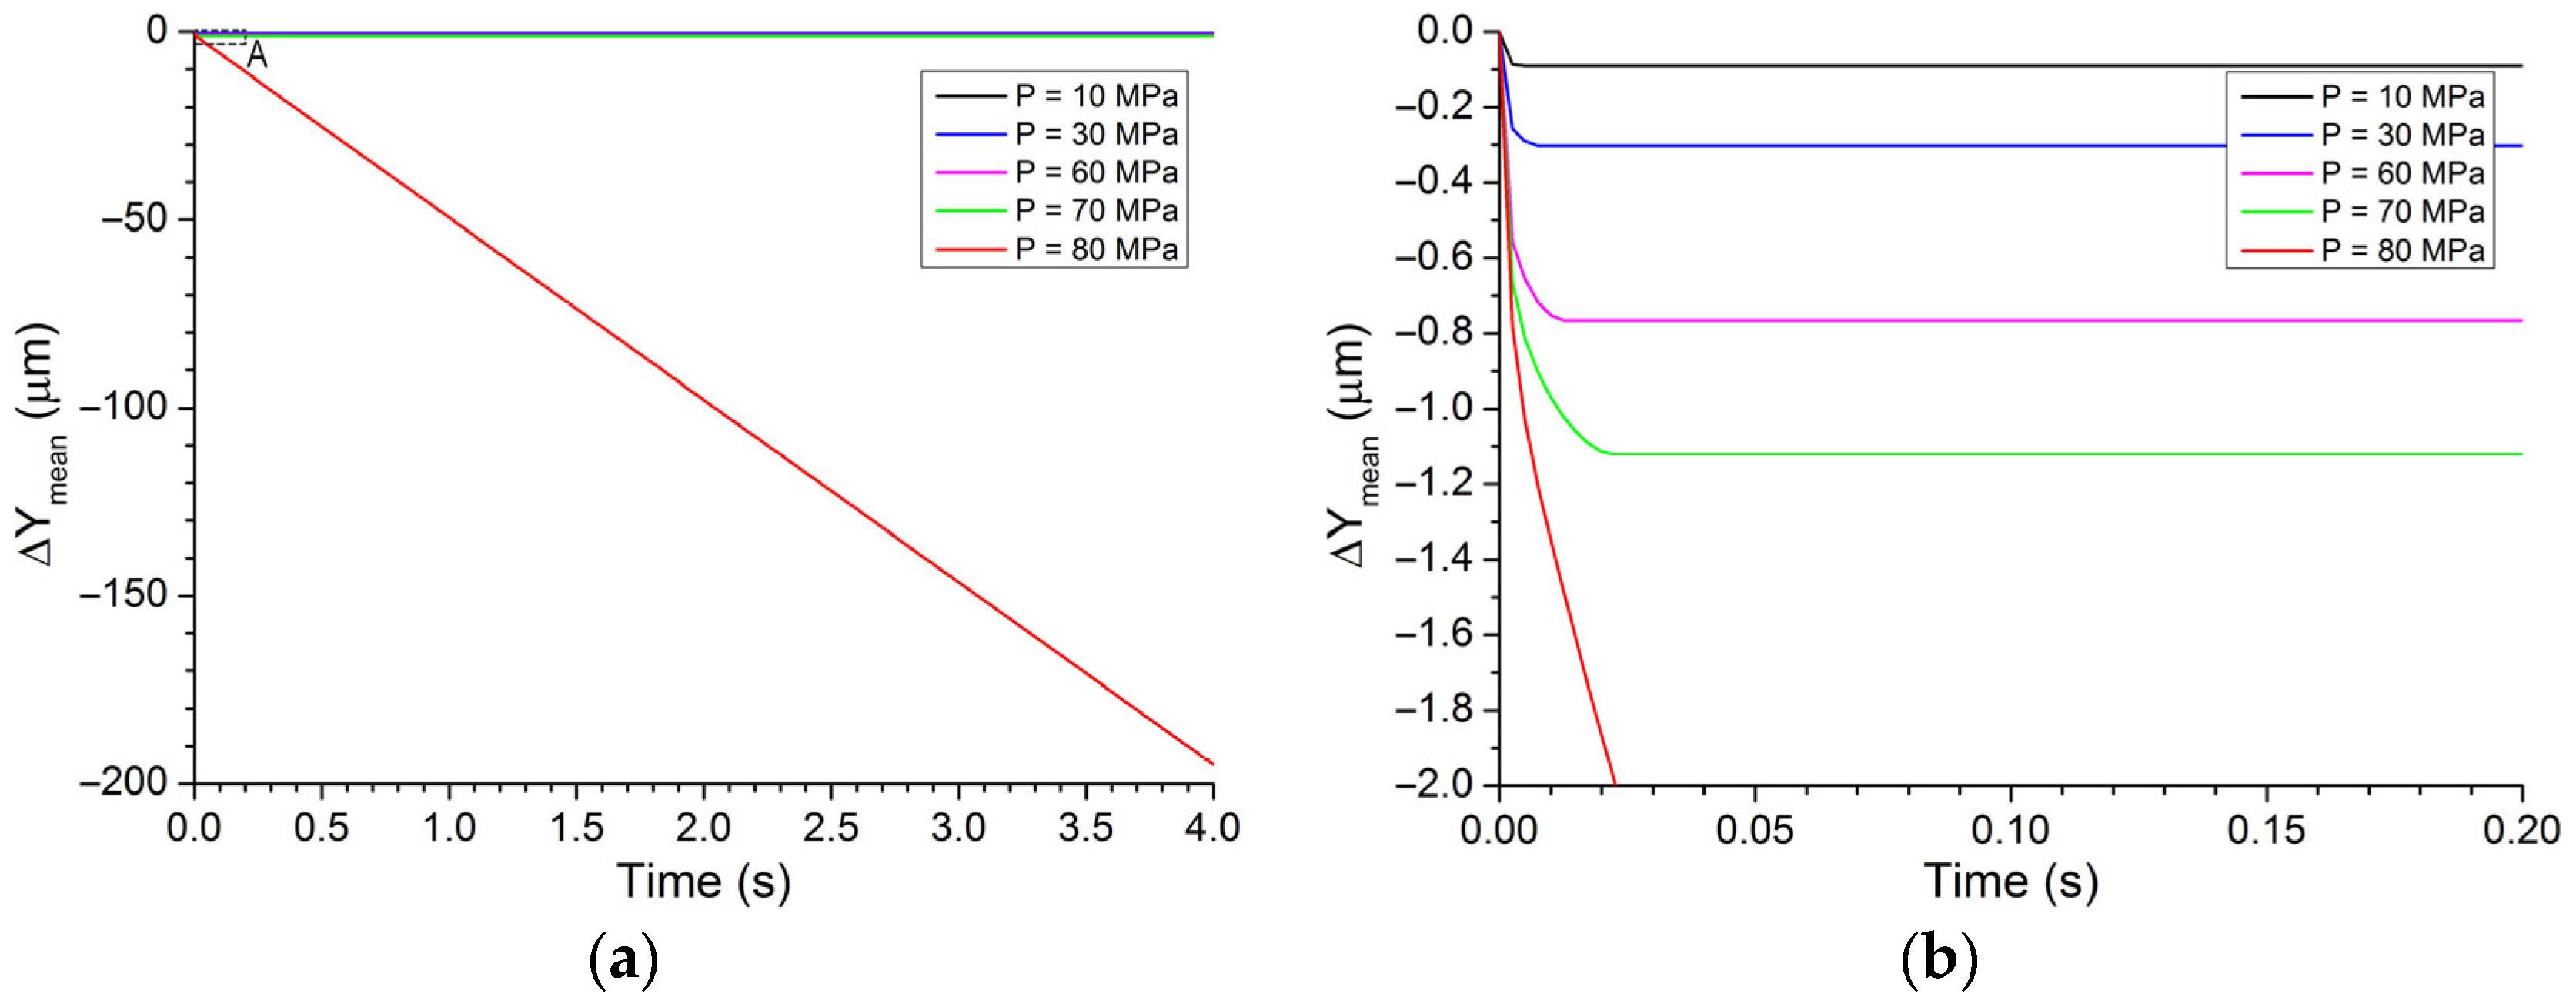
Figure 2 shows typical wear vs. time dependencies for the PTE model material at different applied pressures (σLoad) and the same sliding velocity (Vsl). The wear is characterized by a change in the mean position of the surface asperity tips along the Y-axis ( Δ Y m e a n t = Y m e a n t Y m e a n i n i t , where Y m e a n i n i t is the initial value of Ymean). Here, as well as below, we will present the simulation results only for one of the bodies; for the lower body, it can be observed that the wear mode qualitatively changes with increasing the pressure.
At some “small” σLoad magnitudes, i.e., below a certain threshold value σ L o a d c r i t ( σ L o a d c r i t ≈ 30 MPa for the PTE material under consideration), wear occurs only at the initial stage of sliding, for less than 0.1 s (Figure 2b). After such a running-in stage, the surfaces can interact without wear if no adhesion occurs between them. The amount of wear Δ Y m e a n increases when contact pressure increases. However, in all cases, it stays less than the roughness Ra of the initial surface. When σ L o a d c r i t is exceeded, wear becomes continuous, and its rate in the steady state of friction increases non-linearly with the applied pressure. Note that the transition from the running-in stage to the steady wear regime also occurs during the first hundredths of a second.
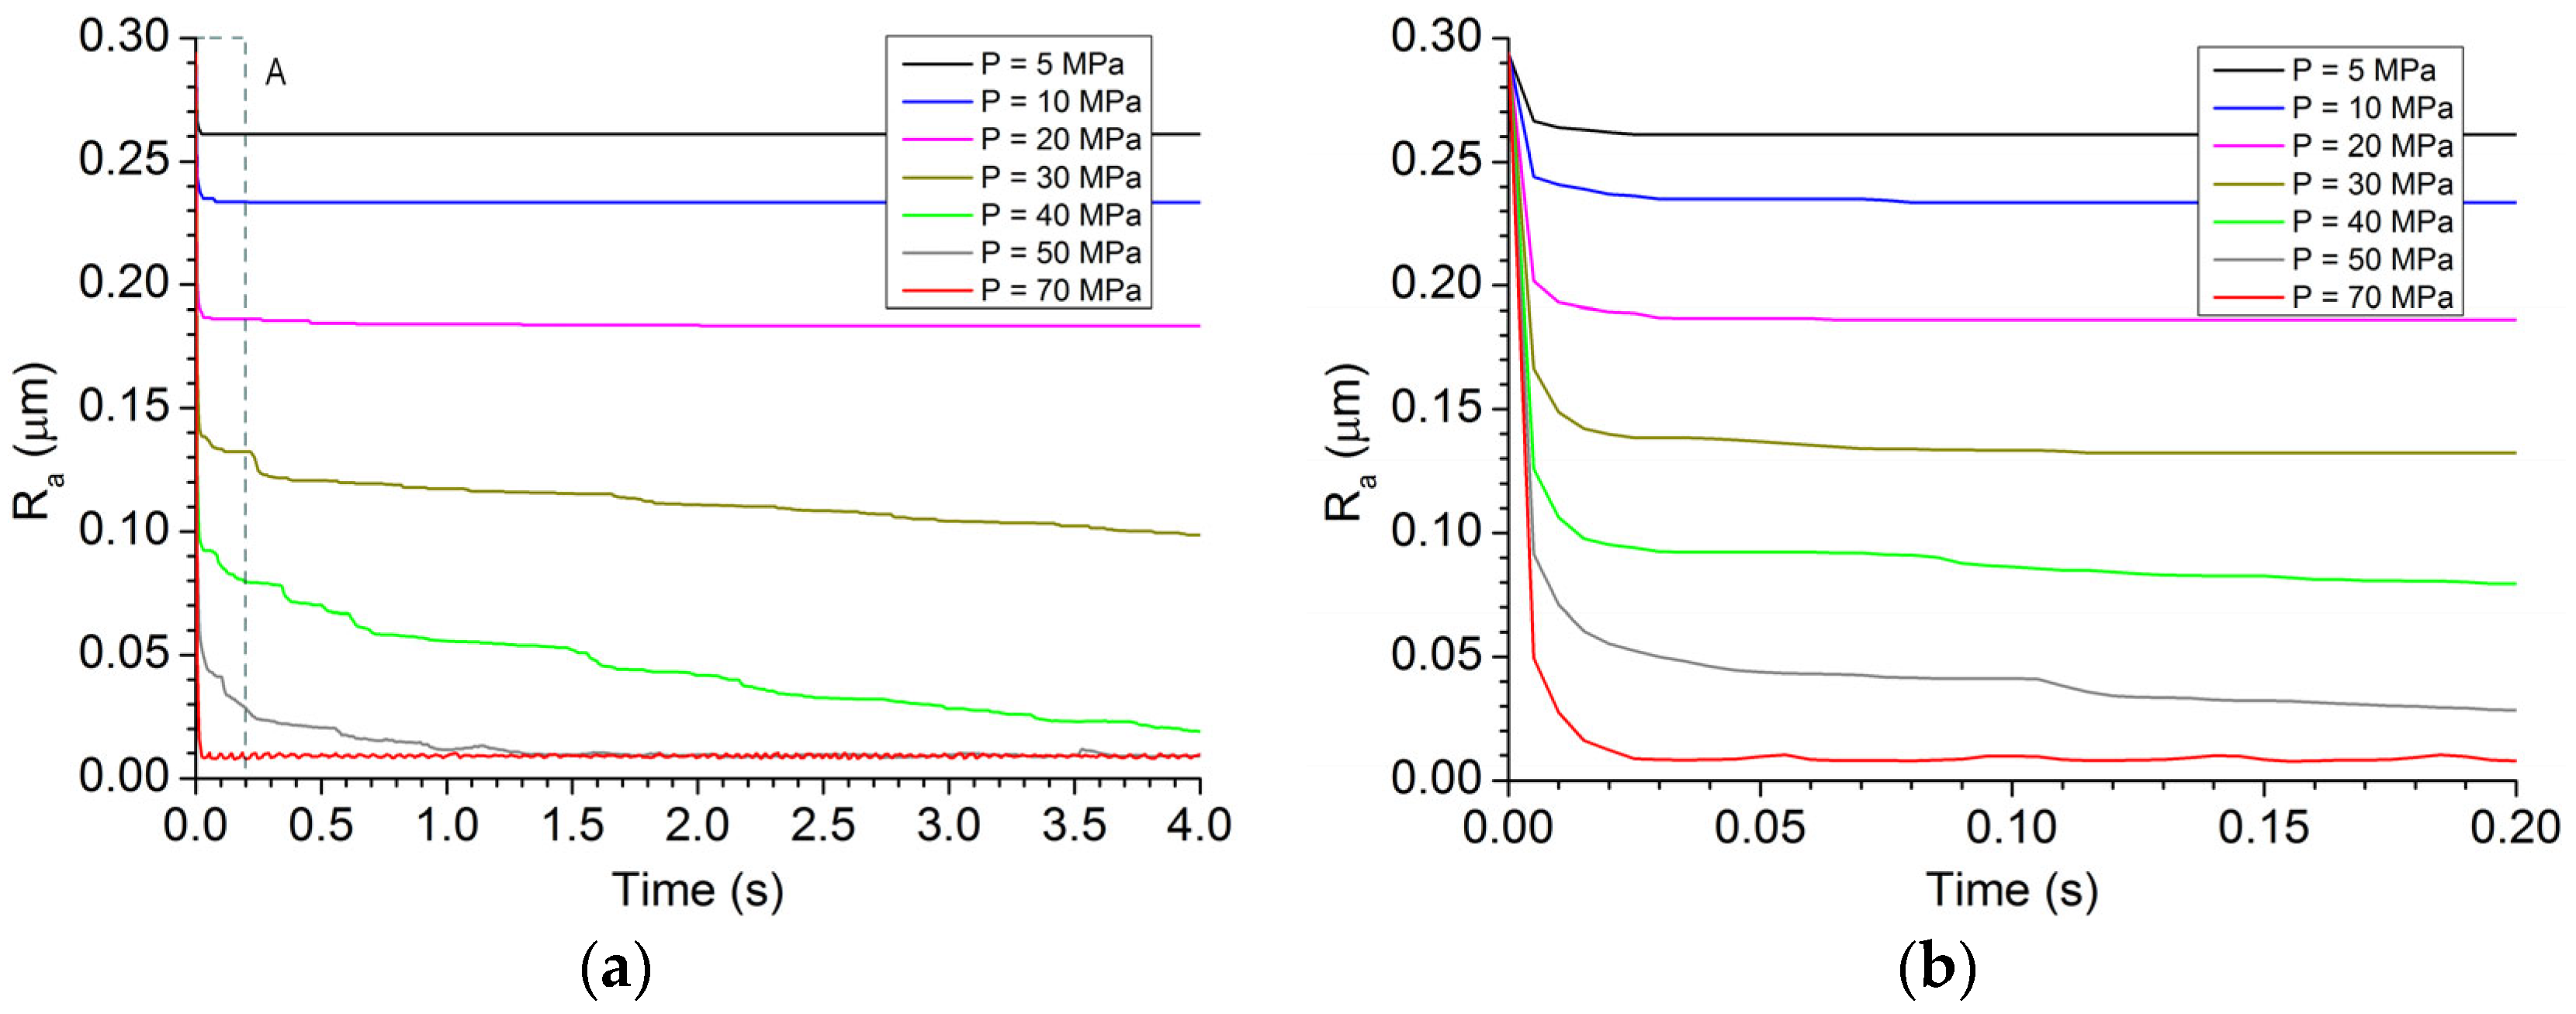
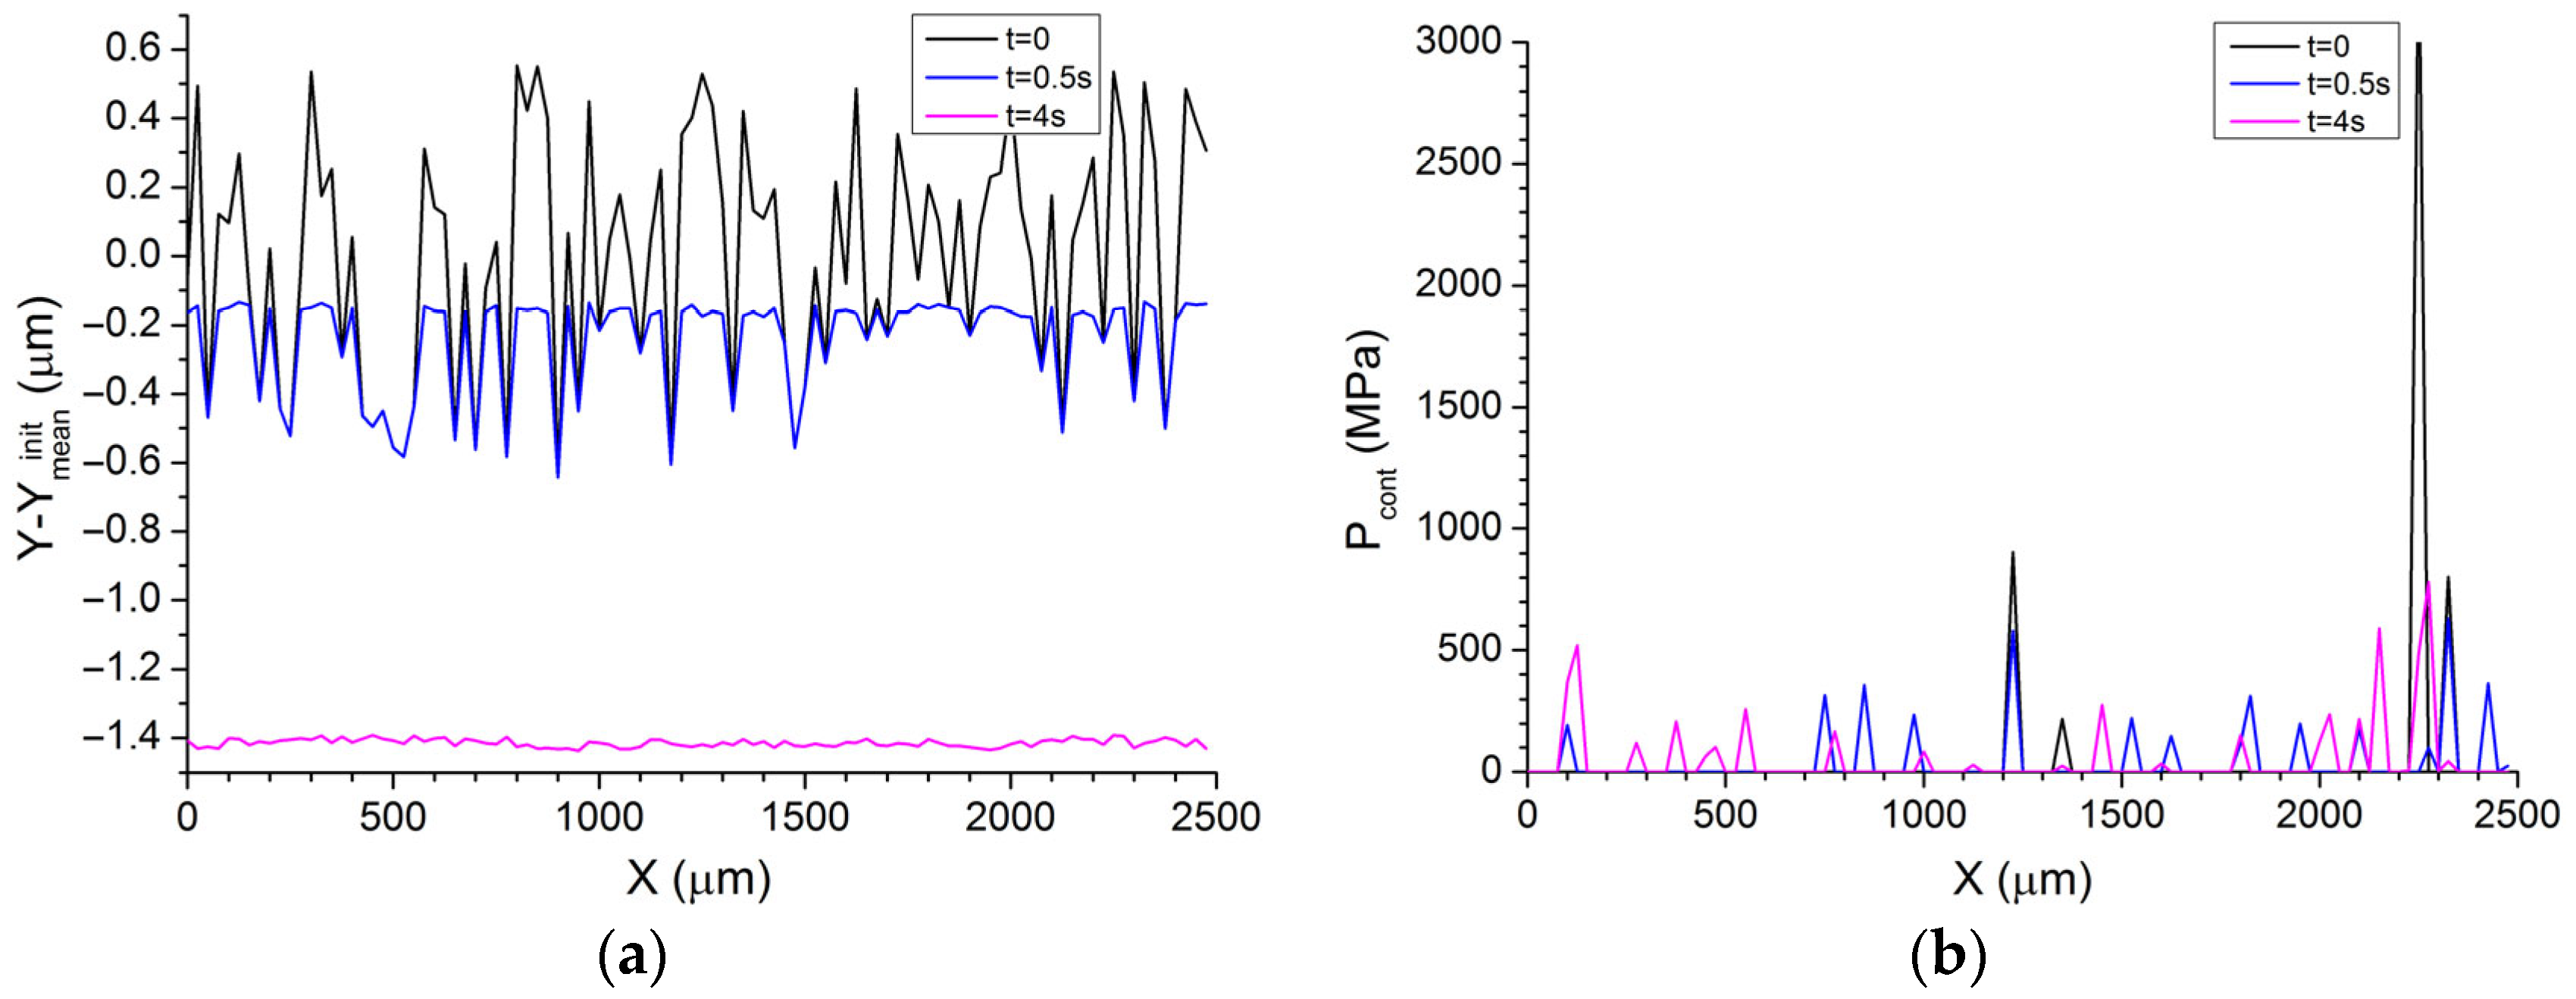
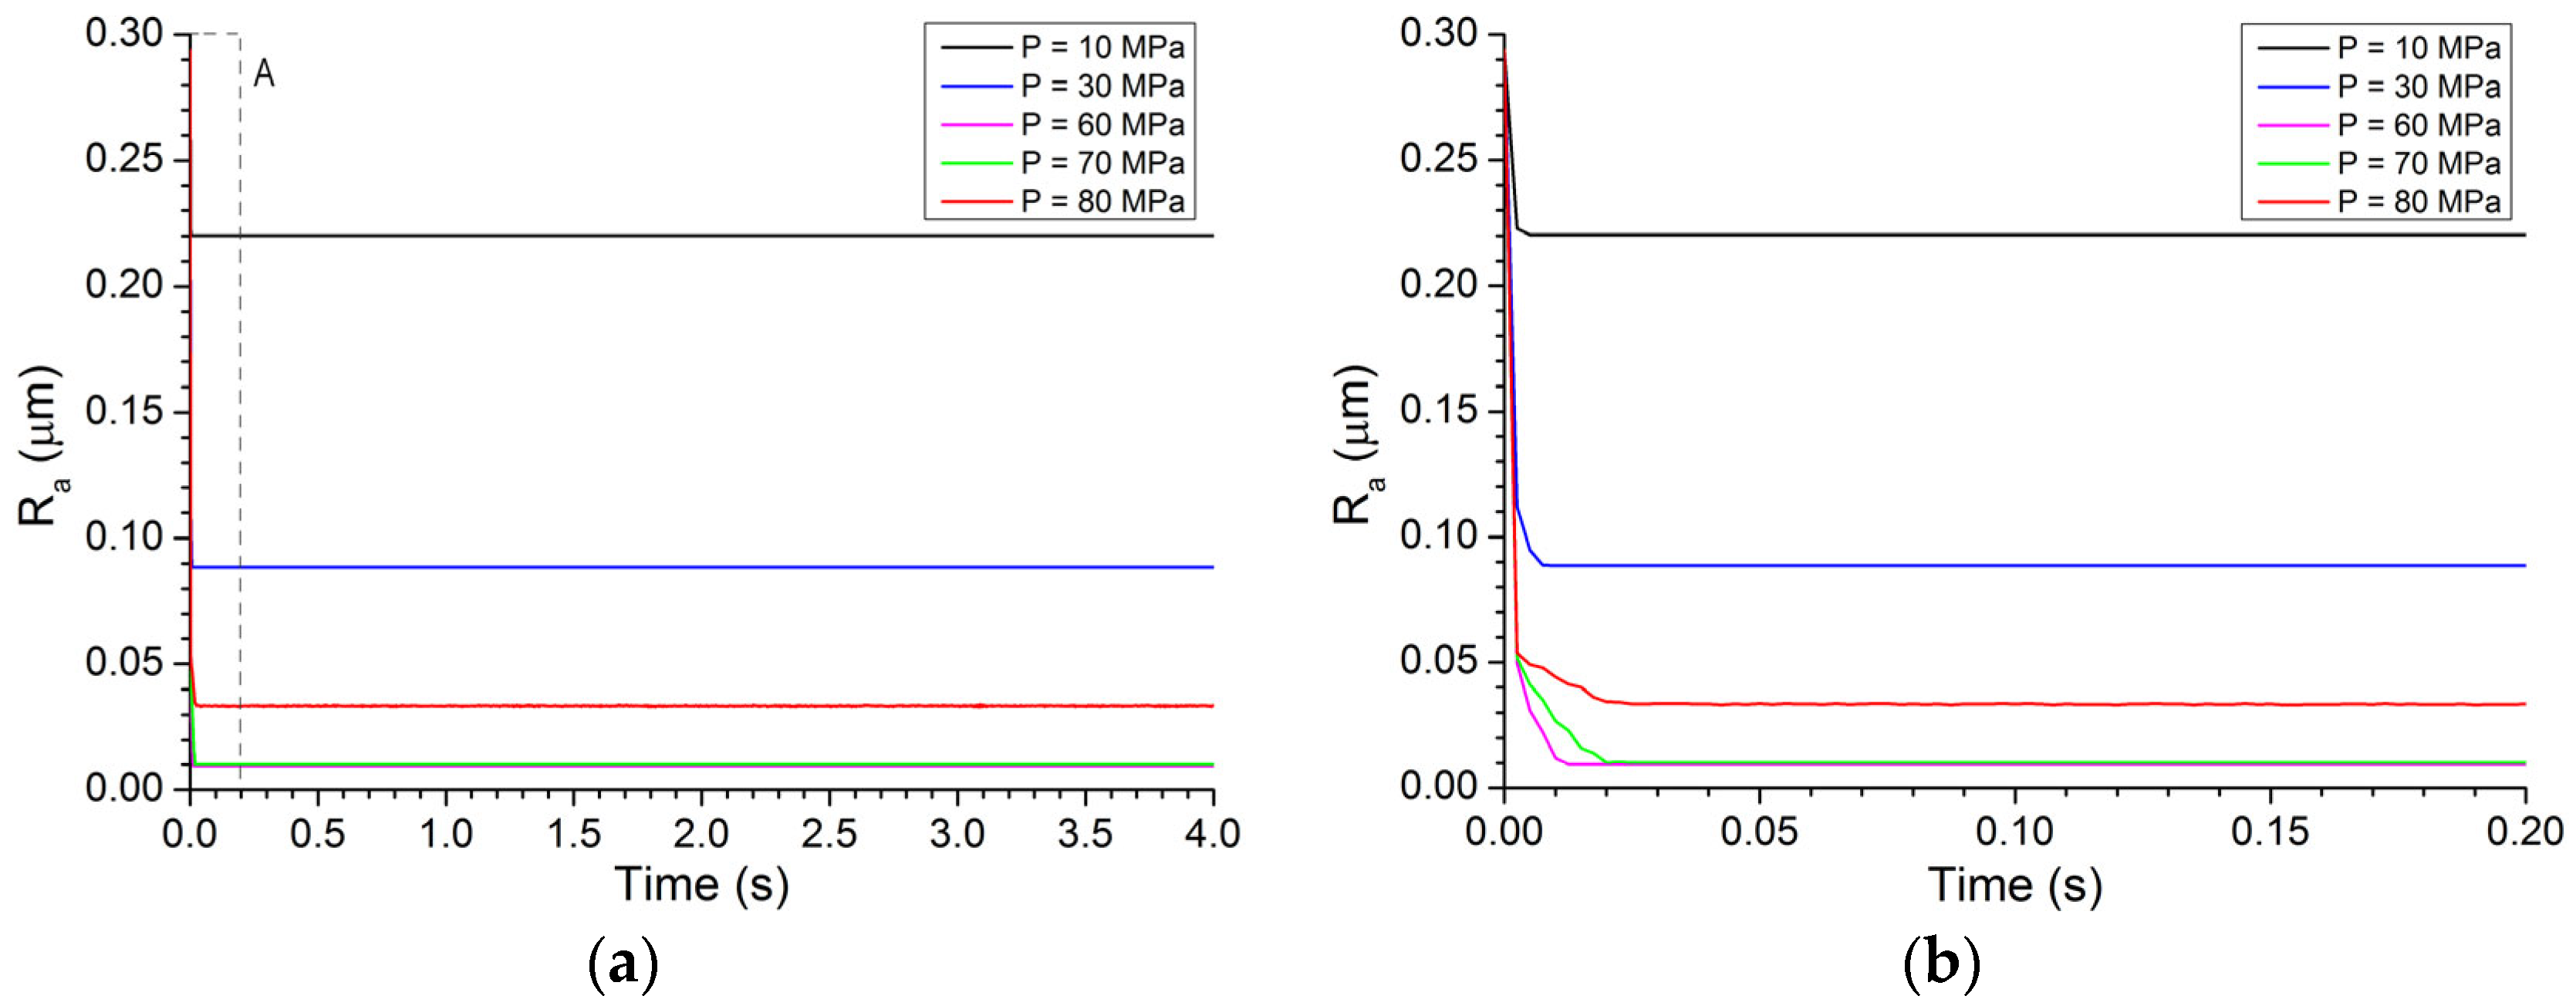
Wear is accompanied by smoothing the initial surface roughness (Figure 3) as shown by reduction of the Ra values in sliding. It can be observed that the steady-state value of Ra consistently decreases with increasing the pressure. At the same time, at low pressures σLoad when the “wear-free” friction mode is established, the Ra reduction is not more than 30–35%. With σLoad > σ L o a d c r i t , the Ra value dramatically decreases to a certain lower limit (Ra ≈ 10 nm). Thus, the steady wear regime is characterized by the nanoscale roughness of the worn surfaces. In this regard, two facts should be noted. First, the rate of roughness reduction at a constant sliding speed depends on the degree of excessing the critical pressure. As the ratio σLoad/ σ L o a d c r i t increases, the characteristic time needed for the Ra to reach a steady level decreases from 10s of seconds to hundredths of a second (the speed of surface smoothing increases by three orders of magnitude). Secondly, the steady nanoscale value of Ra is the same for all values of σLoad/ σ L o a d c r i t . Its specific value does not depend on the sliding velocity (this will be shown below) and is determined by the material parameters of the rubbing bodies.
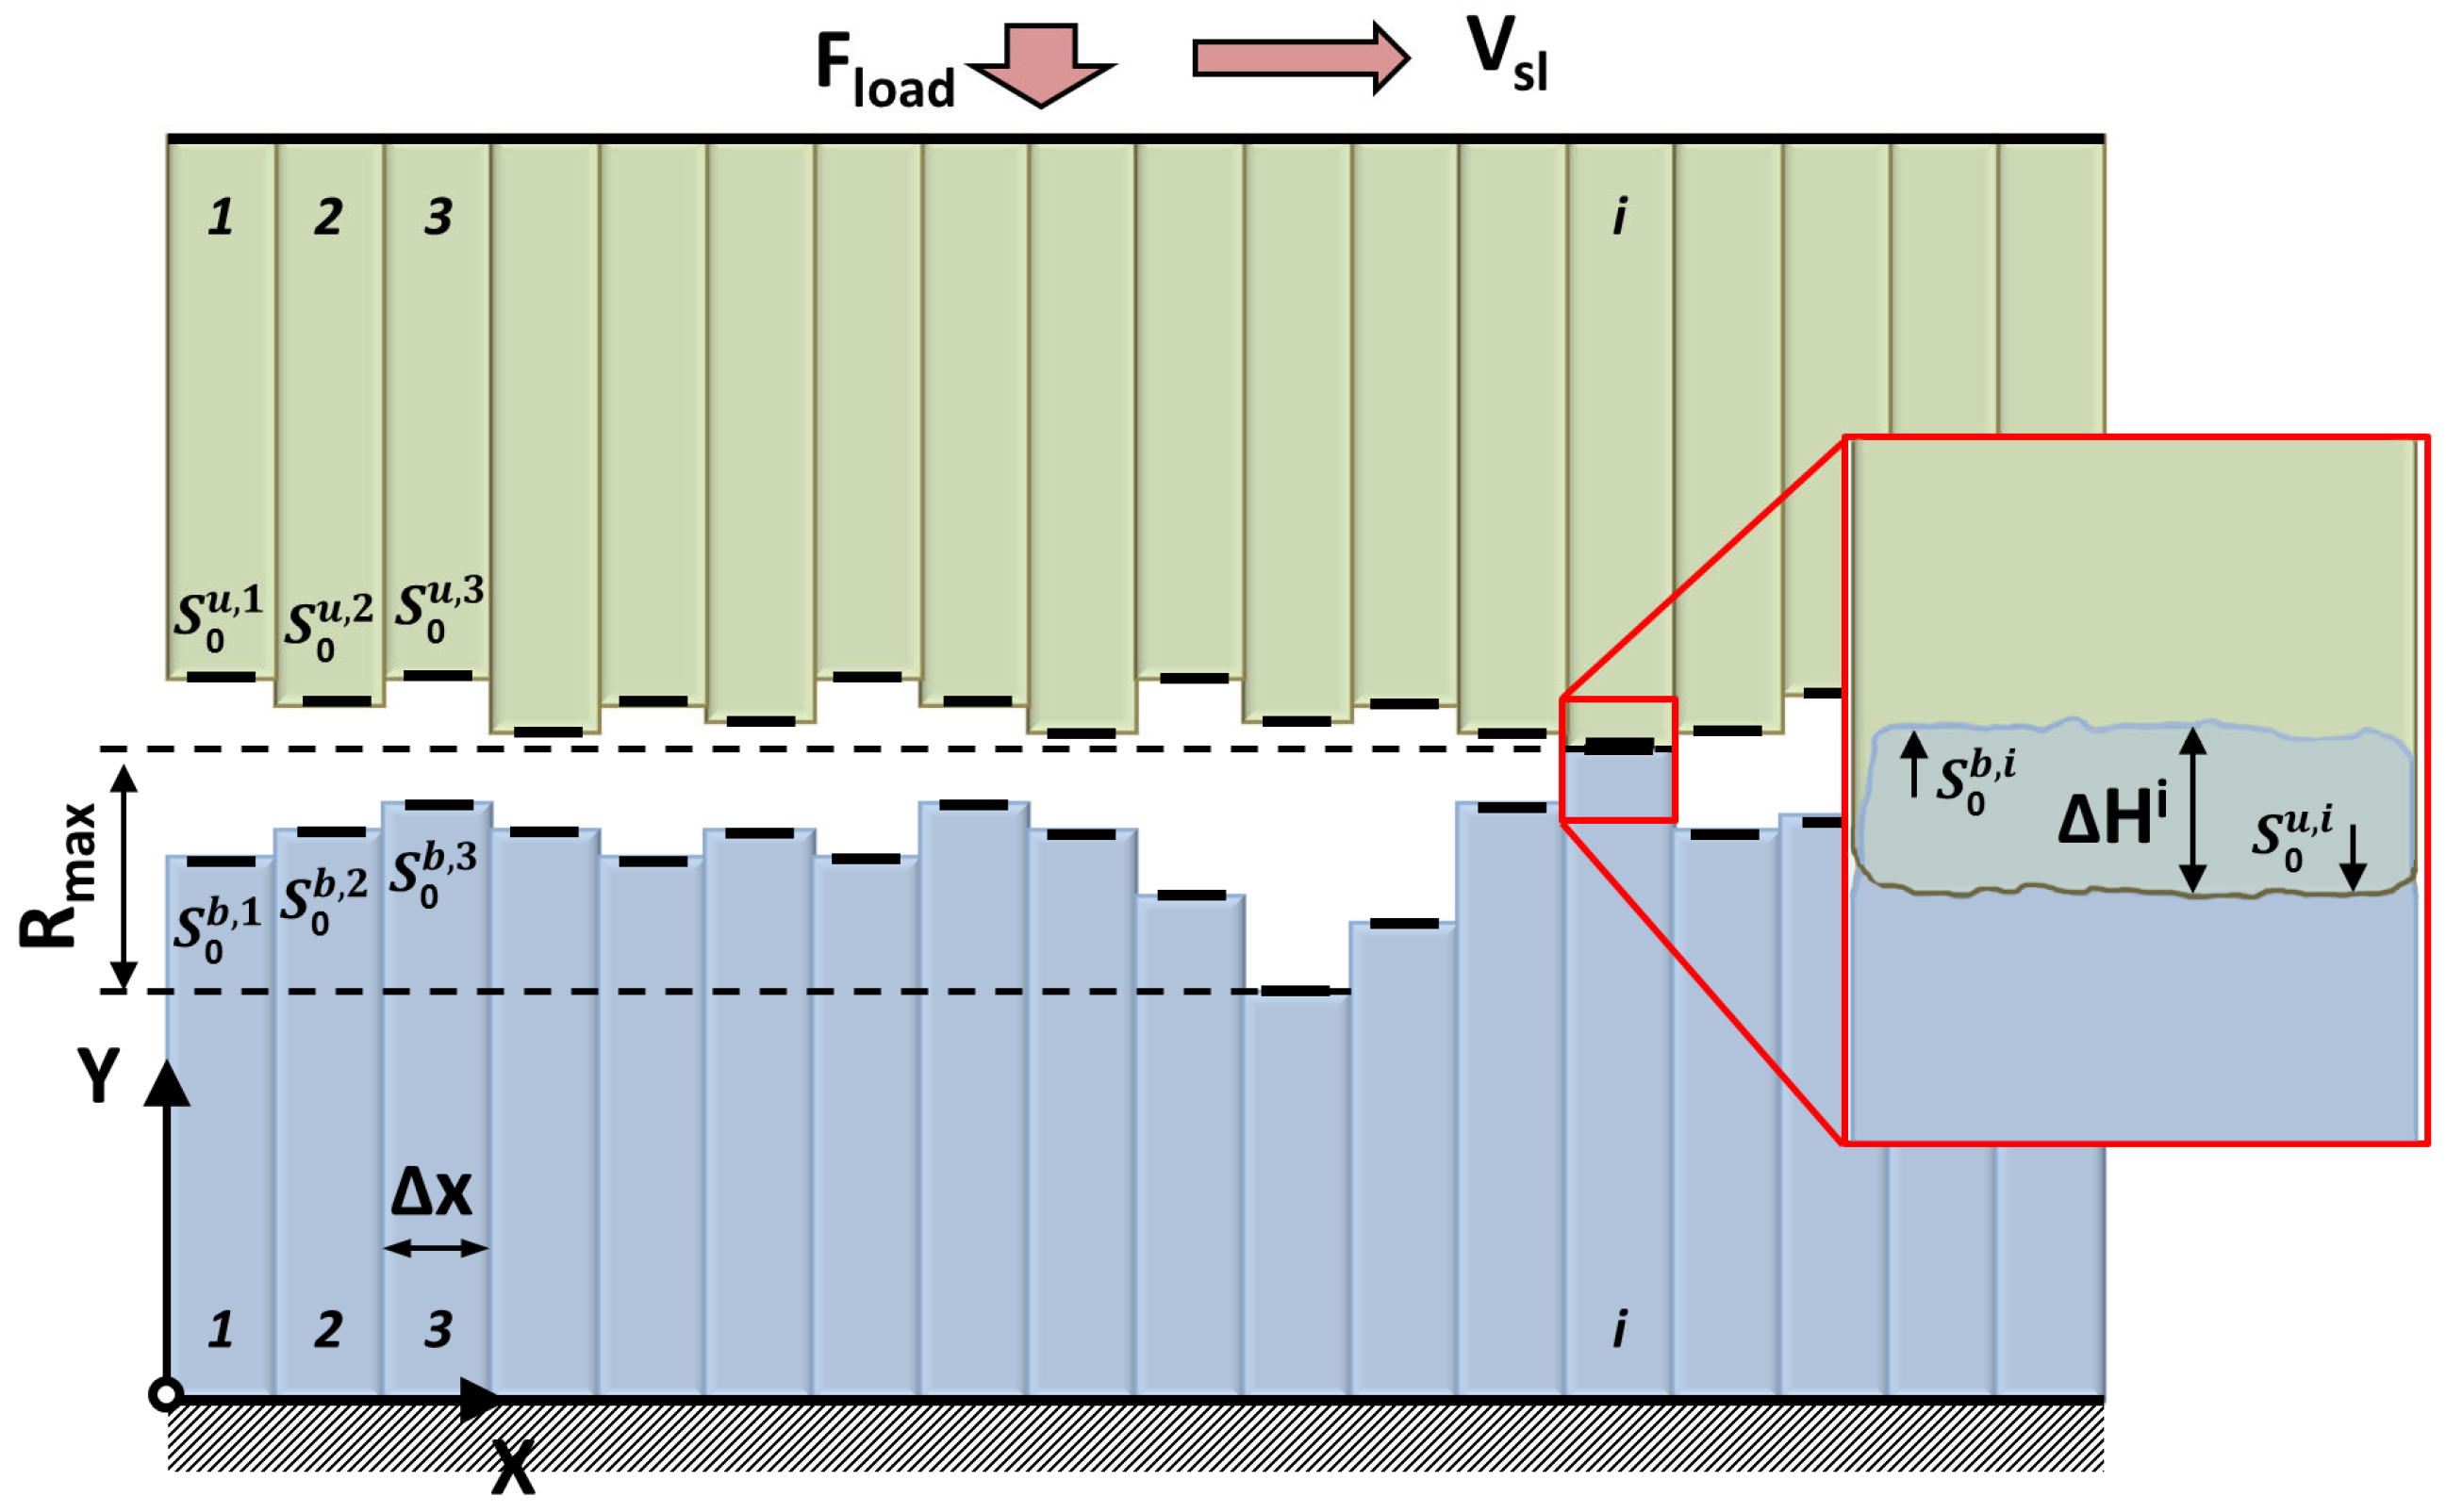
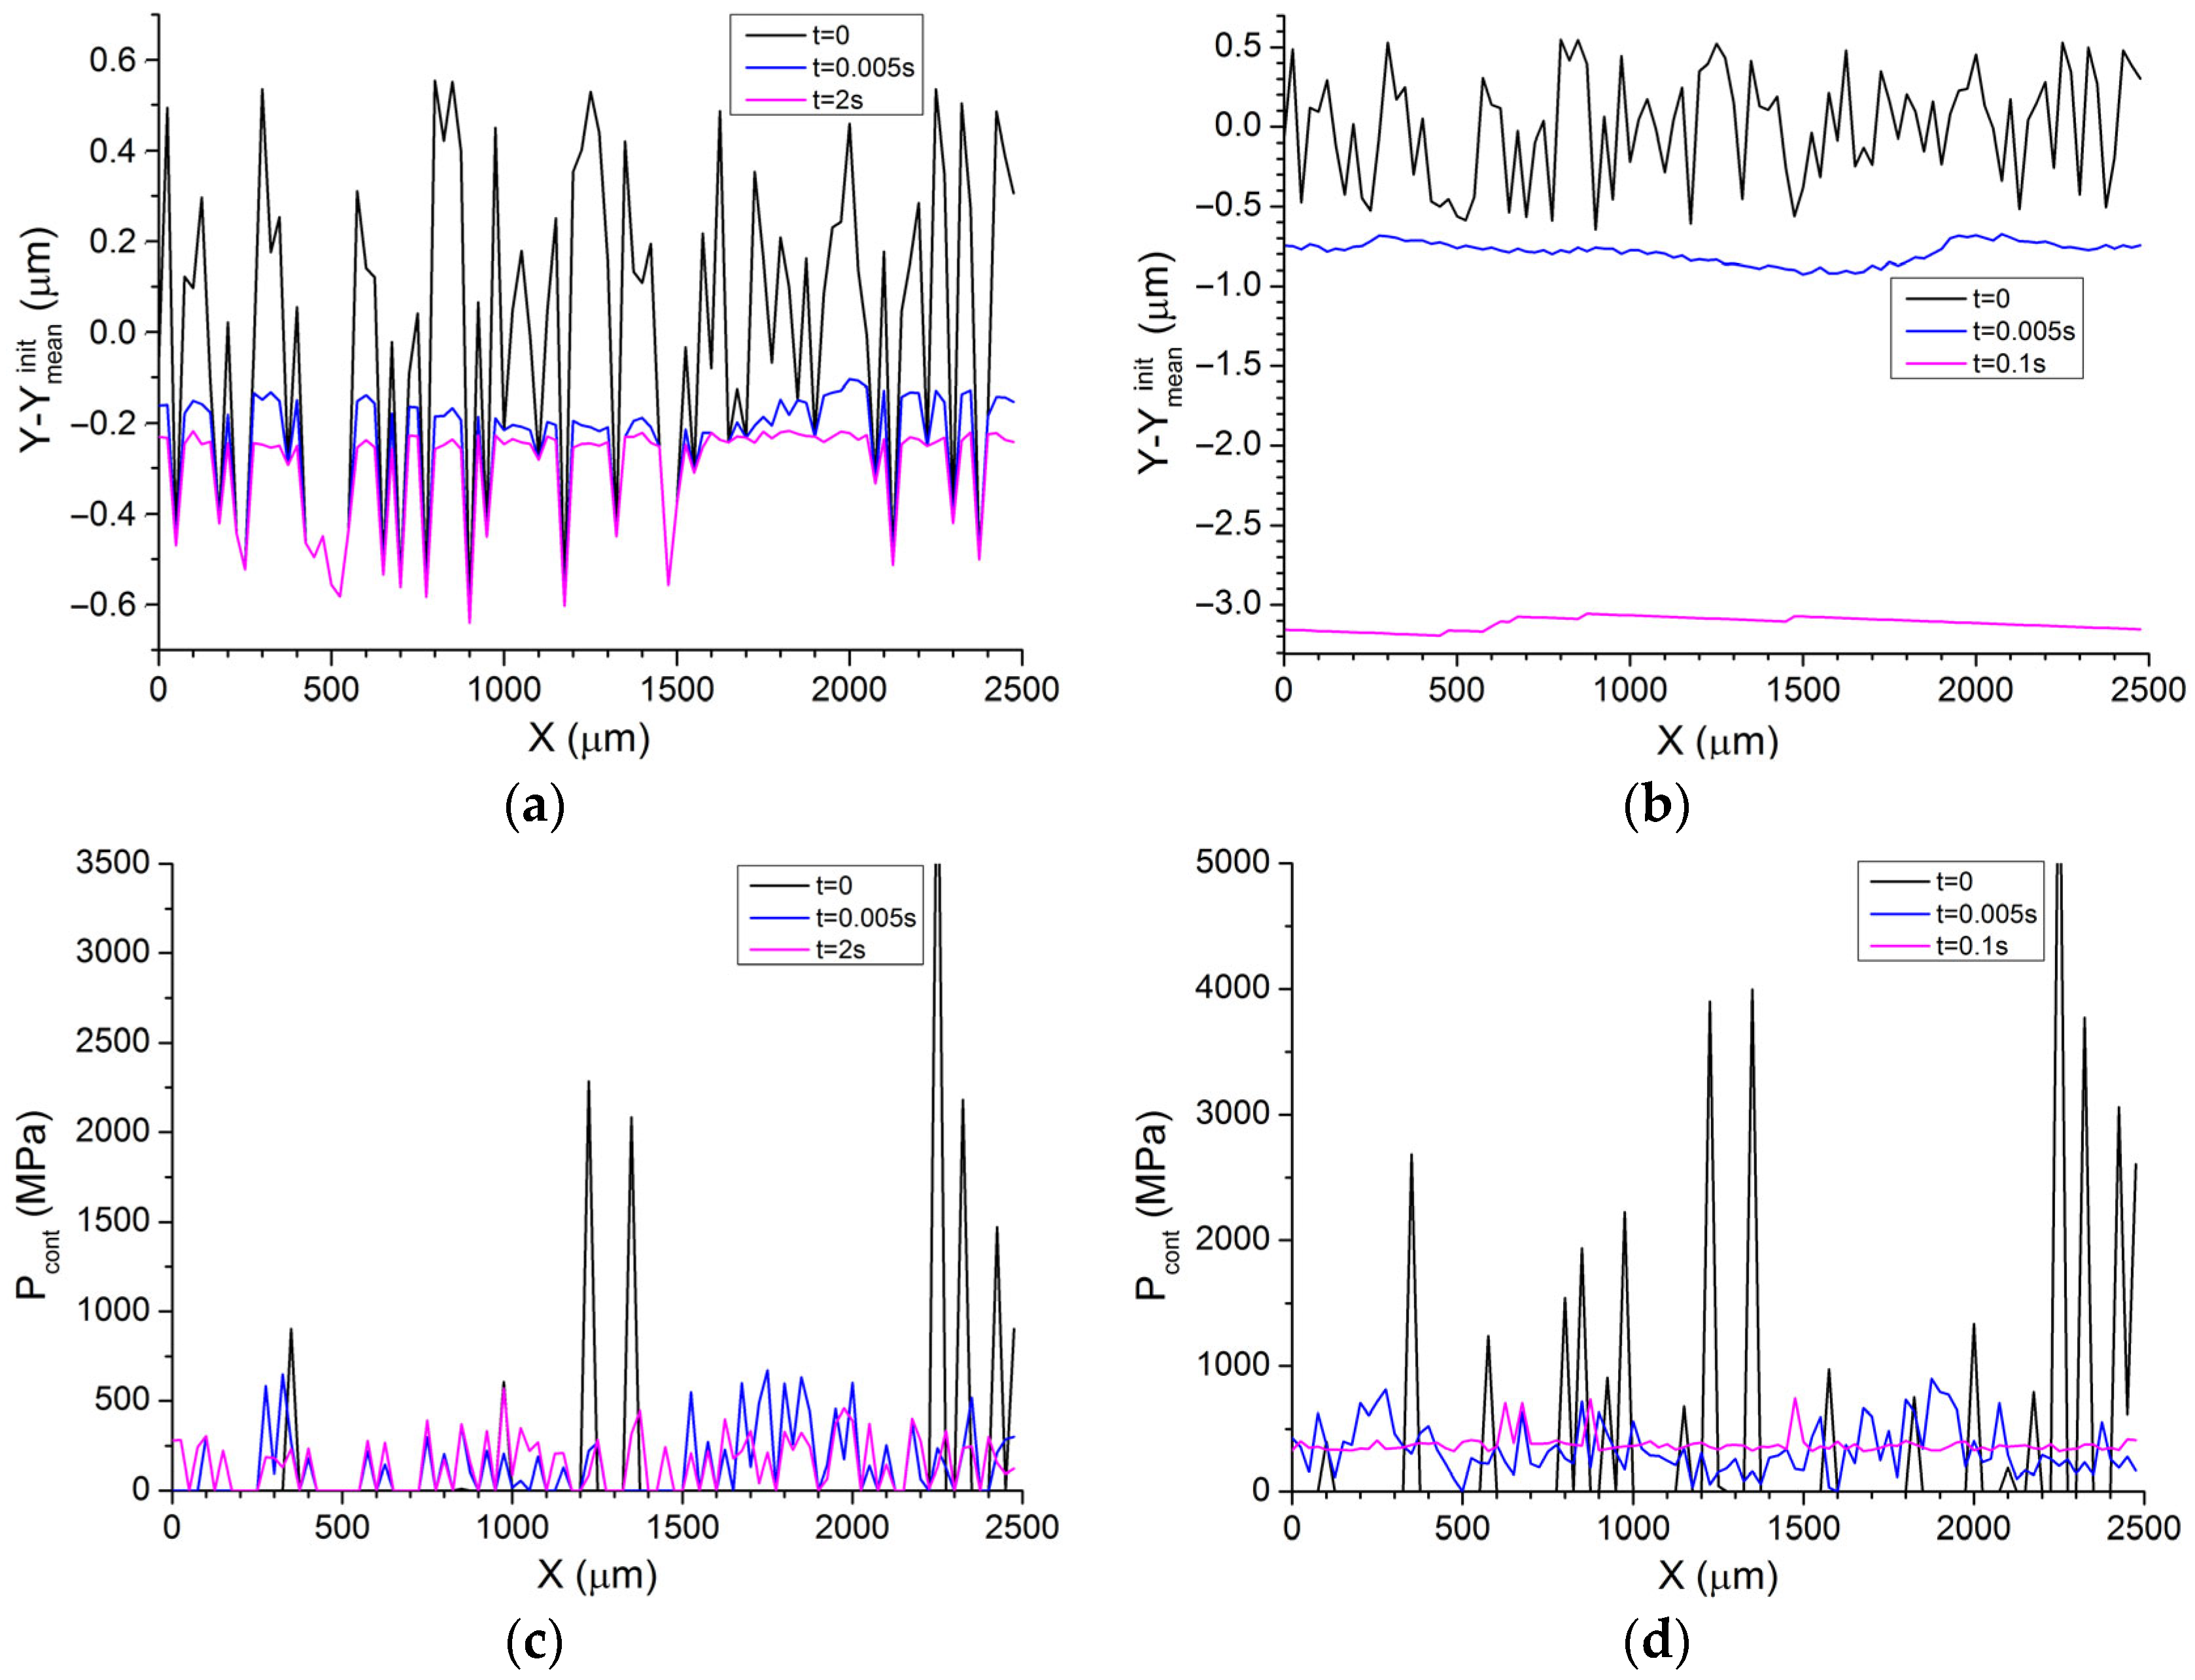
Wear occurs by failure of the highest asperities, which are therefore most highly loaded. In this case, the local wear volume depends on value of the asperity overlapping, i.e., on the local contact pressure. Local contact pressures, in turn, are determined not only by the applied pressure σLoad but also by the number of contact spots. Smoothing the surface during the running-in stage leads to a multiple increase in the number of contact spots and, accordingly, to reducing the local contact stress and stress leveling over the asperity ensemble. 
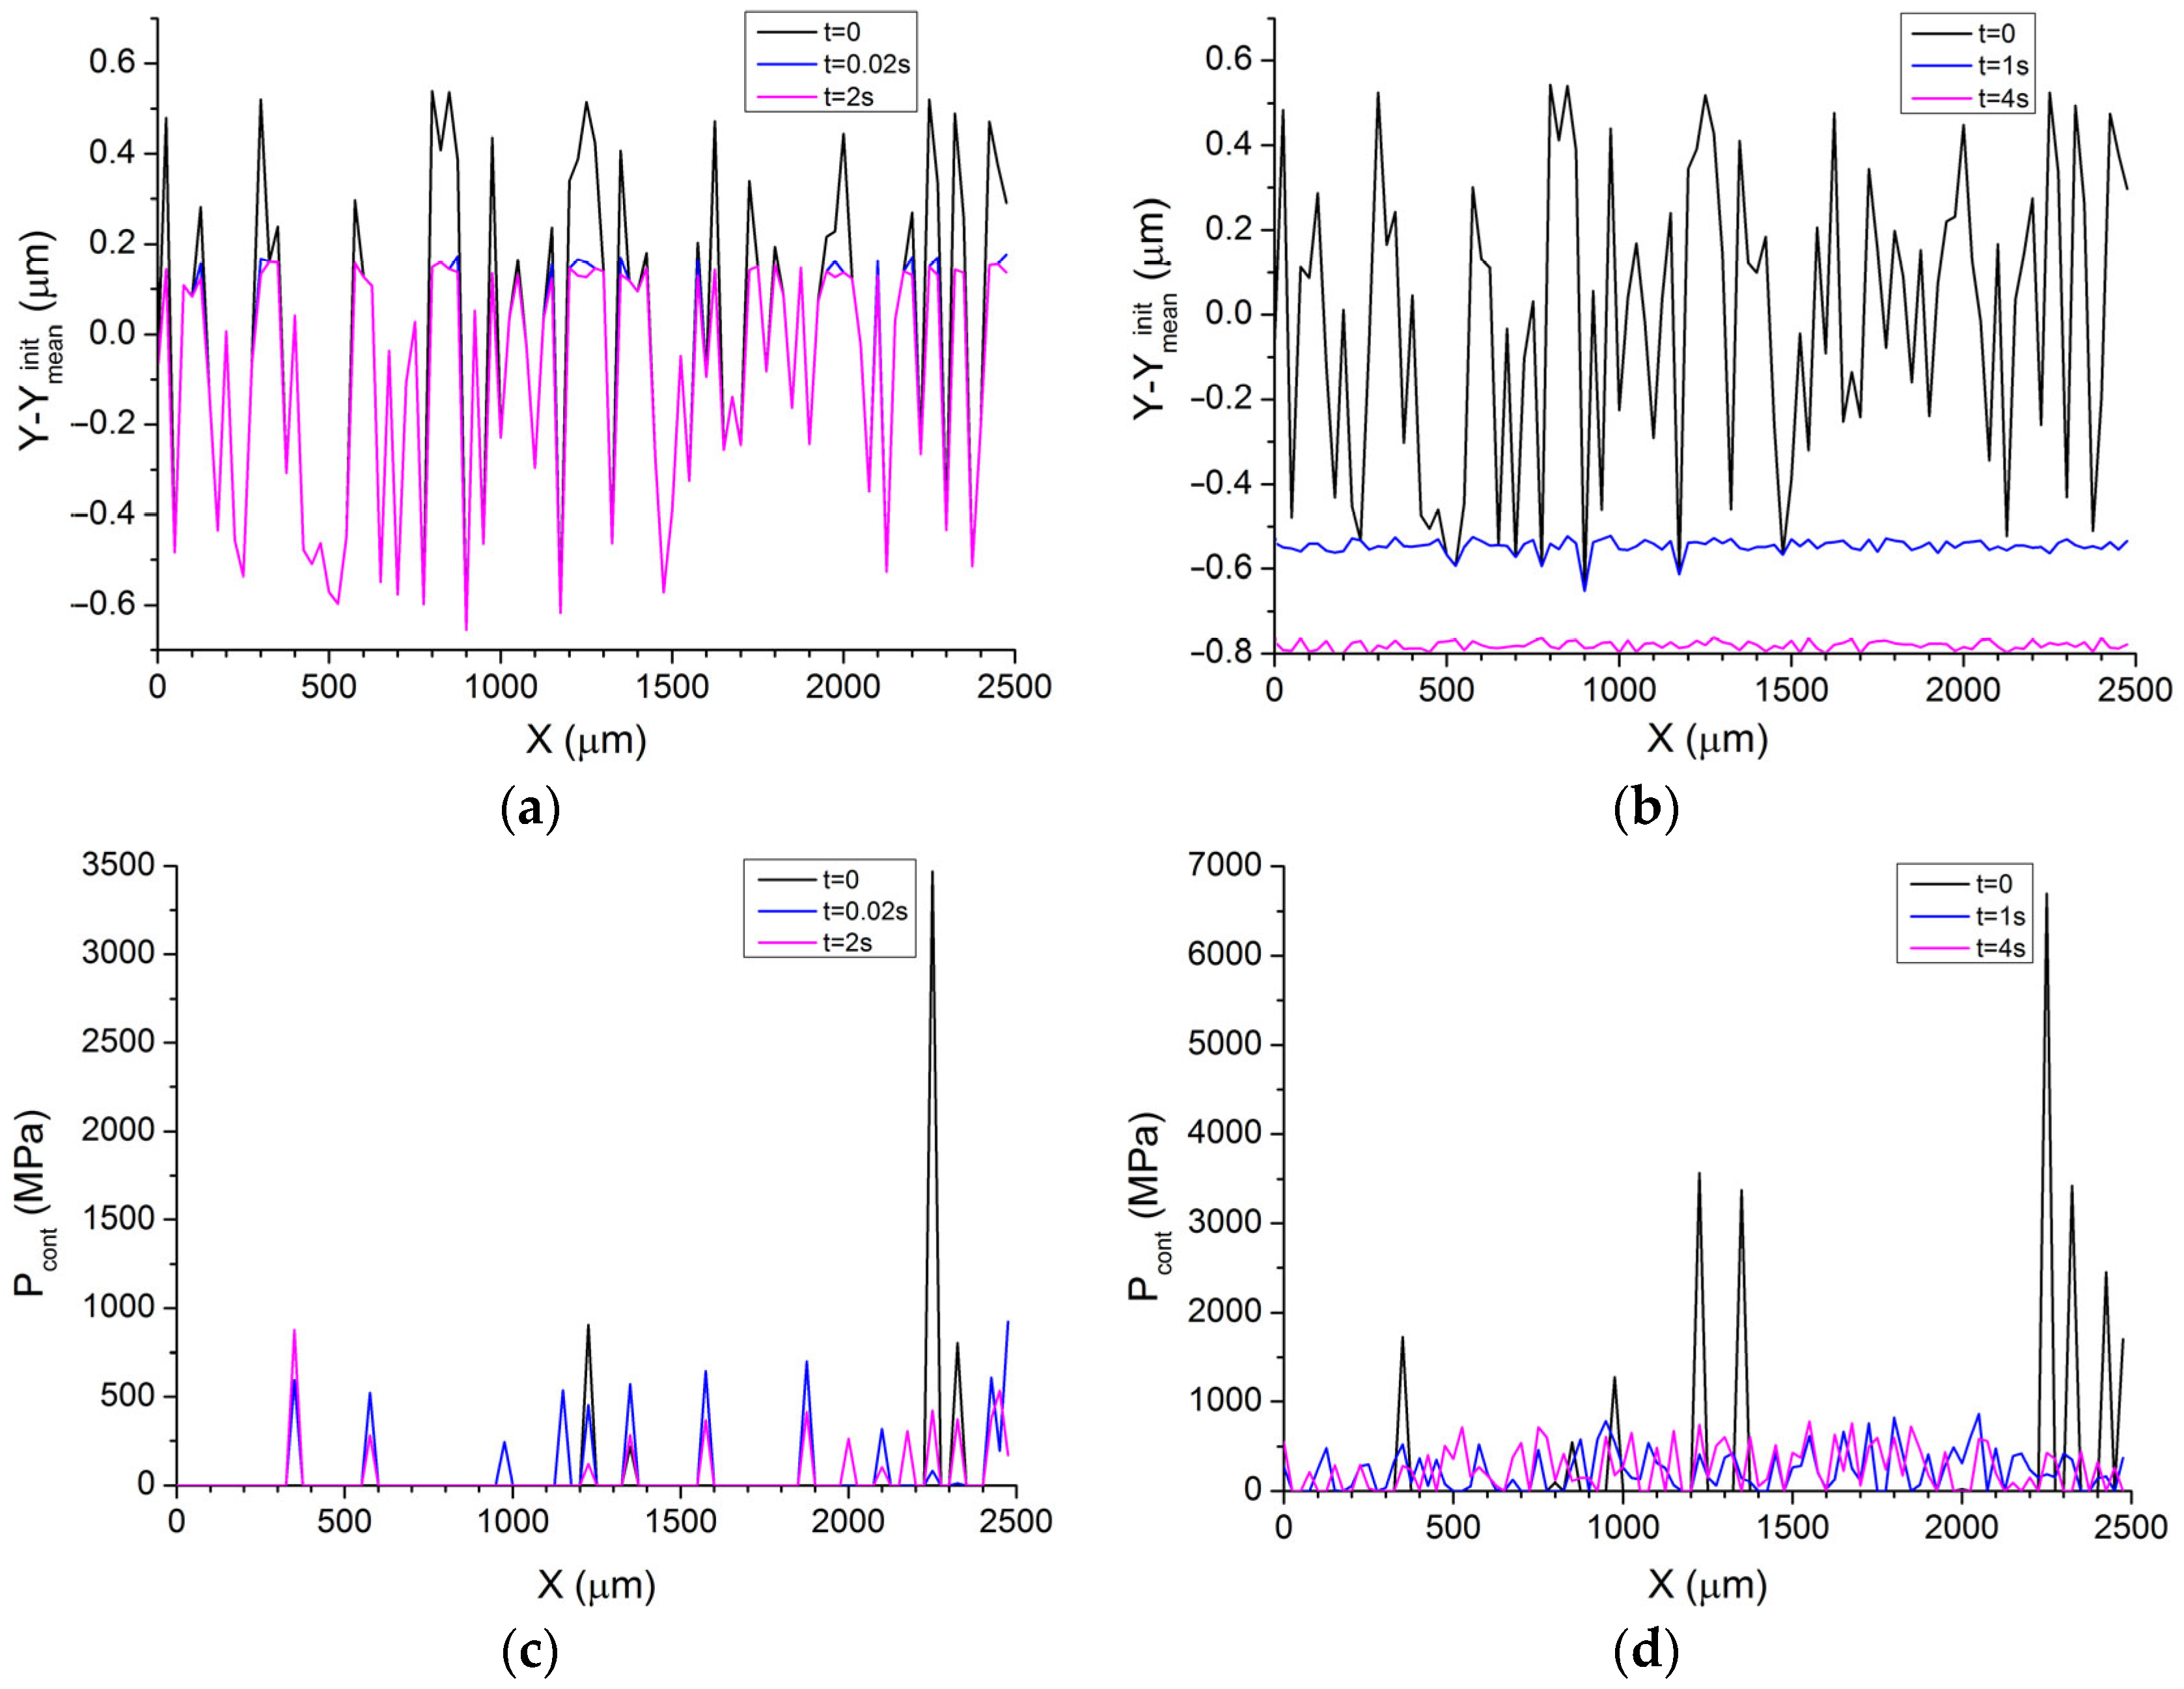
Figure 4 shows the examples of changes occurring to the asperities and local contact pressures during sliding at various values of the applied pressure σLoad.
Only the highest asperities experience wear at low values of the applied load σLoad < σ L o a d c r i t . The corresponding increase in the number of contact spots ensures a decrease in the maximum local pressures to a level at which no further local asperity failure occurs. Such a situation can be characterized as wear-free sliding even if the proportion of contact spots to the total number of asperities is rather small (less than 20%).
When exceeding the critical value of the applied load (σLoad > σ L o a d c r i t ), the wear of the highest asperities can no longer provide the necessary reduction in local contact pressures. In other words, there is always a certain number of contact spots at which local stresses exceed their critical value (condition (A15) is fulfilled) and local failure occurs. It is important to note that the wear-free sliding does not occur even when the surface roughness is reduced to the nanoscale value and the percentage of contact spots is more than 50%. Such an unobvious effect is a consequence of frictional heating and thermal expansion of the asperities. Indeed, in the process of relative sliding, the highest asperities of the lower surface occasionally contact those of the upper surfaces and local stresses exceed their critical value with ensuing local failure. At the same time, other asperities may interact without fracture and experience heating with the corresponding thermally induced increasing of their heights. Later, these asperities can be also destroyed when they meet the highest asperities of the opposite surface. The balance of processes of “thermal growth” of asperities and their wear determines the steady value of roughness and wear rate.
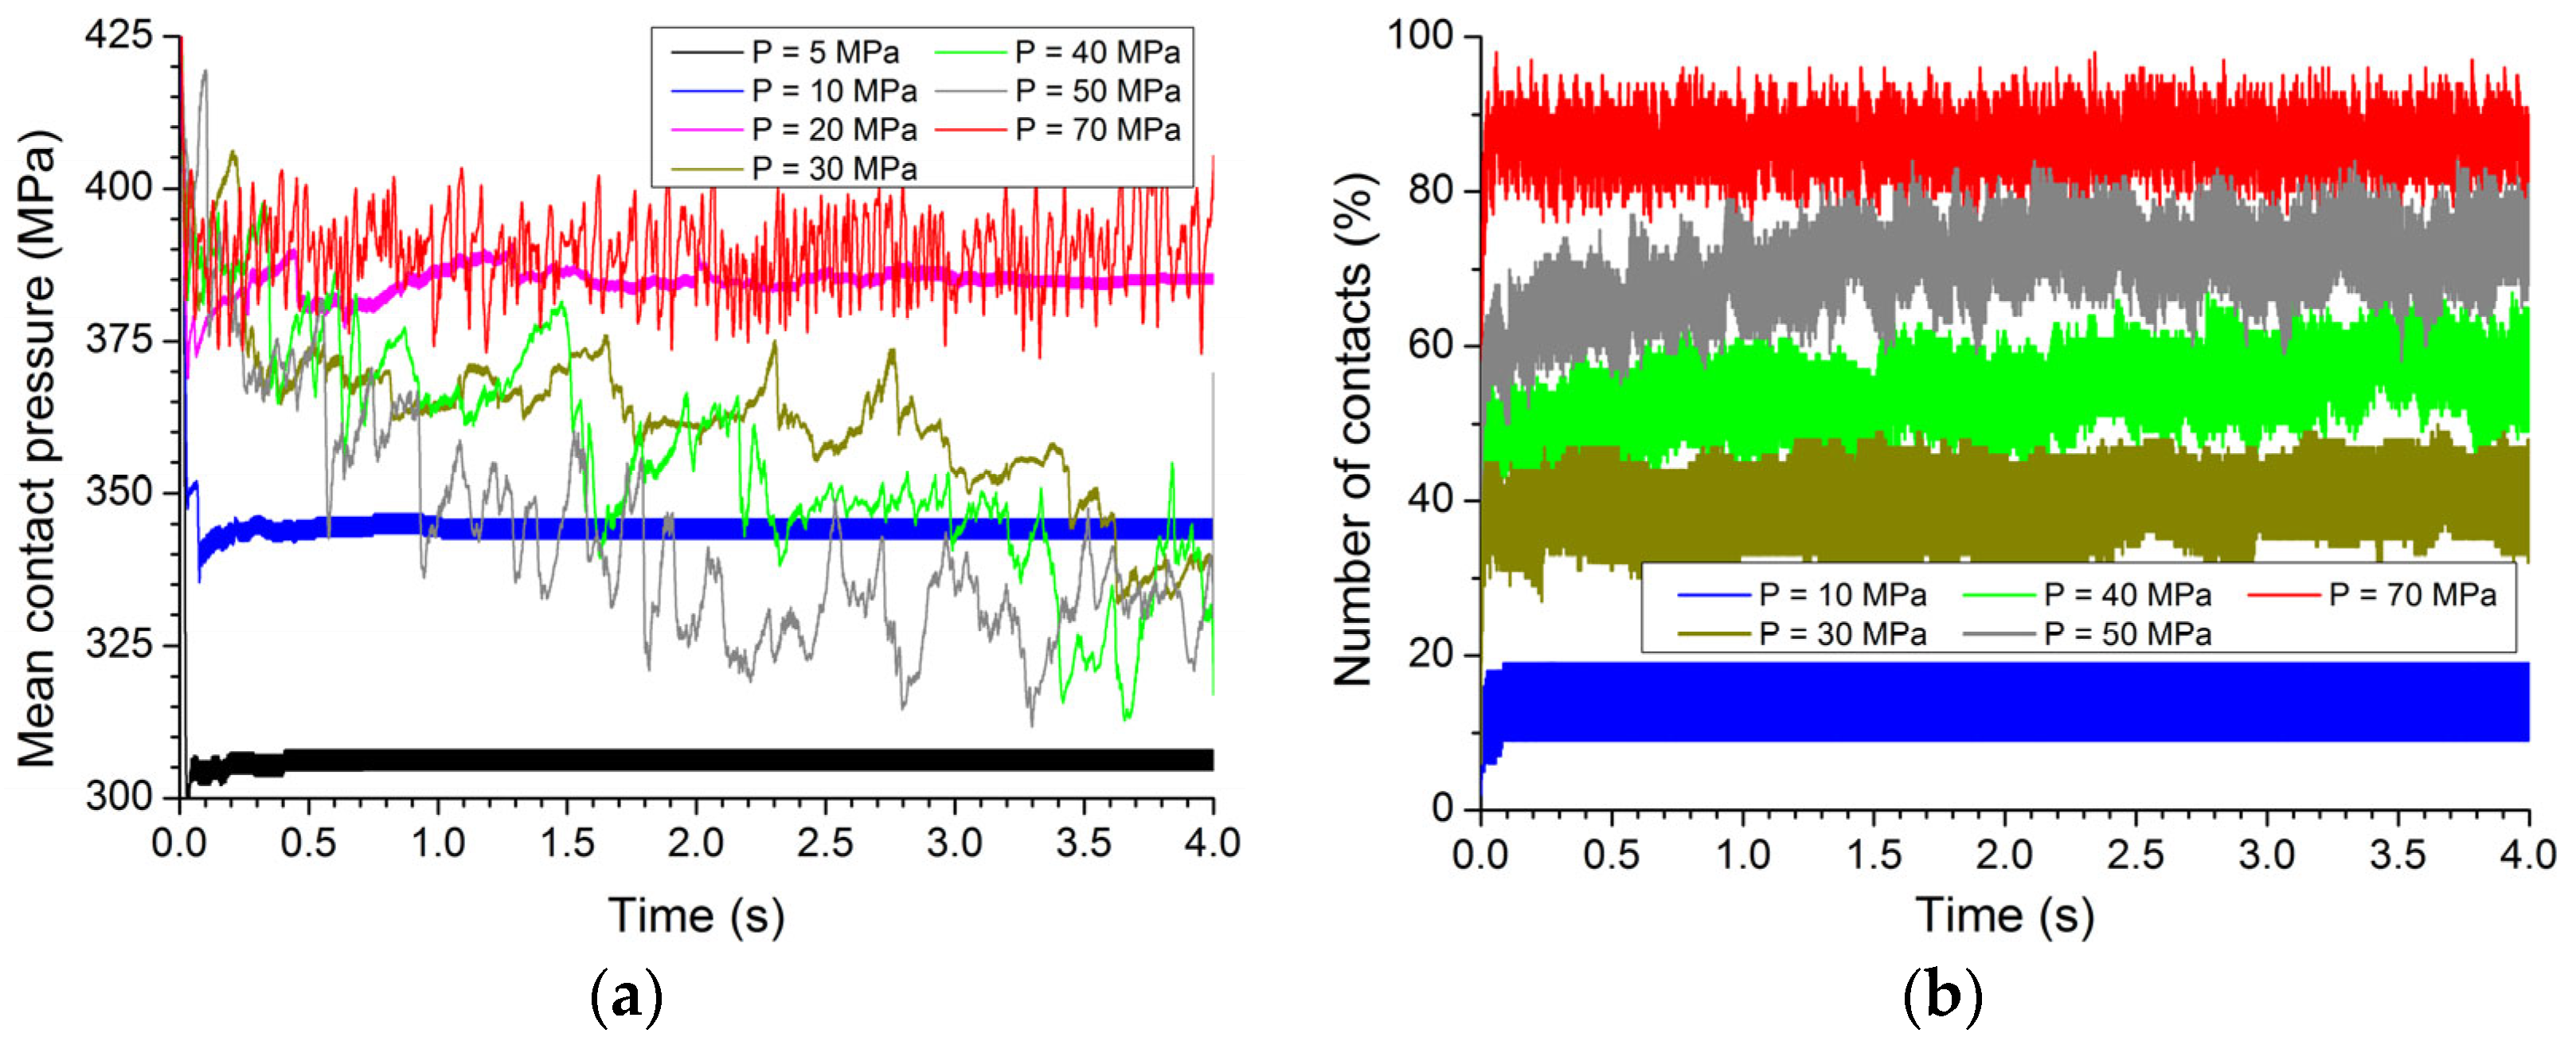
In Figure 5, it is shown how such integral characteristics as mean contact pressure Pmean and number of contacts Ncont normalized to the number of surface asperities change with the sliding time. It can be observed that as the applied pressure σLoad increases, the dynamics of variation of the average contact pressure undergoes qualitative changes. At small loads σLoad < σ L o a d c r i t (wear-free sliding), the average contact pressure reaches a steady level during the running-in stage within the first tenths of a second. In this case, the dependence PmeanLoad) demonstrates a non-linear growth. When critical load (σLoad > σ L o a d c r i t ) is exceeded, the value of Pmean gradually decreases and tends to a certain lower limit, which is due to gradual wear and surface smoothing (Figure 2, Figure 3 and Figure 4b). The characteristic time required for Pmean to reach a steady state is 1–2 orders of magnitude longer than that in the wear-free regime as well as it is decreased with the pressure. In this case, the steady-state value of Pmean is practically independent of σLoad. It is important to note that as σLoad increases, the specific number of contact spots is increased too. When Ncont approaches 100% level, the dynamics of Pmean undergoes a further qualitative change. Like with the wear-free friction, the value of Pmean reaches its steady value already during the first tenths of a second; however, the oscillation amplitude is an order of magnitude higher than that of with the wear-free sliding. Further increase in σLoad does not lead to any qualitative changes in the dynamics, yet the steady-state value of Pmean increases in proportion to σLoad because almost all asperities interact with each other.
It follows from Figure 5 that two wear regimes can be distinguished at applied pressures σLoad > σ L o a d c r i t , such as mild wear and catastrophic wear. At moderately high loads, when the steady-state specific number of contacts is no more than 80% or 90%, the failure criterion is met only for a small number of asperities. Accordingly, the wear rate is low and slowly increased with σLoad. When a certain threshold level σLoad is reached, the number of contacts approaches 100%, and, at the same time, the number of simultaneously worn asperities increases multiply, which determines the multiple increase in the total wear rate. It should be noted that, in contrast to the distinguished (sharp) boundary between the wear-free and continuous wear friction regimes ( σ L o a d c r i t ), the boundary between mild wear and catastrophic wear is diffuse within the interval ΔσLoad ≈ 10 MPa.
The temperature-induced change in the linear dimensions of asperities is determined by the rate of their frictional heating, which depends not only on applied pressure, but also on the sliding velocity. Indeed, increasing Vsl will cause the enhanced heat release on the contact spot thus accelerate its thermal expansion. The simulation results show that in sliding between two PTE materials, this effect leads to a threshold dependence of the wear rate on Vsl. 
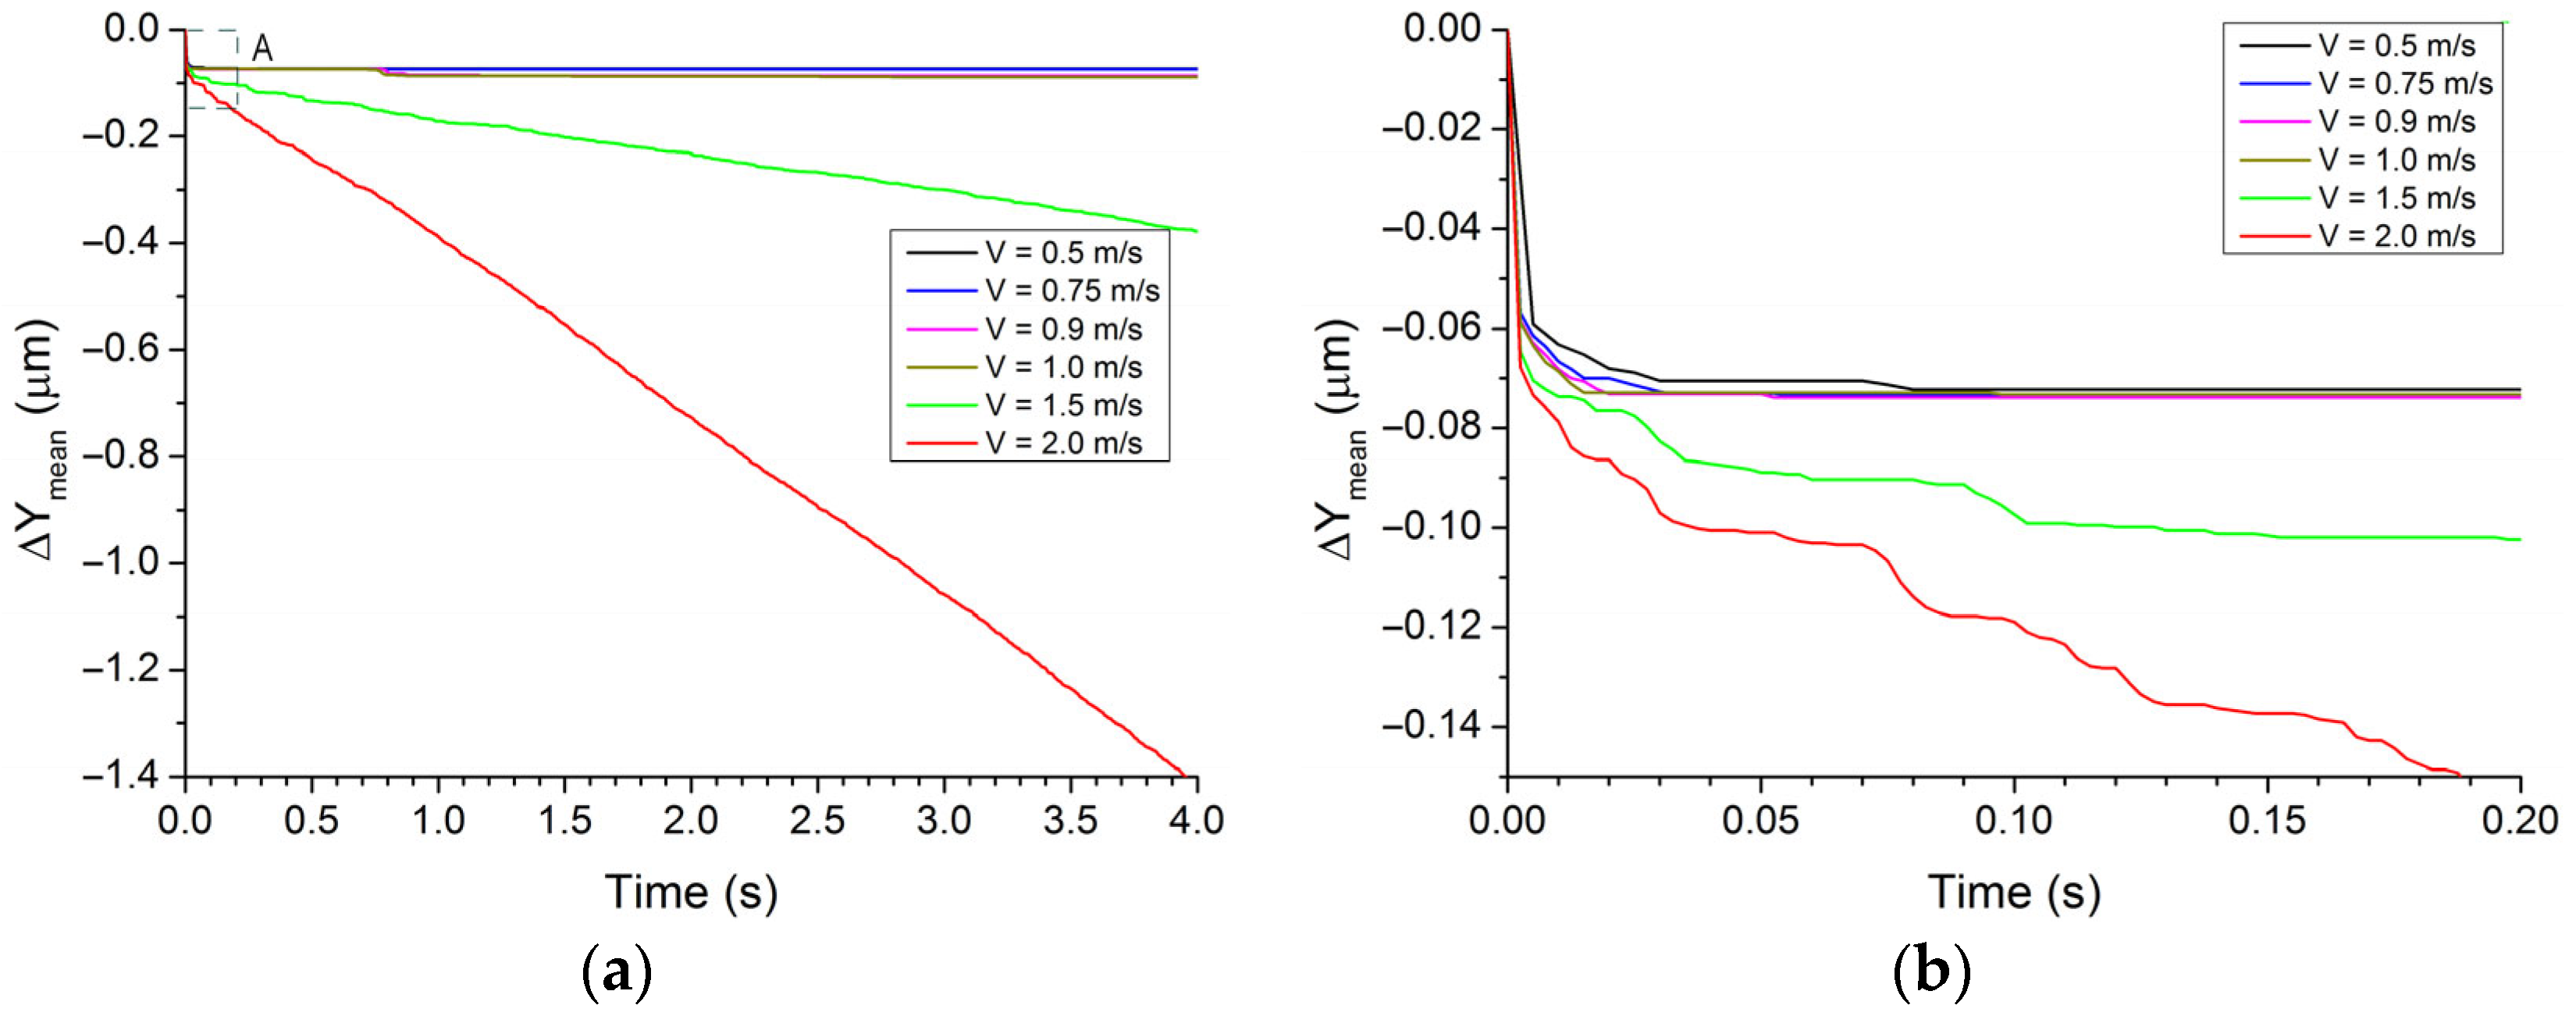
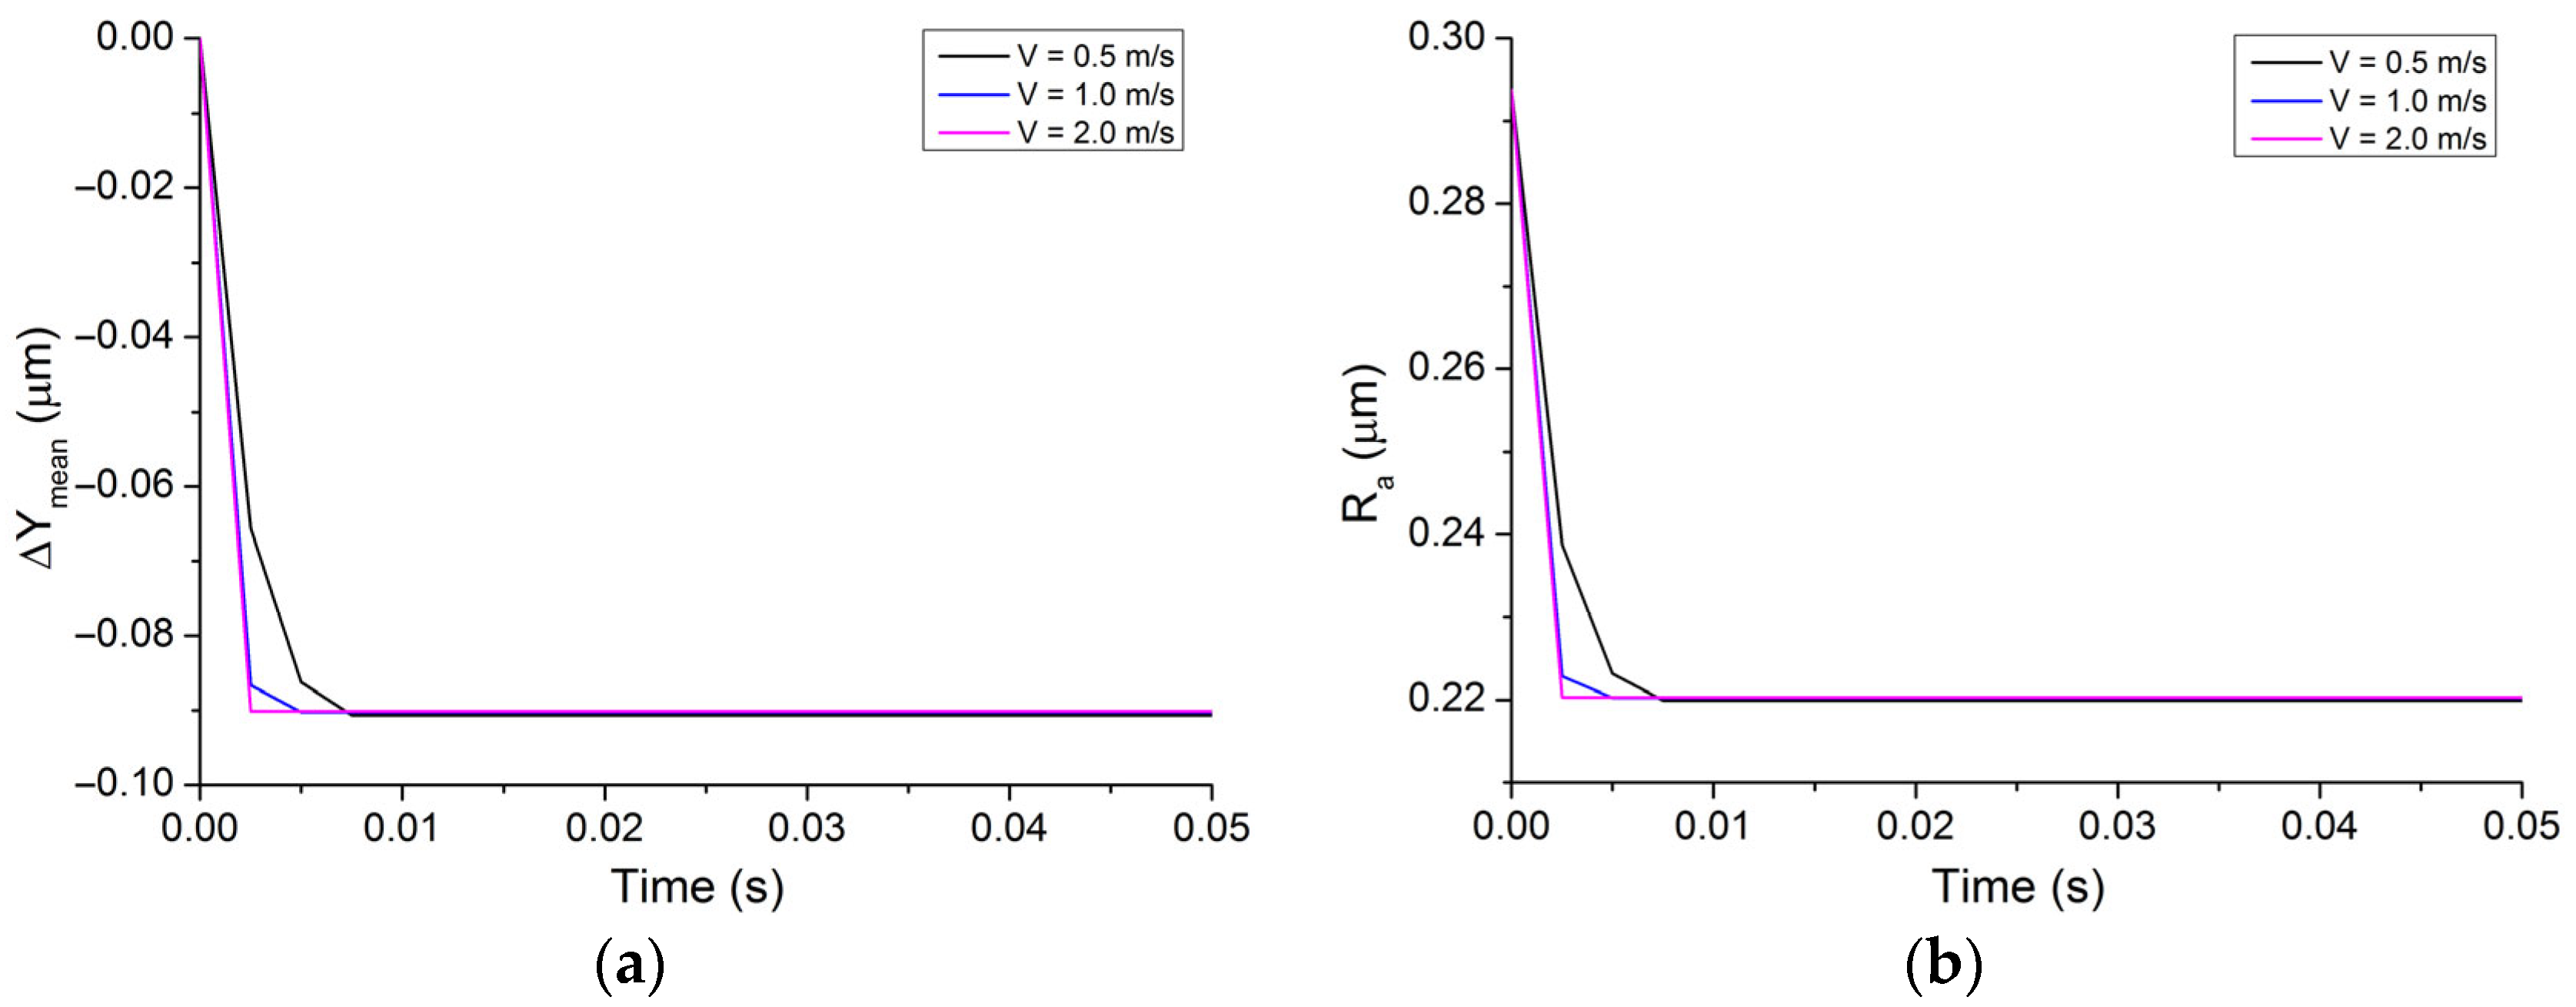
Figure 6 shows an example of wear curves obtained at σLoad = 10 MPa and various Vsl.
At small 
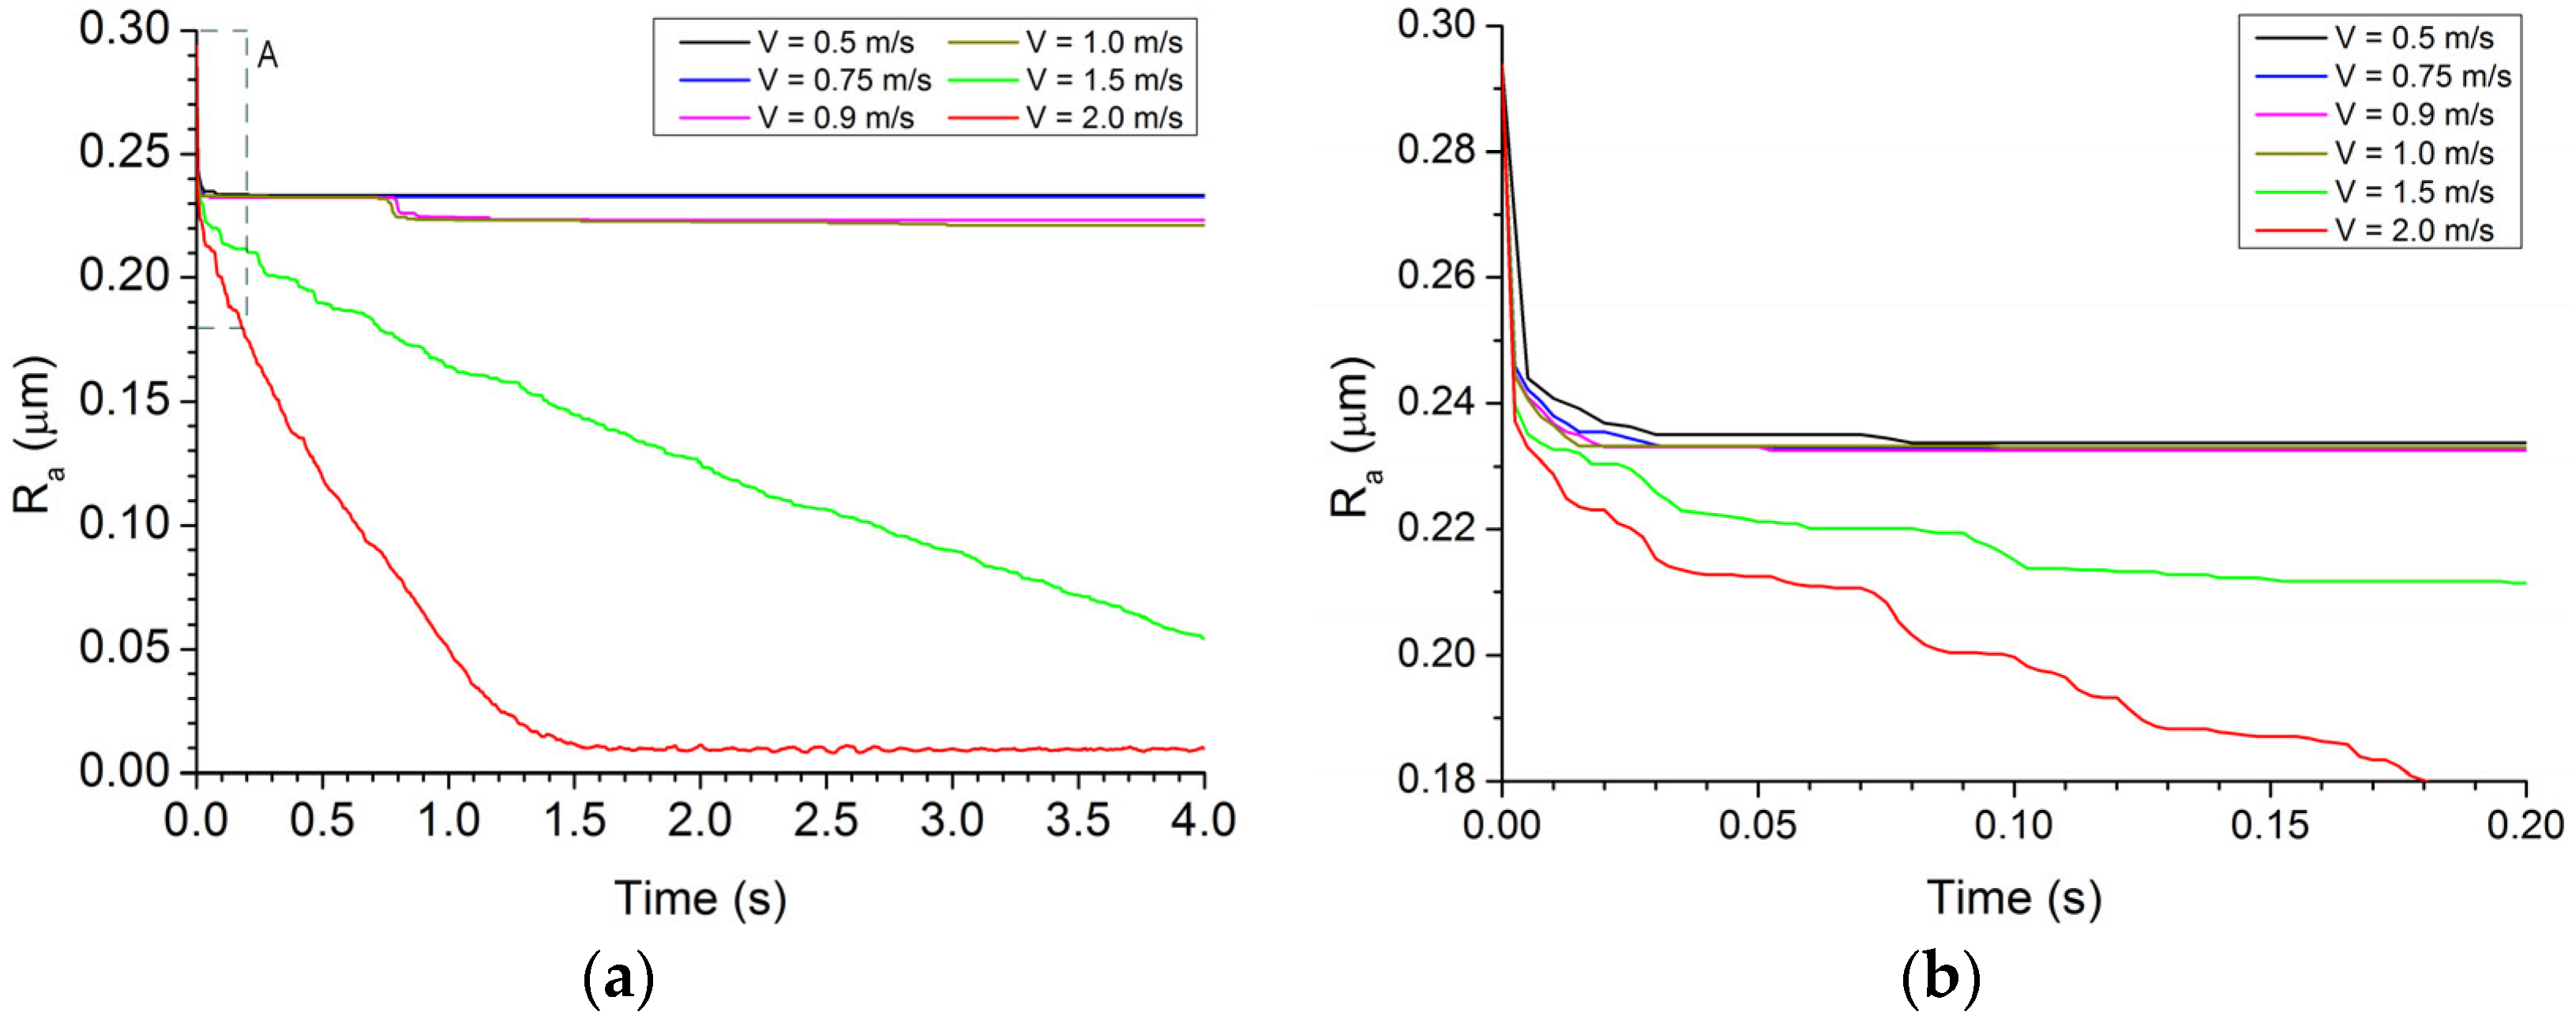
Vsl, below its critical value, at the initial stage of friction (during the first tenths of a second), only the highest asperities are subjected to wear and the surface roughness decreases by several tens of percent (Figure 7). This ensures that the pressures in the local contact spots are equalized and reduced to a level where no further wear may occur (Figure 4a,c and Figure 8). In other words, at Vsl < V s l c r i t , the wear-free regime may be established (in the given example V s l c r i t ≈ 1 m/s). When the threshold value of the sliding speed is exceeded, the wear of the contacting surfaces becomes continuous, and the wear rate increases non-linearly with the Vsl. At the same time, similarly to the results described above for various σLoad, the roughness value decreases to a certain minimum nanoscale value (Figure 7). The quantitative value of this steady level does not depend on the sliding velocity (as well as on σLoad), that is, it is a material characteristic. Similarly to what happens in the case of varying σLoad, the characteristic time for Ra to reach its minimum level decreases with the sliding velocity.
Despite the apparent similarity of the effects that are determined either by applied pressure σLoad or sliding velocity Vsl, the mechanisms that govern the transition from the wear-free to the steady wear regime are different. Thus, the existence of threshold type dependence of the wear rate on the applied load σLoad is associated with achieving a certain threshold level of local pressures, at which contact spots regularly appear where local stresses exceed their critical value and wear of the corresponding asperities occurs. Therefore, the characteristic σ L o a d c r i t is determined by the strength of the material. Thermal expansion has a significant effect on the σ L o a d c r i t 
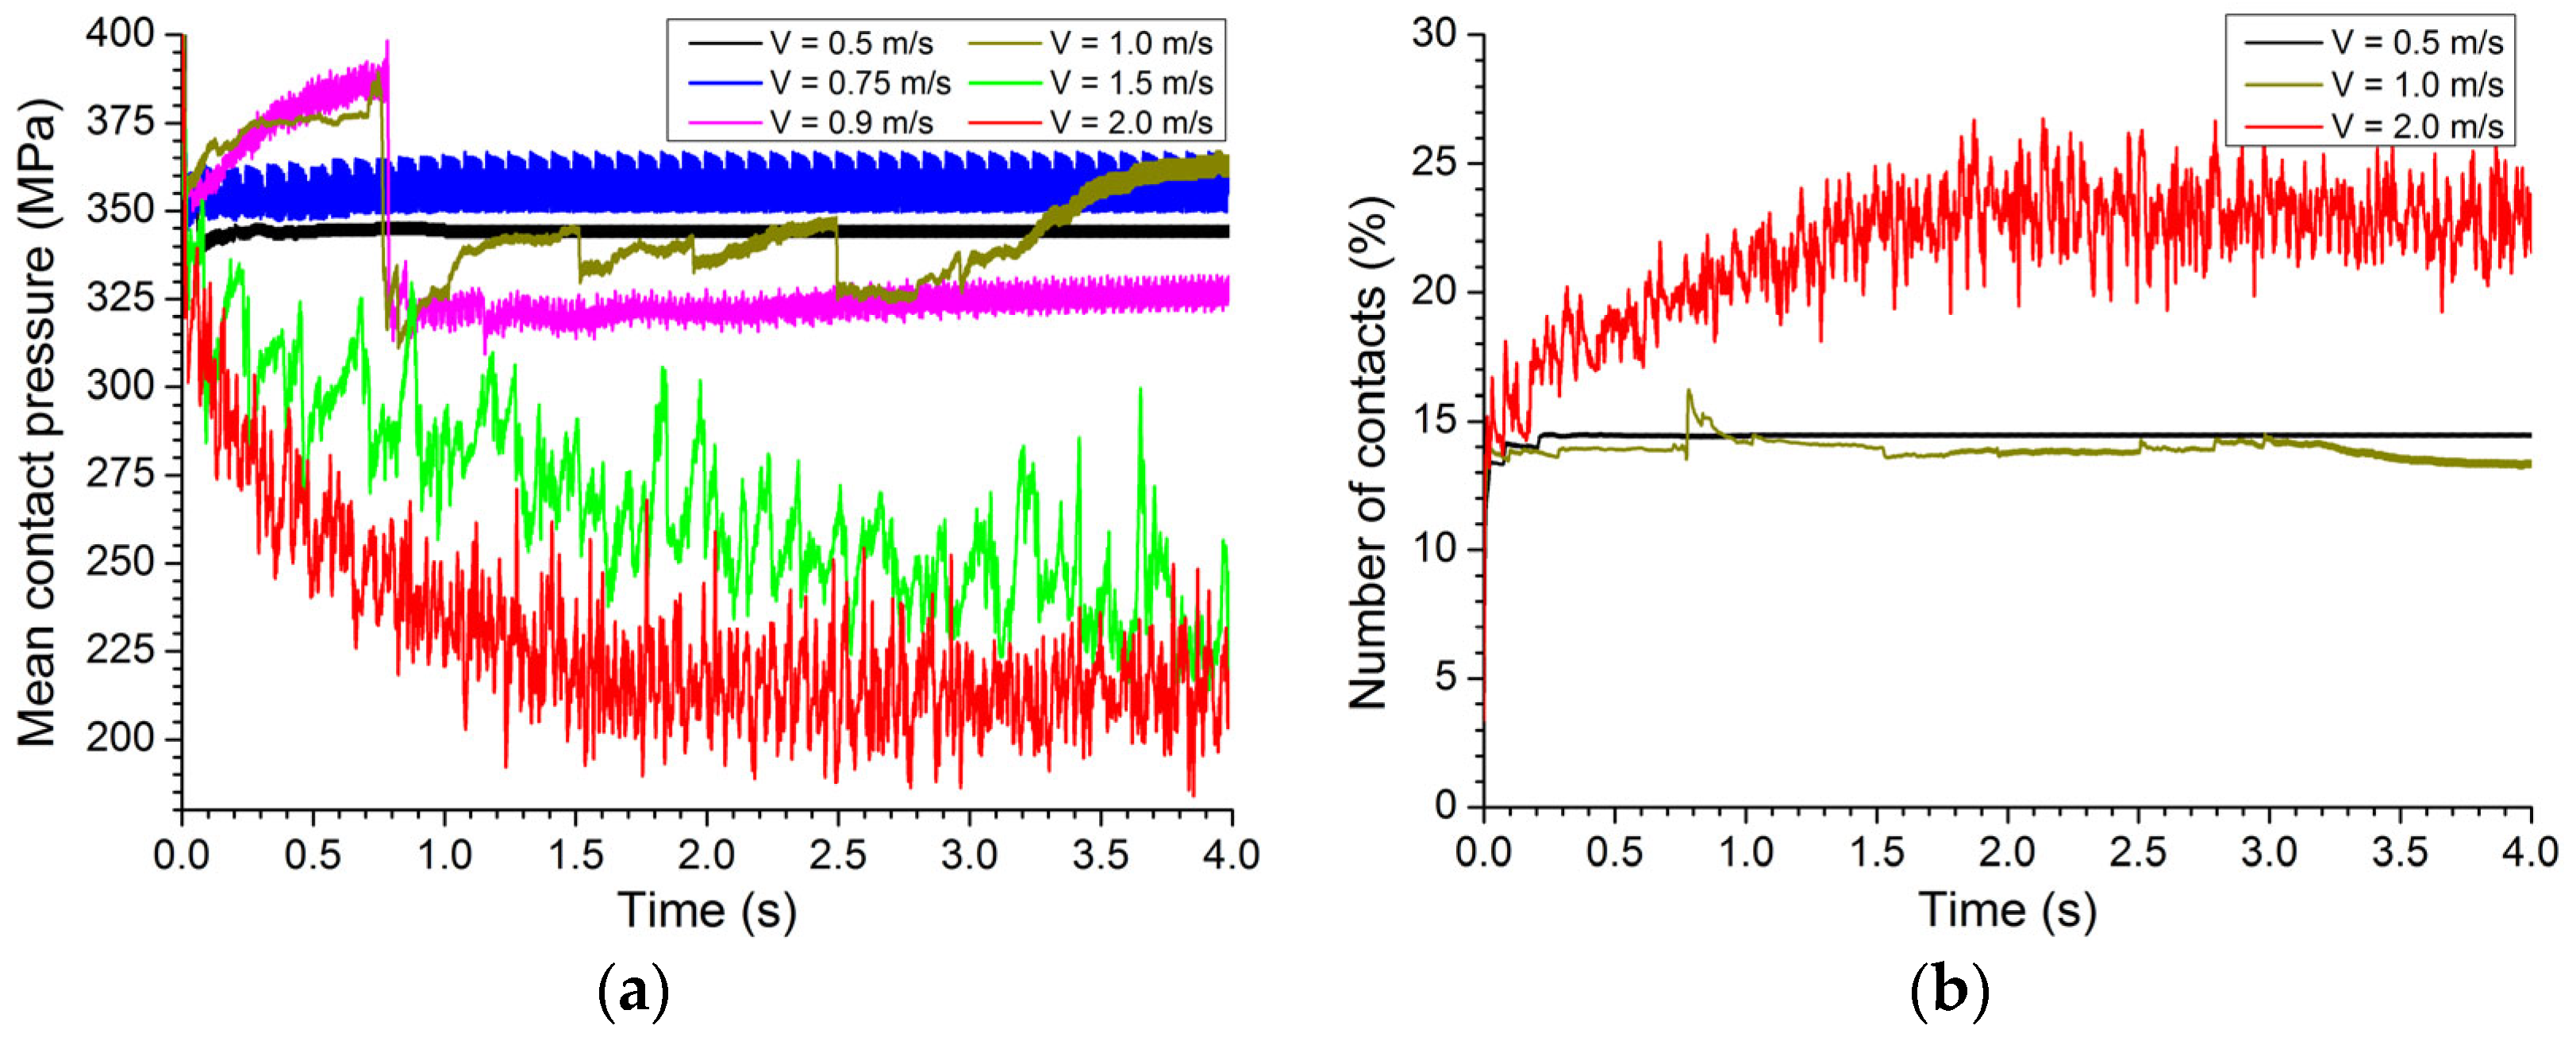
, i.e., it reduces it as will be shown in the next section by the example of an NTE material, nevertheless it is not the main reason for the transition from wear-free to steady wear. Thermally induced change in the linear dimensions of asperities is the reason that determines the sensitivity of the sliding regime to the sliding velocity. In particular, as can be seen from Figure 8, both the number of contact spots and the mean contact pressure change only slightly when passing over V s l c r i t . At Vsl > V s l c r i t , the asperities grow faster compared to their critical growth value and the contact spots regularly appear, wherein local stresses reach their critical value and asperities fail. As the sliding velocity increases, the number of such contact spots increases too, and the wear rate increases despite that the total number of contact spots grows and average contact pressure reduces. In other words, if the Vsl > V s l c r i t and the sliding velocity increases, both the inhomogeneity of the contact pressure distribution and the number of “critically” loaded contact spots increase too (Figure 9). In this range of Vsl values, the wear of the most highly loaded asperities and corresponding smoothing of surfaces do not compensate for the effect of their thermal expansion.
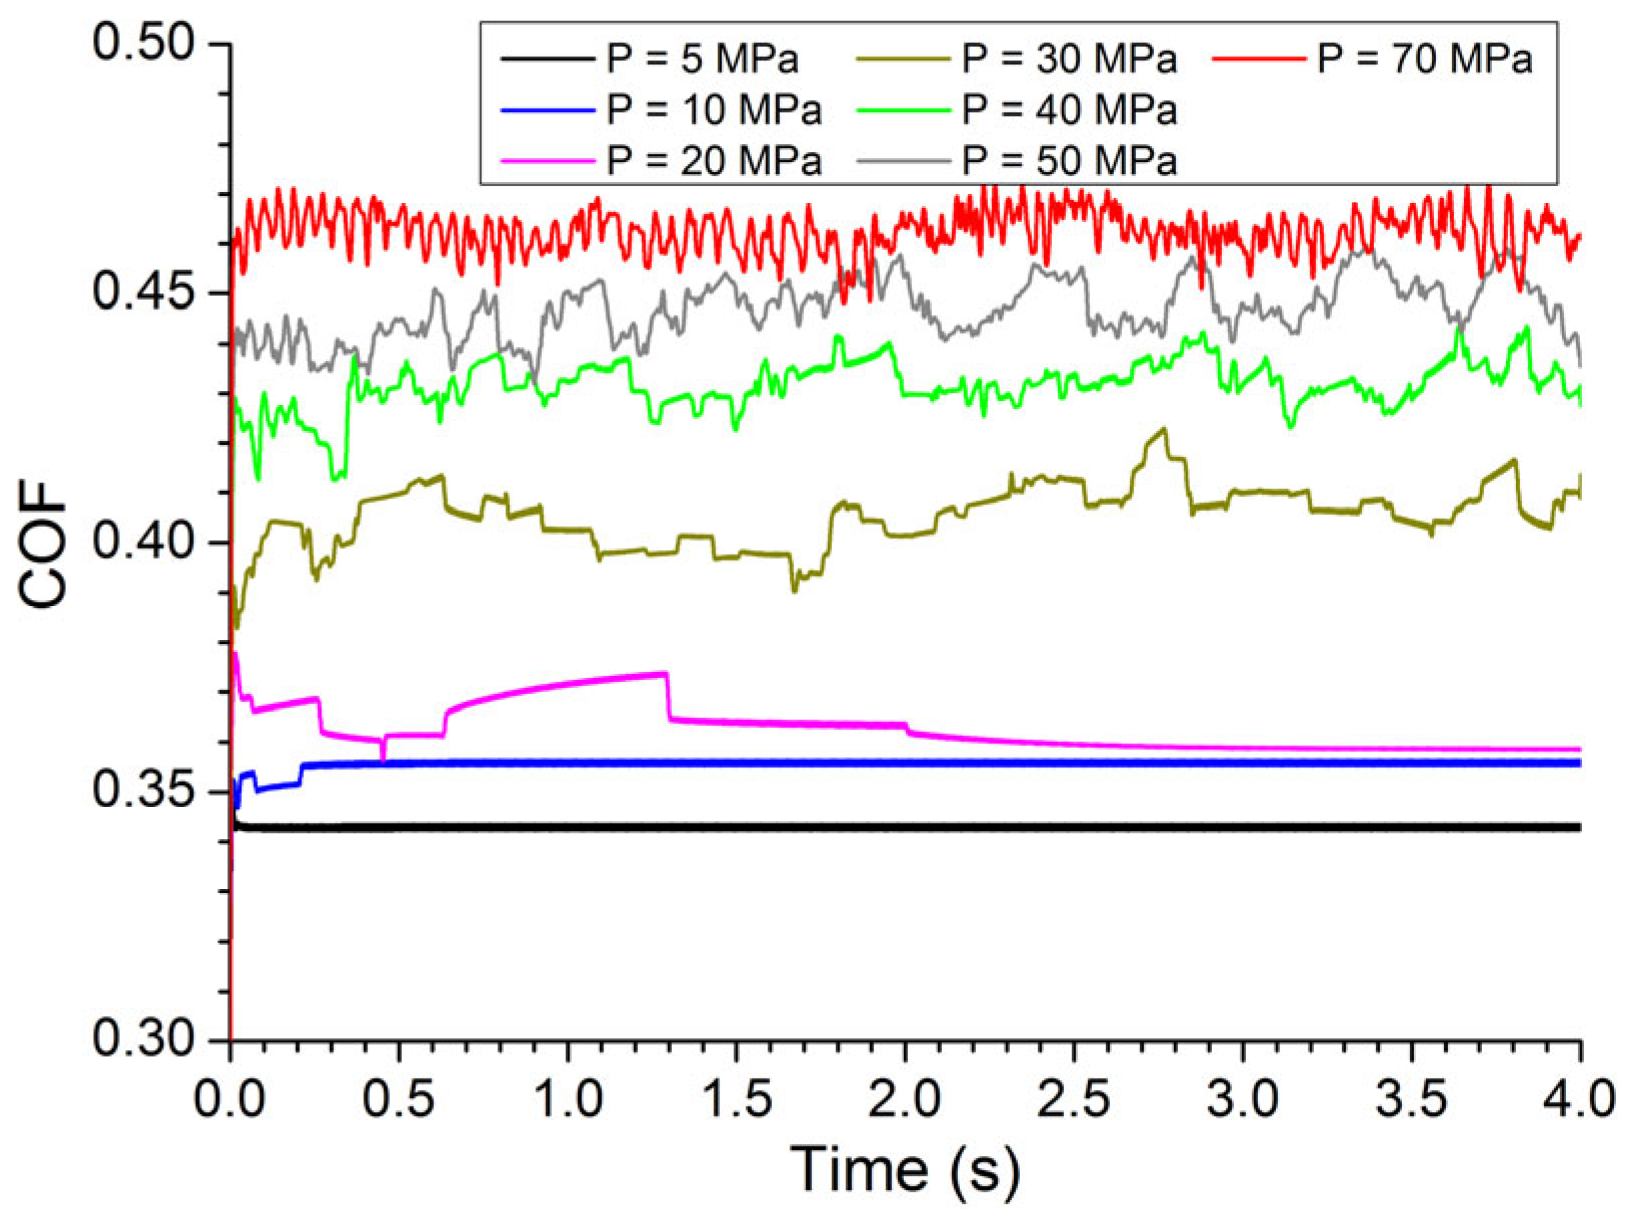
When critical value of either applied pressure or sliding velocity is exceeded, a qualitative change in the wear regime is also manifested in the sliding characteristics (Figure 10) when dynamics of the coefficient of friction (COF) is dependent on the σLoad. At low pressures, when wear-free wear is realized, the COF value reaches a steady value already during the first seconds or even tenths of a second, after which it remains constant (the amplitude of COF dynamic oscillations is insignificant). The steady value of COF slightly increases with σLoad (ΔCOF ≈ 0.02 in the interval 0.3 σ L o a d c r i t < σLoad < σ L o a d c r i t ). When the threshold value of the applied pressure (σLoad > σ L o a d c r i t ) is exceeded, there is an abrupt increase in the average COF value (by 0.04–0.1 depending on σLoad). In this case, the COF value is unstable. Irregular oscillations in the friction force occur that are determined by wear and tear of asperities as well as due to continuous changes of the worn surface topology. As in the wear-free mode, the average COF increases non-linearly with σLoad (the COF growth rate decreases as the applied load increases).
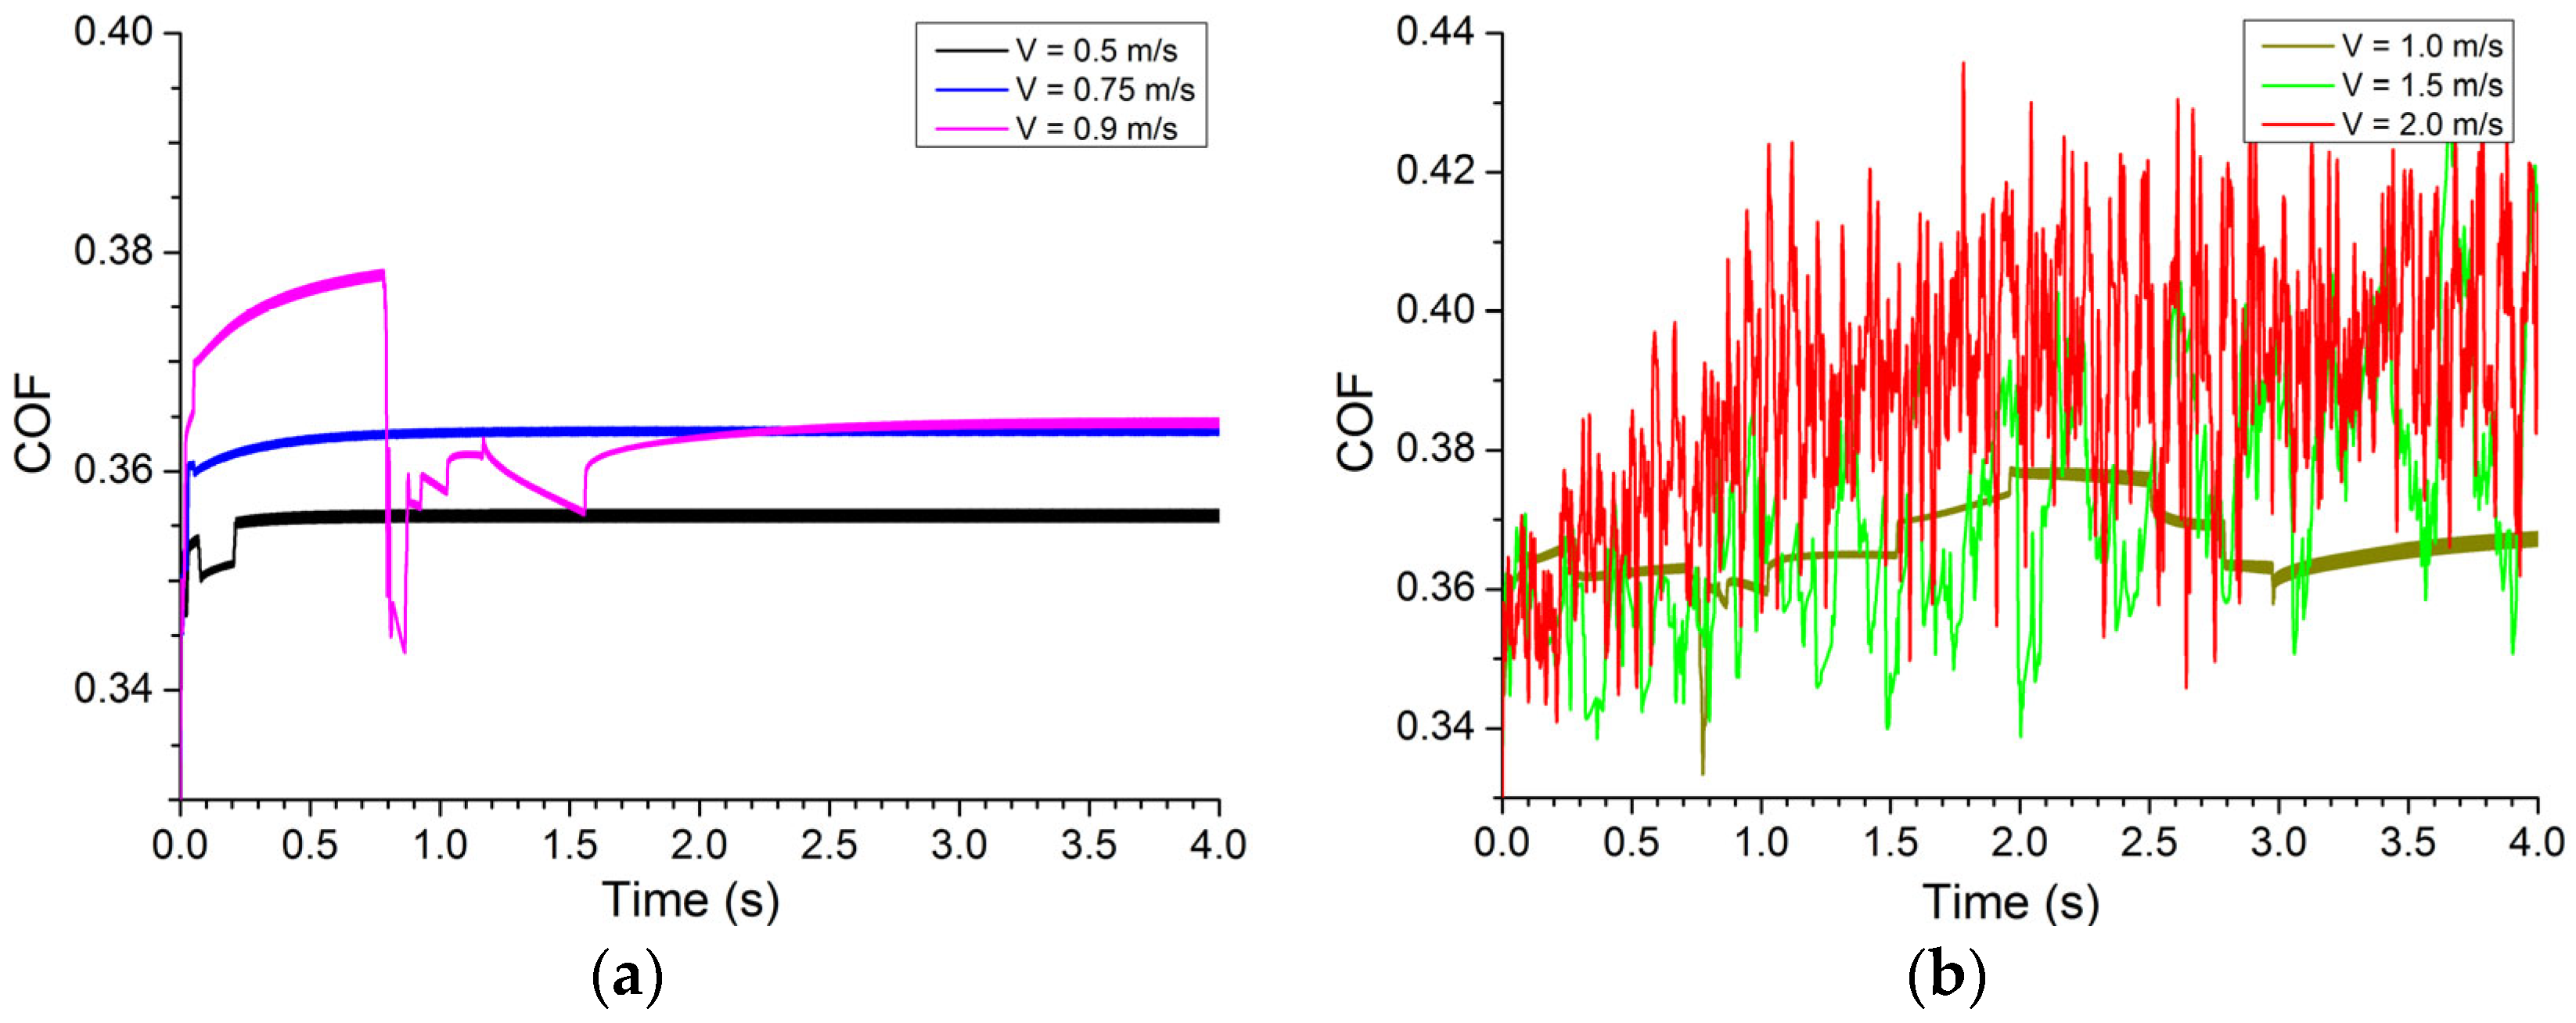
Figure 11 shows the COF dynamics obtained at various sliding velocities Vsl. Similarly to the dependence on σLoad considered above, COF is stable in the range of Vsl values corresponding to the wear-free regime, and its steady-state value is almost independent of the sliding velocity (the increase is less than 0.02). When the critical sliding velocity is exceeded, sliding becomes unstable, and the amplitude of dynamic oscillations increases multiply with the sliding velocity. In particular, at Vsl = 2 m/s, the scatter of dynamic oscillations reaches 0.1, which is five times as much than for the cases shown in Figure 10. Alike the wear-free mode, the average COF value increases with the Vsl, although less significantly than in the above-discussed case for variation of the applied pressure σLoad.
Numerically derived effects of normal load and sliding velocity are in qualitative agreement with the experimental data obtained on traditional ceramic materials (oxides, carbides, and nitrides). It is a traditional approach to delineate two wear regimes, such as mild wear (low wear rate) and severe wear. The mild wear regime occurs usually at low contact pressure and accompanied by smoothing the worn surfaces [5,59]. The COF values are also at a minimum but may grow with pressure [60,61]. Severe wear regime is established at higher contact pressures close in the order to the tensile strength of the materials [5,59]. Not only the wear rate but also the size of wear debris increases with the load. Wear mechanism is changed when reaching the contact pressure close to the tensile strength so that whole grains may be pulled out of the surface, and both wear rate and surface roughness increase drastically [62]. Experimental results show that severe wear regime is typical during initial (running-in) stage sliding at both low and high contact pressures. The sliding velocity has its influence on both wear rate and COF when they increase with it [61]. The transition from mild-to-severe wear with increasing pressure or sliding velocity occurs rather sharply in the narrow ranges of these parameters [59]. Characteristic limiting values of sliding velocity differ from ceramics to ceramics, as well as for different geometry of experiments but stay within the 10−2–100 m/s range.
The results of modeling are consistent with those obtained from experiments that are not just qualitative. In particular, COF values in the range 0.3–0.4 were obtained on ZrO2 using a pin-on-disk scheme and both sliding speed and pressures close to those used in this work [63].
As the above-discussed results suggest, the asperity-based model used in this work not only was adequate for describing the wear and friction on ceramics but also allowed for the obtainment of reasonable quantitative characteristics except for the very high contact pressure values when some dramatic changes of wear mechanism may occur that have never been considered in the numerical model. Moreover, such a model validation improves the reliability of results obtained in the following section on the NTE materials. It is of high importance especially if there is no experimental data on wear and friction of the NTE materials.

3.2. Friction and Wear of NTE Material

It was shown above that thermal expansion of the surface asperity had a significant effect on both wear rate and COF value of the PTE materials. In particular, thermal expansion leads to a narrowing of the ranges of pressures and sliding velocities at which a wear-free friction regime can be observed. The results obtained allow suggesting that the use of NTE materials can contribute to the expansion of these intervals. To verify this assumption, an NTE model material was considered, whose physical and mechanical properties corresponded to those of scandium tungstate (ScW3O12). It is important to note that the elastic and strength characteristics, heat capacity and thermal conductivity of this NTE material are comparable with the corresponding characteristics of the PTE model material considered above (ZrO2), and the CTE values of these two materials are opposite in sign and close in modulus. This allows analyzing the effect of CTE in various sliding conditions using real, rather than abstract model materials [50]. Moreover, the same characteristic intervals of applied pressure σLoad and sliding velocity Vsl were considered for this model NTE material.
Figure 12 shows wear curves for model NTE material at different σLoad values and Vsl kept constant. It can be seen that alike the PTE material (Figure 2), at the end of the short initial running-in stage (wear of the highest initial asperities), a steady sliding regime was established. Two wear modes can also be distinguished: wear-free and continuous wear regimes. However, for NTE materials, the value of the critical applied stress σ L o a d c r i t is almost by a factor of three greater than that obtained for the above considered PTE pair (80 MPa and 30 MPa, respectively), despite the fact that the strength of the NTE material is only about 35% lower than the strength of the PTE material. Obviously, this effect is associated with the thermal contraction of the asperities.
One can see from Figure 13 that for σLoad < σ L o a d c r i t ( σ L o a d c r i t ≈ 80 MPa), the steady value of Ra decreases by an order of magnitude with σLoad even becoming the nanoscale and reaches its minimum value when σLoad σ L o a d c r i t . The steady value of Ra increases with transition to the continuous wear regime (σLoad > σ L o a d c r i t ), albeit remaining within the nanoscale. At the same time, in the case of the PTE material, there are two characteristic minima of the steady Ra values (Figure 3). The first minimum refers to the wear-free sliding (σLoad σ L o a d c r i t ≈ 30 MPa). The minimum steady Ra value (σLoad σ L o a d c r i t ) is approximately 40% lower than the initial Ra value. With transition to the continuous wear regime (σLoad> σ L o a d c r i t ), the steady value of Ra (101 nm) is the same for all σLoad values and is an order of magnitude lower than the initial value of Ra.
Thus, thermally induced contraction of surface asperities is a factor contributing to extreme smoothing of surfaces even in the wear-free sliding. 
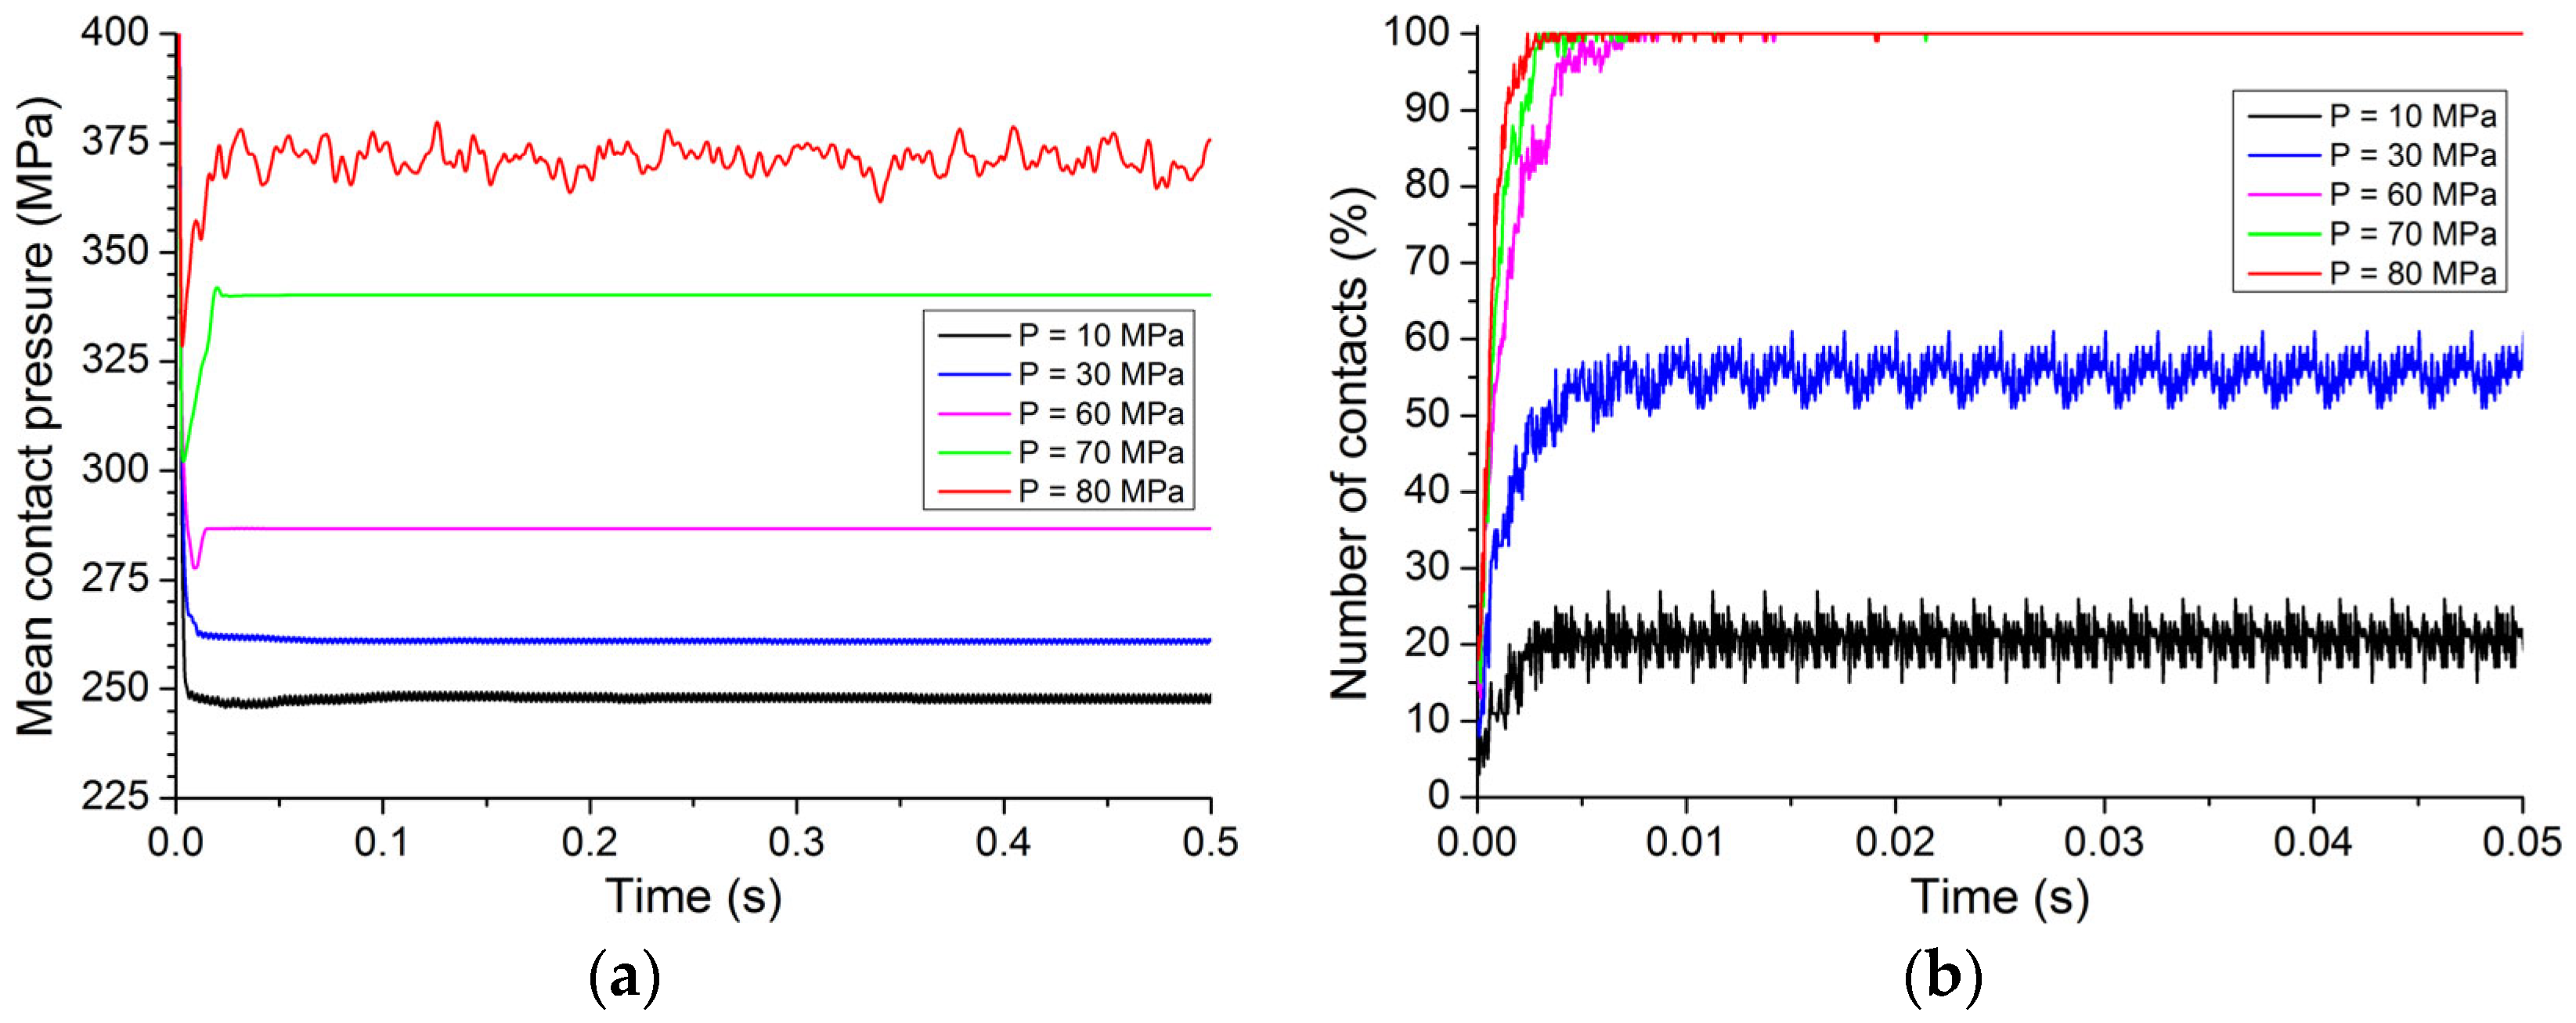
Figure 14 shows the dynamics of mean contact pressure and number of contact spots at different values of σLoad. As σLoad increases, the steady-state values of both Pmean and Ncont increase monotonically (Ncont reaches 100% at σLoad ≈ 50 MPa). Comparison with similar dependences for PTE material (Figure 5) shows several qualitative differences. First, for the NTE material, the dynamics of the mean contact pressure and the number of contact spots is the same for both wear-free and continuous wear regimes. After a short initial running-in stage, both Pmean and Ncont reach their steady-state values and subsequently undergo only minor oscillations around a constant average level. At the same time, on the PTE material, crossing the boundary between the two modes leads to a strong instability of the Pmean (significant irregular fluctuations and a gradual overall decrease to a minimum level that is the same for different σLoad > σ L o a d c r i t ). In addition, full surface contact (Ncont ≈ 100%) is already achieved in the wear-free mode on the NTE material, long before σ L o a d c r i t is reached (at σLoad ≈ 50 MPa ≈ 0.6 σ L o a d c r i t ), while in the case of PTE material, full surface contact occurs already in the continuous wear mode (at σLoad ≈ 100 MPa ≈ 3.3 σ L o a d c r i t ). Such a twofold difference cannot be explained only by the lower stiffness of the NTE material (its Young’s modulus is only 25% less than the Young’s modulus of the PTE material). The above-described differences are determined by the effective smoothing of the surfaces due to thermal contraction of the surface of the NTE material.
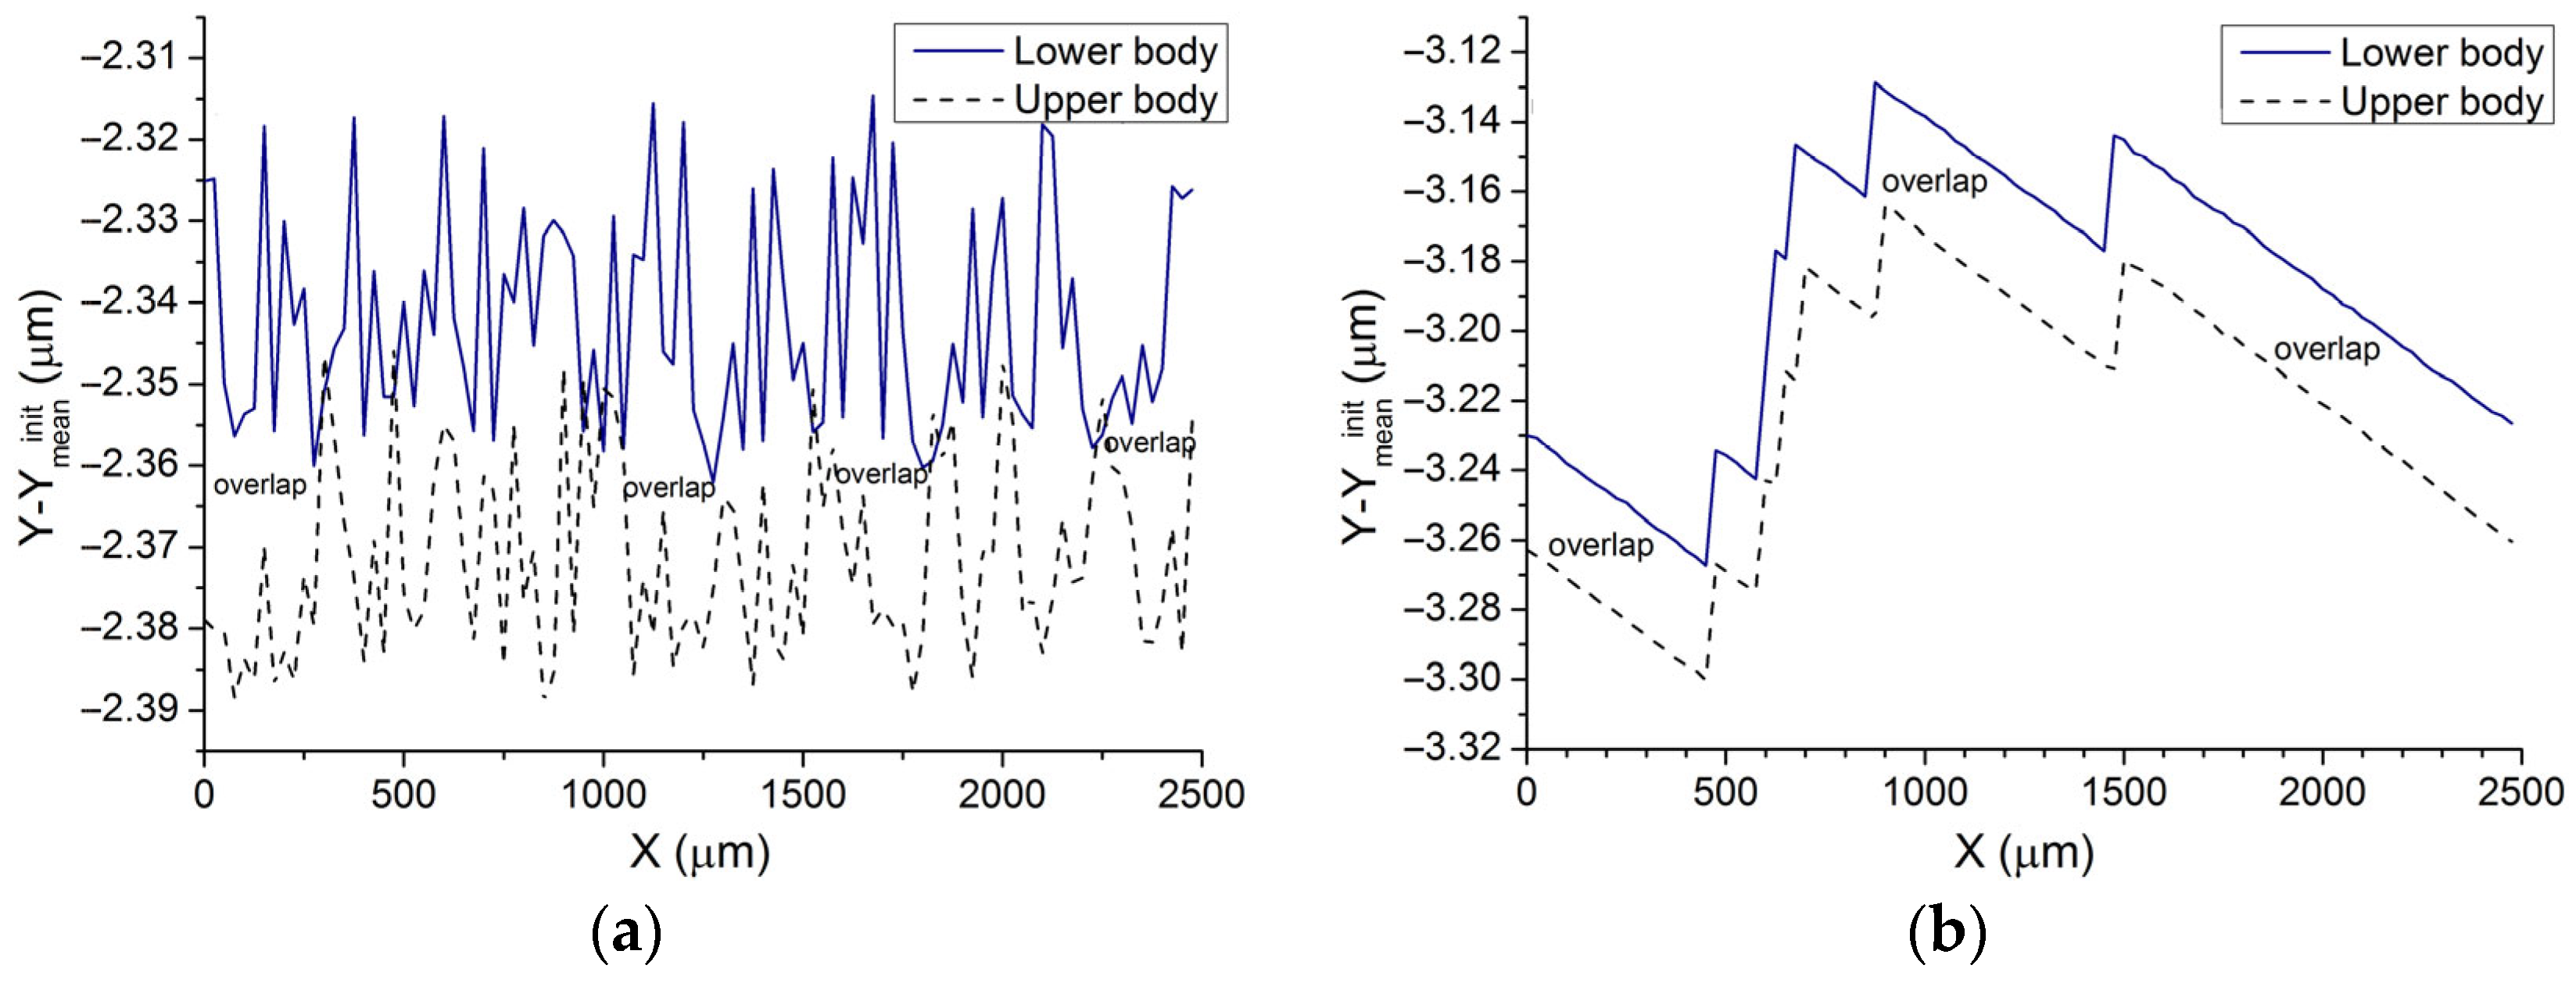
Figure 15 shows examples of the NTE material surface profiles obtained in wear-free (Figure 15a) and continuous (Figure 15b) wear regimes. Not only the highest asperities are subjected to wear at this running-in stage and at “small” applied pressures (σLoad < σ L o a d c r i t ) but all of them are reduced in height (Figure 15a,c).
More efficient smoothing is achieved when extra contact spots are generated, which reduce the contact pressure compared to those obtained on the PTE material. This explains, in particular, high stability of Pmean and Ncont during sliding, smoother profile of the worn surfaces, and multiple increase in the value of the critical applied pressure during the transition from positive (PTE) to negative (NTE) sign of thermal expansion.
These clear advantages of NTE material may, however, become a negative factor at high pressures and in continuous wear regime (σLoad > σ L o a d c r i t ). Indeed, at σLoad σ L o a d c r i t , a much greater real contact area is involved in sliding if local contact pressures were distributed almost uniformly. Accordingly, the wear rate in the NTE friction pair becomes high immediately after overcoming the σ L o a d c r i t value. This qualitatively distinguishes NTE friction pairs from those made of PTE materials. In the latter case, the wear rate at a slight excess of σ L o a d c r i t is low and gradually increases with increasing σLoad. Moreover, for the same large values of σLoad (corresponding to continuous wear in both NTE and PTE friction pairs, when in both cases the specific number of contacts is about 100%), the wear rate in the NTE friction pair is many times higher than that of the PTE friction pair. This is also a consequence of the different sign of the CTE. Thermal expansion of surface asperities in PTE material helps reducing the number of contacts (and hence the number of contacts under wear at the same time) and thus prevents an increase in the wear rate. In contrast, the thermal contraction of the surface asperities of the NTE of the material tends to increase the number of contacts and, accordingly, stimulate increasing the wear rate (due to the overall high level of stress, Figure 16). Thus, NTE materials are “genetically predisposed” to high wear when a critical applied load is exceeded. When the critical load is exceeded, wear mode switches to catastrophic one (while in PTE materials this leads to mild wear, which gradually turns into catastrophic wear with increasing σLoad).
The NTE materials revealed one more specificity in comparison with the classical PTE materials, i.e., the absence of a critical sliding velocity. This may be a consequence of the fact that the velocity dependence of wear is determined by enhanced heat release on the contact spots with increasing Vsl and corresponding height contraction. As an example, Figure 17 shows surface roughness vs. time curves for different sliding velocities and the same σLoad < σ L o a d c r i t value. An increase in Vsl leads to the accelerated crossover of the friction pair to the stationary wear-free regime and, at the same time, does not change the roughness parameters as well as the amount of wear at the running-in stage.
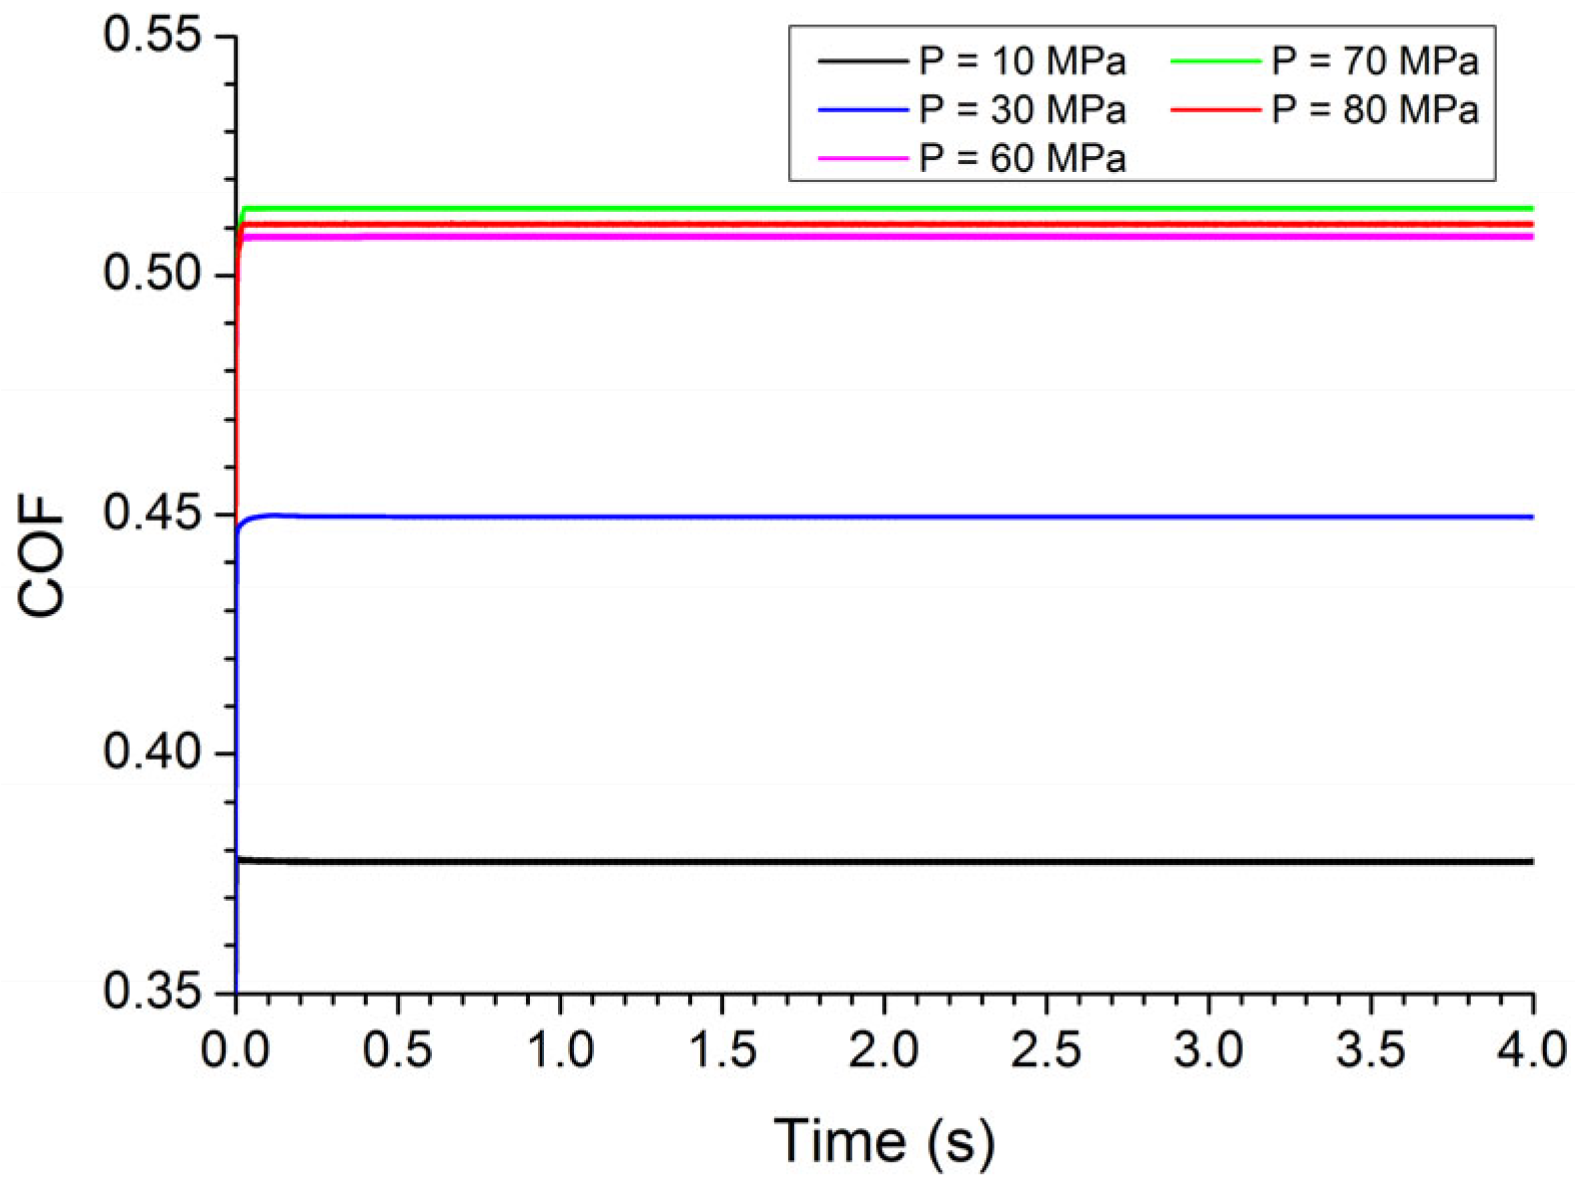
The better steadiness of sliding on the NTE materials both in wear-free and catastrophic wear modes is due to thermally induced smoothing of the contact surfaces, which is also manifested in the high stability of COF (Figure 18). The value of COF increases non-linearly with increasing σLoad, while the amplitude of oscillations near the mean value decreases. Crossing the σ L o a d c r i t threshold is not accompanied by the visible changes in COF dynamics, despite the catastrophic wear.

3.3. Wear-Free Regime in Sliding on PTE and NTE Materials

The results of modeling showed that for any finite value of applied pressure σLoad there is a finite value of critical sliding velocity V s l c r i t , which divides between two wear modes (wear-free and continuous wear). The reverse statement is also true when for any finite Vsl there is a finite critical pressure σ L o a d c r i t . In other words, critical parameters σ L o a d c r i t and V s l c r i t are not independent from each other since both contact pressure (it is directly related to σLoad) and sliding velocity Vsl determine frictional heating rate. Intuitively, it can be suggested that σLoad and Vsl should have equal effects on the wear-free-to-continuous-wear transition and that V s l c r i t ( σ L o a d c r i t 
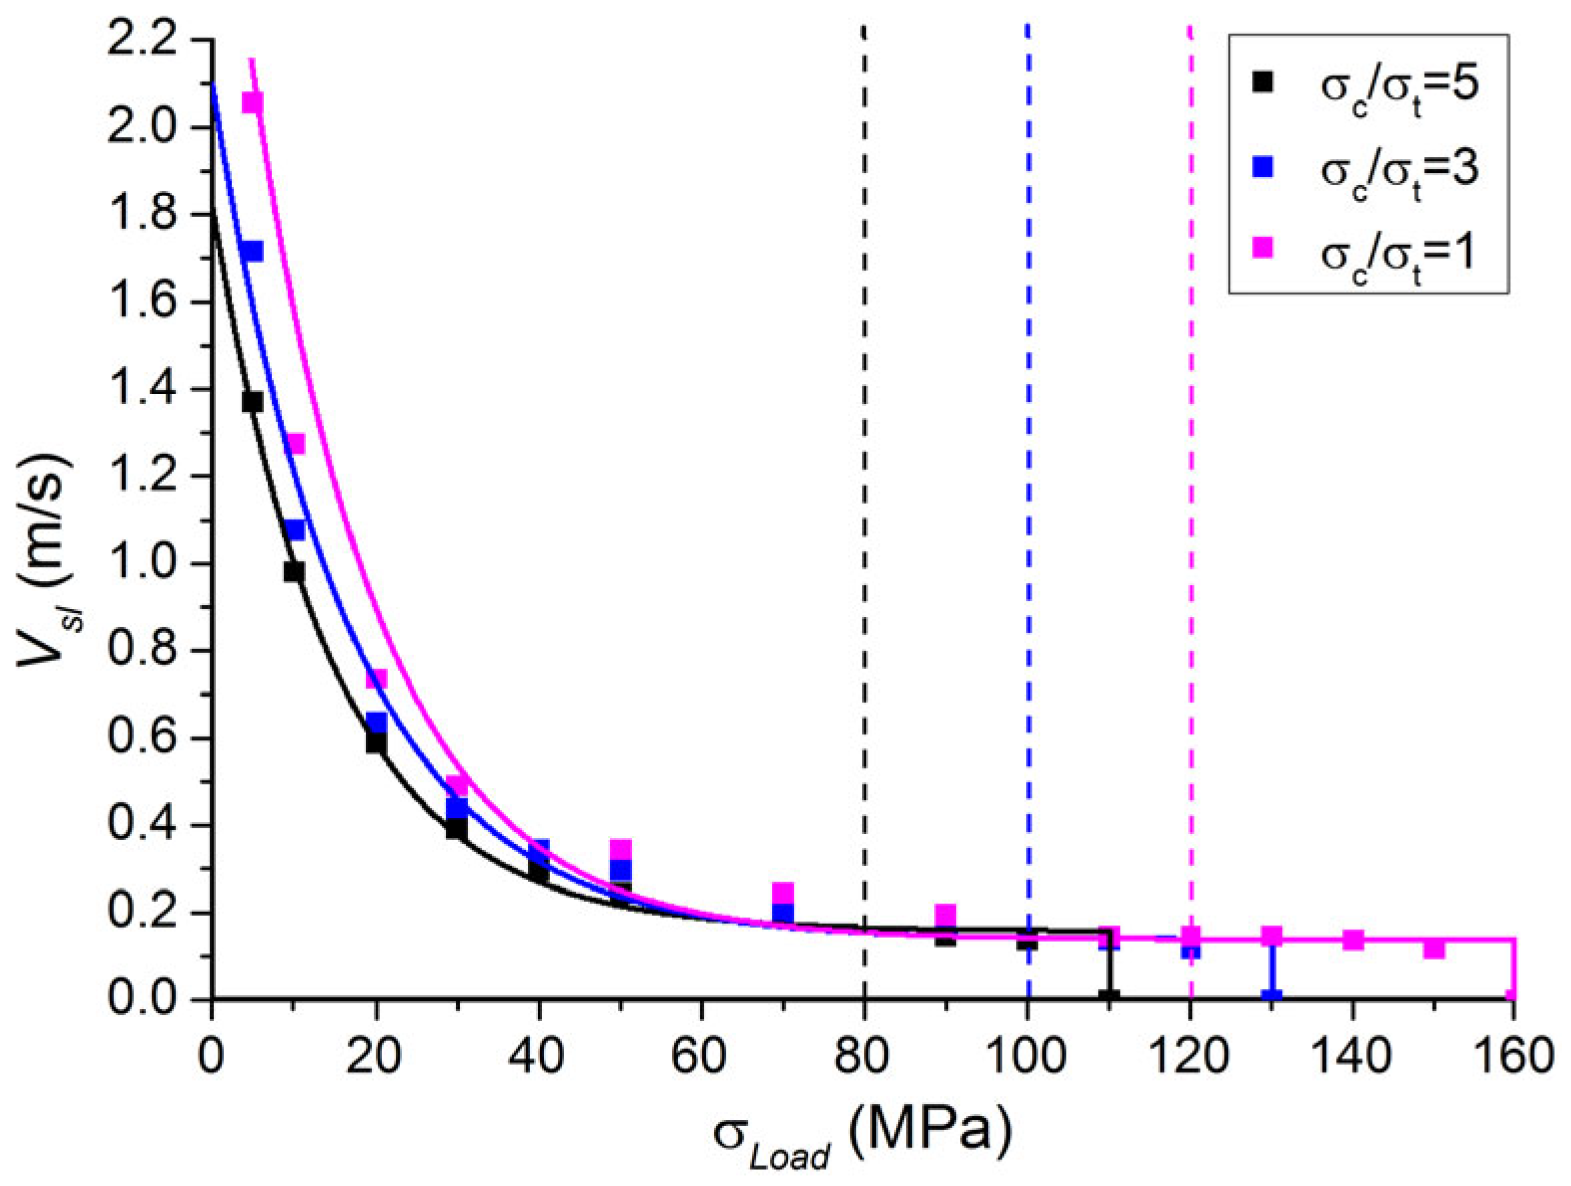
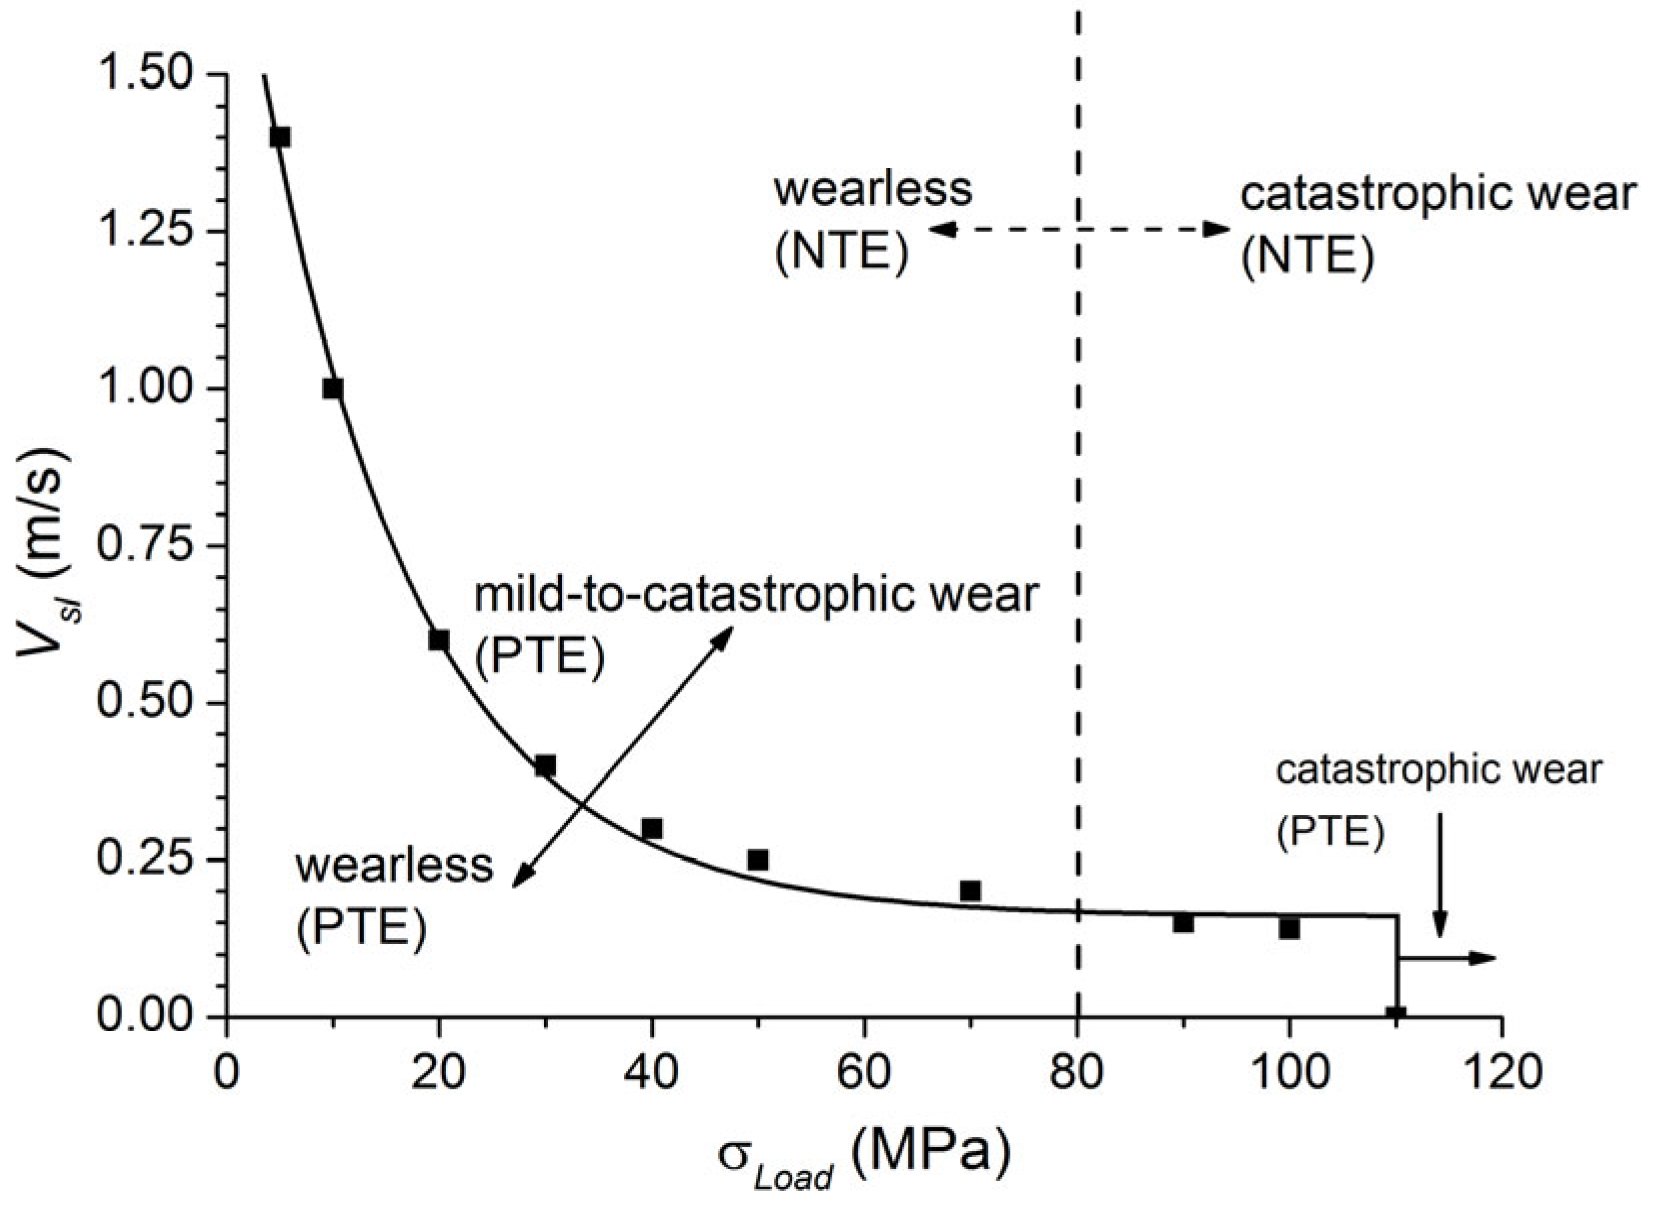
) should be a linear dependence. In fact, the numerically obtained V s l c r i t ( σ L o a d c r i t ) dependence for the PTE friction pair is non-linear (Figure 19) and can be acceptably approximated using an exponential function V s l = A + e B σ L o a d , where A ≈ 0.15 m/s, B ≈ 0.0675 MPa−1 for the PTE material discussed. The existence of such a non-linearity is a direct indication that the applied pressure and sliding velocity have different contributions to wear-free-to-continuous-wear transition. Whereas sliding velocity determines mainly the power of heating, the applied pressure σLoad determines both the total number of real contact spots as well as the fraction of these spots where local shear stress achieves the local value of the dry friction force Fdr. The local values of Fdr are different for different contact spots, yet their average value is proportional to σLoad. Such a complex and non-linear effect of the applied normal load on the heating of particular asperities and increasing their heights results in the non-linearity of the relationship V s l c r i t ( σ L o a d c r i t ).
For low σLoad, the contact spot percentage with respect to total number of asperities is considerably less than 50%. This fact offers great potential for redistribution of contact stresses and hence provides relatively high values of V s l c r i t . Increasing the σLoad results in corresponding increasing the contact spot number that limits the efficiency of stress redistribution caused by thermal expansion of the asperities. That is why V s l c r i t reduction rate is decreased as a function of σLoad.
At σLoad→40 MPa, there occurs some percolation transition when the contact spot percentage becomes equal to 50%. At larger σLoad, the major part of surface asperities are in contact with the opposite ones. Accordingly, this increases the percentage of highly loaded and frictionally heated spots. Therefore, high σLoad values may provide more uniform distribution of contact stresses and more homogeneous heating of the worn surfaces. Moreover, high contact pressures and corresponding high magnitudes of Fdr determine intensive heating of asperities. That is why the value of V s l c r i t is minimal and changes negligibly at high values of σLoad.
At σLoad ≈ 100 MPa, all asperities become contact spots. A slight additional increase in σLoad leads to local stresses in some fraction of the contact spots are always higher the material strength (the criterion of local fracture is satisfied), and the wear becomes continuous for all Vsl. The limiting value of applied normal stress σ L o a d max is 105–110 MPa for the considered PTE material. The parameter σ L o a d max has the meaning of the maximum applied normal stress to achieve wear-free regime of sliding friction.
Figure 19 is a wear map where different wear regimes may be distinguished. Experimental wear maps were also obtained on particular ceramic materials, as well as generalized dimensionless ones [59] when boundaries between mild and severe wear regimes were shown for several traditional PTE ceramics (including ZrO2) using a coordinate axis such as the mean Hertzian pressure and sliding velocity, and where a boundary curve looks analogous to that obtained in this work for the model PTE ceramics (Figure 19). A qualitative agreement was achieved between mean Hertzian pressure and σ L o a d c r i t for ZrO2 at the same Vsl.
Another example of wear maps reconstructed in terms of dimensionless parameters such as mechanical severity of contact and thermal severity of contact was reported [6,59]. These parameters allowed for the consideration of both material characteristics and loading parameters. The above-identified examples may testify on the applicability of the wear maps for different ceramics with indication to their insufficient versatility and potential using other dimensionless variables relating to mechanical and thermophysical characteristics like those obtained using the subsurface temperature gradient established under steady friction conditions [50].
Since the above-discussed PTE material has low thermal conductivity, it is interesting how intensive the worn surface heating under limiting loading conditions would be, at least as determined according to boundary curves in Figure 19. 
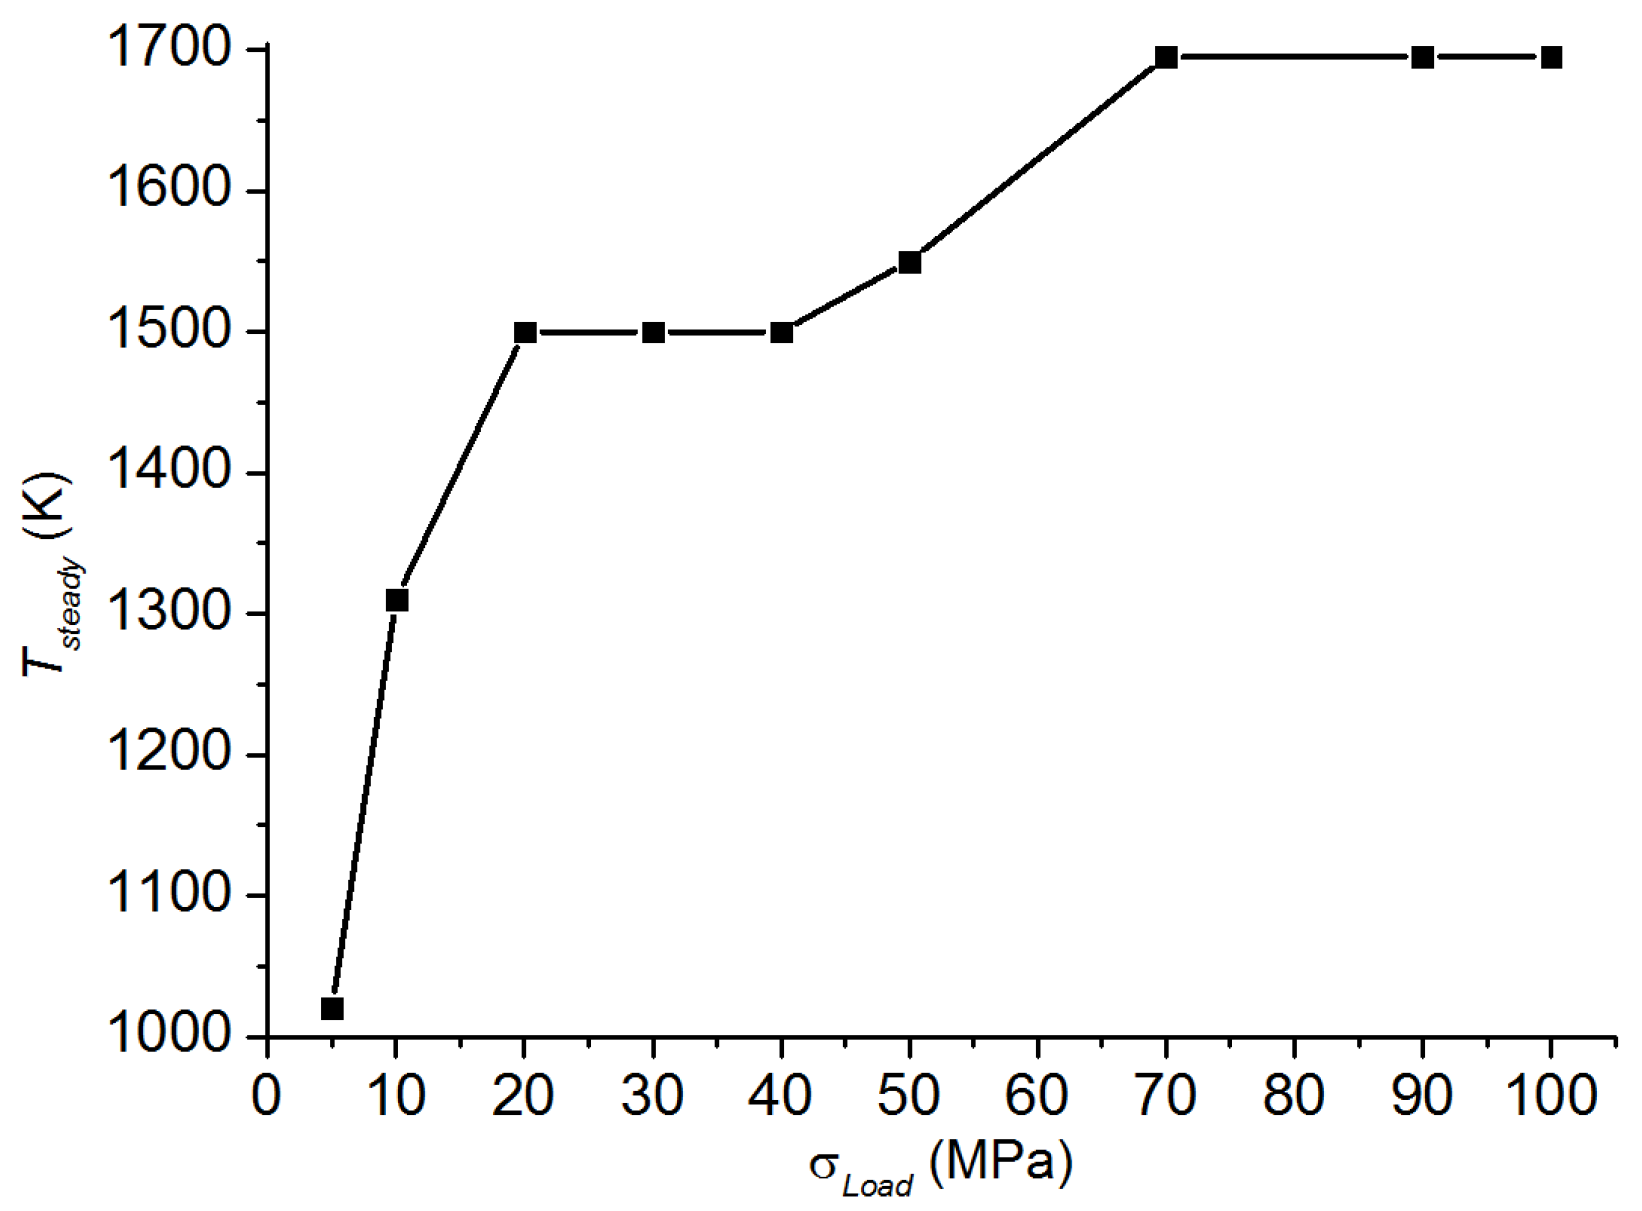
Figure 20 shows the steady averaged surface temperatures, Tsteady, for boundary points ( V s l c r i t , σ L o a d c r i t ) in Figure 19. Generally, it should be noted that Tsteady gradually increases with the applied pressure. This step-by-step growth is determined by changing the contacting conditions and by increasing the percentage of the contact spots. The existence of the first plateau at σLoad ≈ 20/40 MPa corresponds to a “percolation transition” of contact spot percentage Ncont over the 50% threshold (30–60% for the applied pressure interval). The second one at σLoad > 70 MPa appears when Ncont approaches to 100%. In this connection, it is important to note that temperature interval of stable functioning of ZrO2 is limited from above by 1400/1700 K. One can see in Figure 20 that steady worn surface temperatures for the boundary points ( V s l c r i t , σ L o a d c r i t ) do not exceed this limit so that this PTE material may be capable of demonstrating the wear-free sliding, as determined by the boundary in Figure 19.
The high-temperature region at the boundary line between two wear regimes begs a question about the effect of temperature-dependent material characteristics on both profile and position of this boundary in the parametric plane (σLoad, Vsl). Some considerations may be derived even now from analyzing the dimensionless wear map parameters.
Let us take in to account the mechanical parameter [50]: M = σ L o a d E / σ c o m p 2 . The wear-free regime occurs at M < M c r i t = σ L o a d c r i t E / σ c o m p 2 . The magnitude of Mcrit is independent of E and σcomp, yet it depends on the dimensionless thermophysical parameter. For a great number of ceramics, including ZrO2, the temperature rises to ~1000 K provides reduction in both Young’s modulus and strength [64,65,66,67]. By definition of Mcrit, drawing into the temperature dependence of mechanical characteristics results in reducing σ L o a d c r i t . Moreover, since different contact spots have different temperatures the reduction in σ L o a d c r i t should be accompanied by blurring the boundary line between the wear regimes. In addition, both Mcrit and σ L o a d c r i t depend on thermophysical characteristics of the material and, therefore, their temperature dependencies will influence σ L o a d c r i t . In this situation, temperature dependencies of heat capacity and heat conductivity of ZrO2 will grow and fall, respectively [68,69]. The CTE of ZrO2 is stable in the wide temperature range and because of these opposite temperature trends, their common influence on both Mcrit and σ L o a d c r i t will be negligible. Thus, the main factor will be temperature dependence of the ratio E / σ c o m p 2 .
Two regions may be delineated in the parametric plane (σLoad, Vsl), such as closed and open regions corresponding to wear-free and continuous wear, respectively. (Figure 19). Crossing the σLoad< σ L o a d max boundary means transitioning to the continuous low wear (mild) regime. Increasing the distance from this boundary results in accelerated (non-linear) increasing the wear rate up to achieving the catastrophic wear (Figure 2 and Figure 6). At the same time, crossing the boundary at σLoad = σ L o a d max results in a sharp increase of the wear rate and crossover from a wear-free to a catastrophic regime.
For comparison, Figure 19 identifies an analogous boundary for the NTE material under study. As noted above, thermal height reduction of asperities in heating may serve for inducing the wear-free regime with the sliding velocity. Therefore, the wear regime boundary for NTE materials is in the form of a vertical line in the parametrical plane (σLoad, Vsl). In fact, σ L o a d c r i t = c o n s t = σ L o a d max for the NTE ceramic materials.
Since the values of maximum critical pressure ( σ L o a d max ) are close for the considered PTE and NTE materials, it seems appropriate to compare the corresponding values of the above considered dimensionless mechanical parameter M c r i t [50]. For the model, NTE material with mechanical characteristics is close to those of scandium tungstate, i.e., Mcrit ≈ 5.5. The physical meaning of the limiting σLoad values ( σ L o a d max ) for both NTE and PTE materials is the same; it is relevant to estimate the limiting value of Mcrit for the PTE material used in this study: M c r i t = σ L o a d max E / σ c 2 ≈ 7.1. The specified values of the dimensionless mechanical parameter for PTE and NTE materials with comparable mechanical and thermophysical characteristics differ by less than 30%. Therefore, for a wide range of PTE and NTE ceramic materials, it may be assumed that Mcrit = 1/10.
Ceramics are pressure-sensitive materials whose shear strength depends on the local pressure and, therefore, may be characterized by a dimensionless parameter: b = σcomptens. It was in Section 2 that this parameter depends on the size of samples, i.e., that this ratio is reduced with scaling down the samples. The above-discussed results including those in Figure 19 have been obtained at b = 5, the value typical for the macroscopic samples. However, the surface asperities are the microscale objects and it becomes important analyzing the effect of the b-parameter magnitude on the wear regimes occurring on both PTE and NTE sliding pairs.
Figure 21 shows a wear map reconstructed for three b values with b = 1 being the lowest limiting one not achievable on the ceramic materials. The b = σcomptens parameter was varied by varying the material’s tensile strength while keeping its compressive strength constant. This approach allowed accounting for the fact that tensile strength is more sensitive to the internal defects compared to that of the compressive strength. In the case of PTE friction pair it can be observed that despite a five-fold differences in b, the wear-free/continuous wear region boundaries are close to each other as viewed in in the parametric ( V s l c r i t , σ L o a d c r i t ) plane. Significant differences are observed only at low contact pressures ( V s l c r i t at b = 1 is by a factor of 1.5–2 higher than that of at b = 5). At the higher pressures (σLoad > 30/40 MPa), all curves get closer and almost coincide with each other. Another feature is that σ L o a d max is reduced when the b-parameter increases at high applied pressures which is not the case with wear maps obtained at low pressures. This may be due to the enhancing effect of averaged contact spot stress on local fractures, i.e., increasing its contribution to the criterion of local fracture (A14) with b-parameter growth. An analogous trend is for NTE material, i.e., when σ L o a d max is reduced with the increase in b approximately by the same value as in the case of PTE material.
In summary, it can be concluded that the limiting (maximal) values of loading parameters σLoad and Vsl, at which the wear-free wear regime on PTE sliding pairs is still established, are determined mainly by the material’s compression strength (σcomp). The sensitivity of the material’s shear strength to the mean stress magnitude expressed in the form of b-parameter is of the first order of vanishing compared to that of σcomp, which controls the maximum of σLoad and where wear-free regime is feasible. The latter is true for both PTE and NTE materials.

4. Conclusions

The results of this numerical study allow us to stress that the key role of CTE is to expose loading condition intervals where ceramic materials can function without catastrophic wear. For material with positive CTE values, the maximal value of sliding velocity, which still provides the wear-free regime of friction, exponentially depends on the applied pressure. In addition, there is a maximum critical applied pressure whose overcoming leads to establishing the continuous wear regime even at low sliding speeds. Changing the CTE sign to negative leads to the qualitative transformation of the boundary between two wear regimes. There is no wear of NTE ceramics at every sliding velocity value, especially if the applied pressure does not exceed some critical value. The value of critical applied pressure for an NTE material is comparable with that of PTE ceramics, provided that the mechanical and thermophysical characteristics of these ceramics are close in their value.
It should be noted that the maximal sliding velocity corresponding to the wear-free regime on the PTE ceramic materials depends not only on the applied pressure but also on the surface temperature. The latter determines the particular values of the material’s mechanical characteristics because of their dependence on temperature and, more importantly, the stability of structures and phases. For the considered PTE material (ZrO2), all of the numerically derived values of maximal sliding velocity lie within the temperature range of structure stability, although at high applied pressures they approach its upper boundary.
Given that the NTE material (Sc2W3O12) is characterized by the temperature stability boundary close to that of ZrO2, the actual conditions for establishing the wear-free regime are determined not only by the critical applied pressure but also by the critical sliding velocity. The latter should be found from a condition that the steady worn surface temperature approaches the phase transformation temperature. The “phase stability-defined” dependence V s l c r i t Load) takes form the same as in the case of PTE material (Figure 19), although absolute values of V s l c r i t are by a factor of 1.5 lower because of lower heat conductivity and slow cooling.
The presented numerical results in combination with the results of earlier studies [6,50,59] indicate the feasibility of reconstructing wear maps for both PTE and NTE materials in terms of dimensionless mechanical and thermophysical characteristics. Analyzing these wear maps allow for the establishment of wear regime transitions and key parameters responsible for occurring wear regime transitions. Practical use of such maps should include analysis of possible temperature-induced structural and phase transformations, i.e., stability of the material under preset temperature and loading conditions.
NTE materials are used mainly as NTE components in the composite materials in combinations with the PTE ones. The wear reduction effect of negative CTE makes the NTE materials extremely attractive for applications in both low- and heavy-loaded tribological devices—e.g., as components of composite friction (brake) materials with PTE and NTE components. Study of the behavior of such composites during friction requires using full thermomechanical numerical models of surface layers that consider the features of heterogeneous stress, strain distributions, and interface stresses. Further efforts will be focused on studying wear behavior of such composites. Nevertheless, the asperity-based model can be used, albeit with some caution, to estimate the mild wear regime conditions in composites with nanosized PTE and NTE components (provided that the surface roughness significantly exceeds the characteristic particle sizes). The effective properties of the composite should be used in this case.
Another important problem in tribological applications of the NTE materials and NTE/PTE composites is their low heat conductivity while efficient heat removal in highly loaded pairs is necessary for their structural stability. Looking for effective solutions to this problem will be another task of our future investigations.

Author Contributions

Conceptualization, E.V.S., A.I.D. and S.Y.T.; software, E.V.S. and A.S.G.; simulation, E.V.S. and A.S.G.; investigation, E.V.S., A.I.D. and S.Y.T.; data curation, E.V.S.; writing—original draft preparation, E.V.S., A.I.D. and S.Y.T.; writing—review and editing, E.V.S., A.I.D. and A.S.G.; visualization, E.V.S. and A.I.D.; supervision, E.V.S. and A.I.D.; project administration, E.V.S. and A.I.D.; funding acquisition, E.V.S. and A.I.D. All authors have read and agreed to the published version of the manuscript.

Funding

The work was performed according to the Government research assignment for ISPMS SB RAS, projects FWRW-2021-0002 and FWRW-2021-0006.

Data Availability Statement

The authors declare that all data and methods used in the research are presented in sufficient detail in this paper so that other researchers can replicate the work including all raw data.

Conflicts of Interest

The authors declare no conflict of interest.

Appendix A

Mechanical interaction of the surfaces is the sum of contact interactions of opposite asperities (Figure 1). The total force of interaction is calculated as follows:
F t o t a l = F τ n x + F N n y = n x i = 1 m F τ i + n y i = 1 m F N i .
Here, the subscript “N” and “τ” denote normal and tangential interaction, respectively. I is the number of asperity, m is the number of surface asperities (m is the same for both surfaces), F N i and F τ i are absolute values of the forces of normal and tangential interaction of i-th asperity of the lower body with i-th asperity of the upper body, and n x and n y are unit vectors along X-axis and Y-axis, respectively.
The material of the interacting bodies is assumed to be brittle, which is true with the majority of low porosity and pre-free ceramics, and is modeled as a linearly elastic one. The adhesion between the surfaces is assumed negligible and is not taken into account. Surface asperity dimensions are assumed to be much smaller than the height of the body. That is why the interaction force ratio of opposite asperities are based on classic analytical expression, which establish a relationship between a force homogeneously acting on a circle area of the free surface of an elastic half space and deflection at the central point of this circle area.
In the absence of adhesion—i.e., the normal interaction of asperities—is described with only their reaction to compression loading. Assuming that asperities are small enough, the asperity resistance to compression from the opposite one is determined from a classical linear relationship between the normal compression force (F) homogeneously acting on a circle area S of the free surface of an elastic plane’s half space and normal displacement (ΔH) at the central point of this circle [70,71]:
F = p 0 S = π R E 2 1 ν 2 Δ H ,
where p0 is a homogeneously distributed pressure, R is the radius of a circle area, and E and ν are the Young’s modulus and the Poisson’s ratio of the material of a half space, respectively. This expression can be formally rewritten in a simpler form similar to resistance force of a linearly elastic spring to compression:
F = K Δ H ,
where K = π R E / 2 1 ν 2 is the stiffness of a virtual (effective) spring.
Normal contacting between two opposite asperities is described as the asperity resistance to uniaxial compression from the force exerted by the opposite asperity. According to Newton’s third law, the normal force for i-th pair of opposite asperities may be put as follows:
F N i = K N b , i Δ H b , i = K N u , i Δ H u , i Δ H i = Δ H b , i + Δ H u , i .
Here, the superscripts “b” and “u” denote contacting asperities belonging to the bottom and the upper surfaces, respectively. Δ H b , i and Δ H u , i are normal displacements (indentations). K N b , i and K N u , i are stiffness values for the bottom and the upper bodies. Δ H i is the total value of indentation. Another interpretation of Δ H i is the overlap of two asperities if considering them (and the half-spaces) as rigid bodies. Using this interpretation, the Δ H i magnitude can be calculated at each moment of time (Figure 1): Δ H i = Y b , i Y u , i , where Y b , i and Y u , i are positions of the tops of i-th opposite asperities along the Y-axis. Asperities do not interact ( F N i = F τ i = 0 ) unless they are overlapped ( Δ H i 0 ).
The known value of the total overlap of opposite asperities Δ H i is used in (A4) for calculating the current values of both Δ H b , i and Δ H u , i , as well as the interaction force:
F N i = K N b , i K N u , i K N b , i + K N u , i Δ H i .
The values of asperity normal stiffness are defined similar to (A2), as well as (A3) with consideration of the conditions as follows. Firstly, each of the asperities is characterized by its own value of the effective contact area. Secondly, the geometry of this contact area is not specified. Therefore, both K N b , i and K N u , i are computed in accordance with the following equations:
K N b , i = π S 0 i E b 2 1 ν b 2 ,   K N u , i = π S 0 i E u 2 1 ν u 2 ,
where E b u and ν b u are the Young’s modulus and Poisson’s ratio of the material of bottom or upper body, respectively, and S 0 i is the minimum from S 0 b , i and S 0 u , i (the effective contact areas of the opposite asperities).
Tangential interaction of the contacting asperities is modeled by two components according to equation as follows:
F τ i = F s h i + F b e n d i .
The first tangential force component F s h i is considered as approximation of shear resistance between two half-infinite bodies contacting with dry friction by some area S 0 i on their plane surfaces [71,72]. The equations to calculate F s h i are analogous to Equation (A4). They are formulated in hypoelastic (incremental) form:
Δ F s h i = K τ b , i Δ l b , i = K τ u , i Δ l u , i V s l Δ t = Δ l b , i + Δ l u , i ,
where K τ b , i = 0.5 π S 0 i G b and K τ u , i = 0.5 π S 0 i G u are the tangential stiffnesses of the bottom and the top asperities, respectively. G b u = E b u / 2 1 + ν b u is the shear modulus of the material of the bottom or top body. Vsl is the relative tangential velocity of contacting surfaces (sliding velocity). Δt is the time increment (time step of the numerical scheme). Δ l b , i and Δ l u , i are the contributions of asperities into the total tangential displacement increment VslΔt.
Similar to normal interaction, the known value of the total tangential displacement increment VslΔt is used in (A8) for calculating the current values of both Δ l b , i and Δ l u , i , as well as an increment of the shear resistance force:
Δ F s h i = K τ b , i K τ u , i K τ b , i + K τ u , i V s l Δ t .
The current value of F s h i is limited above by the current local value of the dry friction force. If F s h i > F d r i = μ F N i (μ is the local dry friction coefficient), then set F s h i = F d r i .
The second tangential force component F b e n d i serves for effective taking into account interaction between lateral surfaces of the overlapped parts of opposite asperities in a layer of thickness Δ H i during sliding. This type of interaction is a complex one since it combines localized shear of the overlapped asperity parts, as well as their bending and indentation into the bodies during relative sliding of asperities. Such a complex interaction is effectively described using the following equations expressed in hypoelastic (incremental) form:
Δ F b e n d i = K τ b , i K τ u , i K τ b , i + K τ u , i Δ H i V s l Δ t Δ x .
The combination Δ H i V s l Δ t / Δ x in (A10) effectively describes an increase in the asperity volume involved into localized deformation with the relative sliding of the opposite asperities. By analogy with shear resistance force, the value of F b e n d i is bounded above: F b e n d i K τ b , i K τ u , i K τ b , i + K τ u , i Δ H i .
It is well-known that dry friction work dissipates mainly into heat so that the local heat release power on the contact spot formed by opposite i-th asperities can be obtained from equation:
q i = F d r i V s l , i f F s h i = F d r i 0 , i f F s h i < F d r i .
Redistribution of the heat fluxes between two contacting bodies is modeled by numerical solving classical 2D heat conductance equation:
T t = a 2 T x 2 + 2 T y 2 + Q x , y , t ,
where a = k / c ρ is the thermal diffusivity, c is the heat capacity, k is the heat conductivity, ρ is the material’s density, and Q is the local heat source. This equation is solved for each body using the finite difference method on a square 2D grid with the grid size numerically equal to the asperity period Δx. Boundary conditions are as follows: a heat flux (Neumann) condition k T y = 0.5 q Δ x 2 is applied to the contact surface while Dirichlet condition (constant temperature T = T0) is applied to the external surfaces of both bodies. The time integration step Δt was by a factor of 1000 less than the critical one determined from the Courant’s condition.
A change in temperature entails a change in the linear dimensions of the surface layers, including a change in the level (and topography) of the surface. Since internal layers of the material are under mechanically constrained condition, it was assumed that the local change in the surface level (the position of the top of asperity along the Y-axis) is determined mainly by the temperature change in the linear size of the first (surface) cell:
Y T i = Y T 0 i + α T i T 0 i Δ x ,
where T i and T 0 i are the current and initial values of the temperature of the i-th asperity, Y T i and Y T 0 i are the current position of asperity top along the Y-axis (at temperature T i ) and position of this asperity in a cooled state (at temperature T 0 i ), α is the thermal expansion coefficient (TEC). Δ Y t h e r m i = Y T i Y T 0 i is the thermally induced asperity height change. The effect of temperature on the effective contact area S was not considered ( S i = S 0 i ).
If the stresses in the contact spot reach a critical value, then asperity experiences fracture. The asperity fracture by the shear mechanism is considered because stressed asperities are under the “compression + shear” loading condition. Ceramic materials are characterized by a strong dependence of the shear strength on the magnitude of the applied pressure. Therefore, the two-parameter Drucker–Prager criterion was used as a criterion for local failure [57,58]:
σ D P = 1.5 b 1 σ m e a n + 0.5 b + 1 σ e q ,
where b = σ c o m p / σ t e n s , σcomp, and σtens are the asperity material uniaxial compressive and tensile strengths, respectively. σmean and σeq are mean stress and equivalent stress. Assuming the simplified description of the stress state of asperity (uniaxial compression plus tangential interaction of shear type), formulation of σmean and σeq is reduced to the following form: σ m e a n = σ N / 3 and σ e q = 1 2 2 σ N 2 + 6 σ τ 2 , where σ N = F N / S 0 , and σ τ = F τ / S 0 . Note that the Drucker–Prager criterion is extensively used to determine the limiting state of brittle and quasi-brittle materials (in particular, ceramics).
The asperity fracture condition is determined by the following inequality:
σ D P σ c o m p ,
The criterion (A14) and condition (A15) are calculated for each asperity being in contact with opposite asperity (σN > 0) because the mechanical characteristics (σcomp and σtens) of the opposite asperities may generally differ. The values of σmean and σeq are the same for both asperities in the contact.
Fracture of asperity means that some material fragment (wear debris) is separated from the asperity. This leads to decreasing the position of the top of asperity along the Y-axis (wear of asperity) by some value Δ Y w i . The corresponding value of wear volume can be evaluated as Δ W i = Δ Y w i S 0 i . It is assumed that the effective asperity contact area ( S 0 b , i for the i-th asperity of the lower body or S 0 u , i for the i-th asperity of the upper body) changes in wear. Since it is hardly possible to predict the asperity contact area change, the new value of asperity contact area was set randomly within the range limited by minimal ( S 0 min ) and maximal ( S 0 max ) values after each act of wear.
The value of Δ Y w i , which determines the elementary volume of wear, generally depends on many factors and can vary over a wide range. It is known from the results of numerous experimental and theoretical studies that the wear of a single asperity can occur through various mechanisms [36,38,41,42,73], as determined by the ductility/brittleness ratio, the magnitude of the applied normal stress, the degree of lateral overlap of asperities, the features of the geometry of asperities, etc.
Since the asperities are considered in a simplified manner (without taking into account the features of their individual geometry), it is assumed that if condition (A15) is met for some asperity, the broken (separated) part of this asperity has height Δ H b , i (for the asperity of the lower body) or Δ H u , i (for the asperity of the upper body). In other words, the asperity wear is localized in the asperity pair overlap ( Δ H i ), and the height of wear debris Δ Y w i is equal to the contribution of this asperity to Δ H i . Note that in the case of simultaneous fulfillment of conditions (A15) for both contacting asperities, the Y-coordinates of both tops change by Δ H b , i and Δ H u , i , respectively.

References

  1. Zhai, W.; Bai, L.; Zhou, R.; Fan, X.; Kang, G.; Liu, Y.; Zhou, K. Recent Progress on Wear-Resistant Materials: Designs, Properties, and Applications. Adv. Sci. 2021, 8, e2003739. [Google Scholar] [CrossRef] [PubMed]
  2. Fahrenholtz, W.G.; Hilmas, G.E. Ultra-high temperature ceramics: Materials for extreme environments. Scr. Mater. 2017, 129, 94–99. [Google Scholar] [CrossRef]
  3. Grigoriev, O.N.; Mazur, P.V.; Neshpor, I.P.; Mosina, T.V.; Bega, M.D.; Varchenko, V.T.; Vedel, D.V.; Konoval, V.P.; Dukhota, A.I.; Kharchenko, V.V.; et al. Wear-Resistant TiCN-Based Ceramic Materials for High-Load Friction Units. Sov. Powder Met. Met. Ceram. 2021, 59, 528–536. [Google Scholar] [CrossRef]
  4. Chen, M.; Kato, K.; Adachi, K. Friction and wear of self-mated SiC and Si3N4 sliding in water. Wear 2001, 250, 246–255. [Google Scholar] [CrossRef]
  5. Andersson, P.; Blomberg, A. Alumina in unlubricated sliding point, line and plane contacts. Wear 1993, 170, 191–198. [Google Scholar] [CrossRef]
  6. Metselaar, H.; Kerkwijk, B.; Mulder, E.; Verweij, H.; Schipper, D. Wear of ceramics due to thermal stress: A thermal severity parameter. Wear 2002, 249, 962–970. [Google Scholar] [CrossRef]
  7. Hokkirigawa, K.; Kato, K. An experimental and theoretical investigation of ploughing, cutting and wedge formation during abrasive wear. Tribol. Int. 1988, 21, 51–57. [Google Scholar] [CrossRef]
  8. Mahato, A.; Guo, Y.; Sundaram, N.K.; Chandrasekar, S. Surface folding in metals: A mechanism for delamination wear in sliding. Proc. R. Soc. A Math. Phys. Eng. Sci. 2014, 470, 20140297. [Google Scholar] [CrossRef]
  9. Greenwood, J.A. Metal Transfer and Wear. Front. Mech. Eng. 2020, 6, 62. [Google Scholar] [CrossRef]
  10. Shilko, E.V.; Grigoriev, A.S.; Smolin, A.Y. A discrete element formalism for modelling wear particle formation in contact between sliding metals. Facta Univ. Ser. Mech. Eng. 2021, 19, 7–22. [Google Scholar] [CrossRef]
  11. Kalin, M.; Vižintin, J. High temperature phase transformations under fretting conditions. Wear 2001, 249, 172–181. [Google Scholar] [CrossRef]
  12. Smith, E.H.; Arnell, R.D. A New Approach to the Calculation of Flash Temperatures in Dry, Sliding Contacts. Tribol. Lett. 2013, 52, 407–414. [Google Scholar] [CrossRef]
  13. Umar, M.; Mufti, R.A.; Khurram, M. Effect of flash temperature on engine valve train friction. Tribol. Int. 2018, 118, 170–179. [Google Scholar] [CrossRef]
  14. Aborkin, A.; Elkin, A.; Reshetniak, V.; Ob’edkov, A.; Sytschev, A.; Leontiev, V.; Titov, D.; Alymov, M. Thermal expansion of aluminum matrix composites reinforced by carbon nanotubes with in-situ and ex-situ designed interfaces ceramics layers. J. Alloys Compd. 2021, 872, 159593. [Google Scholar] [CrossRef]
  15. Parsons, E.M. Lightweight cellular metal composites with zero and tunable thermal expansion enabled by ultrasonic additive manufacturing: Modeling, manufacturing, and testing. Compos. Struct. 2019, 223, 110656. [Google Scholar] [CrossRef]
  16. Grima-Cornish, J.N.; Attard, D.; Evans, K.E.; Grima, J.N. Auxetic-Inspired Honeycomb Macrostructures with Anomalous Tailormade Thermal Expansion Properties Including “Negative” Heat-Shrinking Characteristics. Front. Mater. 2021, 8, 769879. [Google Scholar] [CrossRef]
  17. Zhang, K.; Wang, K.; Chen, J.; Wei, K.; Liang, B.; He, R. Design and additive manufacturing of 3D-architected ceramic metamaterials with programmable thermal expansion. Addit. Manuf. 2021, 47, 102338. [Google Scholar] [CrossRef]
  18. Wu, L.; Li, B.; Zhou, J. Isotropic Negative Thermal Expansion Metamaterials. ACS Appl. Mater. Interfaces 2016, 8, 17721–17727. [Google Scholar] [CrossRef]
  19. Miller, W.; Smith, C.; Dooling, P.; Burgess, A.; Evans, K. Reduced thermal stress in composites via negative thermal expansion particulate fillers. Compos. Sci. Technol. 2010, 70, 318–327. [Google Scholar] [CrossRef]
  20. Takenaka, K. Progress of Research in Negative Thermal Expansion Materials: Paradigm Shift in the Control of Thermal Expansion. Front. Chem. 2018, 6, 267. [Google Scholar] [CrossRef]
  21. Evans, J.S.O. Negative thermal expansion materials. J. Chem. Soc. Dalton Trans. 1999, 19, 3317–3326. [Google Scholar] [CrossRef]
  22. Lind, C. Two Decades of Negative Thermal Expansion Research: Where Do We Stand? Materials 2012, 5, 1125–1154. [Google Scholar] [CrossRef] [PubMed]
  23. Chumaevskii, A.; Zykova, A.; Sudarikov, A.; Knyazhev, E.; Savchenko, N.; Gubanov, A.; Moskvichev, E.; Gurianov, D.; Nikolaeva, A.; Vorontsov, A.; et al. In-Situ Al-Mg Alloy Base Composite Reinforced by Oxides and Intermetallic Compounds Resulted from Decomposition of ZrW2O8 during Multipass Friction Stir Processing. Materials 2023, 16, 817. [Google Scholar] [CrossRef] [PubMed]
  24. Kanamori, K.; Kineri, T.; Fukuda, R.; Kawano, T.; Nishio, K. Low-temperature sintering of ZrW2O8–SiO2 by spark plasma sintering. J. Mater. Sci. 2009, 44, 855–860. [Google Scholar] [CrossRef]
  25. Yang, C.; Li, J.; Wang, X.; Yang, D.; Shi, H.; Meng, S.; Du, S. ZrW2O8/ZrO2 Composites with Low/Near-Zero Coefficients of Thermal Expansion Fabricated at Ultralow Temperature: An Integration of Hydrothermal Assembly and a Cold Sintering Process. ACS Appl. Mater. Interfaces 2021, 13, 39738–39747. [Google Scholar] [CrossRef] [PubMed]
  26. Mary, T.A.; Evans, J.S.O.; Vogt, T.; Sleight, A.W. Negative thermal expansion from 0.3 to 1050 Kelvin in ZrW2O8. Science 1996, 272, 90–92. [Google Scholar] [CrossRef]
  27. Radu, I.; Li, D. Effects of ZrW2O8 and tungsten additions on the temperature range in which a pseudoelastic TiNi alloy retains its maximum wear resistance. Wear 2007, 263, 858–865. [Google Scholar] [CrossRef]
  28. Shadrin, V.S.; Kulkov, S.N. Influence of Sintering Time on the Structure Formation of Al-ZrW2O8 Pseudo Alloys. IOP Conf. Ser. Mater. Sci. Eng. 2017, 175, 012055. [Google Scholar] [CrossRef]
  29. Dedova, E.S.; Shadrin, V.S.; Petrushina, M.Y.; Kulkov, S.N. The Study on Thermal Expansion of Ceramic Composites with Addition of ZrW2O8. IOP Conf. Ser. Mater. Sci. Eng. 2016, 116, 012030. [Google Scholar] [CrossRef]
  30. Liang, E.; Sun, Q.; Yuan, H.; Wang, J.; Zeng, G.; Gao, Q. Negative thermal expansion: Mechanisms and materials. Front. Phys. 2021, 16, 53302. [Google Scholar] [CrossRef]
  31. Liu, H.; Yang, L.; Zhang, Z.; Pan, K.; Zhang, F.; Cheng, H.; Zeng, X.; Chen, X. Preparation and optical, nanomechanical, negative thermal expansion properties of Sc2W3O12 thin film grown by pulsed laser deposition. Ceram. Int. 2016, 42, 8809–8814. [Google Scholar] [CrossRef]
  32. Li, Q.; Pohrt, R.; Lyashenko, I.A.; Popov, V.L. Boundary element method for nonadhesive and adhesive contacts of a coated elastic half-space. Proc. Inst. Mech. Eng. Part J J. Eng. Tribol. 2020, 234, 73–83. [Google Scholar] [CrossRef]
  33. Li, Q.; Popov, V.L. Boundary element method for normal non-adhesive and adhesive contacts of power-law graded elastic materials. Comput. Mech. 2018, 61, 319–329. [Google Scholar] [CrossRef]
  34. Woldman, M.; Van Der Heide, E.; Tinga, T.; Masen, M.A. A Finite Element Approach to Modeling Abrasive Wear Modes. Tribol. Trans. 2017, 60, 711–718. [Google Scholar] [CrossRef]
  35. Bochkareva, S.A.; Panin, S.V.; Lyukshin, B.A.; Lyukshin, P.A.; Grishaeva, N.Y.; Matolygina, N.Y.; Aleksenko, V.O. Simulation of frictional wear with account of temperature for polymer composites. Phys. Mesomech. 2020, 23, 147–159. [Google Scholar] [CrossRef]
  36. Aghababaei, R.; Warner, D.H.; Molinari, J.-F. Critical length scale controls adhesive wear mechanisms. Nat. Commun. 2017, 7, 11816. [Google Scholar] [CrossRef]
  37. Molinari, J.-F.; Aghababaei, R.; Brink, T.; Frérot, L.; Milanese, E. Adhesive wear mechanisms uncovered by atomistic simulations. Friction 2018, 6, 245–259. [Google Scholar] [CrossRef]
  38. von Lautz, J.; Pastewka, L.; Gumbsch, P.; Moseler, M. Molecular Dynamic Simulation of Collision-Induced Third-Body Formation in Hydrogen-Free Diamond-Like Carbon Asperities. Tribol. Lett. 2016, 63, 26. [Google Scholar] [CrossRef]
  39. Vargonen, M.; Yang, Y.; Huang, L.; Shi, Y. Molecular simulation of tip wear in a single asperity sliding contact. Wear 2013, 307, 150–154. [Google Scholar] [CrossRef]
  40. Dmitriev, A.I.; Nikonov, A.Y.; Österle, W.; Jim, B.C. Verification of Rabinowicz’ Criterion by Direct Molecular Dynamics Modeling. Facta Univ. Ser. Mech. Eng. 2019, 17, 207–215. [Google Scholar] [CrossRef]
  41. Zhang, Z.; Pan, S.; Yin, N.; Shen, B.; Song, J. Multiscale analysis of friction behavior at fretting interfaces. Friction 2021, 9, 119–131. [Google Scholar] [CrossRef]
  42. Hu, J.; Song, H.; Sandfeld, S.; Liu, X.; Wei, Y. Multiscale study of the dynamic friction coefficient due to asperity plowing. Friction 2021, 9, 822–839. [Google Scholar] [CrossRef]
  43. de Rooij, M.; van der Linde, G.; Schipper, D. Modelling material transfer on a single asperity scale. Wear 2013, 307, 198–208. [Google Scholar] [CrossRef]
  44. Mishra, T.; de Rooij, M.; Shisode, M.; Hazrati, J.; Schipper, D.J. A material point method based ploughing model to study the effect of asperity geometry on the ploughing behaviour of an elliptical asperity. Tribol. Int. 2020, 142, 106017. [Google Scholar] [CrossRef]
  45. Mamalis, A.G.; Vortselas, A.K.; Panagopoulos, C.N. Analytical and Numerical Wear Modeling of Metallic Interfaces: A Statistical Asperity Approach. Tribol. Trans. 2013, 56, 121–129. [Google Scholar] [CrossRef]
  46. Smolin, A.Y.; Filippov, A.V.; Shilko, E.V. Friction behavior of aluminum bronze reinforced by boron carbide particles. Facta Univ. Ser. Mech. Eng. 2021, 19, 51–65. [Google Scholar] [CrossRef]
  47. Dimaki, A.V.; Shilko, E.V.; Dudkin, I.V.; Psakhie, S.G.; Popov, V.L. Role of Adhesion Stress in Controlling Transition between Plastic, Grinding and Breakaway Regimes of Adhesive Wear. Sci. Rep. 2020, 10, 1585. [Google Scholar] [CrossRef]
  48. Müser, M.H.; Dapp, W.B.; Bugnicourt, R.; Sainsot, P.; Lesaffre, N.; Lubrecht, T.A.; Persson, B.N.J.; Harris, K.; Bennett, A.; Schulze, K.; et al. Meeting the Contact-Mechanics Challenge. Tribol. Lett. 2017, 65, 118. [Google Scholar] [CrossRef]
  49. Campañá, C.; Müser, M.H.; Robbins, M.O. Elastic contact between self-affine surfaces: Comparison of numerical stress and contact correlation functions with analytic predictions. J. Phys. Condens. Matter 2008, 20, 354013. [Google Scholar] [CrossRef]
  50. Grigoriev, A.S.; Shilko, E.V.; Dmitriev, A.I.; Tarasov, S.Y. Suppression of wear in dry sliding friction induced by negative thermal expansion. Phys. Rev. E 2020, 102, 042801. [Google Scholar] [CrossRef]
  51. Popov, P.A.; Skrobov, S.A.; Zharikov, E.V.; Lis, D.A.; Subbotin, K.A.; Ivleva, L.I.; Shlegel’, V.N.; Kosmyna, M.B.; Shekhovtsov, A.N. Investigation of the Thermal Conductivity of Tungstate Crystals. Crystallogr. Rep. 2018, 63, 111–116. [Google Scholar] [CrossRef]
  52. Liu, Q.; Fan, C.; Wu, G.; Zhao, Y.; Sun, X.; Cheng, X.; Shen, J.; Hu, Y. In-situ synthesis of Sc2W3O12/YSZ ceramic composites with controllable thermal expansion. Ceram. Int. 2015, 41, 8267–8271. [Google Scholar] [CrossRef]
  53. Ushakov, S.V.; Navrotsky, A.; Weber, R.J.K.; Neuefeind, J.C. Structure and Thermal Expansion of YSZ and La2Zr2O7 Above 1500 °C from Neutron Diffraction on Levitated Samples. J. Am. Ceram. Soc. 2015, 98, 3381–3388. [Google Scholar] [CrossRef]
  54. Evans, J.; Mary, T.; Sleight, A. Negative Thermal Expansion in Sc2(WO4)3. J. Solid State Chem. 1998, 137, 148–160. [Google Scholar] [CrossRef]
  55. Yamamura, Y.; Ikeuchi, S.; Saito, K. Characteristic Phonon Spectrum of Negative Thermal Expansion Materials with Framework Structure through Calorimetric Study of Sc2M3O12 (M = W and Mo). Chem. Mater. 2009, 21, 3008–3016. [Google Scholar] [CrossRef]
  56. Bernstein, J.L. The unit cell and space group of gadolinium molybdate and of scandium tungstate. Z. Für Krist. Cryst. Mater. 1965, 122, 315–316. [Google Scholar] [CrossRef]
  57. Drucker, D.C.; Prager, W. Soil mechanics and plastic analysis or limit design. Q. Appl. Math. 1952, 10, 157–165. [Google Scholar] [CrossRef]
  58. Öztekin, E.; Pul, S.; Hüsem, M. Experimental determination of Drucker-Prager yield criterion parameters for normal and high strength concretes under triaxial compression. Constr. Build. Mater. 2016, 112, 725–732. [Google Scholar] [CrossRef]
  59. Kato, K.; Adachi, K. Wear of advanced ceramics. Wear 2002, 253, 1097–1104. [Google Scholar] [CrossRef]
  60. Gahr, K.-H.Z.; Schneider, J. Surface modification of ceramics for improved tribological properties. Ceram. Int. 2000, 26, 363–370. [Google Scholar] [CrossRef]
  61. Blomberg, A.; Olsson, M.; Hogmark, S. Wear mechanisms and tribo mapping of Al2O3 and SiC in dry sliding. Wear 1994, 171, 77–89. [Google Scholar] [CrossRef]
  62. Chaiwan, S.; Hoffman, M.; Munroe, P.; Stiefel, U. Investigation of sub-surface damage during sliding wear of alumina using focused ion-beam milling. Wear 2002, 252, 531–539. [Google Scholar] [CrossRef]
  63. Savchenko, N.L.; Filippov, A.V.; Tarasov, S.Y.; Dmitriev, A.I.; Shilko, E.V.; Grigoriev, A.S. Acoustic emission characterization of sliding wear under condition of direct and inverse transformations in low-temperature degradation aged Y-TZP and Y-TZP-Al2O3. Friction 2018, 6, 323–340. [Google Scholar] [CrossRef]
  64. Gregorová, E.; Nečina, V.; Hříbalová, S.; Pabst, W. Temperature dependence of Young’s modulus and damping of partially sintered and dense zirconia ceramics. J. Eur. Ceram. Soc. 2020, 40, 2063–2071. [Google Scholar] [CrossRef]
  65. Ingel, R.P.; Lewis, D.; Bender, B.A.; Rice, R.W. Temperature Dependence of Strength and Fracture Toughness of ZrO2 Single Crystals. J. Am. Ceram. Soc. 1982, 65, c150–c152. [Google Scholar] [CrossRef]
  66. Tsukuma, K.; Ueda, K.; Shiomi, M.; Tsukidate, T. Engineering ceramics [II] Y-PSZ/Al2O3 (composites between yttria partially stabilized zirconia and alumina)–Mechanical property. Sci. Rep. Toyo Soda 1985, 29, 115–120. [Google Scholar]
  67. Li, D.; Li, W.; Wang, R.; Kou, H. High-temperature strength of zirconia and its sensitivity to surface defects. Mater. Res. Express 2019, 6, 075511. [Google Scholar] [CrossRef]
  68. Degueldre, C.; Tissot, P.; Lartigue, H.; Pouchon, M. Specific heat capacity and Debye temperature of zirconia and its solid solution. Thermochim. Acta 2003, 403, 267–273. [Google Scholar] [CrossRef]
  69. Limarga, A.M.; Clarke, D.R. The grain size and temperature dependence of the thermal conductivity of polycrystalline, tetragonal yttria-stabilized zirconia. Appl. Phys. Lett. 2011, 98, 211906. [Google Scholar] [CrossRef]
  70. Landau, L.D.; Lifschitz, E.M. Theory of Elasticity, 3rd ed.; Course of Theoretical Physics; Butterworth-Heinemann: Oxford, UK, 1999; Volume 7. [Google Scholar]
  71. Popov, V.L. Contact Mechanics and Friction. Physical Principles and Applications; Springer: Berlin/Heidelberg, Germany, 2010. [Google Scholar]
  72. Johnson, K.L. Contact Mechanics; Cambridge University Press: Cambridge, UK, 2003. [Google Scholar]
  73. Dmitriev, A.I.; Voll, L.B.; Popov, V.L. The final NO-WEAR state due to dual-mode fretting: Numerical prediction and experimental validation. Wear 2020, 458–459, 203402. [Google Scholar] [CrossRef]
Figure 1. Outline of the model setup with enlarged view of a single asperity contact inside the red rectangle.
Lubricants 11 00414 g001
Figure 2. Changes in the asperity height level (lower body) during sliding at different values of contact pressure applied to the PTE body σLoad (Vsl = 0.5 m/s, b = 5). (b)—enlarged fragment of (a), marked by A.
Lubricants 11 00414 g002
Figure 3. Roughness Ra vs. time dependencies for different contact pressure levels applied to the PTE lower body at σLoad (Vsl = 0.5 m/s, b = 5). (b)—enlarged fragment of (a), marked by A.
Lubricants 11 00414 g003
Figure 4. The surface roughness profiles (a,b) and local contact stress distributions (c,d) in sliding on PTE material at different nominal contact pressure σLoad (Vsl = 0.5 m/s, b = 5). p = 10 MPa for (a,c) and p = 50 MPa for (b,d). The Y-coordinates of asperity vertices are shown in (a,b).
Lubricants 11 00414 g004
Figure 5. Mean value of local contact pressure Pmean (a) and percentage of the contacting asperities (b) in sliding on PTE material at different applied pressures σLoad (Vsl = 0.5 m/s, b = 5).
Lubricants 11 00414 g005
Figure 6. Changes in the asperity height level (lower body) during sliding at different values of sliding velocity VslLoad = 10 MPa, b = 5) on PTE materials. (b)—enlarged fragment of (a), marked by A.
Lubricants 11 00414 g006
Figure 7. Surface roughness Ra vs. time dependencies for different values of sliding velocity VslLoad = 10 MPa, b = 5) on PTE materials. (b)—enlarged fragment of (a), marked by A.
Lubricants 11 00414 g007
Figure 8. Evolution of mean value of local contact pressure Pmean (a) and percentage of contacting asperities (b) in sliding at different sliding velocities VslLoad = 10 MPa, b = 5) on PTE materials.
Lubricants 11 00414 g008
Figure 9. Contact surface roughness profiles (a) and local contact pressure distributions (b) in sliding on PTE material at Vsl = 2.0 m/s (σLoad = 10 MPa, b = 5). Y-coordinates of the asperity vertices are shown in (a).
Lubricants 11 00414 g009
Figure 10. COF vs. sliding time dependencies for different contact pressure values σLoad (Vsl = 0.5 m/s, b = 5). Model PTE material. Hereinafter, each COF point is an average value of the time interval 5 ms.
Lubricants 11 00414 g010
Figure 11. COF vs. sliding time dependencies for different sliding velocity values VslLoad = 10 MPa, b = 5) on the PTE material: (a) wear-free friction; (b) continuous wear.
Lubricants 11 00414 g011
Figure 12. Contact surface level vs. time dependencies obtained on the lower NTE body at different contact pressure values σLoad (Vsl = 1.0 m/s, b = 5). (b)—enlarged fragment of (a), marked by A.
Lubricants 11 00414 g012
Figure 13. Evolution of the worn surface roughness Ra on the lower NTE body at diferent contact pressure values σLoad (Vsl = 1.0 m/s, b = 5). (b)—enlarged fragment of (a), marked by A.
Lubricants 11 00414 g013
Figure 14. Mean value of local contact pressure Pmean (a) and percentage of contacting asperities (b) in sliding on the NTE material at different contact pressure applied σLoad (Vsl = 1.0 m/s, b = 5).
Lubricants 11 00414 g014
Figure 15. NTE material surface profiles (a,b) and local contact pressure distributions (c,d) obtained at different σLoad (Vsl = 0.5 m/s, b = 5). p = 30 MPa for (a,c) and p = 80 MPa for (b,d).
Lubricants 11 00414 g015
Figure 16. Profiles of upper and lower contacting surfaces on PTE (a) and NTE (b) friction pairs: (a) σLoad = 90 MPa, Vsl = 0.25 m/s, t = 4 s; (b) σLoad = 80 MPa, Vsl = 0.5 m/s, t = 0.1 s.
Lubricants 11 00414 g016
Figure 17. Contact surface level (a) and surface roughness Ra (b) vs. time dependencies obtained on the lower NTE body at different sliding velocities VslLoad = 10 MPa, b = 5).
Lubricants 11 00414 g017
Figure 18. COF vs. time dependencies for different σLoad (Vsl = 1 m/s, b = 5) obtained on the NTE material.
Lubricants 11 00414 g018
Figure 19. Wear mode map for PTE (solid curve) and NTE (dotted line) sliding mated pairs at b = 5. Black squares show numerically obtained critical points ( V s l c r i t , σ L o a d c r i t ) for PTE material. Solid curve approximates points by exponent. Vertical dashed line is the boundary for NTE material.
Lubricants 11 00414 g019
Figure 20. Average values of steady temperature on the bottom body surface Tsteady for PTE friction pair (b = 5) at Vsl = V s l c r i t Load). Values of V s l c r i t correspond to those in Figure 19.
Lubricants 11 00414 g020
Figure 21. Boundaries between loading parameter areas corresponding to qualitatively different wear regimes for PTE and NTE friction pairs with different b varied by reducing the material tensile strength σtens while keeping the compressive strength σcomp constant. Squares show numerically obtained critical points ( V s l c r i t , σ L o a d c r i t ) for PTE material at different values of b. Solid curves approximate corresponding points by exponent. Vertical dashed lines are the boundaries for NTE material at different values of b.
Lubricants 11 00414 g021
Table 1. Thermomechanical properties of the model materials.
PropertyZrO2Sc2W3O12
α (1/K) *1 × 10⁻⁵ [52,53]−0.75 × 10⁻⁵ [22,52,54]
k (W/m/K) *2.71.5 [51]
c (J/kg/K) *500420 [55]
ρ (kg/m3) *60004440 [56]
E (GPa) *200150 [31]
ν *0.250.2
σcomp (MPa) *20001300 [31]
σtens (MPa) *400/2000260/1300
B = σcomptens1/51/5
* α is CTE, k is heat conductivity, c is heat capacity, ρ is density, E is Young’s modulus, ν is Poisson’s ratio, σcomp is uniaxial compressive strength, and σtens is uniaxial tensile strength.
Disclaimer/Publisher’s Note: The statements, opinions and data contained in all publications are solely those of the individual author(s) and contributor(s) and not of MDPI and/or the editor(s). MDPI and/or the editor(s) disclaim responsibility for any injury to people or property resulting from any ideas, methods, instructions or products referred to in the content.

