Article

Tribocorrosion Behavior of γ′-Fe4N Nitride Layer Formed on Mild Steel by Plasma Nitriding in Chloride-Containing Solution

School of Engineering and Sustainable Development, Faculty of Computing, Engineering and Media, De Montfort University, Leicester LE1 9BH, UK
*
Author to whom correspondence should be addressed.
Lubricants 2023, 11(7), 281; https://doi.org/10.3390/lubricants11070281
Submission received: 25 May 2023 / Revised: 15 June 2023 / Accepted: 28 June 2023 / Published: 29 June 2023
(This article belongs to the Special Issue Laser Surface Engineering for Tribology)

Abstract

:
Nitriding has long been used to engineer the surfaces of engineering steels to improve their surface and subsurface properties. The role of the surface compound layer (γ′-Fe4N and/or ε-Fe2-3N) in improving the tribological and corrosion-resistant properties of nitrided steels has been established. However, there have been very few studies on the response of the compound layer to tribocorrosion in corrosive environments. In this work, the tribocorrosion behavior of a 5 μm thick γ′-Fe4N nitride layer produced on mild steel (MS) by plasma nitriding has been studied in a NaCl-containing solution under various electrochemical conditions. The results show that at a cathodic potential of −700 mV (saturated calomel electrode, SCE), where mechanical wear is predominant, the total material removal (TMR) from the γ′-Fe4N layer is 37% smaller than that from the untreated MS, and at open circuit potential, TMR from the layer is 34% smaller than that from the untreated MS, while at an anodic potential of −200 (SCE), the γ′-Fe4N layer can reduce TMR from mild steel by 87%. The beneficial effect of the γ′-Fe4N nitride layer in improving the tribocorrosion behavior of mild steel is derived from its high hardness and good corrosion resistance in the test solution and its ability to resist both mechanical wear and corrosion and to reduce wear–corrosion synergism.

1. Introduction

Nitriding is a common thermochemical treatment technique used to engineer the surfaces of engineering steels [1,2,3,4,5] and many other metallic materials such as titanium alloys [6,7], aluminum alloys [8,9], nickel-based alloys [10,11] and Co-Cr biomedical alloys [12,13]. In particular, nitriding has long been used in industry to case-harden many steel components such as gears and drive-shafts to improve their performance and durability in real applications [1,2]. This is due to the formation of an iron nitride compound layer on the surface and a nitrogen diffusion zone at the subsurface, which can enhance the wear resistance, fatigue resistance and in many cases, corrosion resistance of steel components [1,14].
During nitriding iron and steels, depending on the nitrogen potential or activity in the treatment media and the steel composition, a compound layer of a few microns thick composed of a single γ′-Fe4N phase or a mixed γ′-Fe4N and ε-Fe2-3N phase is formed at the surface [2,3,4]. This is followed by a relatively thick nitrogen diffusion zone at the subsurface. If the steel contains nitride-forming elements such as Cr and V, fine precipitates of nitrides of the alloying elements, such as CrN and VN, will form in the diffusion zone to induce precipitation hardening which contributes to the hardening effect of the diffusion zone [3,15]. In pure iron and plain carbon steels such as mild steels, γ′-Fe4N needles or thin plates form in the diffusion zone, which provides a marginal hardening effect [15,16]. In such steels, the surface-hardening effect is mainly imparted by the iron nitride compound layer at the surface.
The role of the surface compound layer (γ′-Fe4N and/or ε-Fe2-3N) and the nitrogen diffusion zone in improving the tribological, fatigue and load-bearing capacity properties of nitrided steels has been established [17,18,19,20]. The iron nitride compound layer at the surface provides anti-galling properties and good wear resistance, while the nitrogen diffusion zone provides load-bearing capacity and enhances the fatigue strength of steel components, due to the hardening effect and compressive residual stresses [17,19]. In general, a single γ′-Fe4N phase compound layer of a few microns thick is preferred, because a thick compound layer or a mixed phase compound layer can increase the embrittlement of the surface layer which tends to spall off during service [1,2,3]. There have also been reports that the iron nitride compound layer can improve the corrosion resistance of steels, such that nitrided steels can be used in more harsh environmental conditions [14,21,22]. Indeed, in many engineering applications, such as in marine and off-shore applications, nitrided components are used in corrosive environments under mechanical contact sliding conditions. Under such conditions, the components are subjected to combined corrosion and mechanical wear actions, i.e., tribocorrosion [23,24,25,26,27]. So far, the studies on the tribocorrosion behavior of nitrided steels have been focused on stainless steels [28,29]. Although there have been a few studies on the tribocorrosion behavior of nitrided low- alloy steels [30,31], the response of the γ′-Fe4N compound layer to tribocorrosion has not been fully understood. Due to the importance of such a compound layer in determining the performance of nitrided steels, it is necessary to investigate the tribocorrosion behavior of the γ′-Fe4N layer under various electrochemical conditions.
In the present work, a 5 μm thick γ′-Fe4N iron nitride layer was produced on mild steel (MS) by plasma nitriding. The tribocorrosion behavior of this γ′-Fe4N layer was investigated in 1.0% NaCl solution under combined reciprocating sliding wear and electrochemical corrosion conditions. No such systematic study on the response of the technologically important γ′-Fe4N layer to tribocorrosion has been reported previously. This work provides reference values for researchers and engineers to further explore the application potentials of iron nitride layers to combat material degradation due to tribocorrosion.

2. Materials and Methods

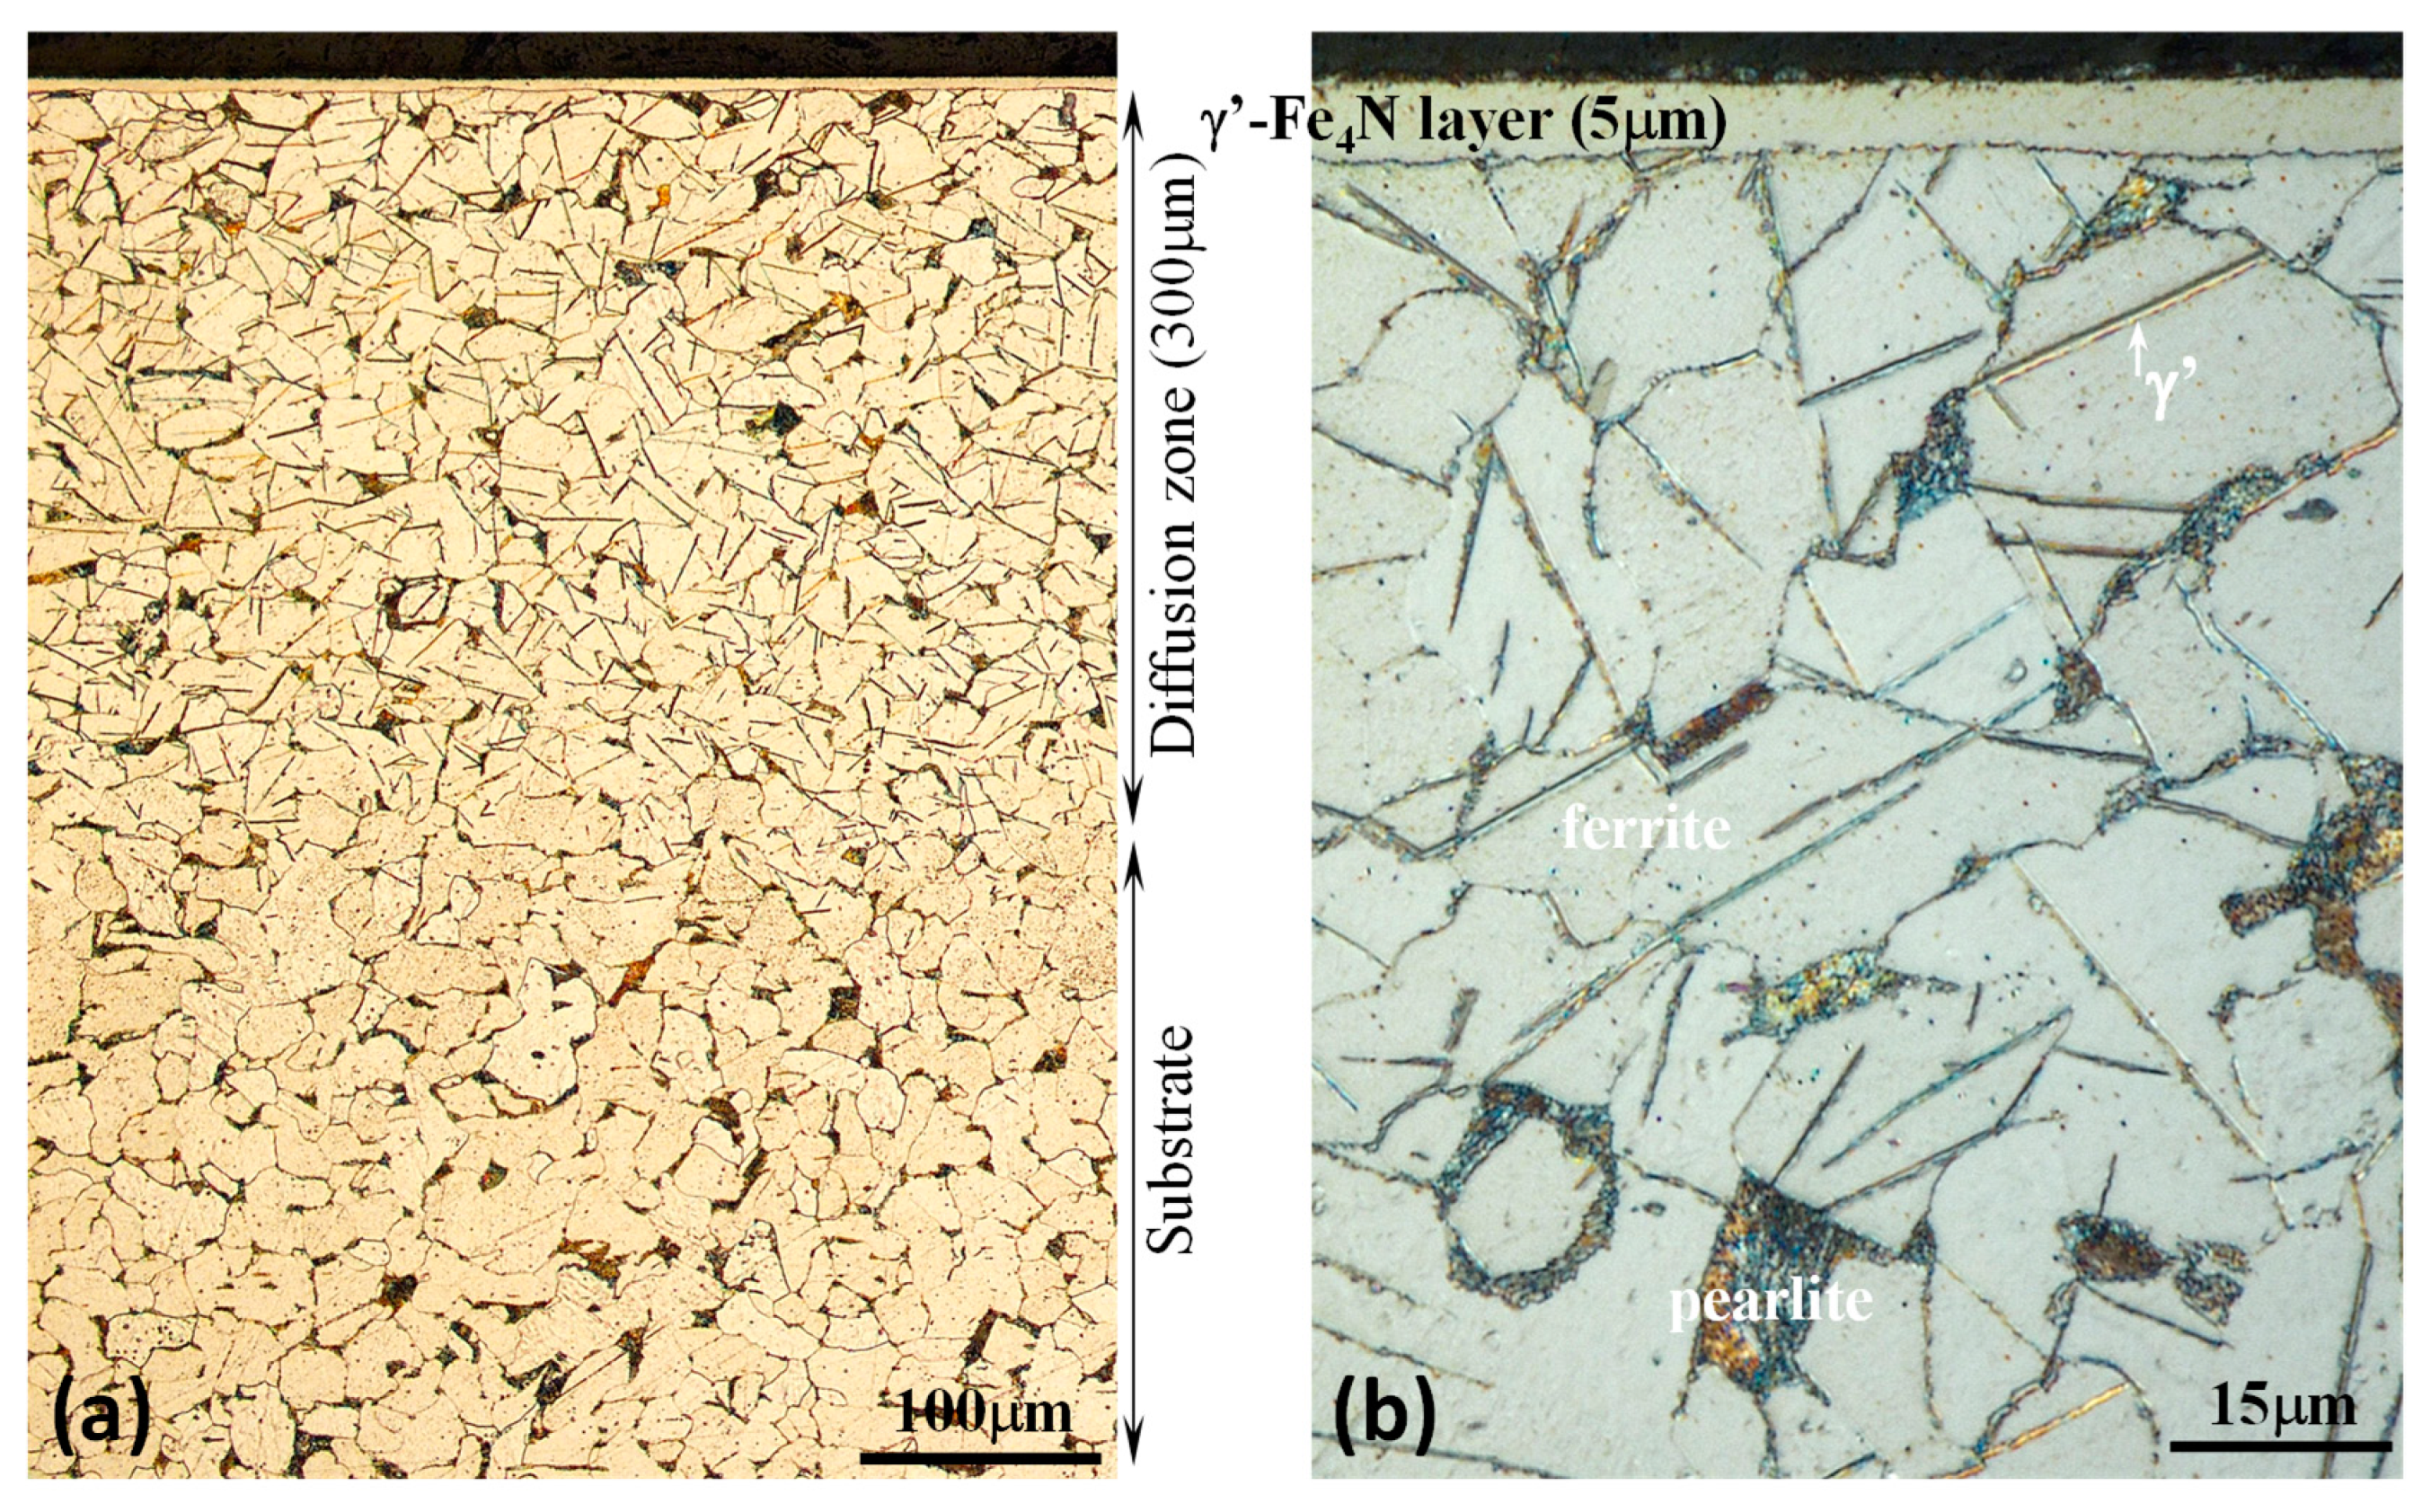
2.1. Substrate Material and Plasma Nitriding

The substrate material was AISI 1020 mild steel with the following chemical composition (in wt%): 0.203 C, 0.463 Mn, 0.040 P, 0.050 S, and balance Fe. Low-carbon steel was used to ensure the formation of a pure γ′-Fe4N layer on the surface by controlled plasma nitriding. The steel was in a normalized state with a ferrite + pearlite structure (Figure 1a) with an average ferrite grain size of 26 μm. The normalizing treatment was conducted in a muffle furnace at 910 °C for 20 min, followed by air cooling. Specimens of 25 × 15 × 4 mm dimensions were machined from a steel plate. The surface to be nitrided (25 × 15 mm) was manually ground using SiC grinding papers down to the P1200 grade to achieve a surface finish of 0.2 μm (Ra).
Plasma nitriding was carried out at 550 °C in a plasma atmosphere containing 10% N2 and 90% H2, at a treatment pressure of 3 mbar for 5 h. Before nitriding, the surface was cleaned in running water and then in ethanol ultrasonically for 10 min. After plasma nitriding, the specimens were cooled inside the furnace under vacuum (0.1 mbar) down to room temperature.
Figure 1 shows the cross-sectional morphology of the nitrided specimen. Table 1 summarizes the structural features of the nitrided (PN) and un-nitrided (normalized) specimens. It can be seen that plasma nitriding produced a thin “white layer” about 5 μm thick at the surface (Figure 1b) and a relatively thick diffusion zone about 300 μm thick beneath (Figure 1a). X-ray diffraction analysis confirmed that the “white layer” at the surface was composed of γ′-Fe4N phase, as can be seen from Figure 2, which shows that only γ′ and α-Fe were detected, where the α-Fe peaks came from the substrate. In the nitrogen diffusion zone, γ′-Fe4N needles were formed, which is typical of nitriding pure iron and low- carbon steels [15,16]. The surface hardness of the PN and normalized specimens were also measured under various indentation loads and the results are listed in Table 1. Clearly, the nitrided surface exhibited a higher hardness than the un-nitrided surface. At the small indentation load of 25 g, the surface hardness of the PN specimen was 760 HV, which agrees with the reported hardness value of γ′-Fe4N [32]. With increasing indentation load, the surface hardness of the PN specimen declined quickly, due to the increasing substrate effect. This also suggests that the precipitation of γ′-Fe4N needles in the diffusion zone had a limited hardening effect. Microhardness measurements were also made in the diffusion zone below the γ′-Fe4N layer. The hardness of the diffusion zone ranged from 245 to 255 HV0.1, similar to that measured from the normalized substrate. Thus, the surface- hardening effect was mainly derived from the formation of the γ′-Fe4N layer.

2.2. Corrosion Tests

All corrosion tests were conducted at room temperature in 1.0 wt% NaCl solution by dissolving analytical grade NaCl in double-distilled water. This solution was used because it contains a chloride content similar to that in human body fluids. An ACM Gill AC potentiostat (ACM Gill AC, ACM Ltd., Cumbria, UK) was used to measure the potentials and currents during the tests employing a 3-electrode configuration, i.e., the test specimen as the working electrode, a saturated calomel electrode (SCE) as the reference electrode and a platinum mesh as the auxiliary electrode.
Before corrosion tests, the nitrided and un-nitrided surfaces were slightly polished using 1 μm diamond paste to remove surface contaminants resulting from nitriding and to further smoothen the surface. This was followed by ultrasonic cleaning in ethanol for 10 min. Then the specimen was masked by using an insulating lacquer to leave a test window of 10 mm × 10 mm which would be exposed to the solution.
Corrosion tests were conducted both potentiodynamically to measure the anodic polarization curves of the specimens and potentiostatically to measure the current evolution as a function of time at constant potentials. The potentiodynamic test was conducted at a scan rate of 1 mV/s, by sweeping potential from −200 mV (vs. open circuit potential (OCP)) to 800 mV (vs. OCP). The potentiostatic tests were conducted at a cathodic potential of −700 mV(SCE), at OCP and at an anodic potential of −200 mV(SCE). During all the tests, the current and potential values were recorded continuously at a sampling rate of 1 Hz.

2.3. Tribocorrosion Tests

Tribocorrosion tests were carried out under the same electrochemical conditions and following the same surface preparation procedures as those used in the corrosion tests described in Section 2.2. A laboratory-scale reciprocating wear test machine was used to perform the tests [33]. The tribometer allowed for the reciprocating movement of a flat specimen against a stationary slider (ball) at controlled frequency, stroke amplitude and contact load, and the continuous measurement of friction force by the incorporated load cell. The incorporation of an electrochemical potentiostat with the tribometer allowed for the measurements of potential and current during the sliding wear process. Before the test, the specimen was masked by using an insulating lacquer to leave a test window of 15 mm × 3 mm which would be exposed to the solution. An electrically conducting lead was connected to the specimen to ensure conductivity of the specimen for electrochemical measurements. In order to ensure that electrochemical reactions only occur in the test window, all other fixtures, including the specimen holder, the test cell and the slider holder were made of nylon.
During tribocorrosion testing, the specimen was immersed in the 1.0 wt% NaCl solution. An SCE and a platinum wire were also inserted in the solution as the reference and auxiliary electrode, respectively. An alumina (Al2O3) ball of 8 mm diameter (Ra = 0.05 μm) was used as the stationary slider, which made sliding contact with the reciprocating specimen, generating a sliding track on the specimen. All tests were implemented under a contact load of 4 N for a total sliding duration of 7200 s at a reciprocating frequency of 1 Hz and an amplitude of 6 mm. Before and after sliding, the specimen was stabilized in the solution for 300 s under respective conditions, such that potentials and/or currents could be measured before, during and after sliding. The test parameters were selected based on our experience and preliminary tests to ensure that the properties of the γ′-Fe4N layer were measured.
All corrosion and tribocorrosion tests were duplicated, which was considered sufficient because the results were reproducible. The results from the two tests are presented where applicable. Table 2 summarizes the test conditions under both sliding (tribocorrosion) and no-sliding (corrosion) conditions.

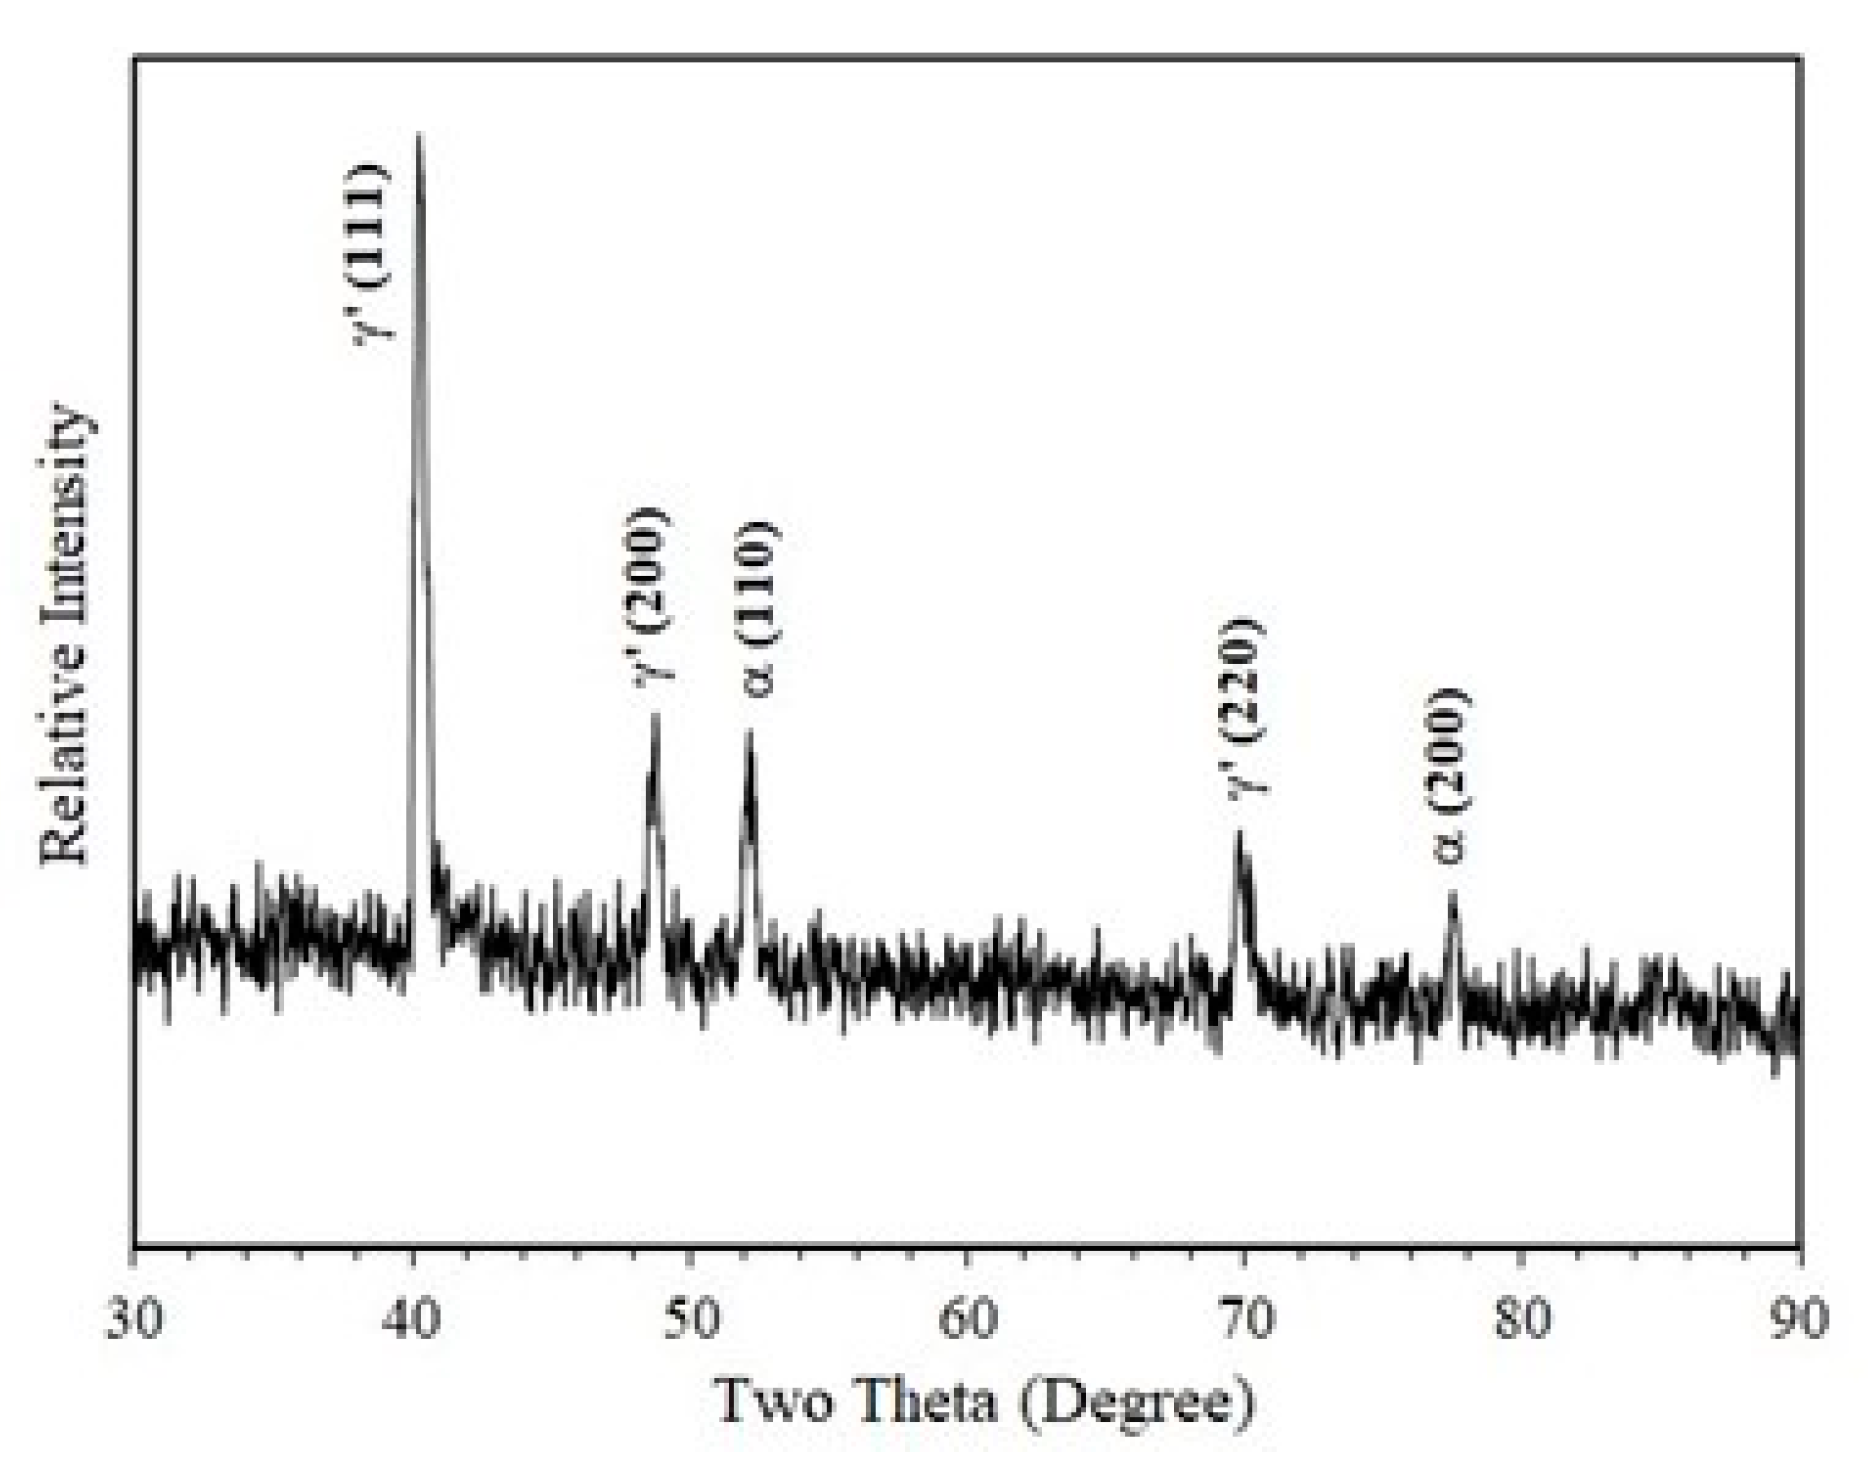
2.4. Specimen Characterization

After corrosion and tribocorrosion tests, the corroded surfaces and sliding tracks were examined microscopically under optical microscope (Nikon LV150N, Nikon, Tokyo, Japan) and scanning electron microscope (SEM) (Carl Zeiss EVO LS 15, Carl Zeiss, Jena, Germany). Using the extended depth-of-focus feature of the Nikon microscope, 3D images and surface profiles of the sliding tracks could be captured. The SEM was equipped with EDX facilities for elemental composition analysis. A profilometer (Surtonic Intra Touch, Taylor-Hobson, Leicester, UK) was used to measure the surface profiles across each sliding track at three locations to measure the cross-sectional area of the track and thus obtain the total material removal (TMR) from each specimen due to tribocorrosion.

3. Results

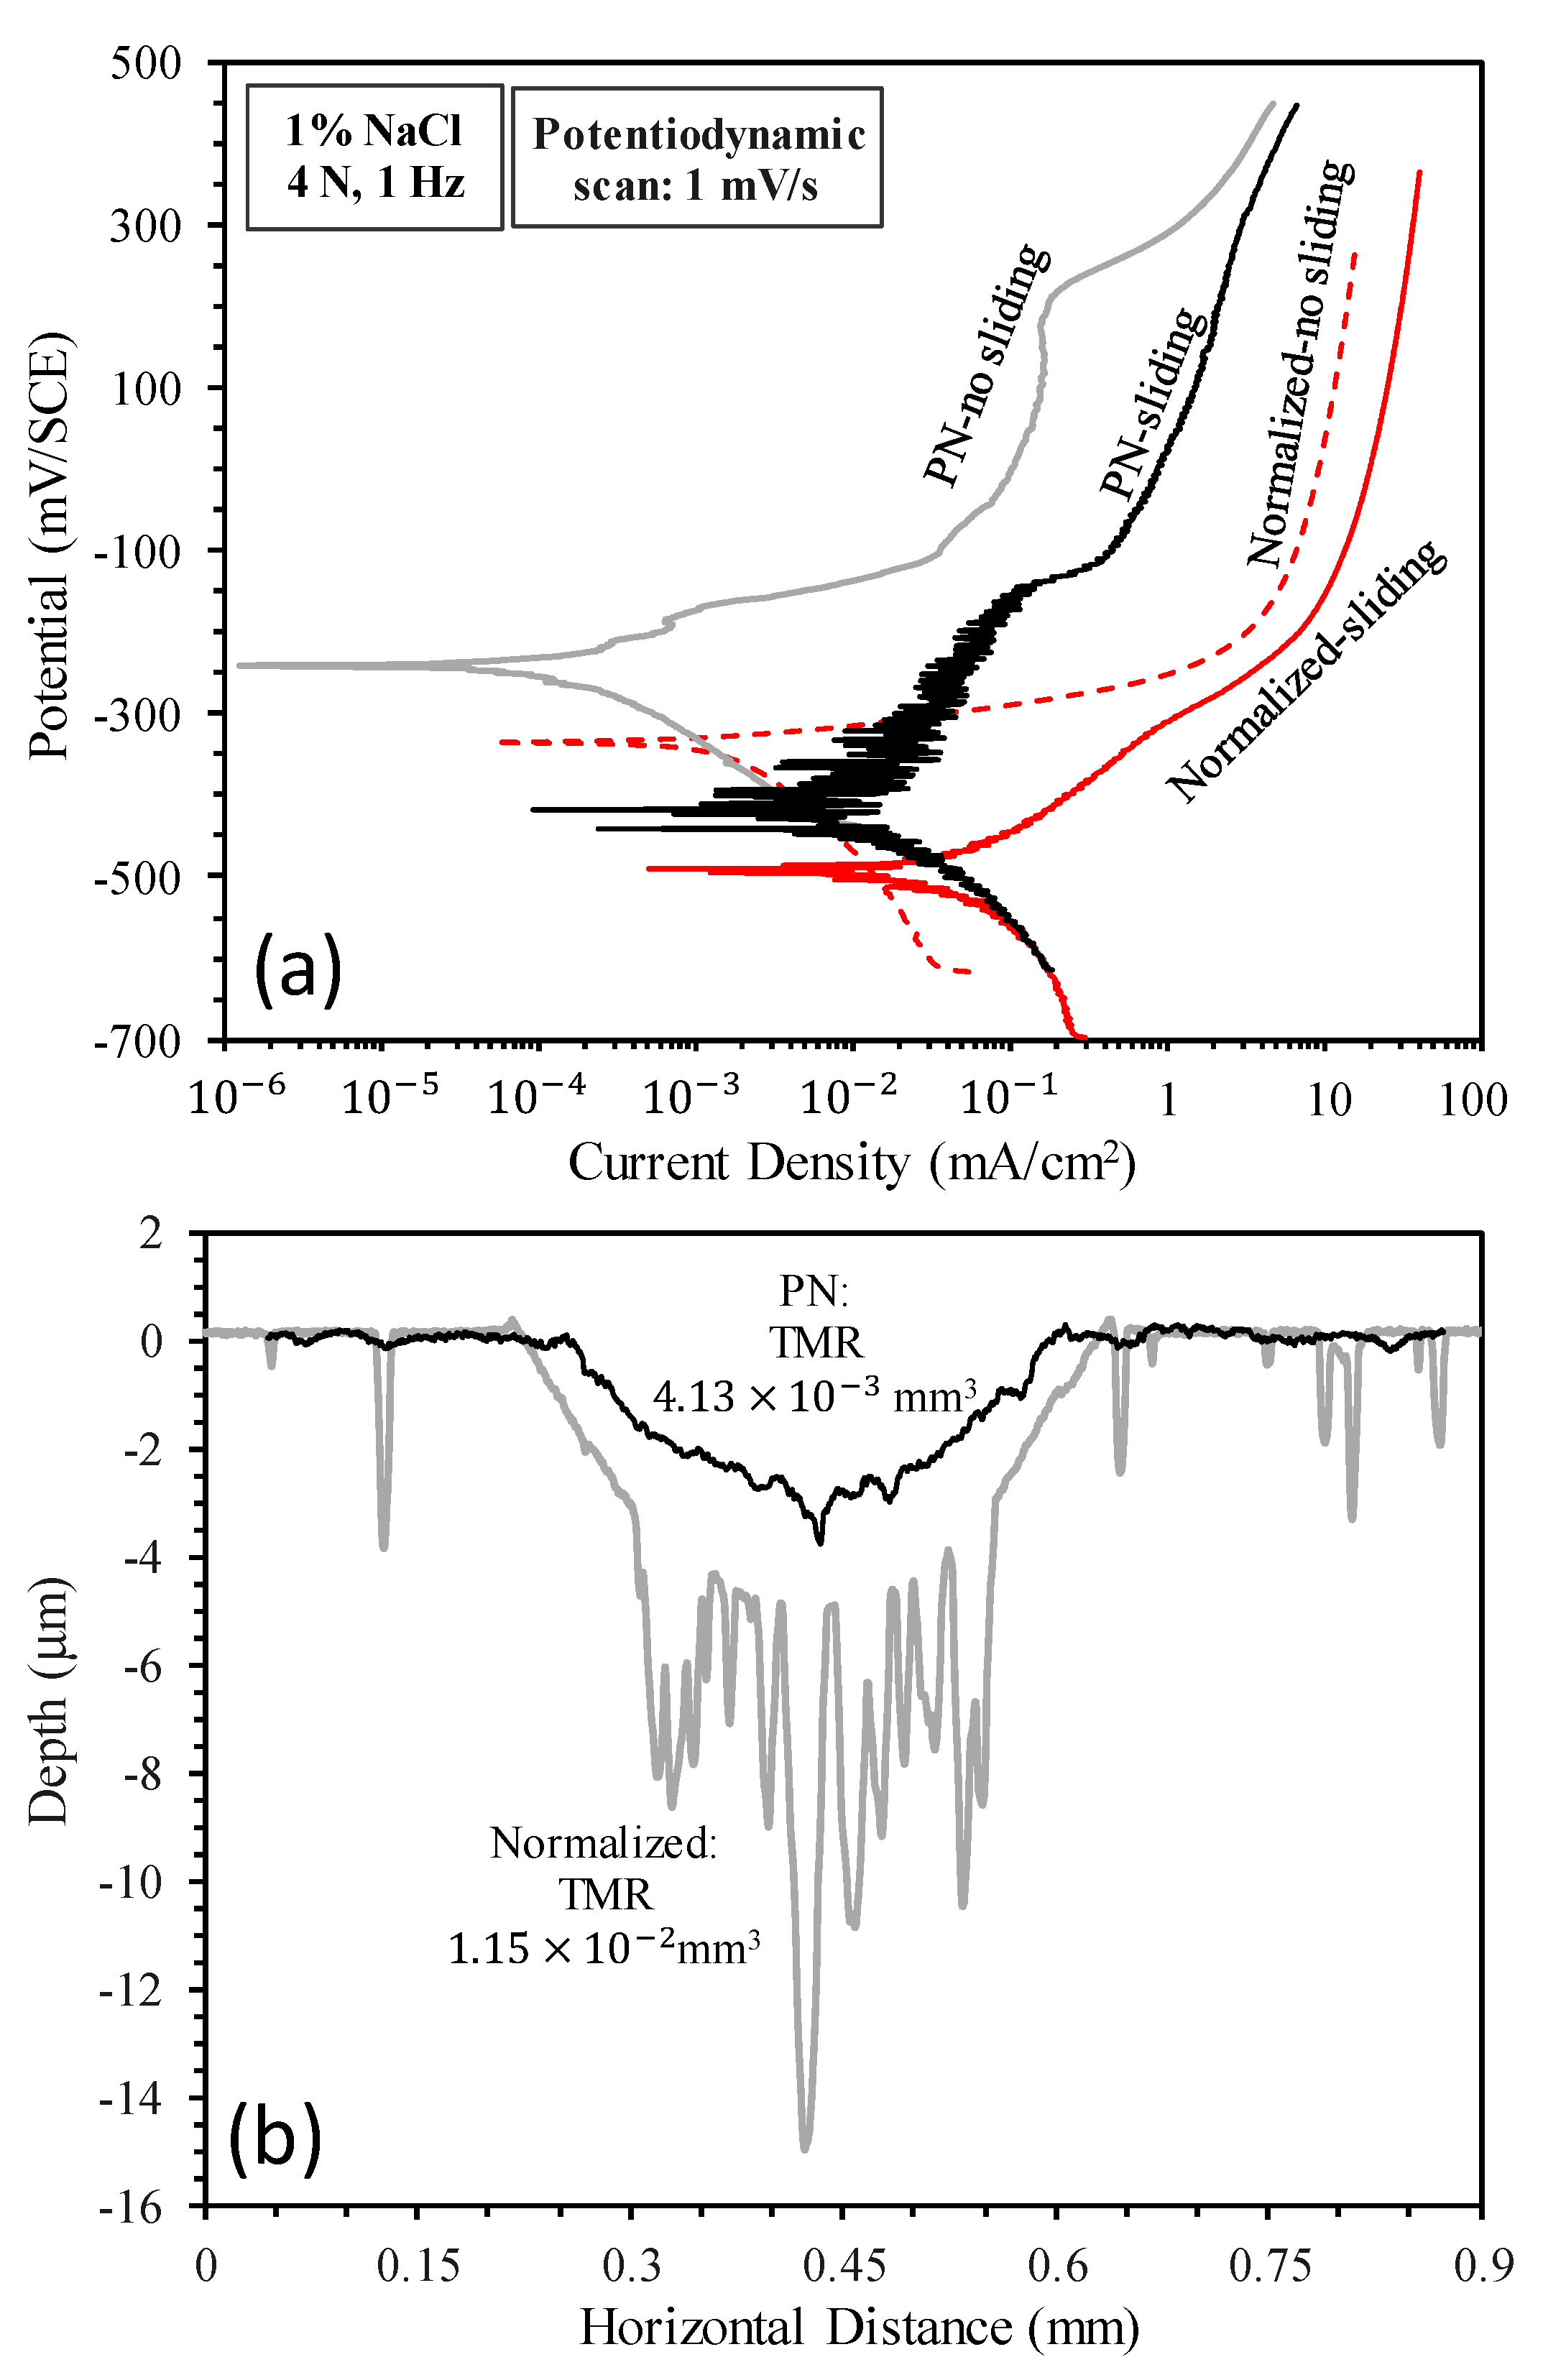
3.1. Potentiodynamic Tests

Figure 3a shows the anodic polarization curves measured without sliding and during sliding for the un-nitrided (normalized) and plasma-nitrided (PN) specimens. Under the condition of corrosion (no-sliding), the normalized specimen showed active anodic dissolution behavior: the current density increased quickly at anodic potentials above the corrosion potential and then increased slowly due to transpassivity. Microscopic examination revealed that the normalized specimen suffered from severe corrosion which etched the grain structures and led to grain detachment (see Figure 4a). Under the same no-sliding condition, the PN specimen showed a higher corrosion potential and much lower current densities in the anodic region. The corroded area only showed some discoloration as compared to the un-corroded area (see Figure 4b). Thus, in the test solution, the normalized specimen was in the active state in the anodic region, while the γ′-Fe4N layer formed on the surface by nitriding was effective in reducing the dissolution rate of mild steel. Under the condition of tribocorrosion (sliding), the corrosion potentials of both specimens were shifted cathodically and the current densities in the anodic region were increased (Figure 3a). This demonstrates that the sliding mechanical action activated both the normalized surface and PN surface such that corrosion in the sliding tracks was accelerated, which is a common phenomenon observed in tribocorrosion [23,24,25,26,27].
Table 3 lists the corrosion potentials, corrosion current densities and corrosion rates derived from the polarization curves shown in Figure 3a. It can be seen that sliding led to an increase in corrosion current density by an order of magnitude for the normalized specimen and by nearly two orders of magnitude for the PN specimen. As compared to the normalized specimen, the PN specimen showed higher corrosion potentials and lower corrosion current densities, demonstrating that the γ′-Fe4N layer had the ability to reduce corrosion under both sliding and no-sliding conditions.
Figure 3b shows the surface profiles measured across the sliding tracks after anodic polarization tests during sliding. It can be seen that the sliding track on the normalized specimen was much deeper and rougher than that on the PN specimen. Material removal from outside the sliding track of the normalized specimen was also evident, obviously due to corrosion occurring outside the sliding track, as can be seen from Figure 4c. The deep valleys in the sliding track shown in Figure 3b for the normalized specimen were the results of accelerated corrosion. On the other hand, the sliding track on the PN specimen exhibited a shiny and polished appearance (Figure 4d). The TMR from the PN specimen was 64% smaller than that from the normalized specimen (Figure 3b). The measured surface profile shown in Figure 3b also revealed that the sliding track on the PN specimen was smaller than 4 μm, thus tribocorrosion occurred mainly within the γ′-Fe4N layer. However, some pits of several tens of microns in size were observed in the sliding track (Figure 4d,e). The penetration depth of the pits was as deep as 15 μm (Figure 4f), suggesting that once the γ′-Fe4N layer was broken down locally, accelerated corrosion happened in the form of pitting corrosion during the tribocorrosion process.
The results presented in this section provide a general picture of the corrosion and tribocorrosion behavior of the specimens over a wide potential range. In order to further demonstrate the beneficial effect of the γ′-Fe4N layer in improving the tribocorrosion behavior of mild steel, detailed tests were conducted potentiostatically at different potentials, as discussed in the following sections.

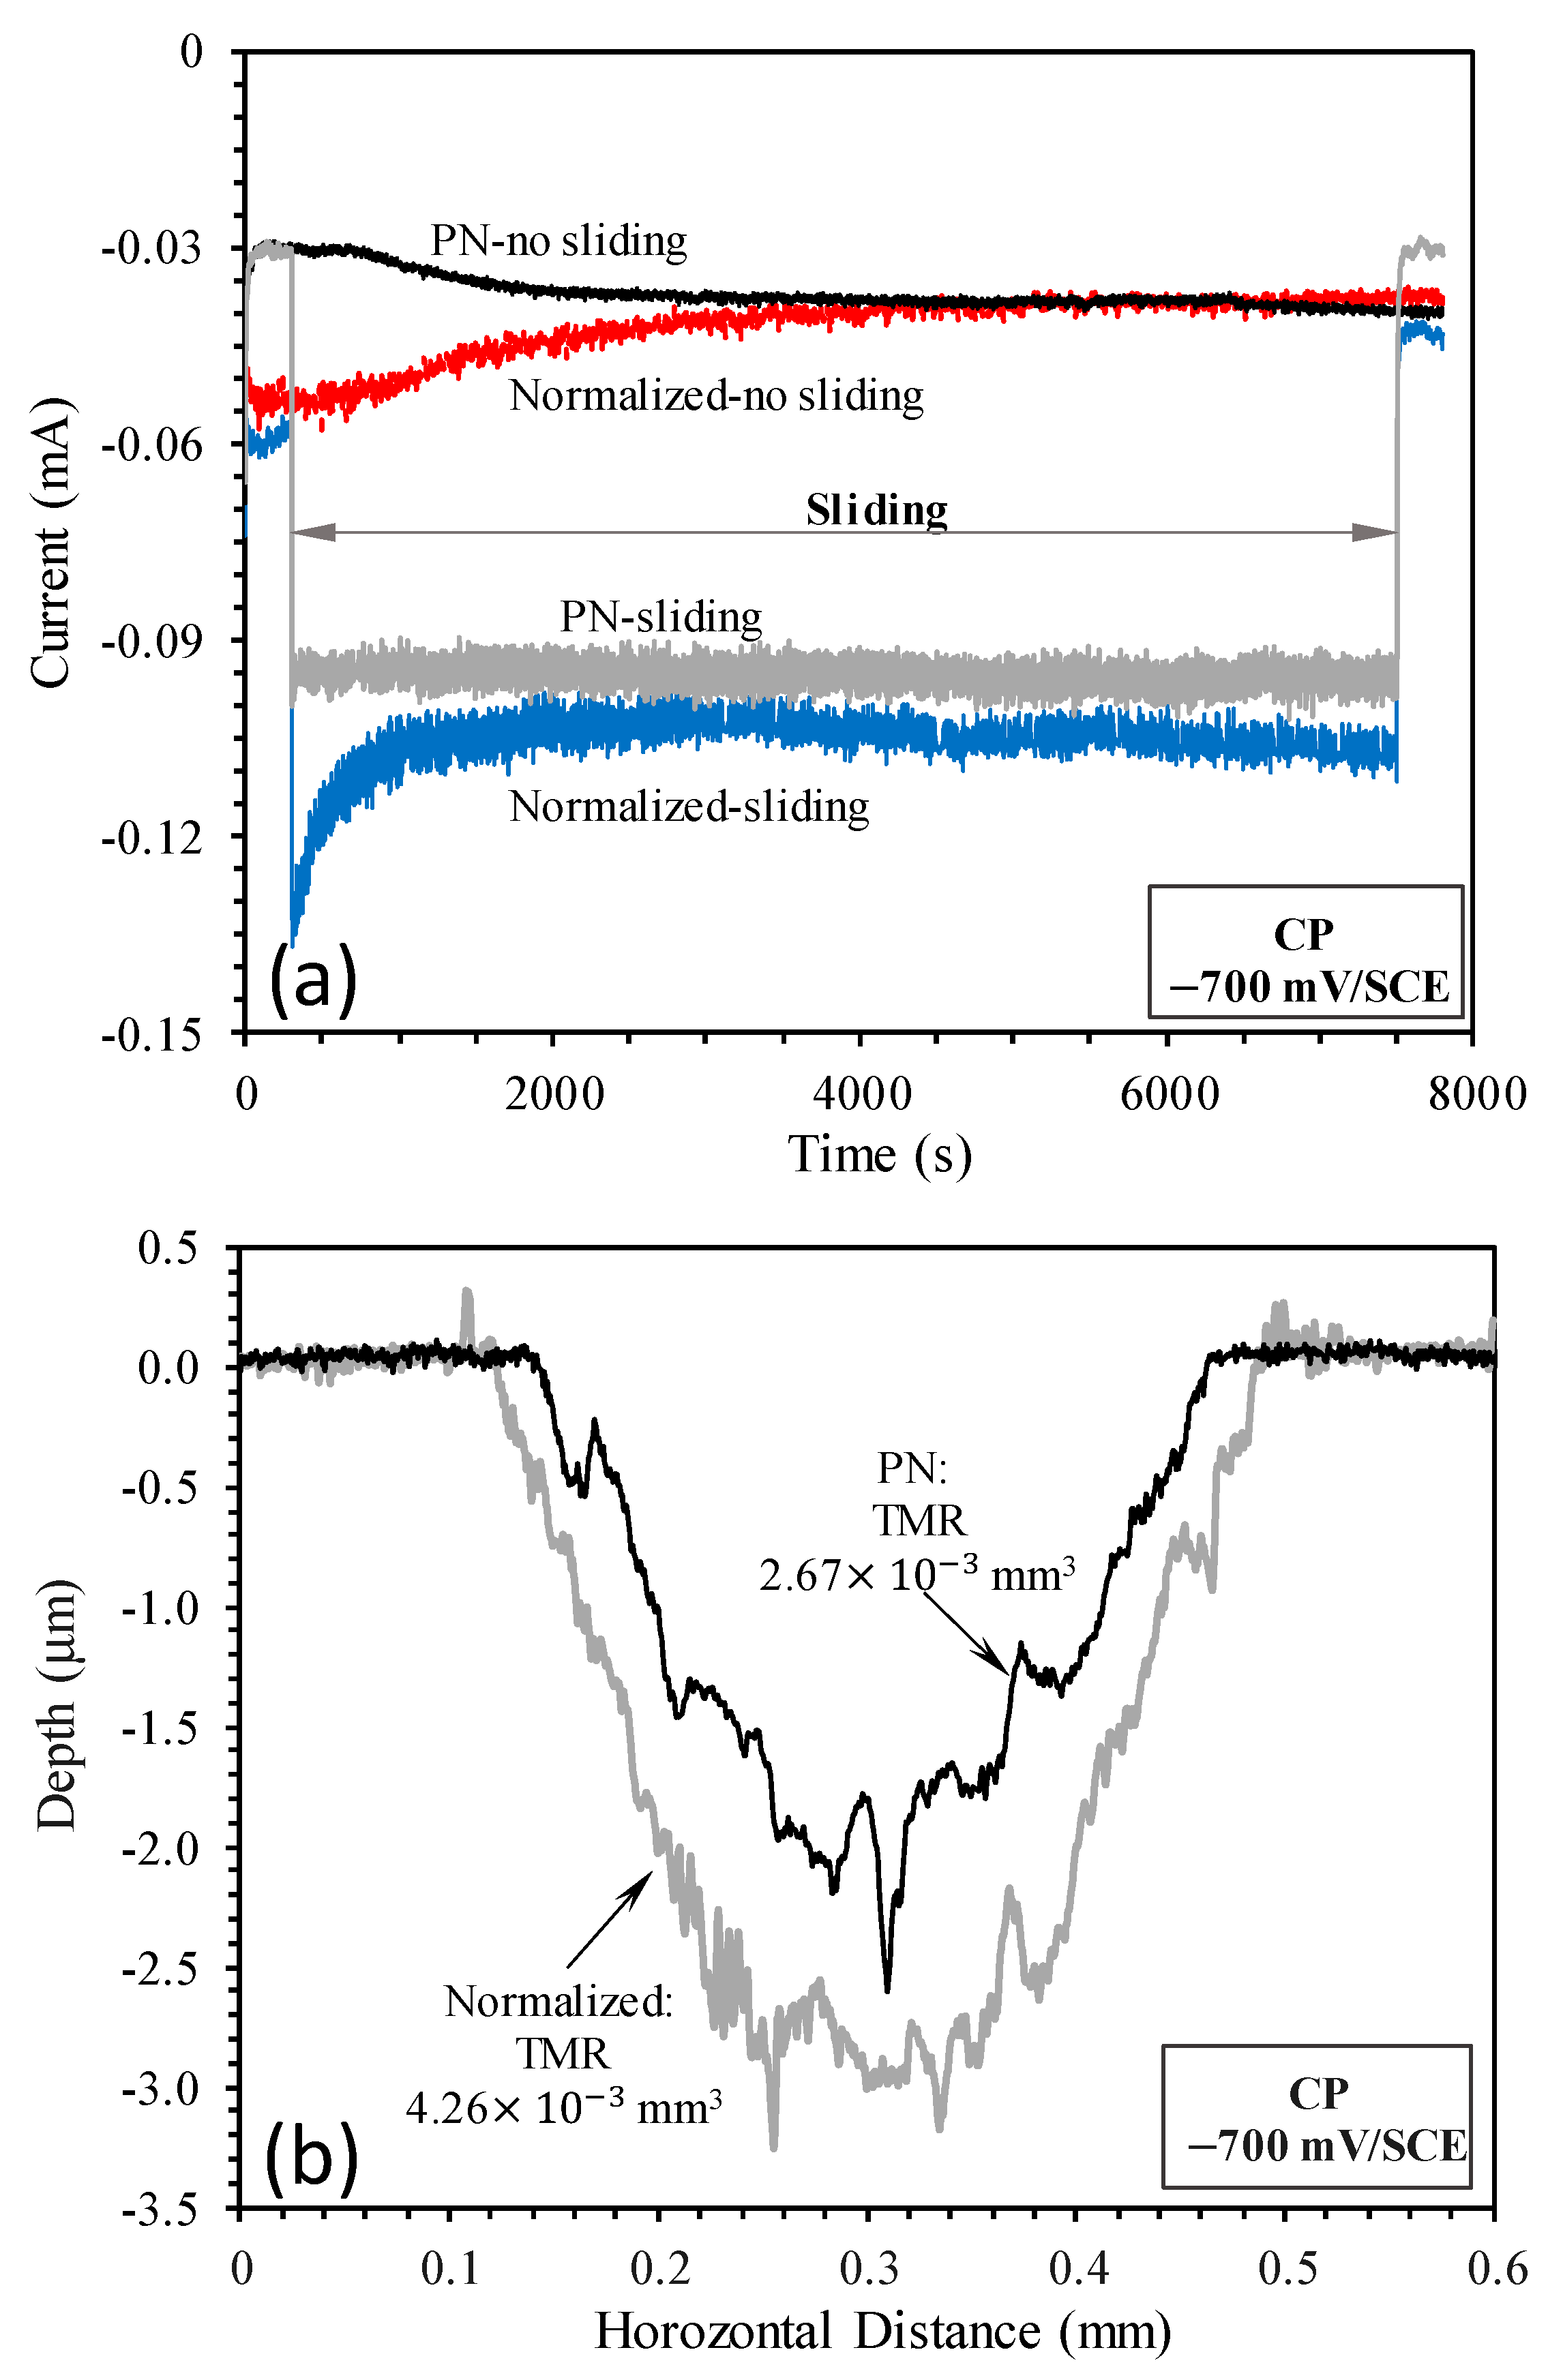
3.2. Cathodic Potential Tests

Figure 5a shows the recorded current versus time curves at the cathodic potential of −700 mV(SCE) in 1.0% NaCl solution under both sliding and no-sliding conditions. Under no-sliding conditions, negative currents were recorded for both specimens, suggesting that cathodic reactions were dominant, while metal oxidation (corrosion) became less dominant [23]. Sliding led to an increase in cathodic currents from around −0.04 mA to around −0.1 mA for both specimens, suggesting that the sliding action activated the surfaces and accelerated cathodic reactions.
Although corrosion is still possible at such a cathodic potential, its contribution to TMR from the sliding track is insignificant [23,33]. Thus, TMR was mainly due to mechanical wear. Figure 5b shows the surface profiles measured across the sliding tracks on the normalized and PN specimens. It can be seen that the sliding track on the normalized specimen was deeper and wider than that on the PN specimen. The wear depth on the PN specimen was smaller than 3 μm, thus wear occurred within the 5 μm thick γ′-Fe4N layer. The TMR from the PN specimen was about 63% of that from the normalized specimen. Clearly, the γ′-Fe4N layer had the ability to reduce the mechanical wear of mild steel by about 37%.
Figure 6 shows the SEM images and EDX elemental mappings of the sliding tracks on the normalized and PN specimens. The parallel scratch marks on the sliding tracks are good indications of mechanical abrasion wear arising from the sliding action of the alumina slider. The sliding track on the PN specimen showed a shiny appearance with very few signs of corrosion (Figure 6b). EDX mapping could not find oxygen on the worn surface, instead, nitrogen was found (Figure 6b), further confirming that the γ′-Fe4N layer was not worn through. On the other hand, the sliding track on the normalized specimen was covered with some dark gray products, which were rich in oxygen (Figure 6a), suggesting that limited corrosion could happen to the normalized specimen at such a cathodic potential.

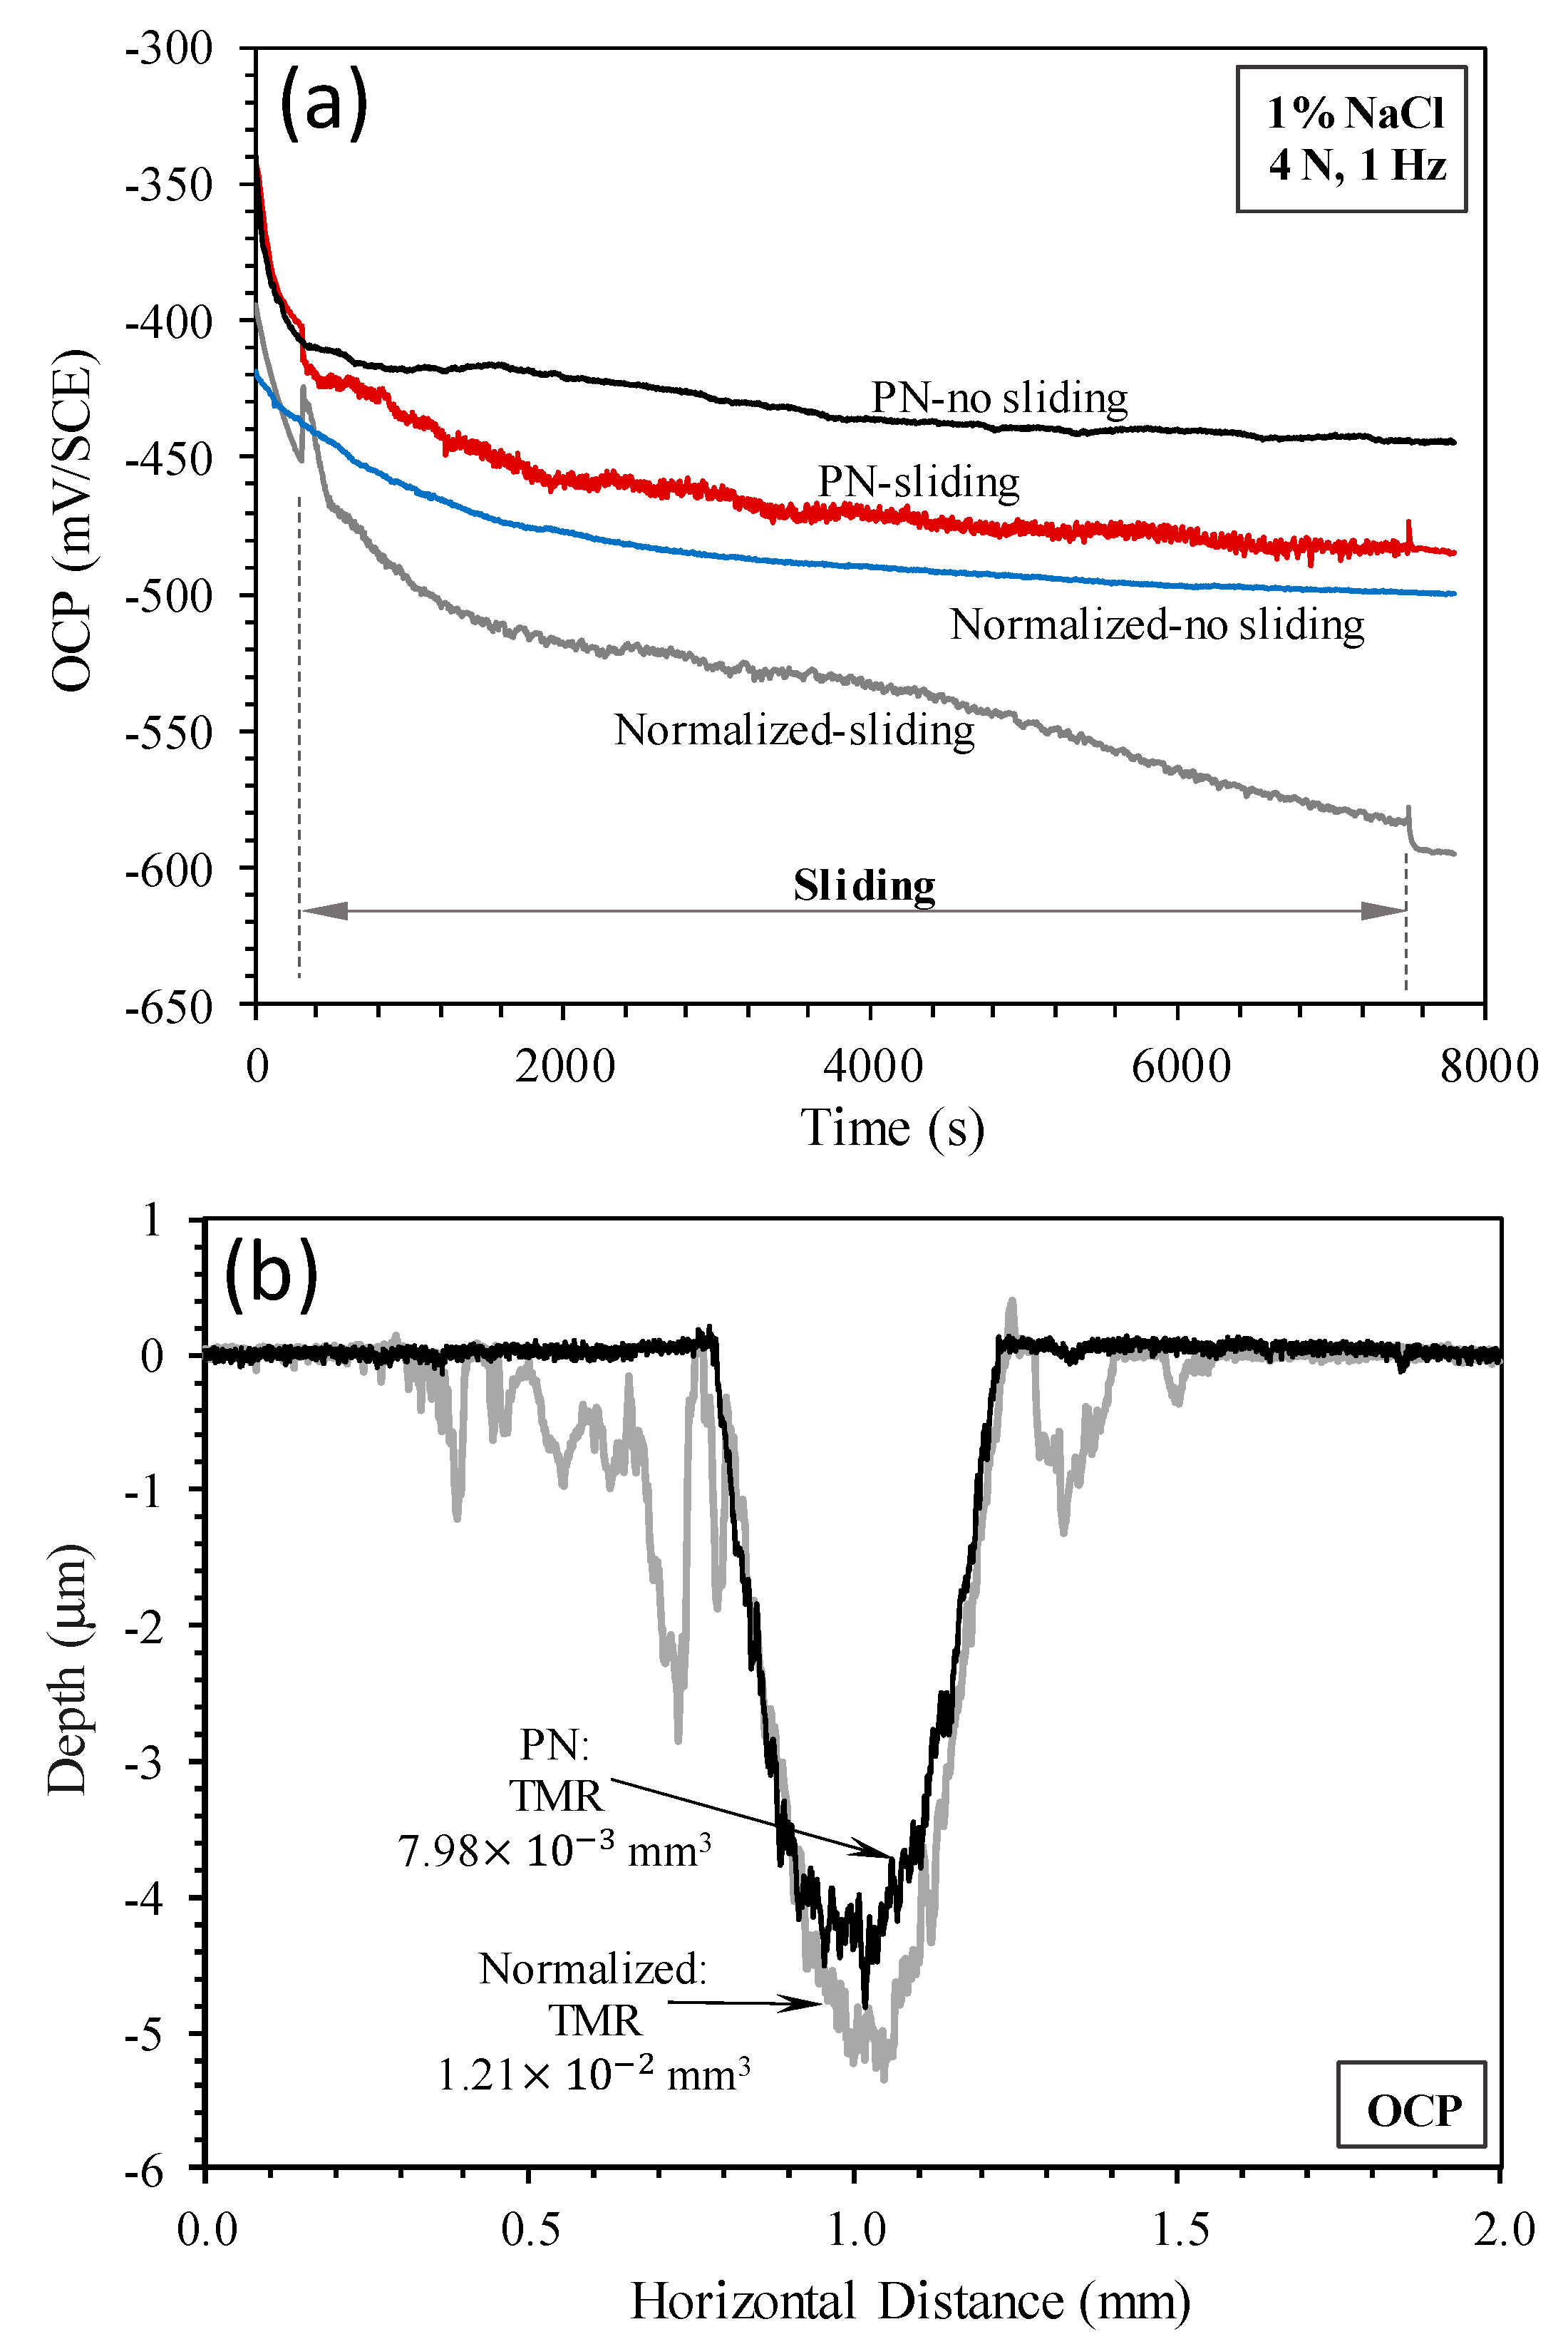
3.3. Open Circuit Potential (OCP) Tests

The OCP versus time curves recorded under open circuit conditions are shown in Figure 7a. Under no-sliding conditions, the OCP of both specimens decreased with increasing time of immersion in the solution. Both specimens were in the active state such that the surfaces became more activated with increasing time of immersion, leading to decreased OCP values. Under sliding conditions, the recorded OCP values also decreased with time and were more negative than those measured under no-sliding conditions, suggesting that sliding led to further activation of the surfaces. In agreement with the potentiodynamic measurements shown in Figure 3a, the OCP values measured for the PN specimen were more anodic than those measured for the normalized specimen under both sliding and no-sliding conditions. Clearly, the normalized surface was in a more active state than the PN surface under open circuit conditions.
The surface profiles measured across the sliding tracks are shown in Figure 7b. The sliding track on the normalized specimen was deeper than that on the PN specimen. Interestingly, material removal also occurred outside the sliding track on the normalized specimen, which was due to corrosion in areas exposed to the solution outside the track, as can be seen from Figure 8a. On the other hand, corrosion outside the sliding track on the PN specimen was very limited (Figure 7b), which was confirmed by microscopic examination (Figure 8c). Inside the sliding track, there were clear signs of corrosion in addition to the parallel abrasion marks (Figure 8b,d). The wear depth of the PN specimen was smaller than 5 μm (Figure 7b), thus wear and corrosion occurred within the γ′-Fe4N layer. A few pits were also observed inside the sliding track on the normalized specimen, which were several microns in depth (Figure 8b).
TMRs from the specimens were obviously the combined results of wear (abrasion) and corrosion. TMR from the PN specimen was about 34% smaller than that from the normalized specimen (Figure 7b). When compared with TMRs resulting from sliding at the cathodic potential of −700 mV(SCE) discussed in Section 3.2, TML at OCP was 2.8 times larger for the normalized specimen and 3.6 larger for the PN specimen. This demonstrates the effect of corrosion and wear–corrosion synergism in accelerating TMR from the specimen.

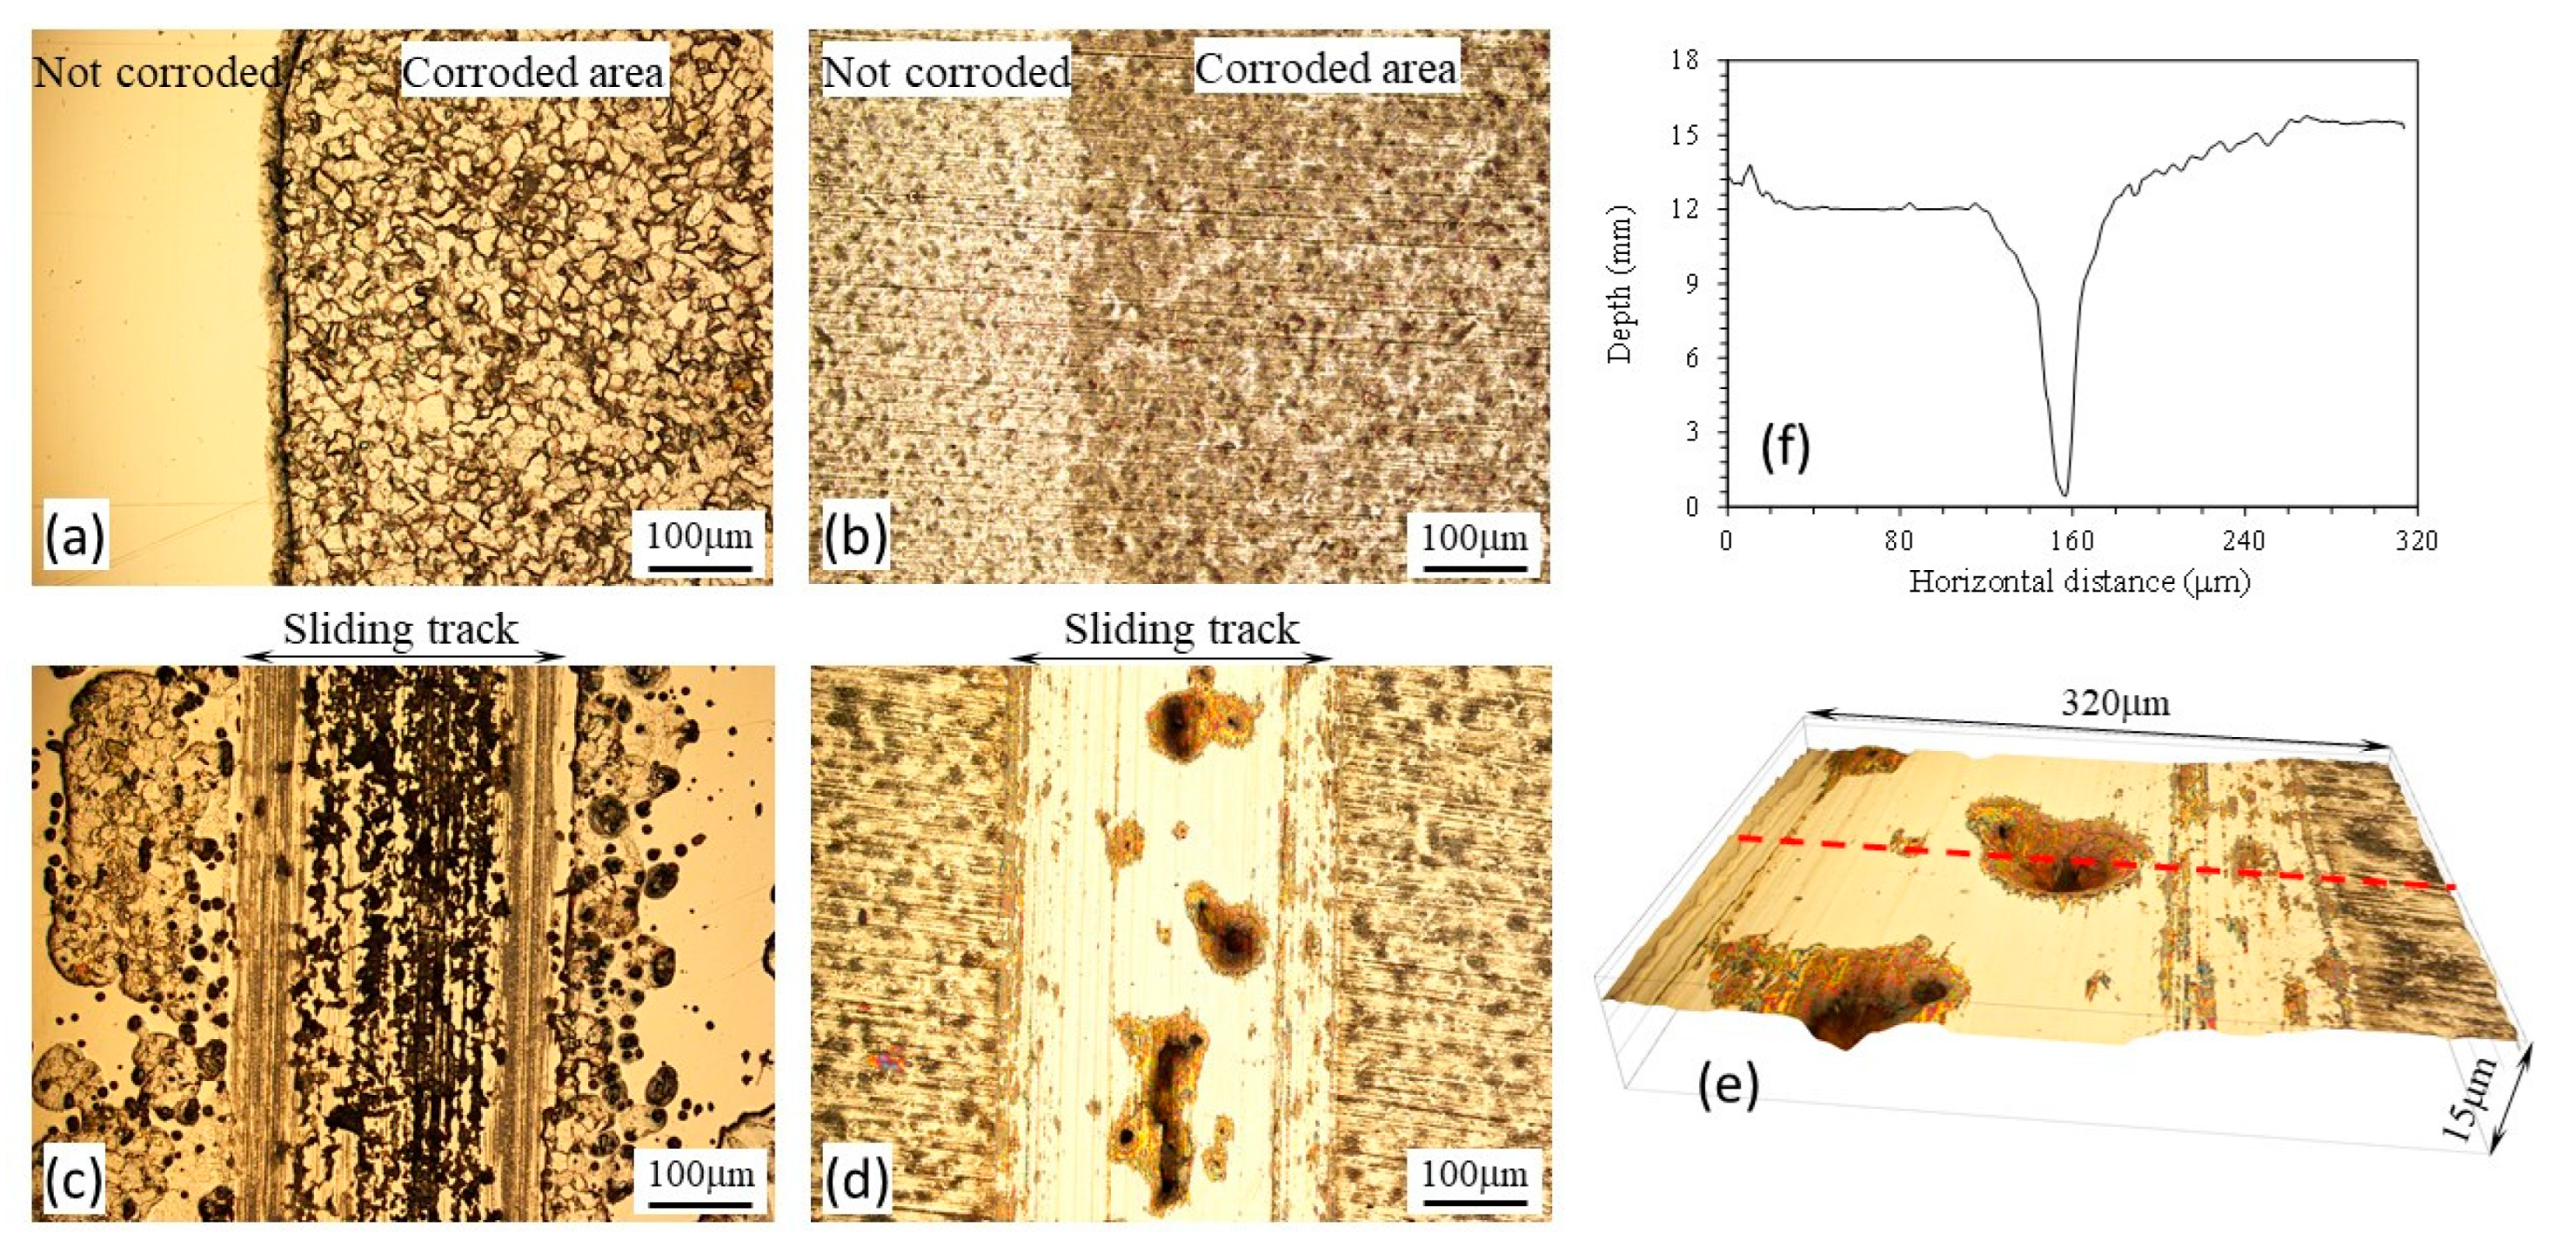
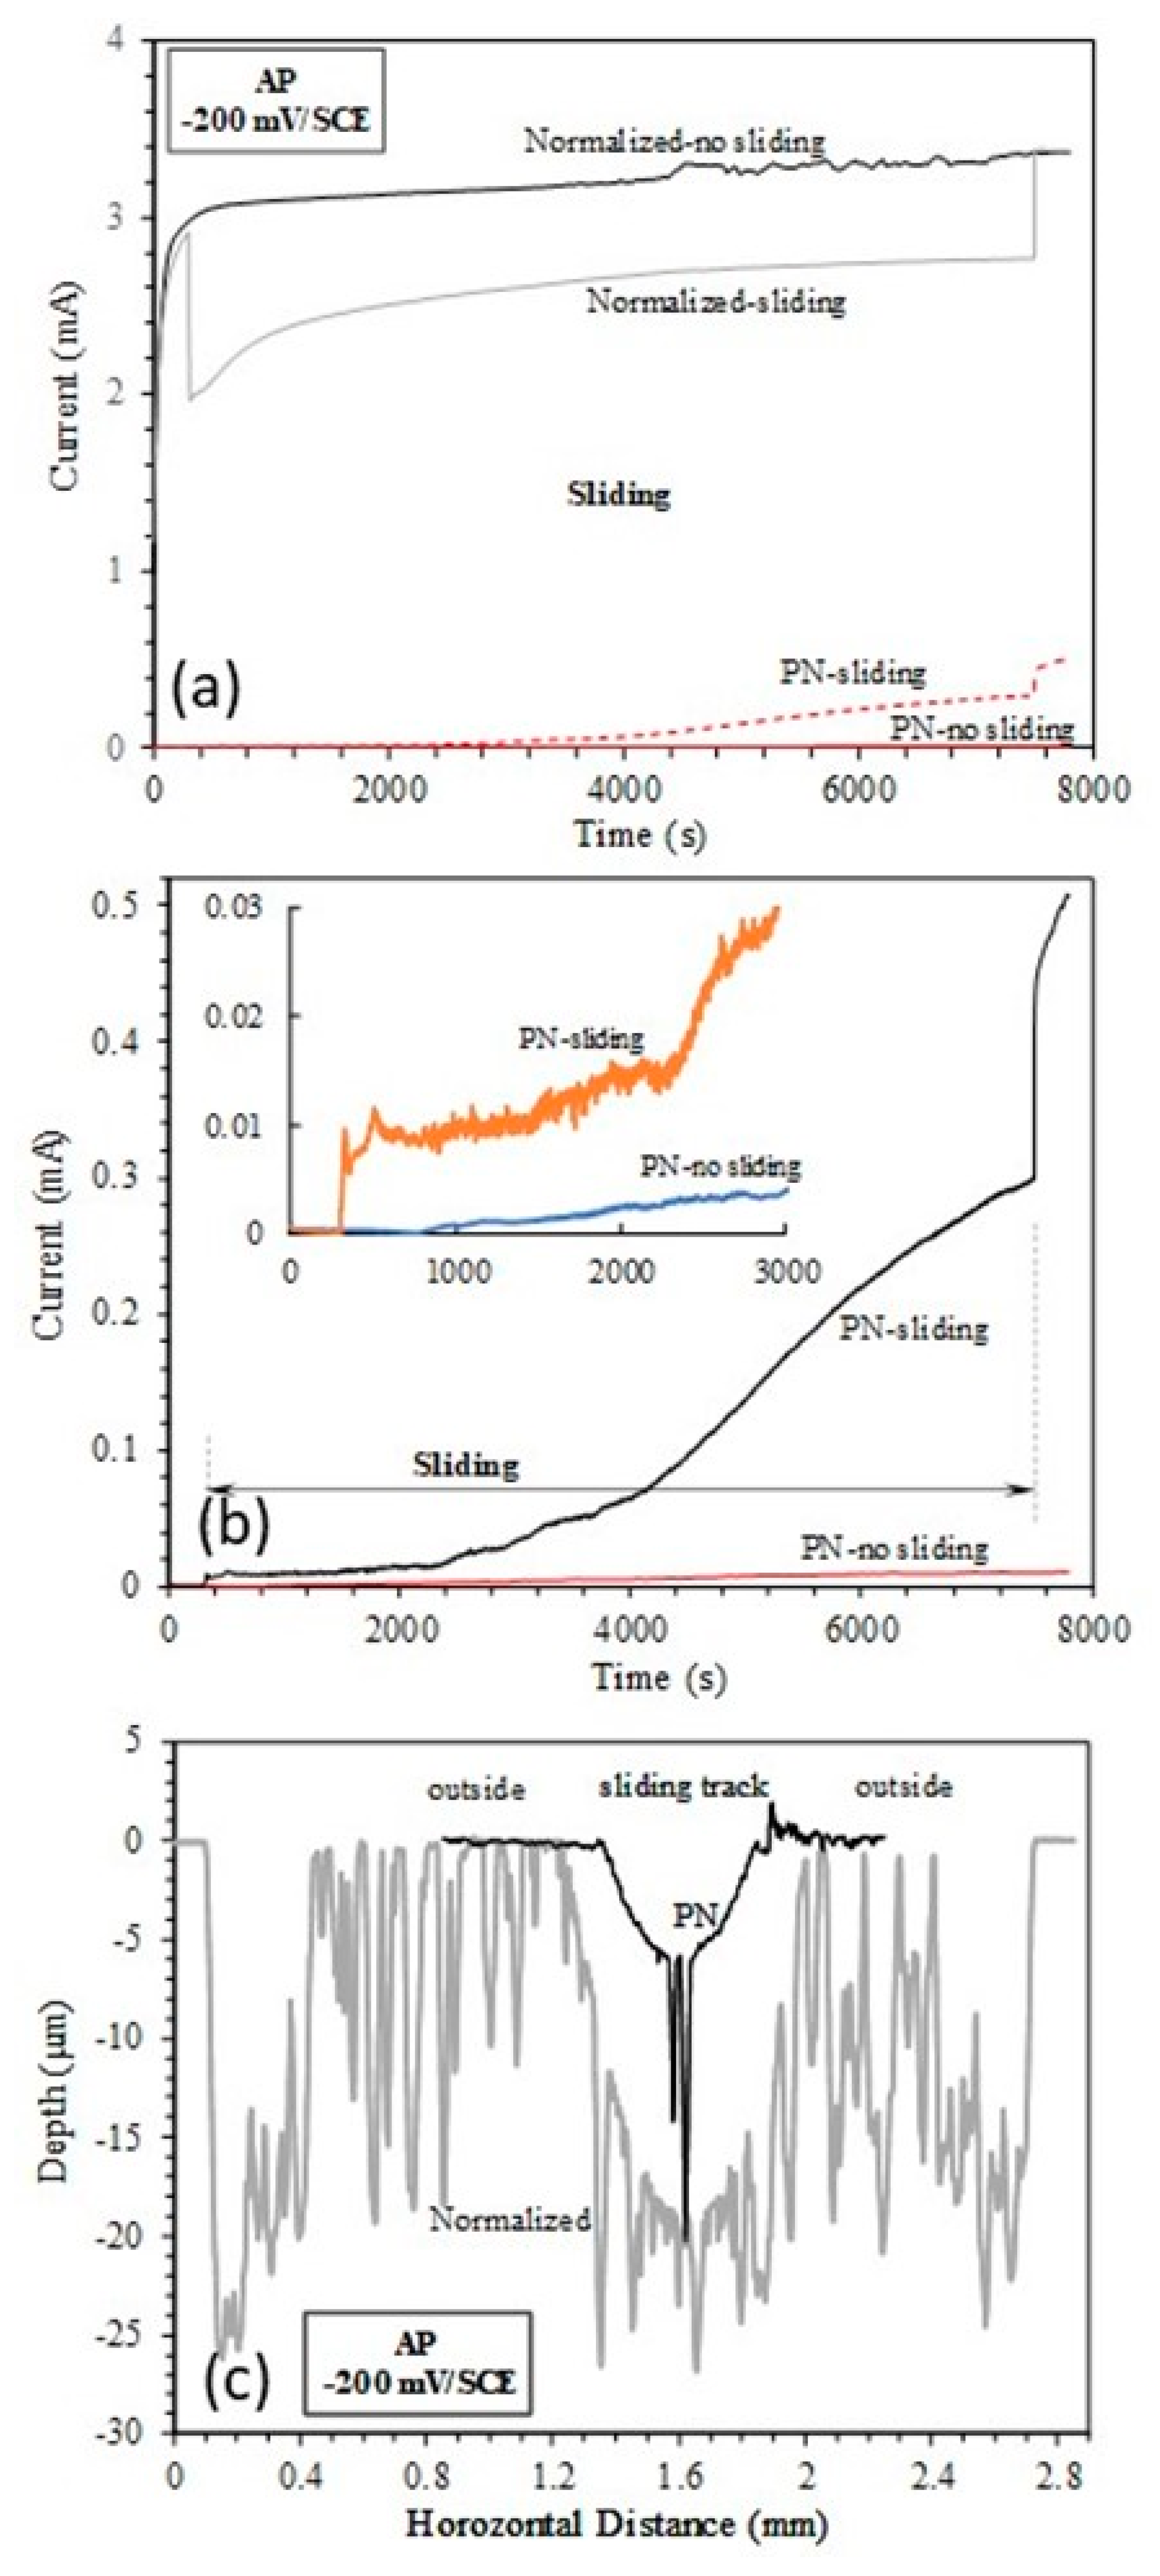
3.4. Anodic Potential Tests

At the anodic potential of −200 mV(SCE), the normalized and PN specimens behaved quite differently (Figure 9a). Under no-sliding conditions, both the normalized and PN specimens registered continuously increasing the currents with polarization time, confirming that the specimens suffered from anodic dissolution and had no ability to passivate at such an anodic potential. However, the current generated from the PN specimen was more than two orders of magnitude smaller than that generated from the normalized specimen (Figure 9a,b), demonstrating that the γ′-Fe4N layer had the ability to reduce metal dissolution and improve corrosion resistance.
Interestingly, sliding led to a decrease in currents from the normalized specimen (Figure 9a), which is different from the observations made on passive metals where sliding leads to an abrupt increase in currents due to the depassivation of the surface by the sliding action [24,25,33]. For the active normalized specimen in this study, removal of the corrosion products from the sliding track by the mechanical action obviously helped to reduce metal dissolution. After the termination of sliding, the current from the normalized specimen increased to the level measured under no-sliding conditions. A microscopic examination revealed that corrosion occurred both inside and outside the sliding track of the normalized specimen (Figure 10). Outside the sliding track, the surface became quite rough with peaks and valleys due to grain detachment arising from the corrosion action (Figure 10b). Inside the sliding track, the peaks were flattened due to the wearing action, but the valleys and some corrosion pits could still be observed (Figure 10a).
On the other hand, sliding led to an abrupt increase in currents from the PN specimen, and the current generated during sliding increased slowly for the first 2000 s, and then increased more quickly between 2000 s and 4000 s sliding, and then further quickly after 4000 s sliding (Figure 9b). Microscopic examination (Figure 11) revealed that in the central region of the sliding track on the PN specimen, the γ′-Fe4N layer was removed, such that pits were formed in this region, which penetrated deep into the substrate (Figure 9c and Figure 11). This explains the quick increase in currents after 2000 s and then 4000 s sliding (Figure 9b).
Surface profile measurements across the sliding tracks showed that TMR from the PN specimen was mainly from the sliding track with limited corrosion loss outside the sliding track (Figure 9c). The wear depth in the central region of the sliding track was more than 5 μm and as deep as 20 μm in the pitting area, suggesting that the γ′-Fe4N layer was worn through in this region, in line with the microscopic examination (Figure 11). On the other hand, for the normalized specimen, TMR came from both inside and outside the sliding track (Figure 9c). Thus, corrosion played a more significant role in TMR from the normalized specimen.

4. Discussion

4.1. Effect of Potential on Tribocorrosion Behavior

From the results presented in Section 3, the 5 μm γ′-Fe4N thick layer was not worn through during the tribocorrosion tests. Thus, the measured corrosion and tribocorrosion behavior of the nitride specimen is characteristic of the γ′-Fe4N layer. It is clear that the γ′-Fe4N layer produced by nitriding on mild steel has the ability to increase surface hardness, reduce metal dissolution rate and improve tribocorrosion resistance in the NaCl-containing solution. The tribocorrosion behavior of the γ′-Fe4N layer is affected by the applied potential, as summarized in Figure 12, which shows the variation of the average coefficient of friction (COF) and TMR with potential.
The COF values vary quite largely between two repeated tests under the same conditions (Figure 12a). However, a general trend can be seen that the average COF for both specimens is the highest at OCP and is lower at cathodic and anodic potentials. This behavior can be explained as follows. At the cathodic potential of −700 mV(SCE), mechanical wear is predominant and there is little contribution of corrosion products to friction. At OCP, both mechanical wear and corrosion are involved and there is synergism between wear and corrosion, which could lead to increased friction because of the trapping of corrosion-wear products at the frictional interface. At the anodic potential of −200 mV(SCE), although corrosion is accelerated, the formation of corrosion pits, particularly at the central region of the sliding track on the PN specimen (Figure 11), could reduce the real contact area and thus could lead to reduced friction. As compared to the normalized specimen, the PN specimen shows lower friction at OCP and −200 mV(SCE), thus the γ′-Fe4N layer is beneficial in reducing friction during tribocorrosion in the NaCl-containing solution.
The variation of TMR with potential is shown in Figure 12b. It can be seen that the TMR of both specimens increases with potential and the TMR of the PN specimen is significantly lower than that of the normalized specimen under all test conditions. As the potential is increased from OCP to −200 mV(SCE), the TMR of the normalized specimen is increased by nearly 17 times, while the TMR of the PN specimen is increased only by 3 times. When comparing the TMR of the two specimens, the TMR of the PN specimen is 37% lower at the cathodic potential, 34% lower at OCP and 87% lower at the anodic potential than the normalized specimen. This demonstrates the beneficial effect of the γ′-Fe4N layer on improving the resistance to mechanical wear, corrosion and the synergism between wear and corrosion of mild steel, as discussed below.

4.2. Contribution of Mechanical Wear, Corrosion and Wear–Corrosion Synergism

Material removal during tribocorrosion is the result of mechanical wear, corrosion and synergism between wear and corrosion [26,27,34,35]. At the cathodic potential, corrosion is limited and mechanical wear is dominant. The results (Figure 5b and Figure 12b) show that the TMR of the PN specimen is 37% smaller than that of the raw specimen. This can be attributed to the high hardness of the γ′-Fe4N layer (Table 1), which provides good resistance to mechanical abrasive wear. At OCP and the anodic potential, both mechanical wear and corrosion are involved and there is synergism between wear and corrosion. According to the synergistic approach for tribocorrosion analysis [23,26], the TMR (T) is the sum of material removal due to mechanical wear (W0), corrosion (C0) and the synergism between wear and corrosion (S):
T = W 0 + C 0 + S
where T can be measured after the tests (e.g., Figure 12b), W0 is the TMR during sliding at the cathodic potential (−700 mV (SCE)) and C0 can be theoretically estimated by using the Faraday’s law [23,26,27]:
V c h e m = I t M n F ρ
where I is corrosion current (A) measured under no-sliding conditions, t (s) is the sliding time, M (g/mol) is the atomic mass of the steel, n is the valence of oxidation, which is 3 to account for FeOOH oxide film on steel, which is the main corrosion product of carbon steel [36,37], F is the Faraday’s constant (96,458 C/mol) and ρ is the density of steel.
Equation (2) can be used to calculate C0 if general corrosion is the predominant form of corrosion. In the present work, at the anodic potential of −200 mV(SCE), significant pitting corrosion occurred inside the sliding track (Figure 10 and Figure 11), particularly in the central region of the sliding track on the PN specimen, thus most of the measured currents (Figure 9a,b) are expected to come from the corrosion pits. In such a case, it is unrealistic to estimate C0 by using Equation (2). However, at OCP, general corrosion was predominant, thus the corrosion parameter data (icorr under no-sliding conditions) shown in Table 3 can be used to estimate C0 for both specimens and then Equation (1) can be used to calculate S. The results are summarized in Table 4.
From Table 4, it can be seen that at OCP, as compared to the normalized specimen, the γ′-Fe4N layer can reduce mechanical wear by 37%, corrosion by 95% and wear–corrosion synergism by 27%. The contribution of corrosion to TMR is smaller than 5% for the normalized specimen and smaller than 1% for the γ′-Fe4N layer. On the other hand, the synergistic effect has a large contribution to TMR for both specimens, accounting for 60.1% of TMR for the normalized specimen and 66.3% of TMR for the PN specimen (refer to the S/T × 100 column in Table 4). Therefore, it can be concluded that the γ′-Fe4N layer has the ability to provide improved resistance to mechanical wear, corrosion and wear–corrosion synergism. It is also noted that the contribution of the synergistic effect of the γ′-Fe4N layer to TMR (66.3%) is larger than that of the normalized specimen (60.1%); to explain this, further analysis is necessary, as follows.
During tribocorrosion, the synergism between wear and corrosion arises from wear-induced corrosion (ΔC) and corrosion-induced wear (ΔW) [23,26]. Thus, the term, S, is the sum of ΔC and ΔW:
S = Δ C + Δ W
where, by using Equation (2), ΔC can be calculated from the measured corrosion current during sliding (subtracted by the corrosion current measured under no-sliding conditions). Using the current density data in Table 3, ΔC is calculated for both specimens and then ΔW is obtained from Equation (3). The results are listed in the last two columns of Table 4. It can be seen that ΔC and ΔW have positive values, suggesting that, at OCP, corrosion is accelerated by wear and wear is accelerated by corrosion in both specimens. For the normalized specimen, the contribution of wear-accelerated corrosion (ΔC) to the synergism is more significant than the contribution of corrosion accelerated-wear (ΔW). On the other hand, for the γ′-Fe4N layer, corrosion accelerated-wear (ΔW) contributes more to the synergism. The ΔW value from the γ′-Fe4N layer is even larger than that from the normalized specimen. This suggests that the corrosion-wear products trapped at the contact interface can serve as third-body particles to cause accelerated wear of the γ′-Fe4N layer, as evidenced by the many wide scratch marks and the existence of corrosion-wear products on the sliding surface shown in Figure 8c,d.
Although it is not possible to quantitatively estimate the relative contribution of various TMR components at the anodic potential by using Equations (1) to (3), judging from the measured currents (Figure 9) and sliding track morphology (Figure 10 and Figure 11), it can be deduced that corrosion and wear–corrosion synergism play increasing roles in TMR from both specimens. For the PN specimen, the local breakdown of the γ′-Fe4N layer can lead to much accelerated corrosion in the form of pitting corrosion, which in turn can lead to accelerated mechanical wear [38]. Thus, like other surface coatings for corrosion and wear protection, there is always an issue concerning the sustainability of the coating system under harsh loading and environmental conditions [39].

5. Conclusions

1.
In the NaCl-containing solution, both the normalized mild steel and γ′-Fe4N layer are in the active state in the anodic region. The γ′-Fe4N layer has the ability to reduce metal dissolution and improve corrosion resistance of mild steel.
2.
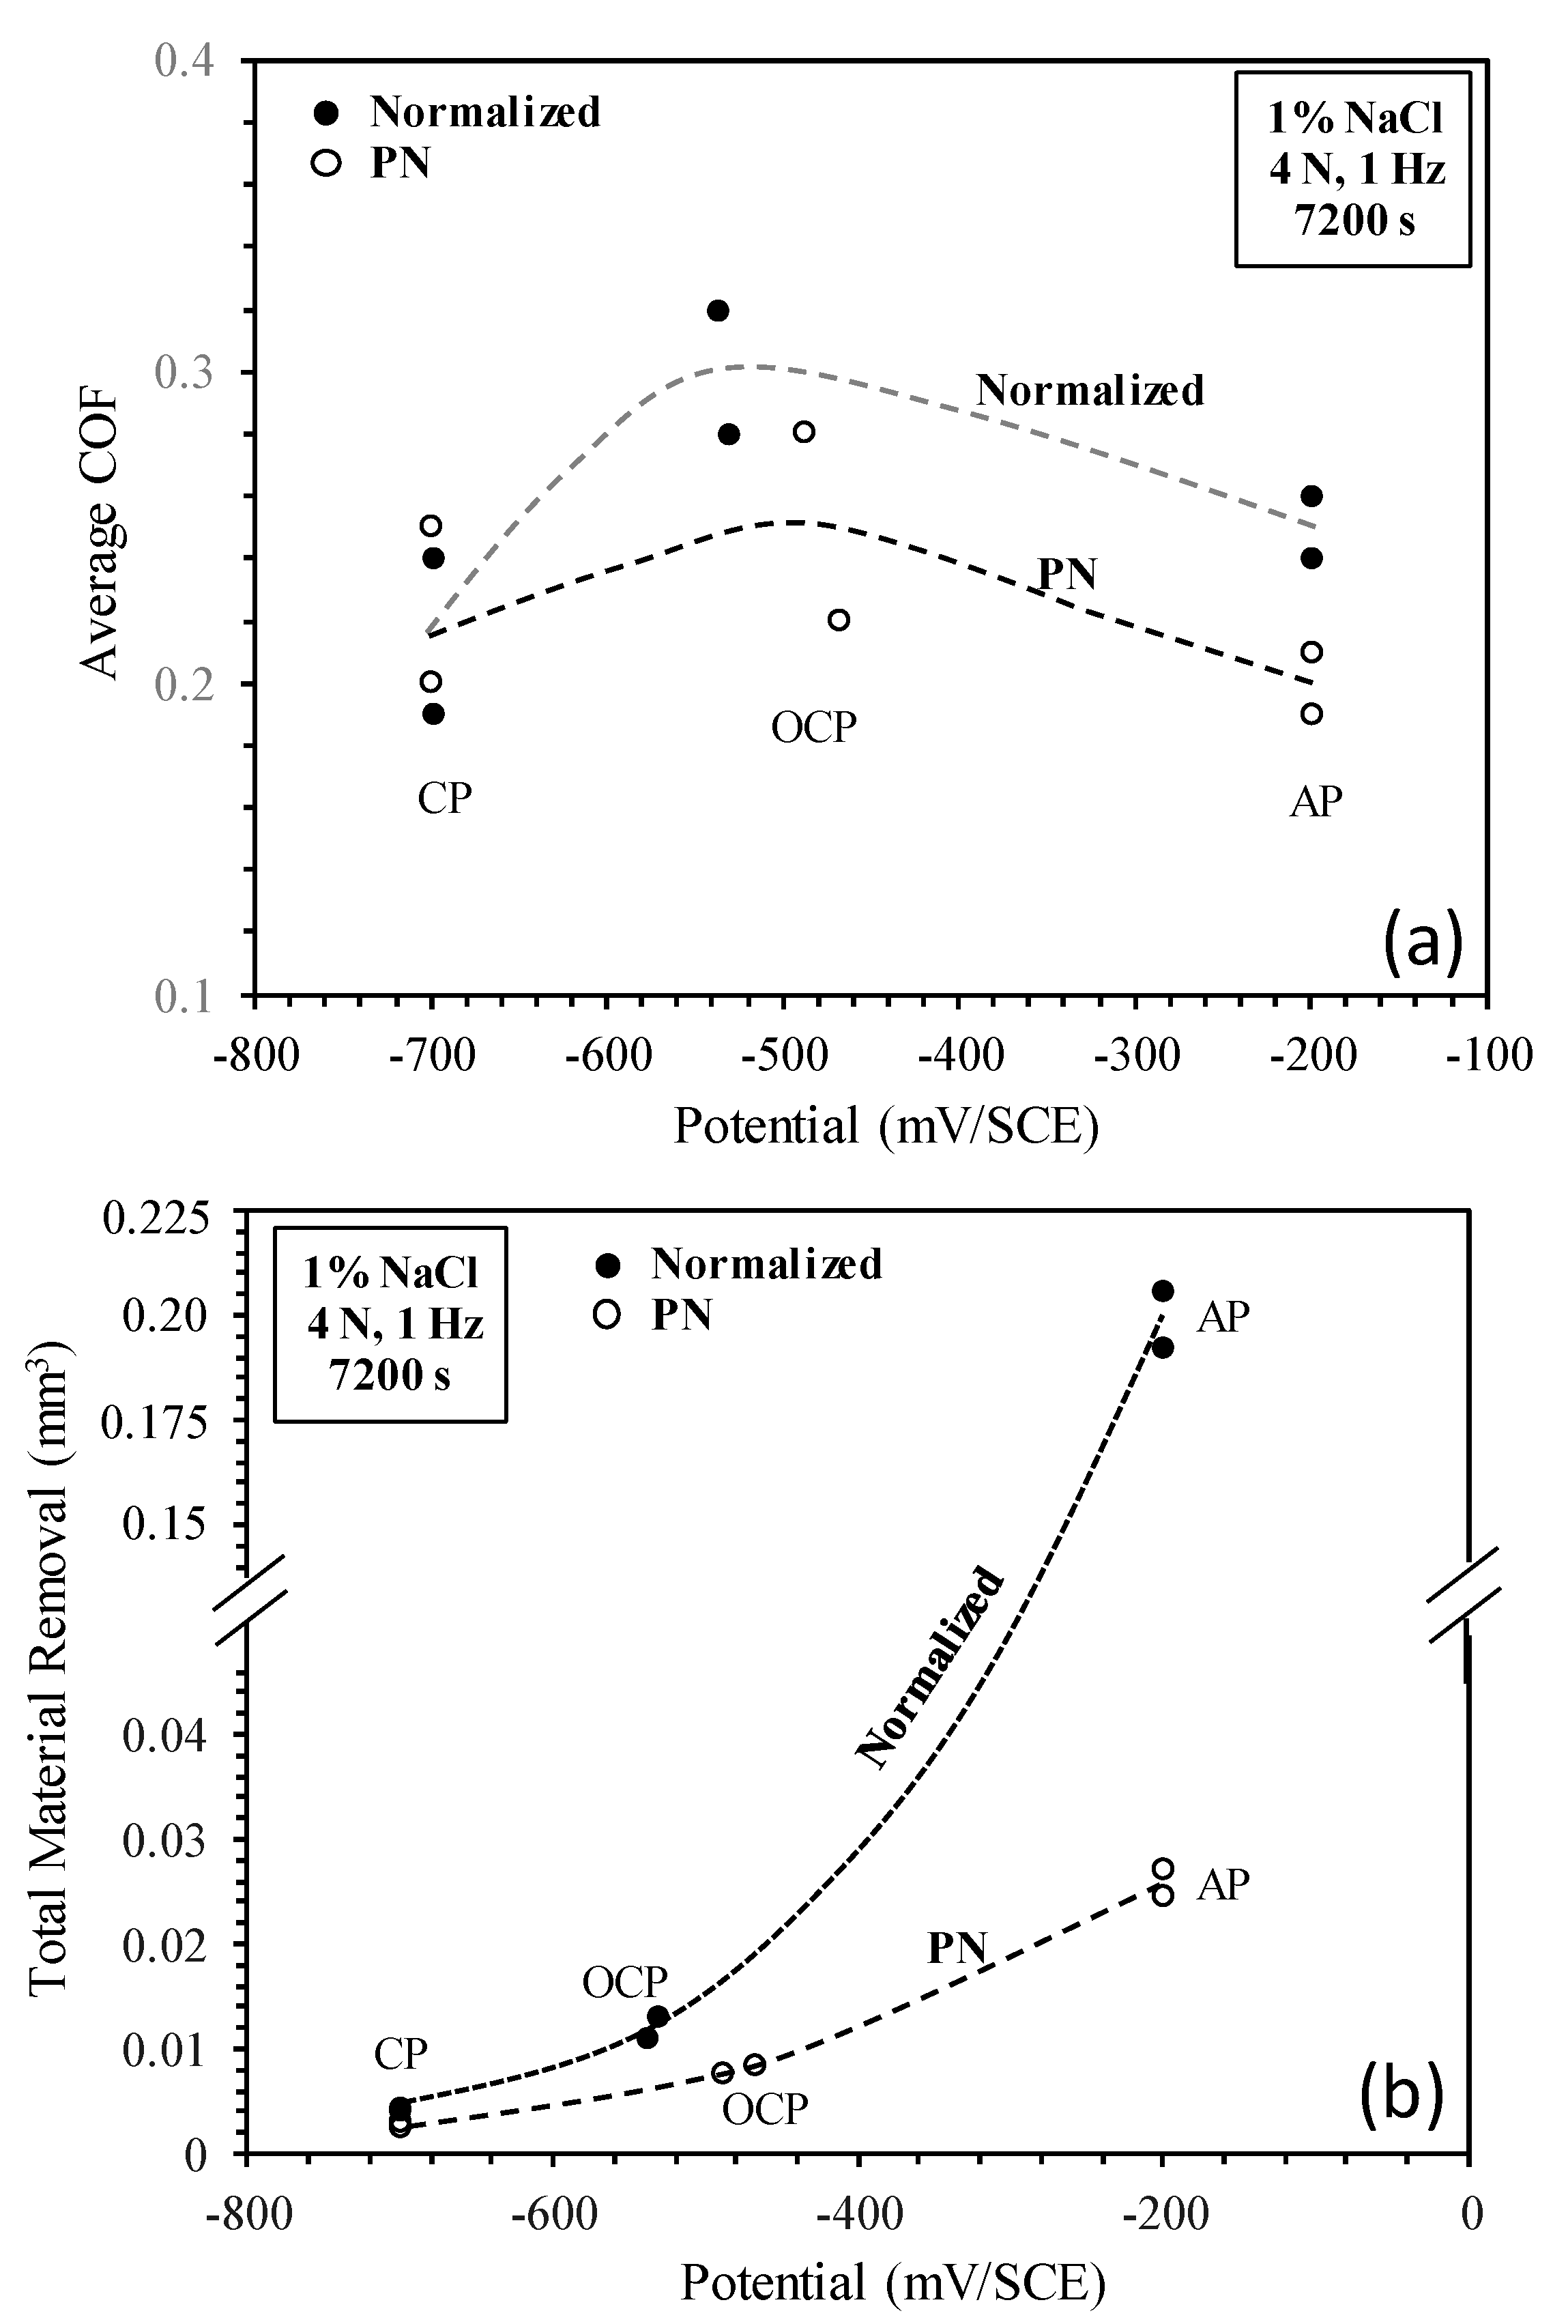
At the cathodic potential, where mechanical wear dominates, the γ′-Fe4N layer can reduce total material removal by 37% due to its higher hardness than that of normalized mild steel.
3.
At open circuit potential, where both mechanical wear and corrosion are involved, the γ′-Fe4N layer has the ability to reduce mechanical wear, corrosion and the synergy between wear and corrosion due to its higher hardness and better resistance to metal dissolution, such that the total material removal is reduced by 34% as compared to that from the normalized mild steel.
4.
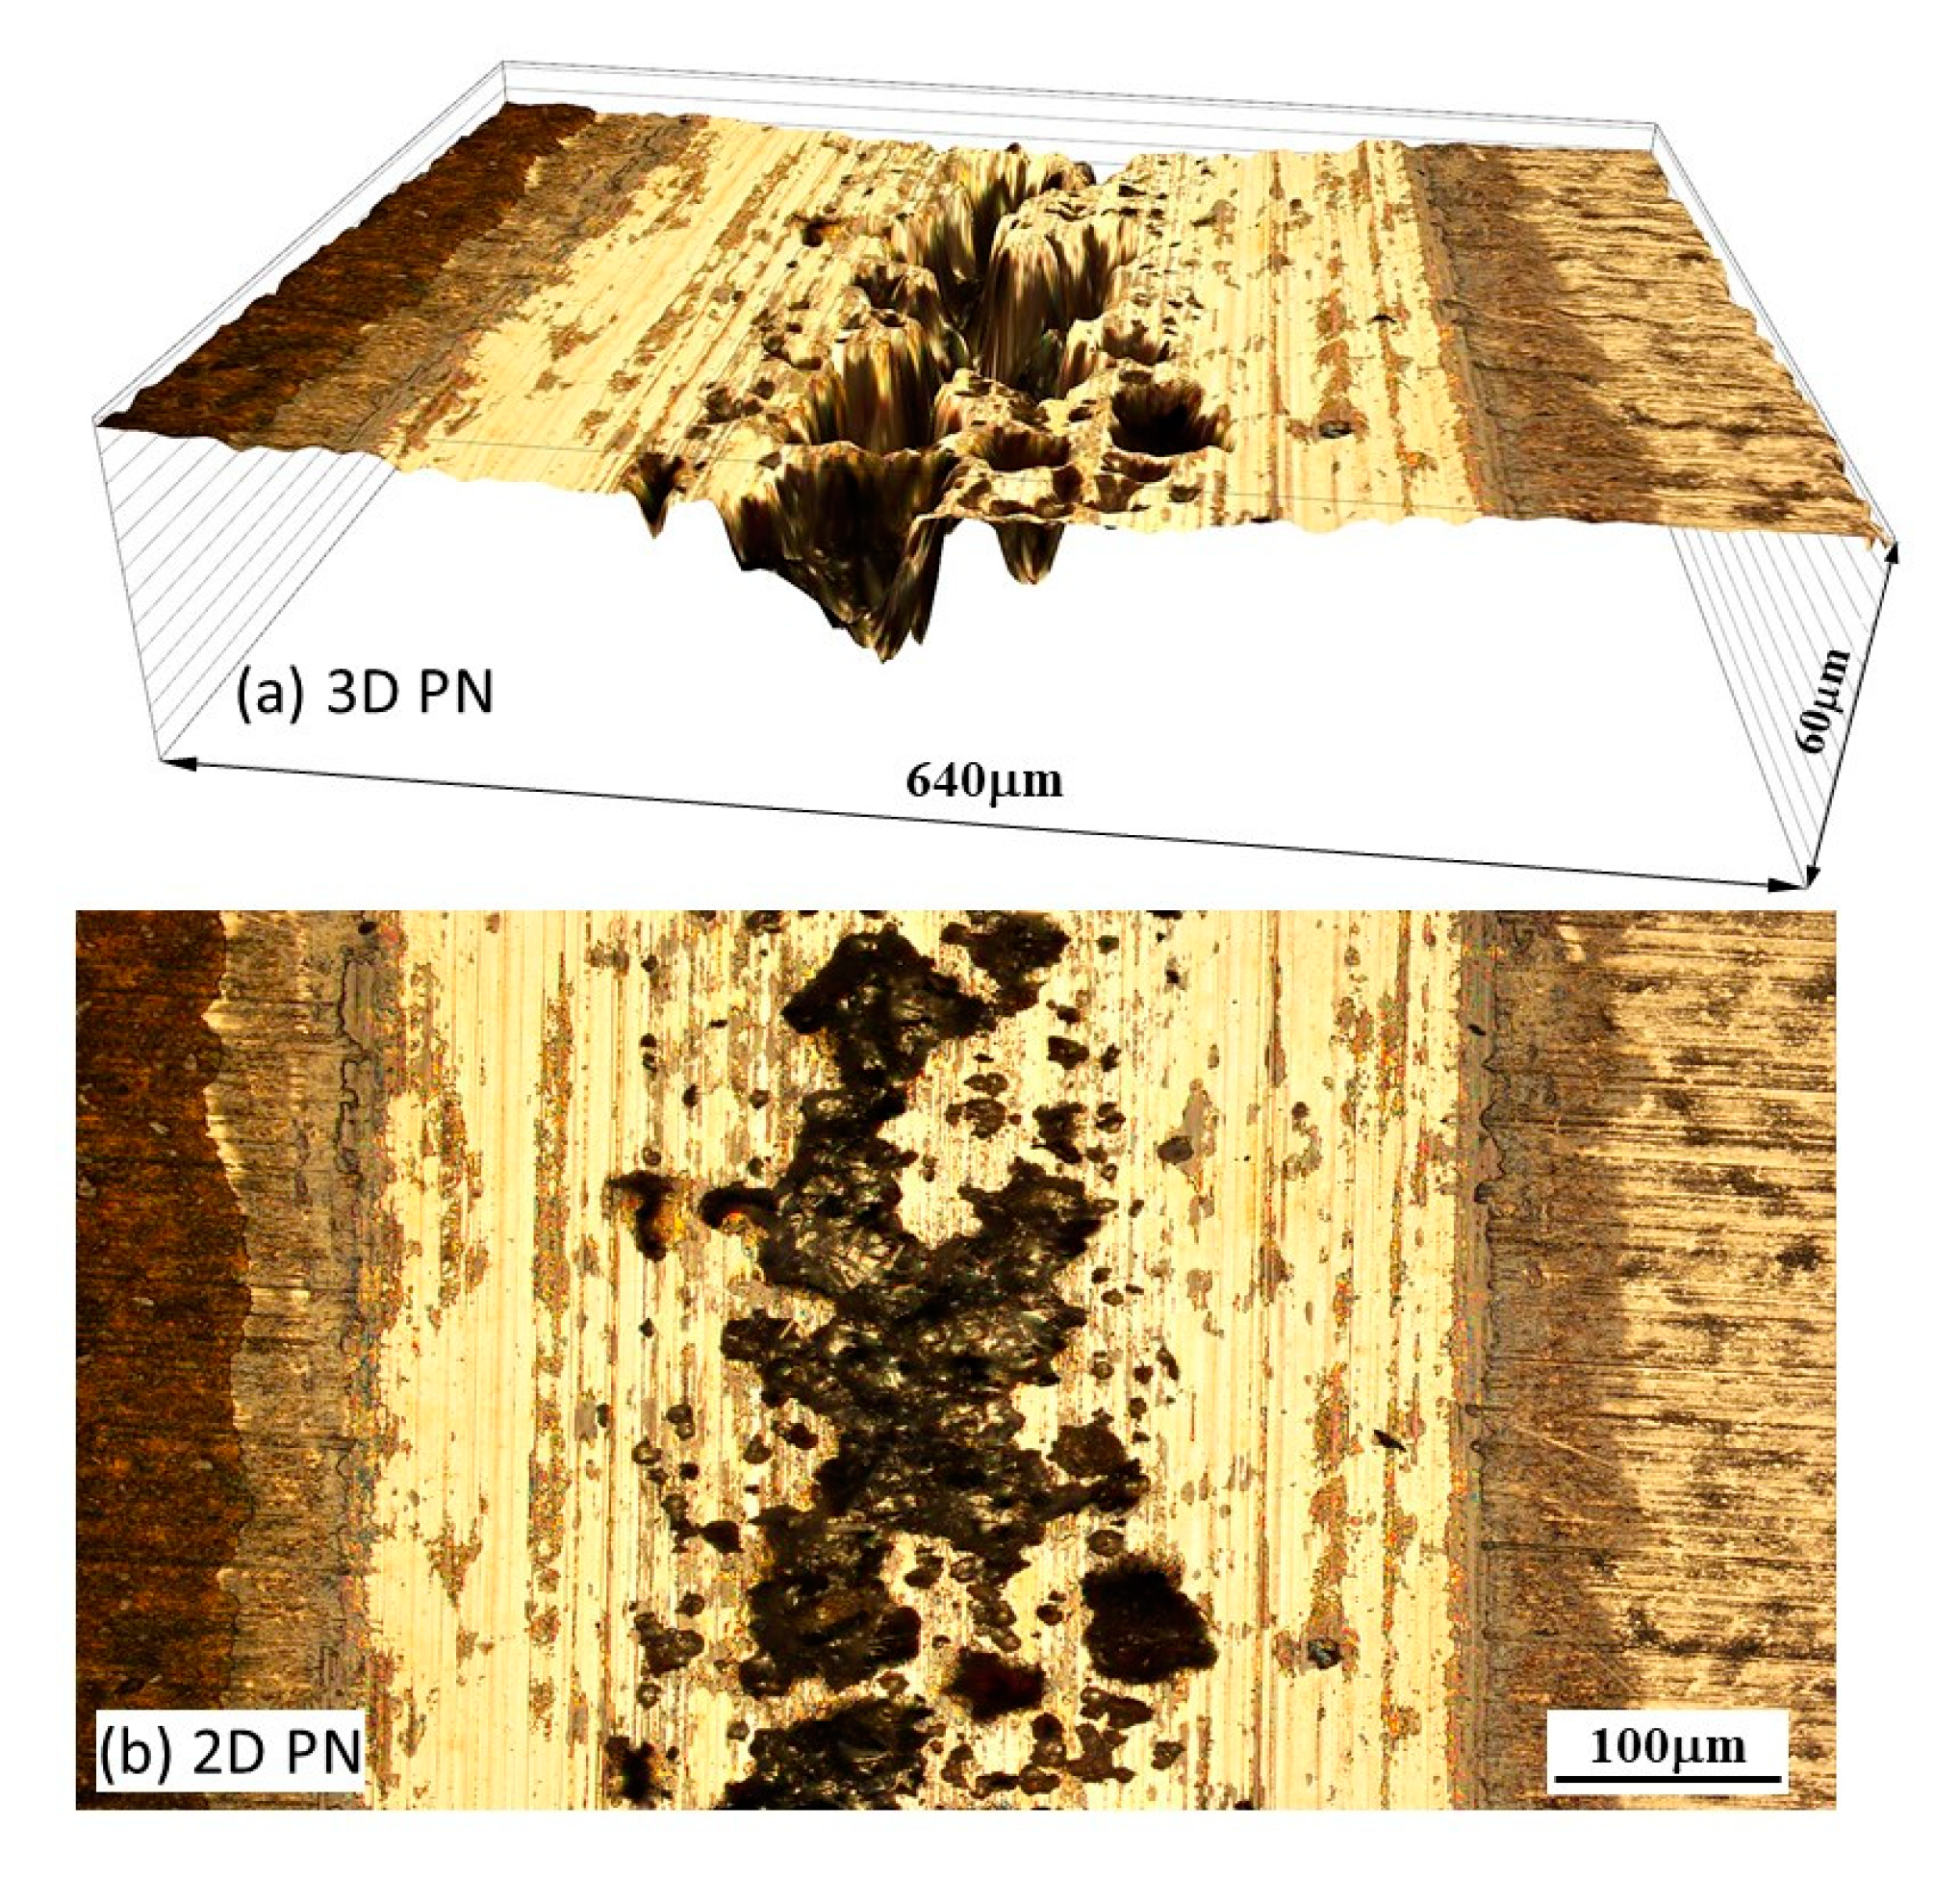
At the anodic potential, where corrosion plays an increasing role, the γ′-Fe4N layer can reduce total material removal by 87%. However, local breakdown of the γ′-Fe4N layer can happen in the sliding track, leading to accelerated pitting corrosion.
5.
The γ′-Fe4N layer has the ability to improve the tribocorrosion behavior of mild steel in the NaCl-containing solution under all test conditions, provided that the layer is not worn through or broken down locally during the tribocorrosion process. However, there is a concern regarding the sustainability of the layer when localized breakdown or wearing-through occurs, which can lead to accelerated pitting and accelerated material removal.

Author Contributions

Methodology, Y.S.; Experimentation, Y.S. and R.B.; Investigation, Y.S. and R.B.; writing—original draft preparation, Y.S.; writing—review and editing, R.B. All authors have read and agreed to the published version of the manuscript.

Funding

This research received no external funding.

Data Availability Statement

The original data of this work is available from the authors upon reasonable request.

Conflicts of Interest

The authors declare no conflict of interest.

References

  1. Staines, A.M.; Bell, T. Technological importance of plasma-induced nitrided and carburized layers on steel. Thin Solid Films 1981, 86, 201–212. [Google Scholar] [CrossRef]
  2. Spies, H.J.; Thien, H.L.; Biermann, H.B. Controlled nitriding. Met. Sci. Heat Treat. 2004, 46, 272–276. [Google Scholar] [CrossRef]
  3. Lightfoot, B.J.; Jack, D.H. Kinetics of nitriding with and without white-layer formation. In Heat Treatment ’73; The Metals Society: Metals Park, OH, USA, 1973; Republished in the Source Book on Nitriding; American Society for Metals: Metals Park, OH, USA, 1977; pp. 248–254. [Google Scholar]
  4. Mittemeijer, E.J.; Somers, A.L. (Eds.) Thermochemical Surface Engineering of Steels; Elsevier Woodhead Publishing: Sawston, Cambridge, 2015. [Google Scholar]
  5. Menthe, E.; Rie, K.T.; Schultze, J.W.; Simson, S. Structure and properties of plasma-nitrided stainless steel. Surf. Coat. Technol. 1995, 74–75, 412–416. [Google Scholar] [CrossRef]
  6. Zhang, L.; Shao, M.; Zhang, Z.; Yi, X.; Yan, J.; Zhou, Z.; Fang, D.; He, Y.; Li, Y. Corrosion behaviour of nitrided layer of Ti6Al4V titanium alloy by hollow cathodic plasma source nitriding. Materials 2023, 16, 2961. [Google Scholar] [CrossRef] [PubMed]
  7. Zhecheva, A.; Malinov, S. Titanium alloys after surface gas nitriding. Surf. Coat. Technol. 2006, 201, 2467–2474. [Google Scholar] [CrossRef]
  8. Buchwalder, A.; Bocker, J.; Hegelmann, E.; Klemm, V. Investigations on the microstructure of an aluminium nitride layer and its interface with the aluminium substrate (Part I). Coatings 2022, 12, 618. [Google Scholar] [CrossRef]
  9. Visuttipitukul, P.; Aizawa, T.; Kuwahara, H. Advanced plasma nitriding for aluminium and aluminium alloys. Mater. Trans. 2003, 44, 2695–2700. [Google Scholar] [CrossRef] [Green Version]
  10. Sun, Y. Kinetics of layer growth during plasma nitriding of nickel based alloy Inconel 600. J. Alloys Compd. 2003, 351, 241–247. [Google Scholar] [CrossRef]
  11. Tao, X.; Kavanagh, J.; Li, X.; Dong, H.; Matthews, A.; Leyland, A. An investigation of precipitation strengthened Inconel 718 superalloy after triode plasma nitriding. Surf. Coat. Technol. 2022, 442, 128401. [Google Scholar] [CrossRef]
  12. Luo, X.; Li, X.; Sun, Y.; Dong, H. Tribocorrosion behaviour of S-phase surface engineered medical grade Co-Cr alloy. Wear 2013, 302, 1615–1623. [Google Scholar] [CrossRef]
  13. Purandare, Y.; Shukla, K.; Sugumaran, A.; Ehiasarian, A.; Khan, I.; Hovsepian, P. Improving tribocorrosion resistance of a medical grade CoCrMo alloy by the novel HIPIMS nitriding technique. J. Sci. Adv. Mater. Devices 2023, 8, 100570. [Google Scholar] [CrossRef]
  14. Spies, H.J. Corrosion behaviour of nitrided, nitrocarburised and carburised steels. In Thermochemical Surface Engineering of Steels; Mittemeijer, E.J., Somers, A.L., Eds.; Elsevier Woodhead Publishing: Sawston, Cambridge, 2015. [Google Scholar]
  15. Mittemeijer, E.J. Nitriding of binary and ternary iron-based alloy. In Thermochemical Surface Engineering of Steels; Mittemeijer, E.J., Somers, A.L., Eds.; Elsevier Woodhead Publishing: Sawston, Cambridge, 2015. [Google Scholar]
  16. Jasinski, J.J.; Kurpaska, L.; Frazek, T.; Lubas, M.; Sitarz, M. Structural characterisation of fine γ′-Fe4N nitrides form by active screen plasma nitriding. Metals 2020, 10, 1656. [Google Scholar] [CrossRef]
  17. Bell, T.; Loh, N.L. The fatigue characteristics of plasma nitrided three Pct Cr-Mo steel. J. Heat Treat. 1982, 2, 232–237. [Google Scholar] [CrossRef]
  18. Kato, H.; Eyre, T.S.; Ralph, B. Wear mechanism map of nitrided steel. Acta Metall. Mater. 1994, 42, 1703–1713. [Google Scholar] [CrossRef]
  19. Bell, T.; Sun, Y. Load bearing capacity of plasma nitrided low alloy steel under combined rolling-sliding contact. Surf. Eng. 1990, 6, 133–139. [Google Scholar] [CrossRef]
  20. Boztepe, E.; Alves, A.C.; Ariza, E.; Rocha, L.A.; Cansever, N.; Toptan, F. A comparative investigation of the corrosion and tribocorrosion behaviour of nitrocarburized, gas nitrided, fluidized-bed nitrided, and plasma nitrided plastic mould steel. Surf. Coat. Technol. 2018, 334, 116–123. [Google Scholar] [CrossRef] [Green Version]
  21. Ram Mohan Rao, K.; Nouveau, C.; Lakshman, S.; Muralidhar, P.; Trinadh, K. Effect of low and high temperature plasma nitriding on electrochemical corrosion of steel. Mater. Today Proc. 2020, 39, 1367–1371. [Google Scholar] [CrossRef]
  22. Valdes, J.; Huape, E.; Oseguern, J.; Ruiz, A.; Ibarrra, J.; Bernal, J.L.; Medina, A. Effects of plasma nitriding in corrosion behaviour of an AISI 4140 steel using a seawater medium solution. Mater. Lett. 2022, 316, 131991. [Google Scholar] [CrossRef]
  23. Watson, S.W.; Friedersdorf, F.J.; Madsen, B.W.; Gramer, S.D. Methods of measuring wear-corrosion synergism. Wear 1995, 181–183, 476–484. [Google Scholar] [CrossRef]
  24. Ponthiaux, P.; Wenger, F.; Drees, D.; Celis, J.P. Electrochemical techniques for studying tribocorrosion processes. Wear 2004, 256, 459–468. [Google Scholar] [CrossRef]
  25. Munoz, A.I.; Espallargas, N.; Mischler, S. (Eds.) Tribocorrosion; Springer: Cham, Switzerland, 2020. [Google Scholar]
  26. Mischler, S. Triboelectrochemical techniques and interpretation methods in triborrosion: A comparative evaluation. Tribol. Int. 2008, 41, 573–583. [Google Scholar] [CrossRef]
  27. Landolt, D.; Mischler, S.; Stemp, M. Electrochim. Electrochemical methods in tribocorrosion: A critical appraisal. Electrochim. Acta 2001, 46, 3913–3929. [Google Scholar] [CrossRef]
  28. Mindivan, F.; Aktas, G.R.; Bayram, A. Influence of plasma nitriding on dry wear, corrosion and tribocorrosion performance of 17-4 precipitation hardening stainless steel. Mater. Werkst. 2022, 53, 963–978. [Google Scholar] [CrossRef]
  29. Li, X.; Dou, W.; Tian, L.; Dong, H. Combating the tribo-corrosion of LDX2404 lean duplex stainless steel by low temperature plasma nitriding. Lubricants 2018, 6, 93. [Google Scholar] [CrossRef] [Green Version]
  30. Hacisalihoglu, I.; Yildiz, F.; Celik, A. Tribocorrosion behavior of plasma nitrided Hardox steels in NaCl solution. Tribol. Int. 2018, 120, 434–445. [Google Scholar] [CrossRef]
  31. Wong-Angel, W.D.; Martinez-Trinidad, J.; Campos-Silva, V.; Hernandez-Hernandez; Silva-Rivera, U.S.; Garcia-Leon, R.A. Wear-corrosion synergy on Din-16MnCr5 steel under nitriding and post-oxidizing treatments. J. Bio-Tribo-Corros. 2021, 7, 83. [Google Scholar] [CrossRef]
  32. Takahashi, T.; Burghaus, J.; Music, D.; Dronskowski, R.; Schneider, J.M. Elastric properties of γ′-Fe4N probed by nanoindentation and ab initio calculation. Acta Mater. 2012, 60, 2054–2060. [Google Scholar] [CrossRef]
  33. Sun, Y.; Bailey, R. Comparison of wear performance of low temperature nitrided and carburized 316L stainless steel under dry sliding and corrosive-wear condition. J. Mater. Eng. Perform. 2022, 32, 1238–1247. [Google Scholar] [CrossRef]
  34. Casar, J.; Malia, B.; Mazzonello, A.; Karl, A.; Buhagiar, J. Improved tribocorrosion resistance of a CoCrMo implant material by carburising. Lubricants 2018, 6, 76. [Google Scholar] [CrossRef] [Green Version]
  35. Rasool, G.; Shafei, Y.E.; Stack, M.M. Mapping tribo-corrosion behaviour of Ti-6Al-4V Eli in laboratory simulated hip joint environments. Lubricants 2020, 8, 69. [Google Scholar] [CrossRef]
  36. Antunes, R.A.; Ichikawa, R.U.; Martinez, L.G.; Costa, I. Characterisation of corrosion products on carbon steel exposed to natural weathering and to accelerated corrosion tests. Int. J. Corros. 2014, 2014, 419570. [Google Scholar] [CrossRef] [Green Version]
  37. Fonna, S.; Ibrahim, I.B.M.; Gunawarman; Huzni, S.; Lksan, M.; Thalib, S. Investigation of corrosion products formed on the surface of carbon steel exposed in Banda Aceh’s atmosphere. Heliyon 2021, 7, e06608. [Google Scholar] [CrossRef]
  38. Jiang, J.; Stack, M.M.; Neville, A. Modelling the tribo-corrosion interaction in aqueous sliding conditions. Tribol. Int. 2002, 35, 669–679. [Google Scholar] [CrossRef]
  39. Sun, Y.; Dearnley, P.A.; Bertram, M. Response of duplex Cr(N)/S and Cr(C)/S coatings on 316L stainless steel to tribocorrosion in 0.89% NaCl solution under plastic contact conditions. J. Biomed. Mater. Res. Part B 2017, 105, 1503–1513. [Google Scholar] [CrossRef] [PubMed] [Green Version]
Figure 1. Microscopic images of the nitrided mild steel specimen showing (a) the overall view of the cross section from the surface to the substrate and (b) details of the 5 μm thick Fe4N compound layer at the surface and the underneath diffusion zone with needle-like precipitates.
Lubricants 11 00281 g001
Figure 2. X-ray diffraction pattern generated from the nitrided specimen, showing that the compound layer was composed of γ′-Fe4N phase (Cu Kα radiation).
Lubricants 11 00281 g002
Figure 3. (a) Anodic polarization curves measured without sliding and during sliding and (b) surface profiles measured across the sliding tracks produced during anodic polarization.
Lubricants 11 00281 g003
Figure 4. Microscopic images showing the test surfaces after potentiodynamic polarization tests without sliding and during sliding: (a) Normalized MS without sliding; (b) PN MS without sliding; (c) Normalized MS with sliding; (d) PN MS with sliding; (e) 3D view of corrosion pits in (d); (f) surface profile measured across a pit shown by the dashed line in (e).
Lubricants 11 00281 g004
Figure 5. (a) Current variation with time measured without sliding and during sliding at the cathodic potential of −700 mV(SCE) and (b) surface profiles measured across the sliding tracks produced by sliding at −700 mV(SCE).
Lubricants 11 00281 g005
Figure 6. Microscopic images and EDX mapping of the sliding tracks produced at the cathodic potential of −700 mV(SCE) on the (a) normalized MS and (b) PN MS specimens.
Lubricants 11 00281 g006
Figure 7. (a) Open circuit potential (OCP) variation with time measured without sliding and during sliding at OCP and (b) surface profiles measured across the sliding tracks produced by sliding at OCP.
Lubricants 11 00281 g007
Figure 8. Microscopic images showing 3D (a,c) and 2D (b,d) views of the sliding tracks produced at OCP on the normalized MS (a,b) and PN MS (c,d) specimens. The inset in (b) shows the surface profile measured across the pit indicated by the dashed line.
Lubricants 11 00281 g008
Figure 9. (a) Current variation with time measured without sliding and during sliding at the anodic potential of −200 mV(SCE); (b) Zoom-in view of current variation of the nitrided specimen during sliding at −200 mV(SCE); (c) Surface profiles measured across the sliding tracks produced by sliding at −200 mV(SCE).
Lubricants 11 00281 g009
Figure 10. Microscopic images showing (a) the worn surface inside the sliding track and (b) the corroded surface outside the sliding track, produced at the anodic potential of −200 mV(SCE) on the normalized MS.
Lubricants 11 00281 g010
Figure 11. Microscopic images showing (a) 3D and (b) 2D views of the sliding track, produced at the anodic potential of −200 mV(SCE) on the PN MS.
Lubricants 11 00281 g011
Figure 12. (a) Average coefficient of friction (COF) and (b) total material removal during sliding at cathodic (CP), open circuit (OCP) and anodic (AP) potentials.
Lubricants 11 00281 g012
Table 1. Summary of structure and surface hardness of the test specimens.
SpecimenStructureSurface Hardness
Surface LayerDiffusion ZoneHV0.025HV0.05HV0.1HV0.2
PN MSγ′-Fe4N
5 μm thick
γ′-Fe4N needles
in α + P matrix
760 ±   17 540 ±   14 370 ±   9 292 ±   7
Raw MSα + Pα + P266 ±   15 258 ±   13 248 ±   9 245 ±   7
Note: α—ferrite; P—pearlite.
Table 2. Summary of corrosion and tribocorrosion conditions.
CorrosionTribocorrosion
Potentiodynamic       200 mV to 800 mV, 1 mV/s
No sliding
              200 mV to 800 mV, 1 mV/s
Sliding at 4 N and 1 Hz
Potentiostatic       700 mV(SCE) no sliding
OCP no sliding
      200 mV(SCE) no sliding
            700 mV(SCE) sliding at 4 N and 1 Hz
OCP sliding at 4 N and 1 Hz
          200 mV(SCE) sliding at 4 N and 1 Hz
Table 3. Corrosion potential (Ecorr), corrosion current density (icorr) and corrosion rate derived from the polarization curves in Figure 3a.
Ecorr (mV/SCE)icorr (mA/cm2)
SpecimenNo SlidingSlidingNo SlidingSliding
Raw MS−335−4904.28 × 10−34.95 × 10⁻²
PN MS−241−4182.05 × 10−41.91 × 10⁻²
Table 4. Summary of T, W0, C0, ΔC and ΔW at OCP.
SpecimenT (mm3)W0 (mm3)C0 (mm3)S (mm3) S / T × 100 DC (mm3)DW (mm3)
Normalized 1.21 × 10 2 4.26 × 10 3 5.03 × 10 4 7.28 × 10 3 60.1 5.31 × 10 3 1.97 × 10 3
PN 7.98 × 10 3 2.67 × 10 3 2.39 × 10 5 5.29 × 10 3 66.3 2.20 × 10 3 3.09 × 10 3
Disclaimer/Publisher’s Note: The statements, opinions and data contained in all publications are solely those of the individual author(s) and contributor(s) and not of MDPI and/or the editor(s). MDPI and/or the editor(s) disclaim responsibility for any injury to people or property resulting from any ideas, methods, instructions or products referred to in the content.

