Effect of Ferromagnetic Metal Base on Friction and Wear of 3D-Printed Aluminum Alloy Surface under Magnetorheological Fluid Action


Abstract
:1. Introduction
2. Preparation
2.1. Magnetorheological Fluid
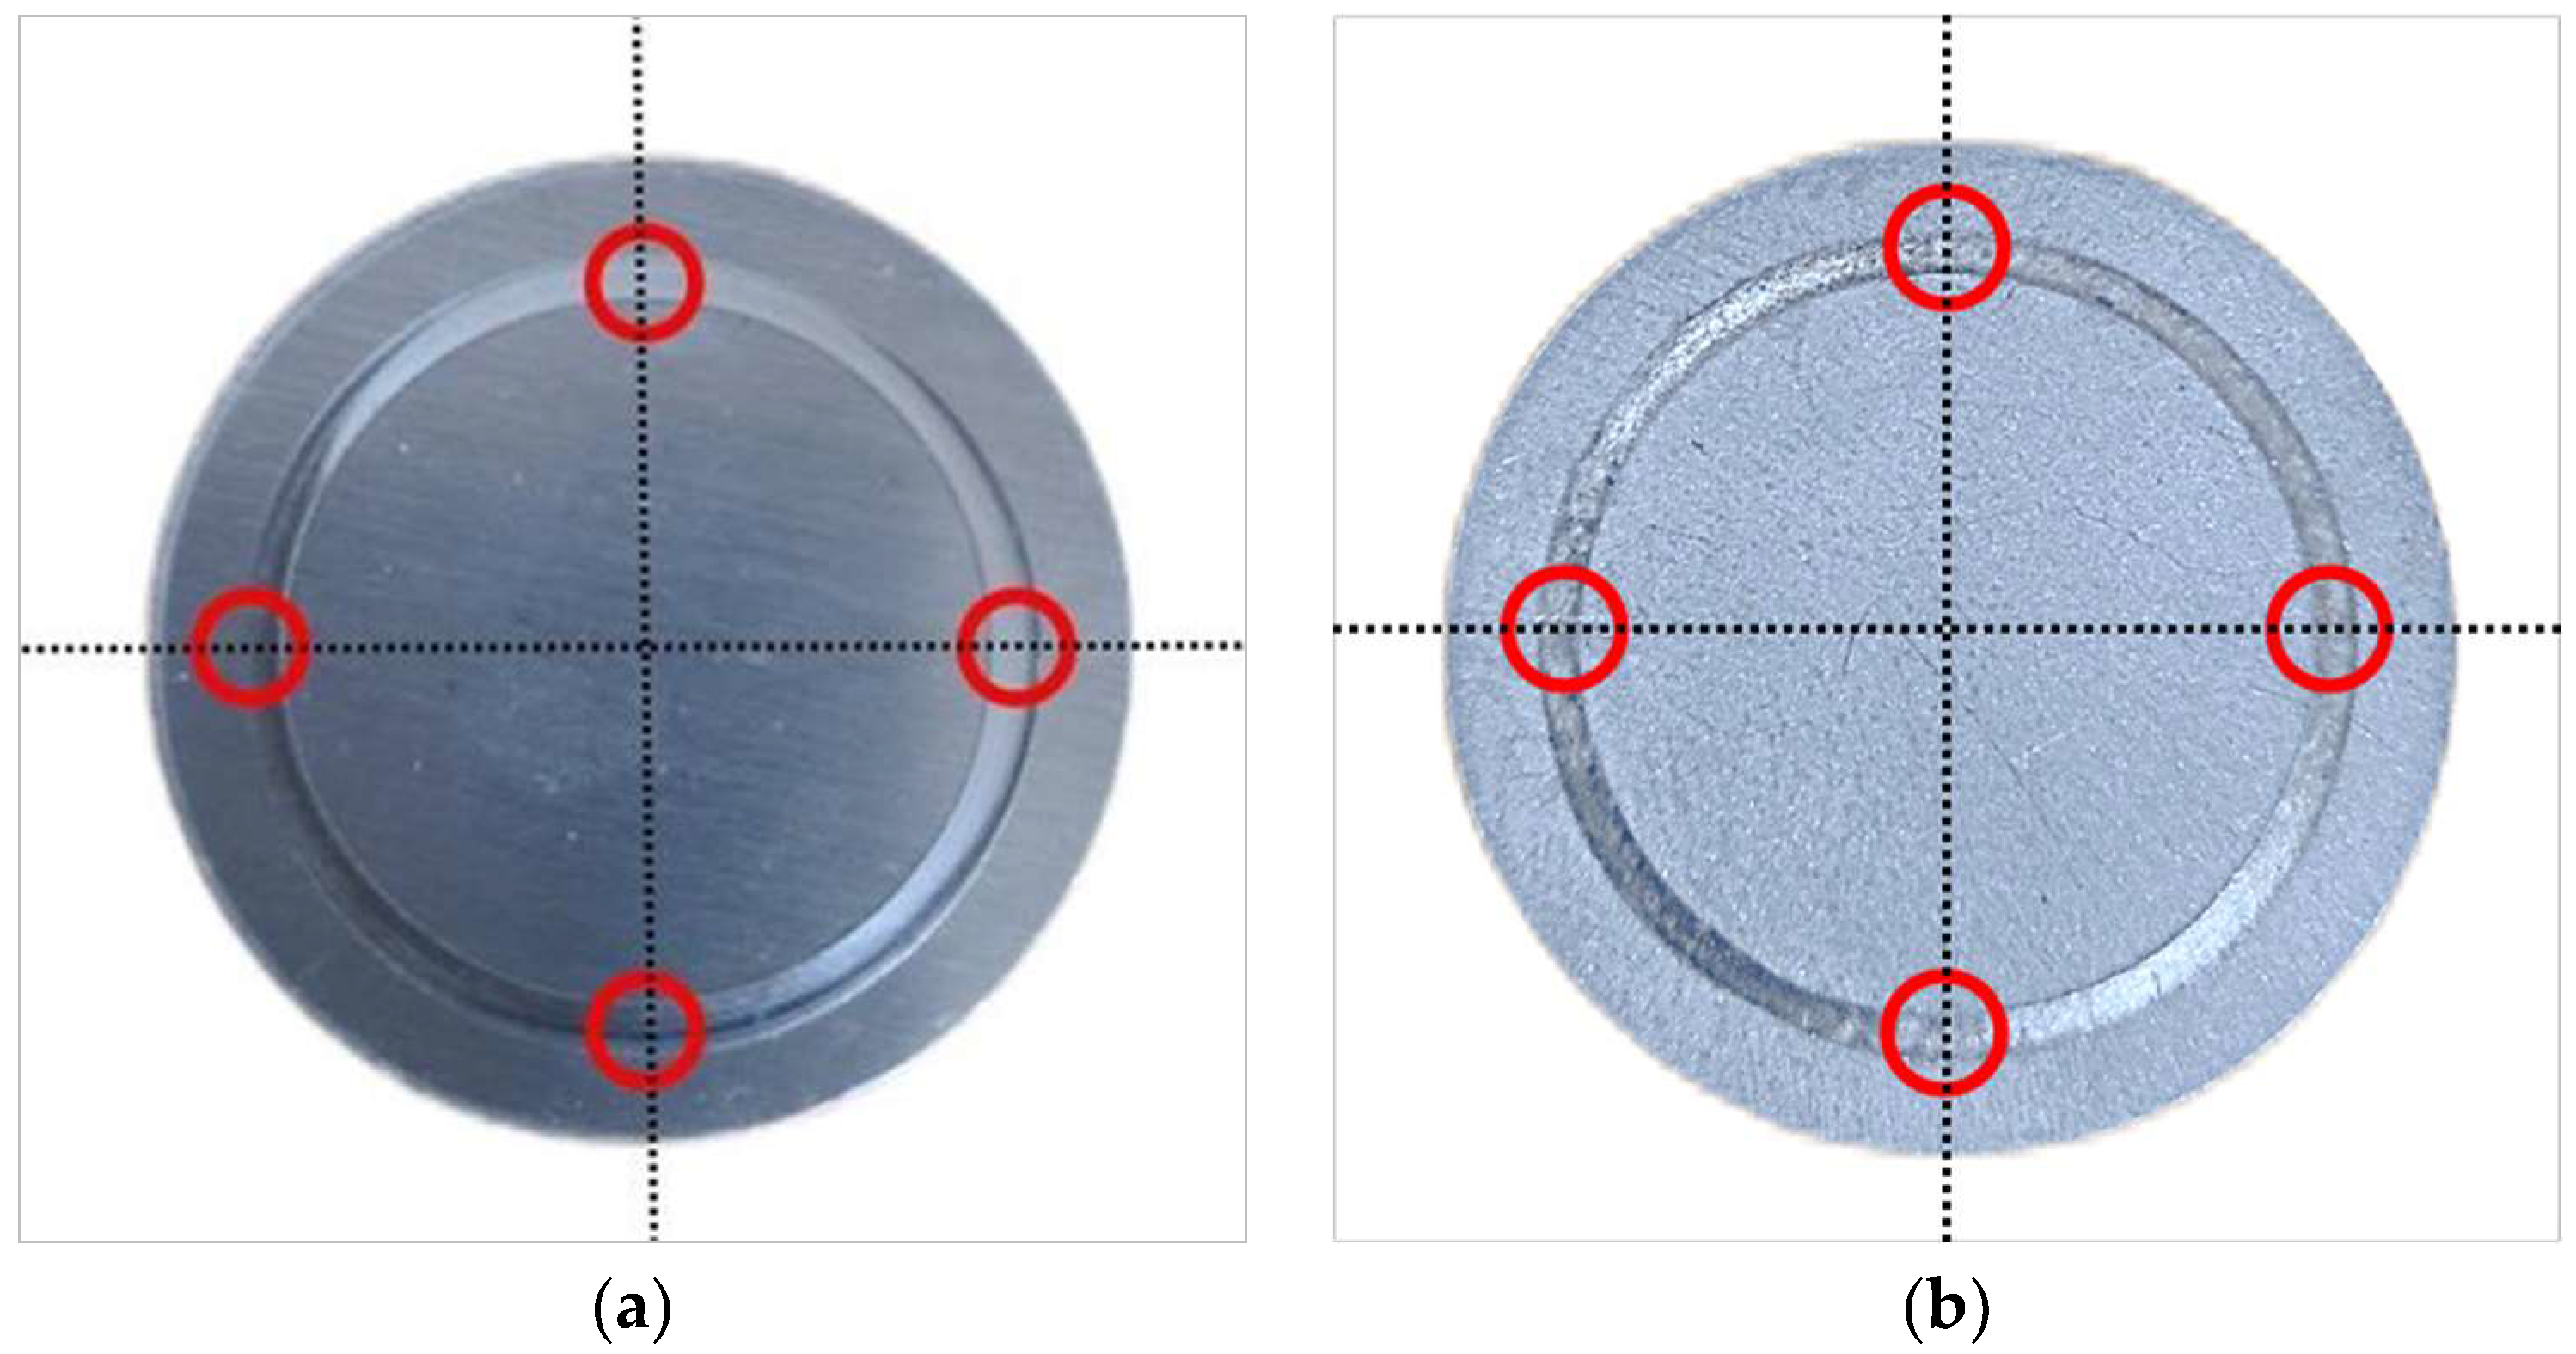
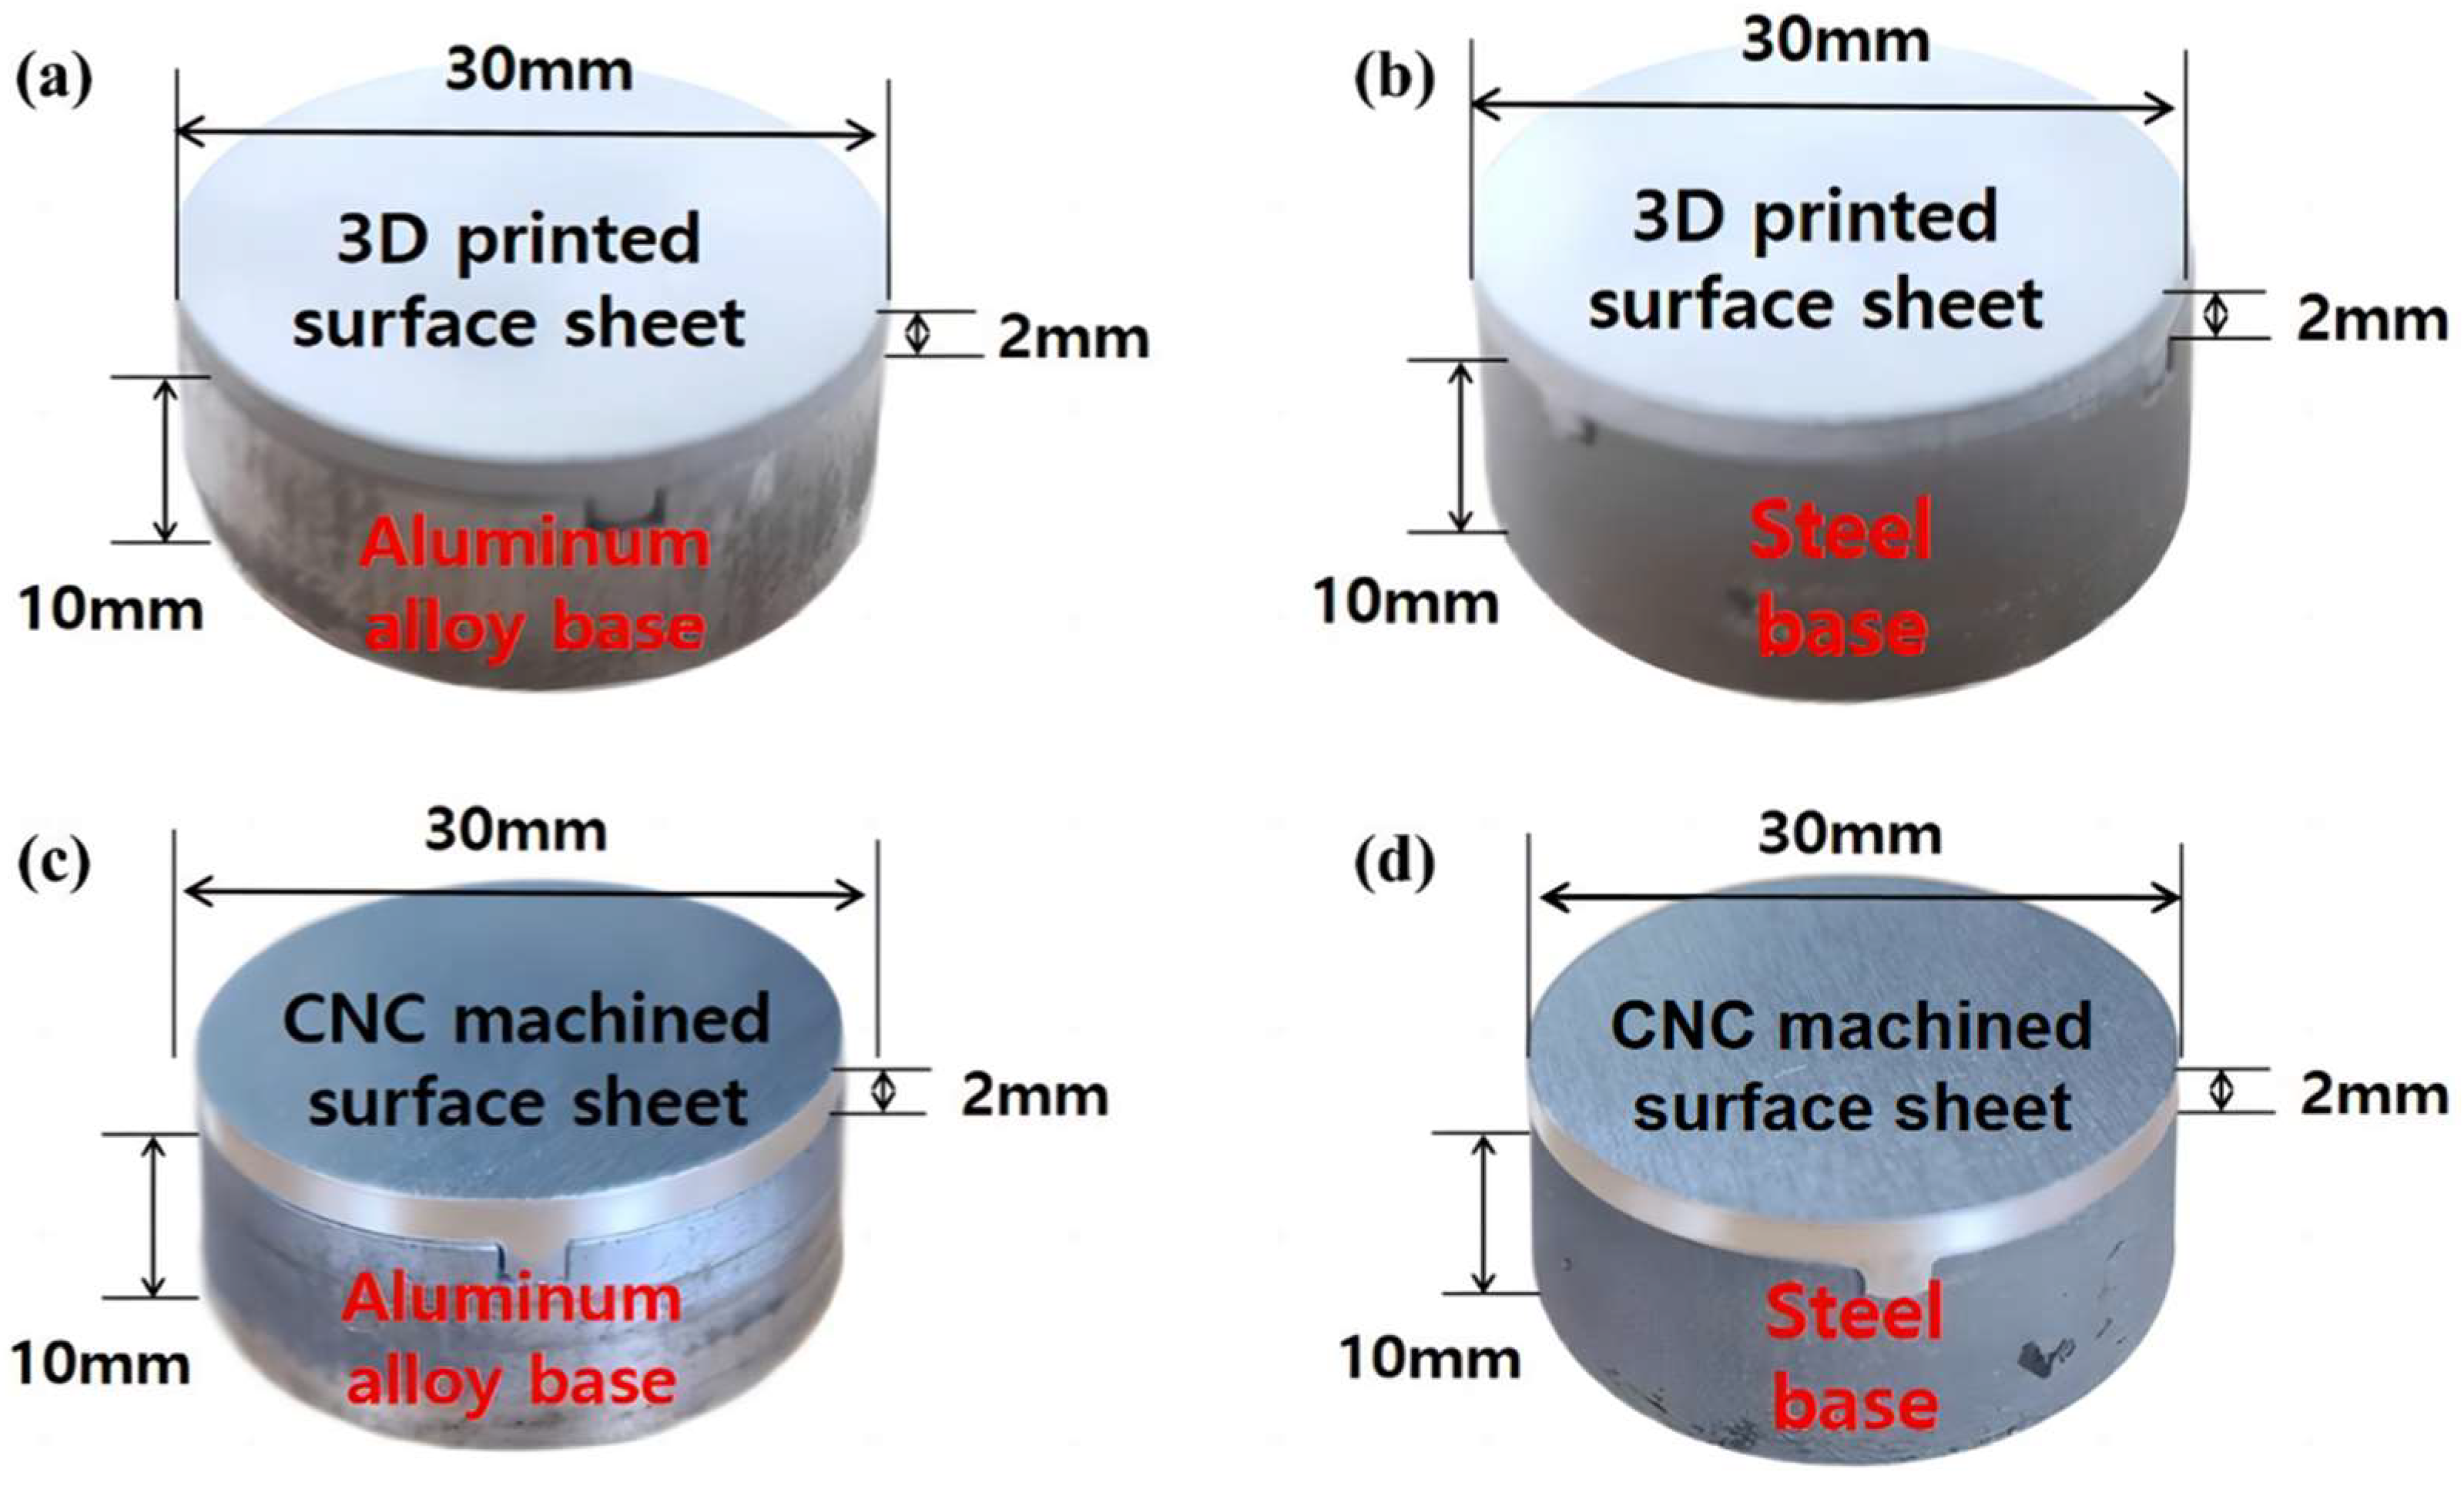
2.2. Sample Preparation
3. Experiment
3.1. Friction and Wear Test
3.2. Surface Analysis
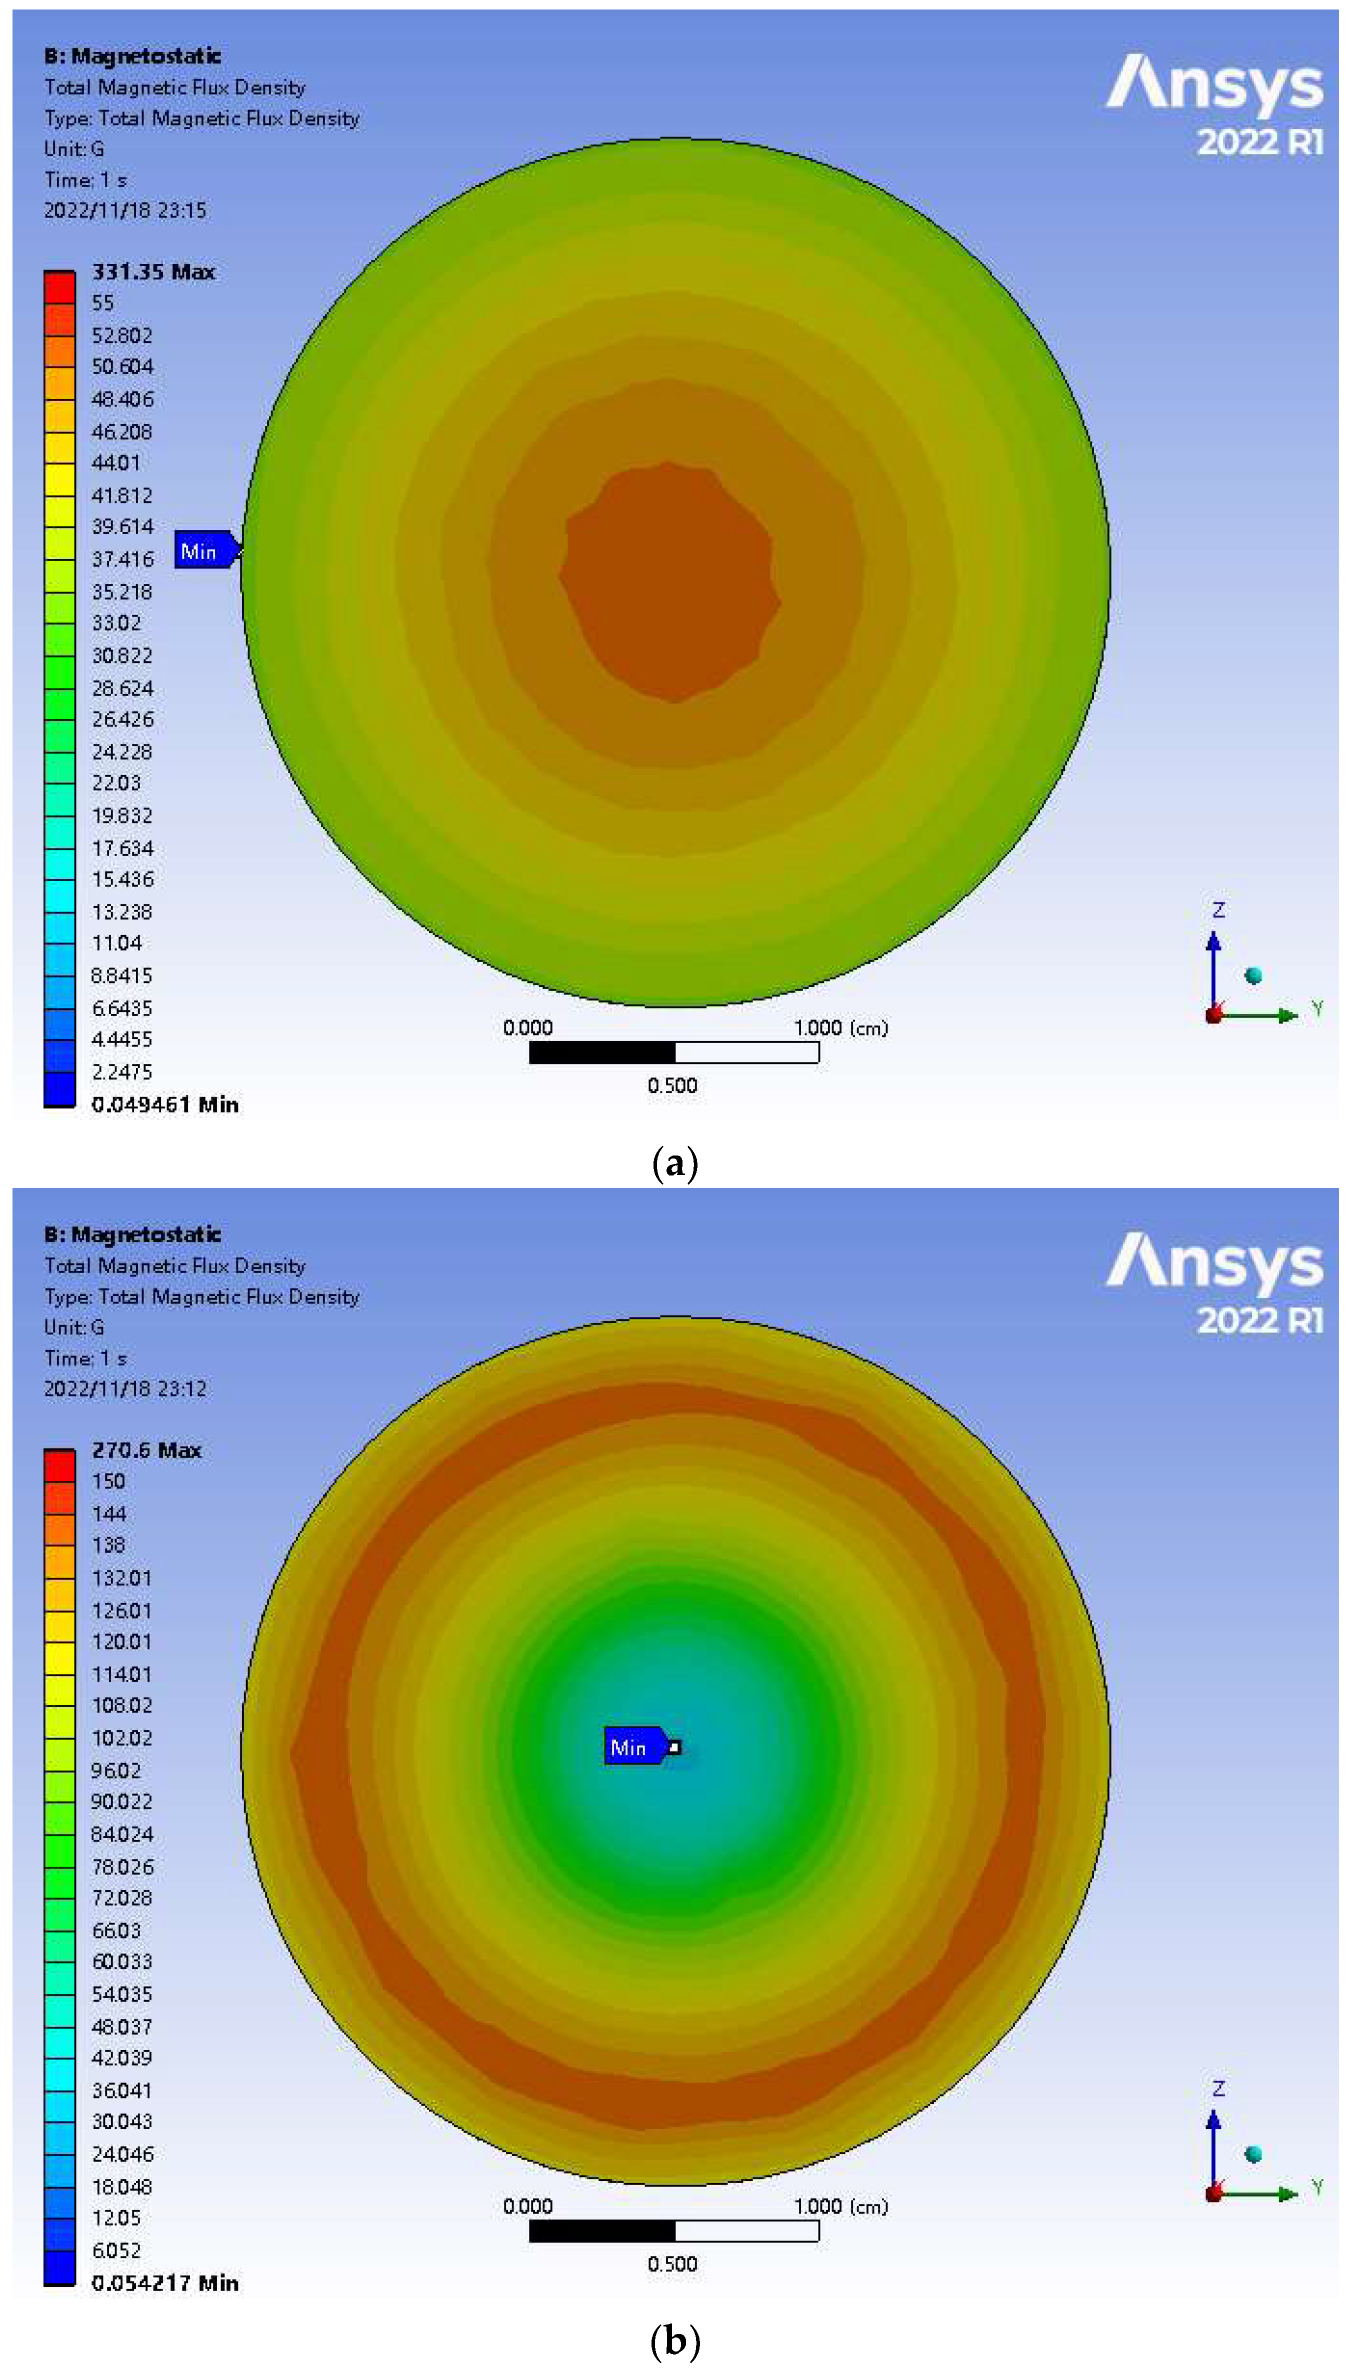
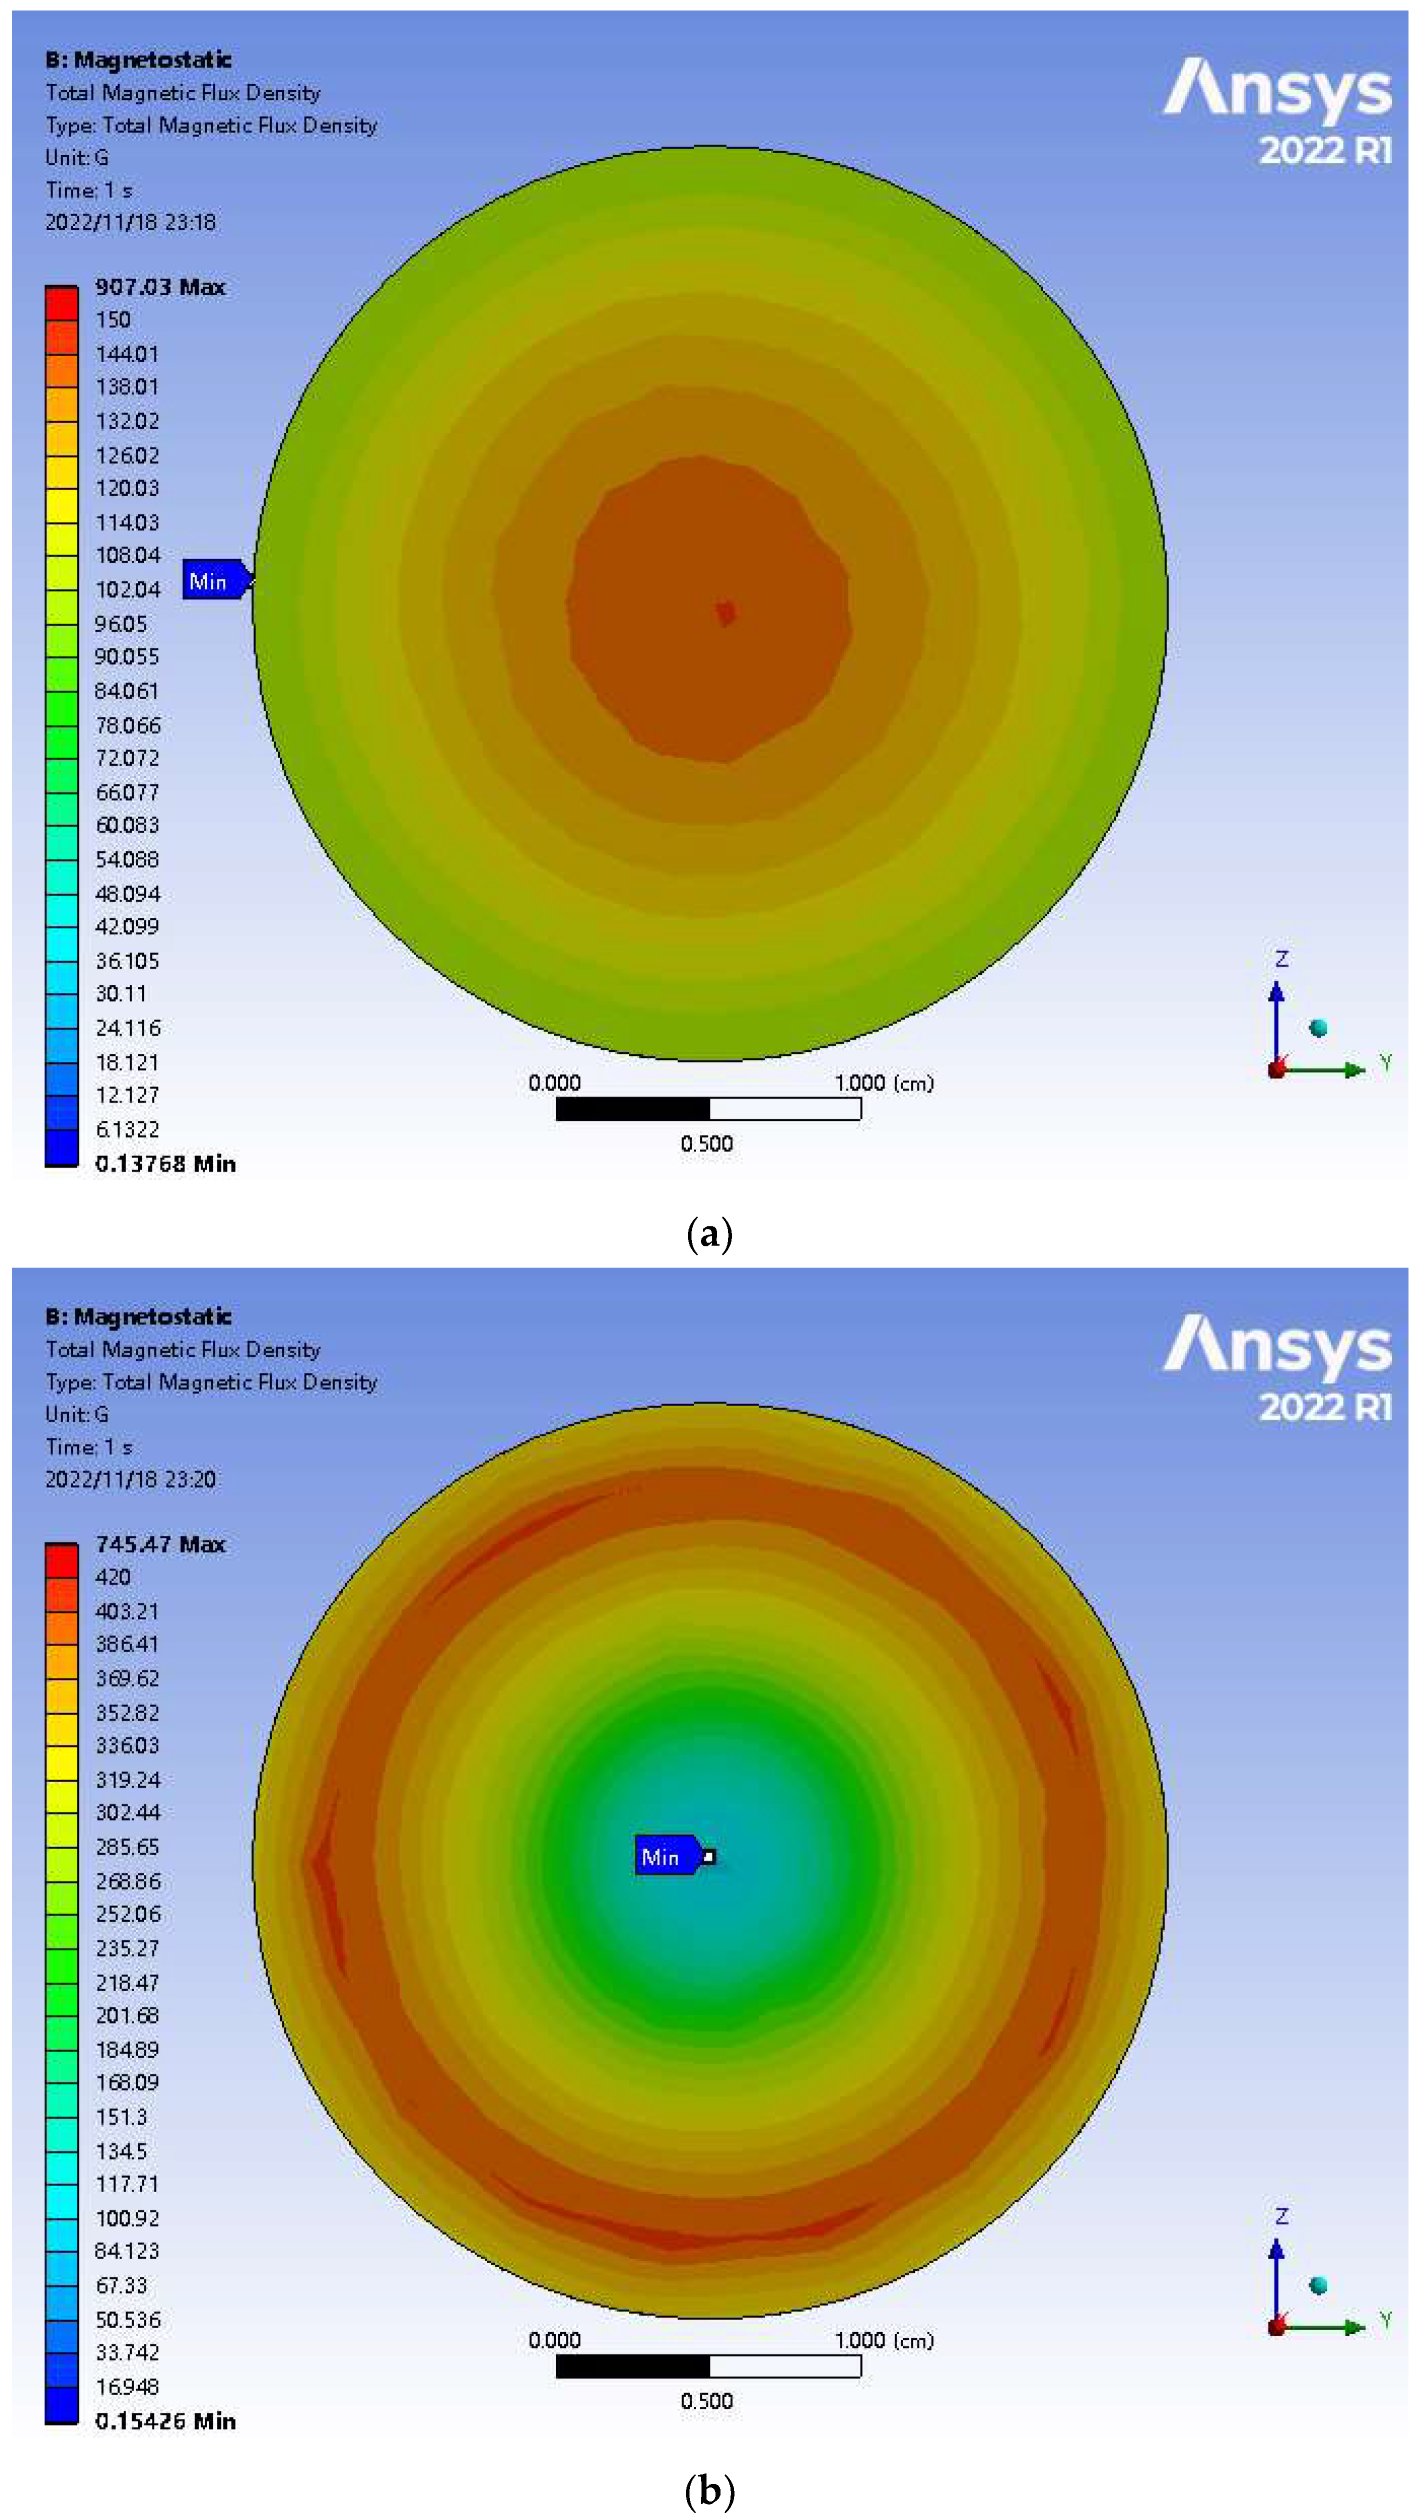
4. Magnetostatic Simulation
5. Results and Discussion
6. Conclusions
6.1. Ferromagnetic Base vs. Non-Ferromagnetic Base
6.2. Metal 3D-Printed Surfaces vs. CNC-Machined Surfaces
Author Contributions
Funding
Data Availability Statement
Conflicts of Interest
References
- Bozorth, R.M. Ferromagnetism; Wiley-IEEE Press: Hoboken, NJ, USA, 1993. [Google Scholar]
- Jha, S.; Jain, V. Modeling and simulation of surface roughness in magnetorheological abrasive flow finishing (MRAFF) process. Wear 2006, 261, 856–866. [Google Scholar] [CrossRef]
- Hajalilou, A.; Amri Mazlan, S.; Lavvafi, H.; Shameli, K. Field Responsive Fluids as Smart Materials; Springer: Singapore, 2016; p. 121. [Google Scholar]
- Kumar, J.S.; Paul, P.S.; Raghunathan, G.; Alex, D.G. A review of challenges and solutions in the preparation and use of magnetorheological fluids. Int. J. Mech. Mater. Eng. 2019, 14, 13. [Google Scholar] [CrossRef]
- Seo, Y.P.; Han, S.; Choi, J.; Takahara, A.; Choi, H.J.; Seo, Y. Searching for a Stable High-Performance Magnetorheological Suspension. Mater. Res. Seoul Natl. Univ. 2018, 30, 1704769. [Google Scholar] [CrossRef] [PubMed]
- Li, Y.; Su, Z.; Luo, Y.; Wang, Y.; Luo, J.; Ji, D. Study on the friction and wear properties of magnetorheological fluids based on different lubricant formulas. J. Supercond. Nov. Magn. 2021, 34, 943–950. [Google Scholar] [CrossRef]
- Thiagarajan, S.; Koh, A.S. Performance and stability of magnetorheological fluids—A detailed review of the state of the art. Adv. Eng. Mater. 2021, 23, 2001458. [Google Scholar] [CrossRef]
- Zhang, P.; Lee, K.H.; Lee, C.H. Reciprocating friction characteristics of magneto-rheological fluid for aluminum under magnetic field. Trans. Nonferrous Met. Soc. China 2014, 24, 171–176. [Google Scholar] [CrossRef]
- Quinci, F.; Litwin, W.; Wodtke, M.; van den Nieuwendijk, R. A comparative performance assessment of a hydrodynamic journal bearing lubricated with oil and magnetorheological fluid. Tribol. Int. 2021, 162, 107143. [Google Scholar] [CrossRef]
- Gołdasz, J.; Sapiński, B. Insight into Magnetorheological Shock Absorbers; Springer International Publishing: Cham, Switzerland, 2016; pp. 1–224. [Google Scholar]
- Nakano, M.; Yang, J.; Sun, S.; Totsuka, A.; Fukukita, A. Development and Damping Properties of a Seismic Linear Motion Damper with MR Fluid Porous Composite Rotary Brake. Smart Mater. Struct. 2020, 29, 115043. [Google Scholar] [CrossRef]
- Zhang, P.; Lee, K.H.; Lee, C.H. Wear Behavior of Rotary Lip Seal Operating in a Magnetorheological Fluid Under Magnetic Field Conditions. J. Tribol. 2018, 140, 22201. [Google Scholar] [CrossRef]
- Zhang, P.; Lee, K.H.; Lee, C.H. Fretting friction and wear characteristics of magnetorheological fluid under different magnetic field strengths. J. Magn. Magn. Mater. 2017, 421, 13–18. [Google Scholar] [CrossRef]
- Shahrivar, K.; Ortiz, A.; de Vicente, J. A comparative study of the tribological performance of ferrofluids and magnetorheological fluids within steel–steel point contacts. Tribol. Int. 2014, 78, 125–133. [Google Scholar] [CrossRef]
- Vafadar, A.; Guzzomi, F.; Rassau, A.; Hayward, K. Advances in metal additive manufacturing: A review of common processes, industrial applications, and current challenges. Appl. Sci. 2021, 11, 1213. [Google Scholar] [CrossRef]
- Cui, X.; Zhang, S.; Wang, C.; Zhang, C.H.; Chen, J.; Zhang, J.B. Microstructure and fatigue behavior of a laser additive manufactured 12CrNi2 low alloy steel. Mater. Sci. Eng. A 2020, 772, 138685. [Google Scholar] [CrossRef]
- Bača, A.; Konečná, R.; Nicoletto, G.; Kunz, L. Influence of build direction on the fatigue behaviour of Ti6Al4V alloy produced by direct metal laser sintering. Mater. Today Proc. 2016, 3, 921–924. [Google Scholar] [CrossRef]
- Buchanan, C.; Gardner, L. Metal 3D printing in construction: A review of methods, research, applications, opportunities and challenges. Eng. Struct. 2019, 180, 332–348. [Google Scholar] [CrossRef]
- Wang, Y.; Wang, Y.T.; Li, R.D.; Niu, P.D.; Wang, M.B.; Yuan, T.C.; Li, K. Hall-Petch relationship in selective laser melting additively manufactured metals: Using grain or cell size? J. Cent. South Univ. 2021, 28, 1043–1057. [Google Scholar] [CrossRef]
- Lam, L.P.; Zhang, D.Q.; Liu, Z.H.; Chua, C.K. Phase analysis and microstructure characterisation of AlSi10Mg parts produced by Selective Laser Melting. Virtual Phys. Prototyp. 2015, 10, 207–215. [Google Scholar] [CrossRef]
- Zhang, H.; Wang, Y.; Wang, J.J.; Ni, D.R.; Wang, D.; Xiao, B.L.; Ma, Z.Y. Achieving superior mechanical properties of selective laser melted AlSi10Mg via direct aging treatment. J. Mater. Sci. Technol. 2022, 108, 226–235. [Google Scholar] [CrossRef]
- Nasab, M.H.; Gastaldi, D.; Lecis, N.F.; Vedani, M. On morphological surface features of the parts printed by selective laser melting (SLM). Addit. Manuf. 2018, 24, 373–377. [Google Scholar] [CrossRef]
- Liu, X.; Zhao, C.; Zhou, X.; Shen, Z.; Liu, W. Microstructure of selective laser melted AlSi10Mg alloy. Mater. Des. 2019, 168, 107677. [Google Scholar] [CrossRef]
- Alghamdi, F.; Song, X.; Hadadzadeh, A.; Shalchi-Amirkhiz, B.; Mohammadi, M.; Haghshenas, M. Post heat treatment of additive manufactured AlSi10Mg: On silicon morphology, texture and small-scale properties. Mater. Sci. Eng. A 2020, 783, 139296. [Google Scholar] [CrossRef]
- Oßwald, K.; Gissel, J.C.; Lochmahr, I. Macroanalysis of Hand Scraping. J. Manuf. Mater. Process. 2020, 4, 90. [Google Scholar] [CrossRef]
- Liang, X.M.; Xing, Y.Z.; Li, L.T.; Yuan, W.K.; Wang, G.F. An experimental study on the relation between friction force and real contact area. Sci. Rep. 2021, 11, 20366. [Google Scholar] [CrossRef]
- Kim, J.W.; Joo, B.S.; Jang, H. The effect of contact area on velocity weakening of the friction coefficient and friction instability: A case study on brake friction materials. Tribol. Int. 2019, 135, 38–45. [Google Scholar] [CrossRef]
- Kumar, S.; Sehgal, R.; Wani, M.; Sharma, M.D. Stabilization and tribological properties of magnetorheological (MR) fluids: A review. J. Magn. Magn. Mater. 2021, 538, 168295. [Google Scholar] [CrossRef]
- Li, H.; Jönkkäri, I.; Sarlin, E.; Chen, F. Temperature effects and temperature-dependent constitutive model of magnetorheological fluids. Rheol. Acta 2021, 60, 719–728. [Google Scholar] [CrossRef]
- Ren, L.; Zeng, S.; Zhang, Y. Magnetic field characteristics analysis of a single assembled magnetic medium using ANSYS software. Int. J. Min. Sci. Technol. 2015, 25, 479–487. [Google Scholar] [CrossRef]


| Item | Unit | Content |
|---|---|---|
| Viscosity | Pa-s | 0.112 ± 0.02 |
| Density | g/cm3 | 2.95–3.15 |
| Solids Content by Weight | % | 80.98 |
| Flash Point | °C | >150 |
| Operating Temperature | °C | −40~130 |
| Item | 3D-Printed | Traditional Casting |
|---|---|---|
| Tensile Strength (Mpa) | 400~460 | 220~300 |
| Yield Strength (Mpa) | 240~300 | 140~200 |
| Elongation (%) | 2~4 | 1~3 |
| Hardness (HBW) | 120~160 | 70~100 |
| Parameter | Unit | Content |
|---|---|---|
| Speed | rpm | 50 |
| Test Radius | mm | 11.5 |
| Lubricant | - | MRF |
| Temperature | °C | 15–25 |
| Load | N | 100 |
| Duration | Sec | 3600 |
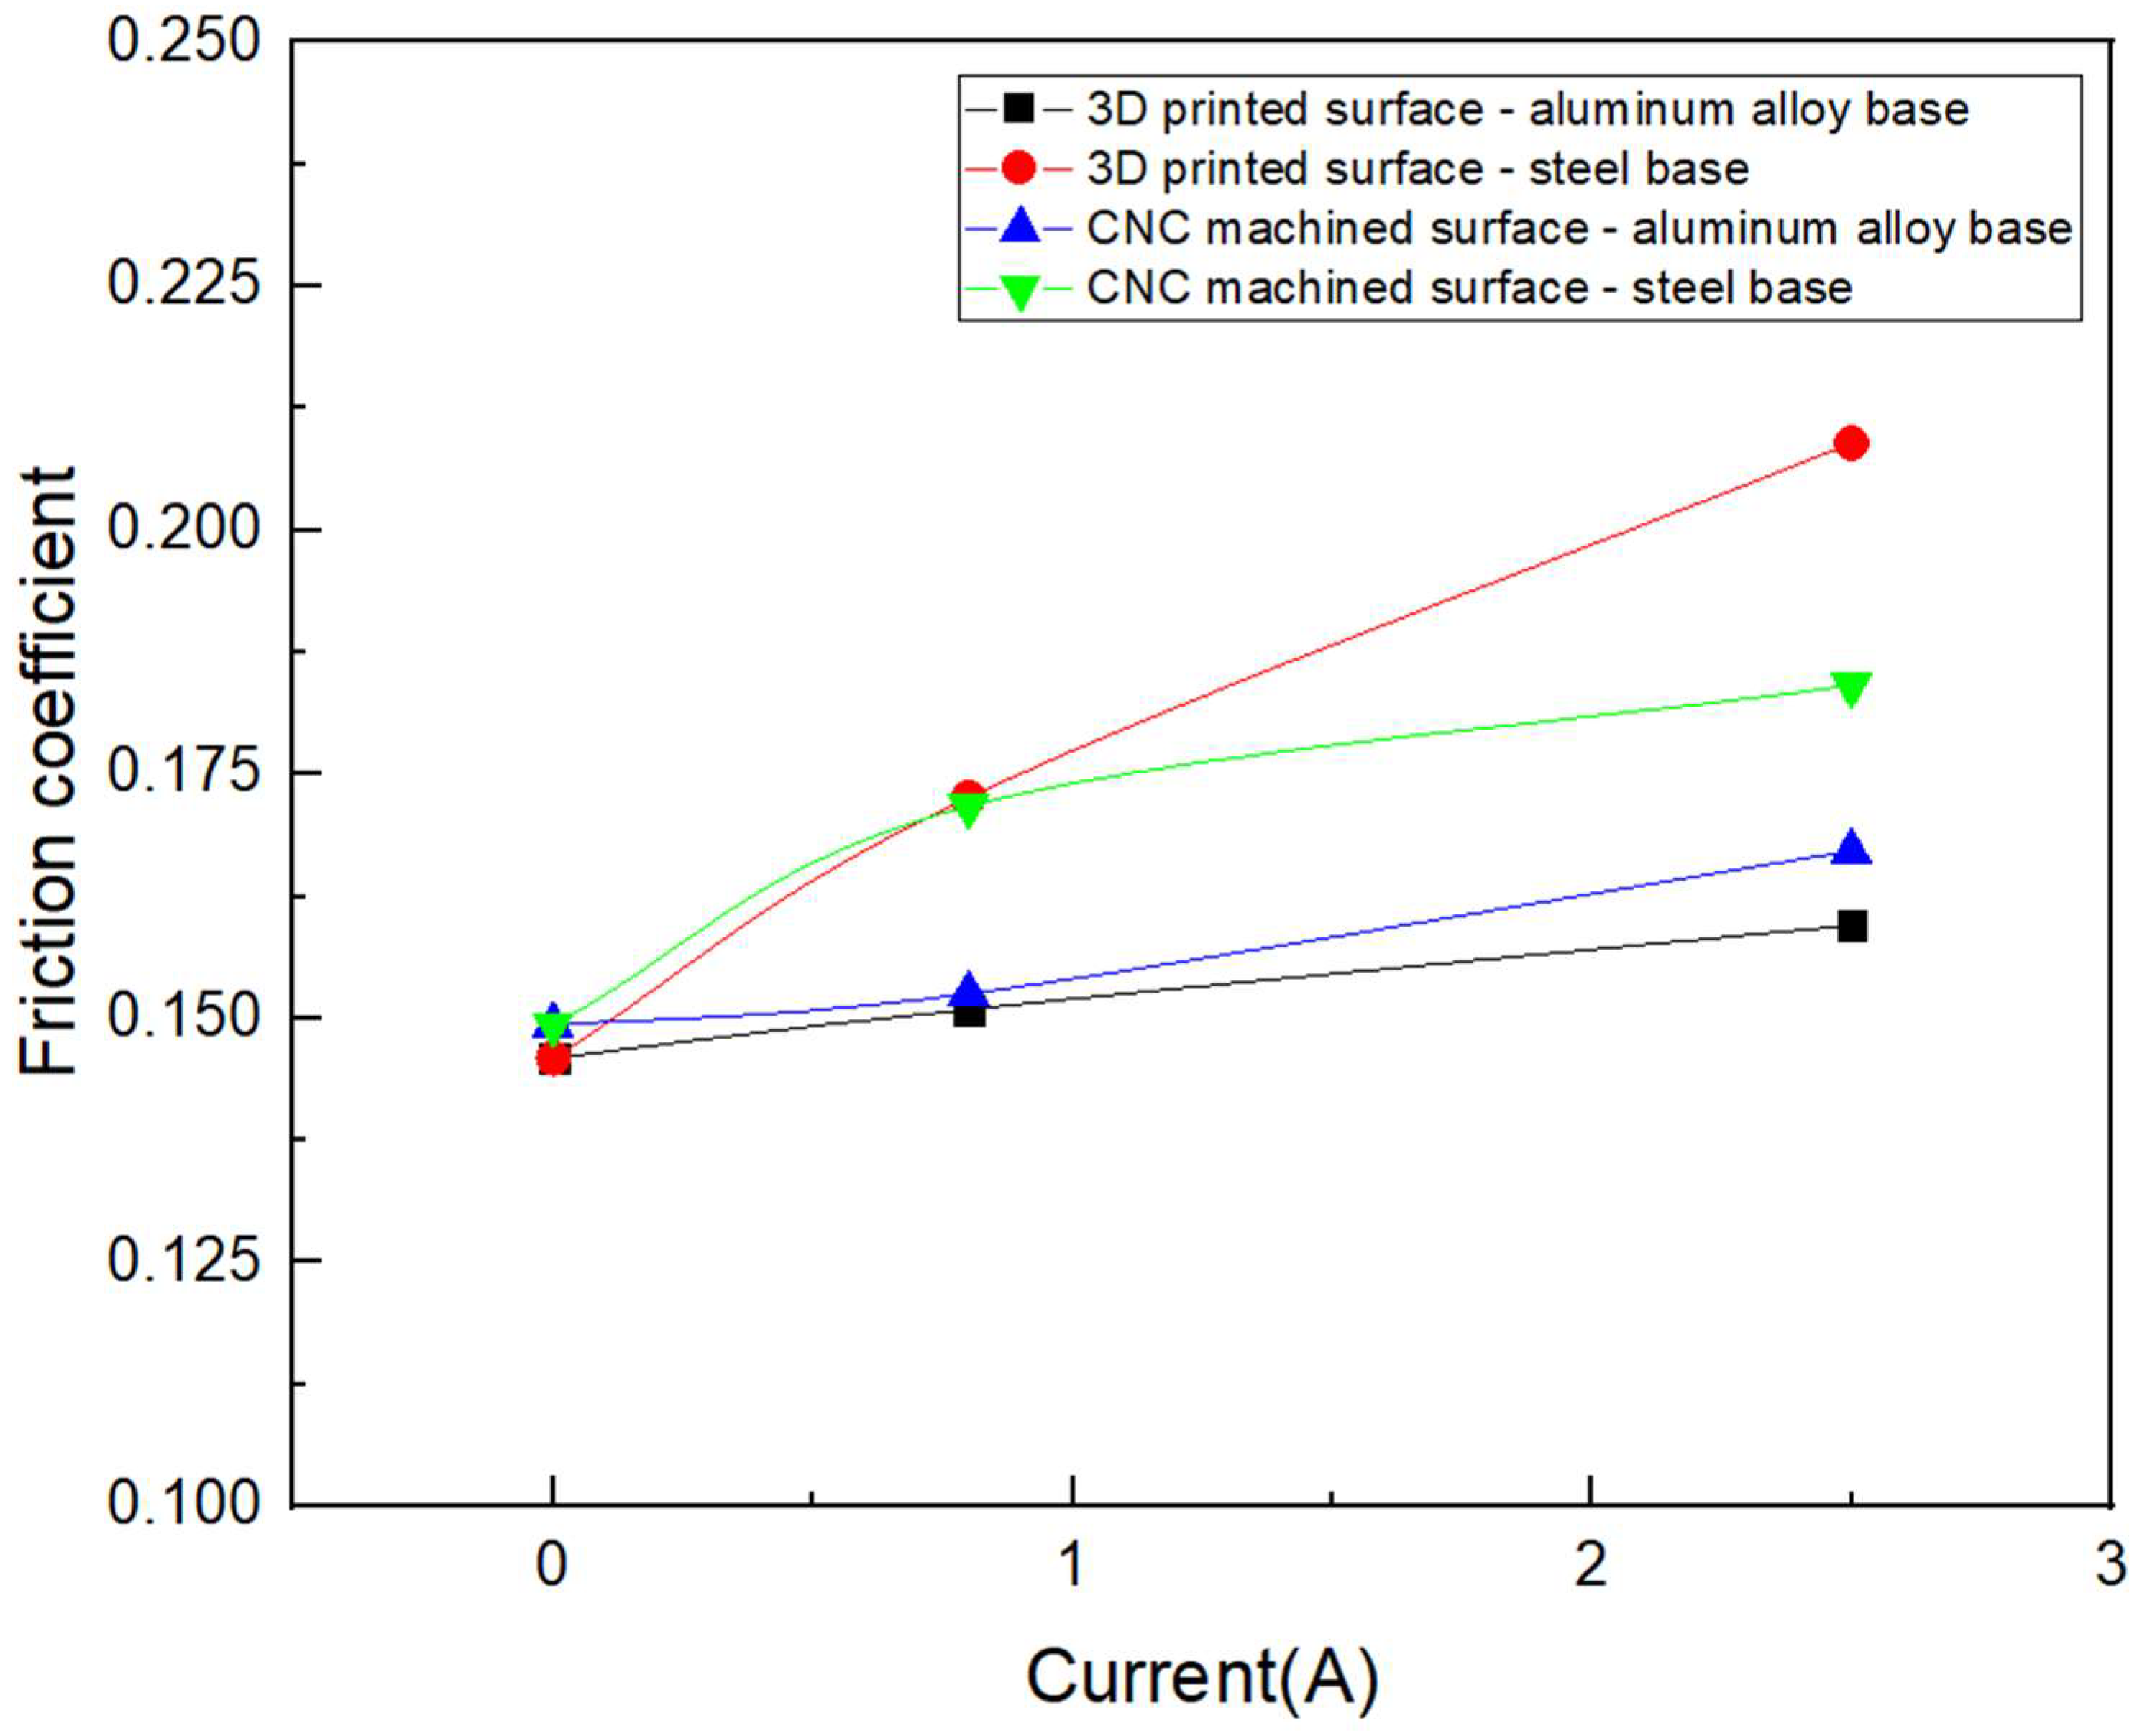
| Surface | Base | Current (A) | Friction Coefficient | Growth Rate (%) | |
|---|---|---|---|---|---|
| Avg. | Sta. Dev | ||||
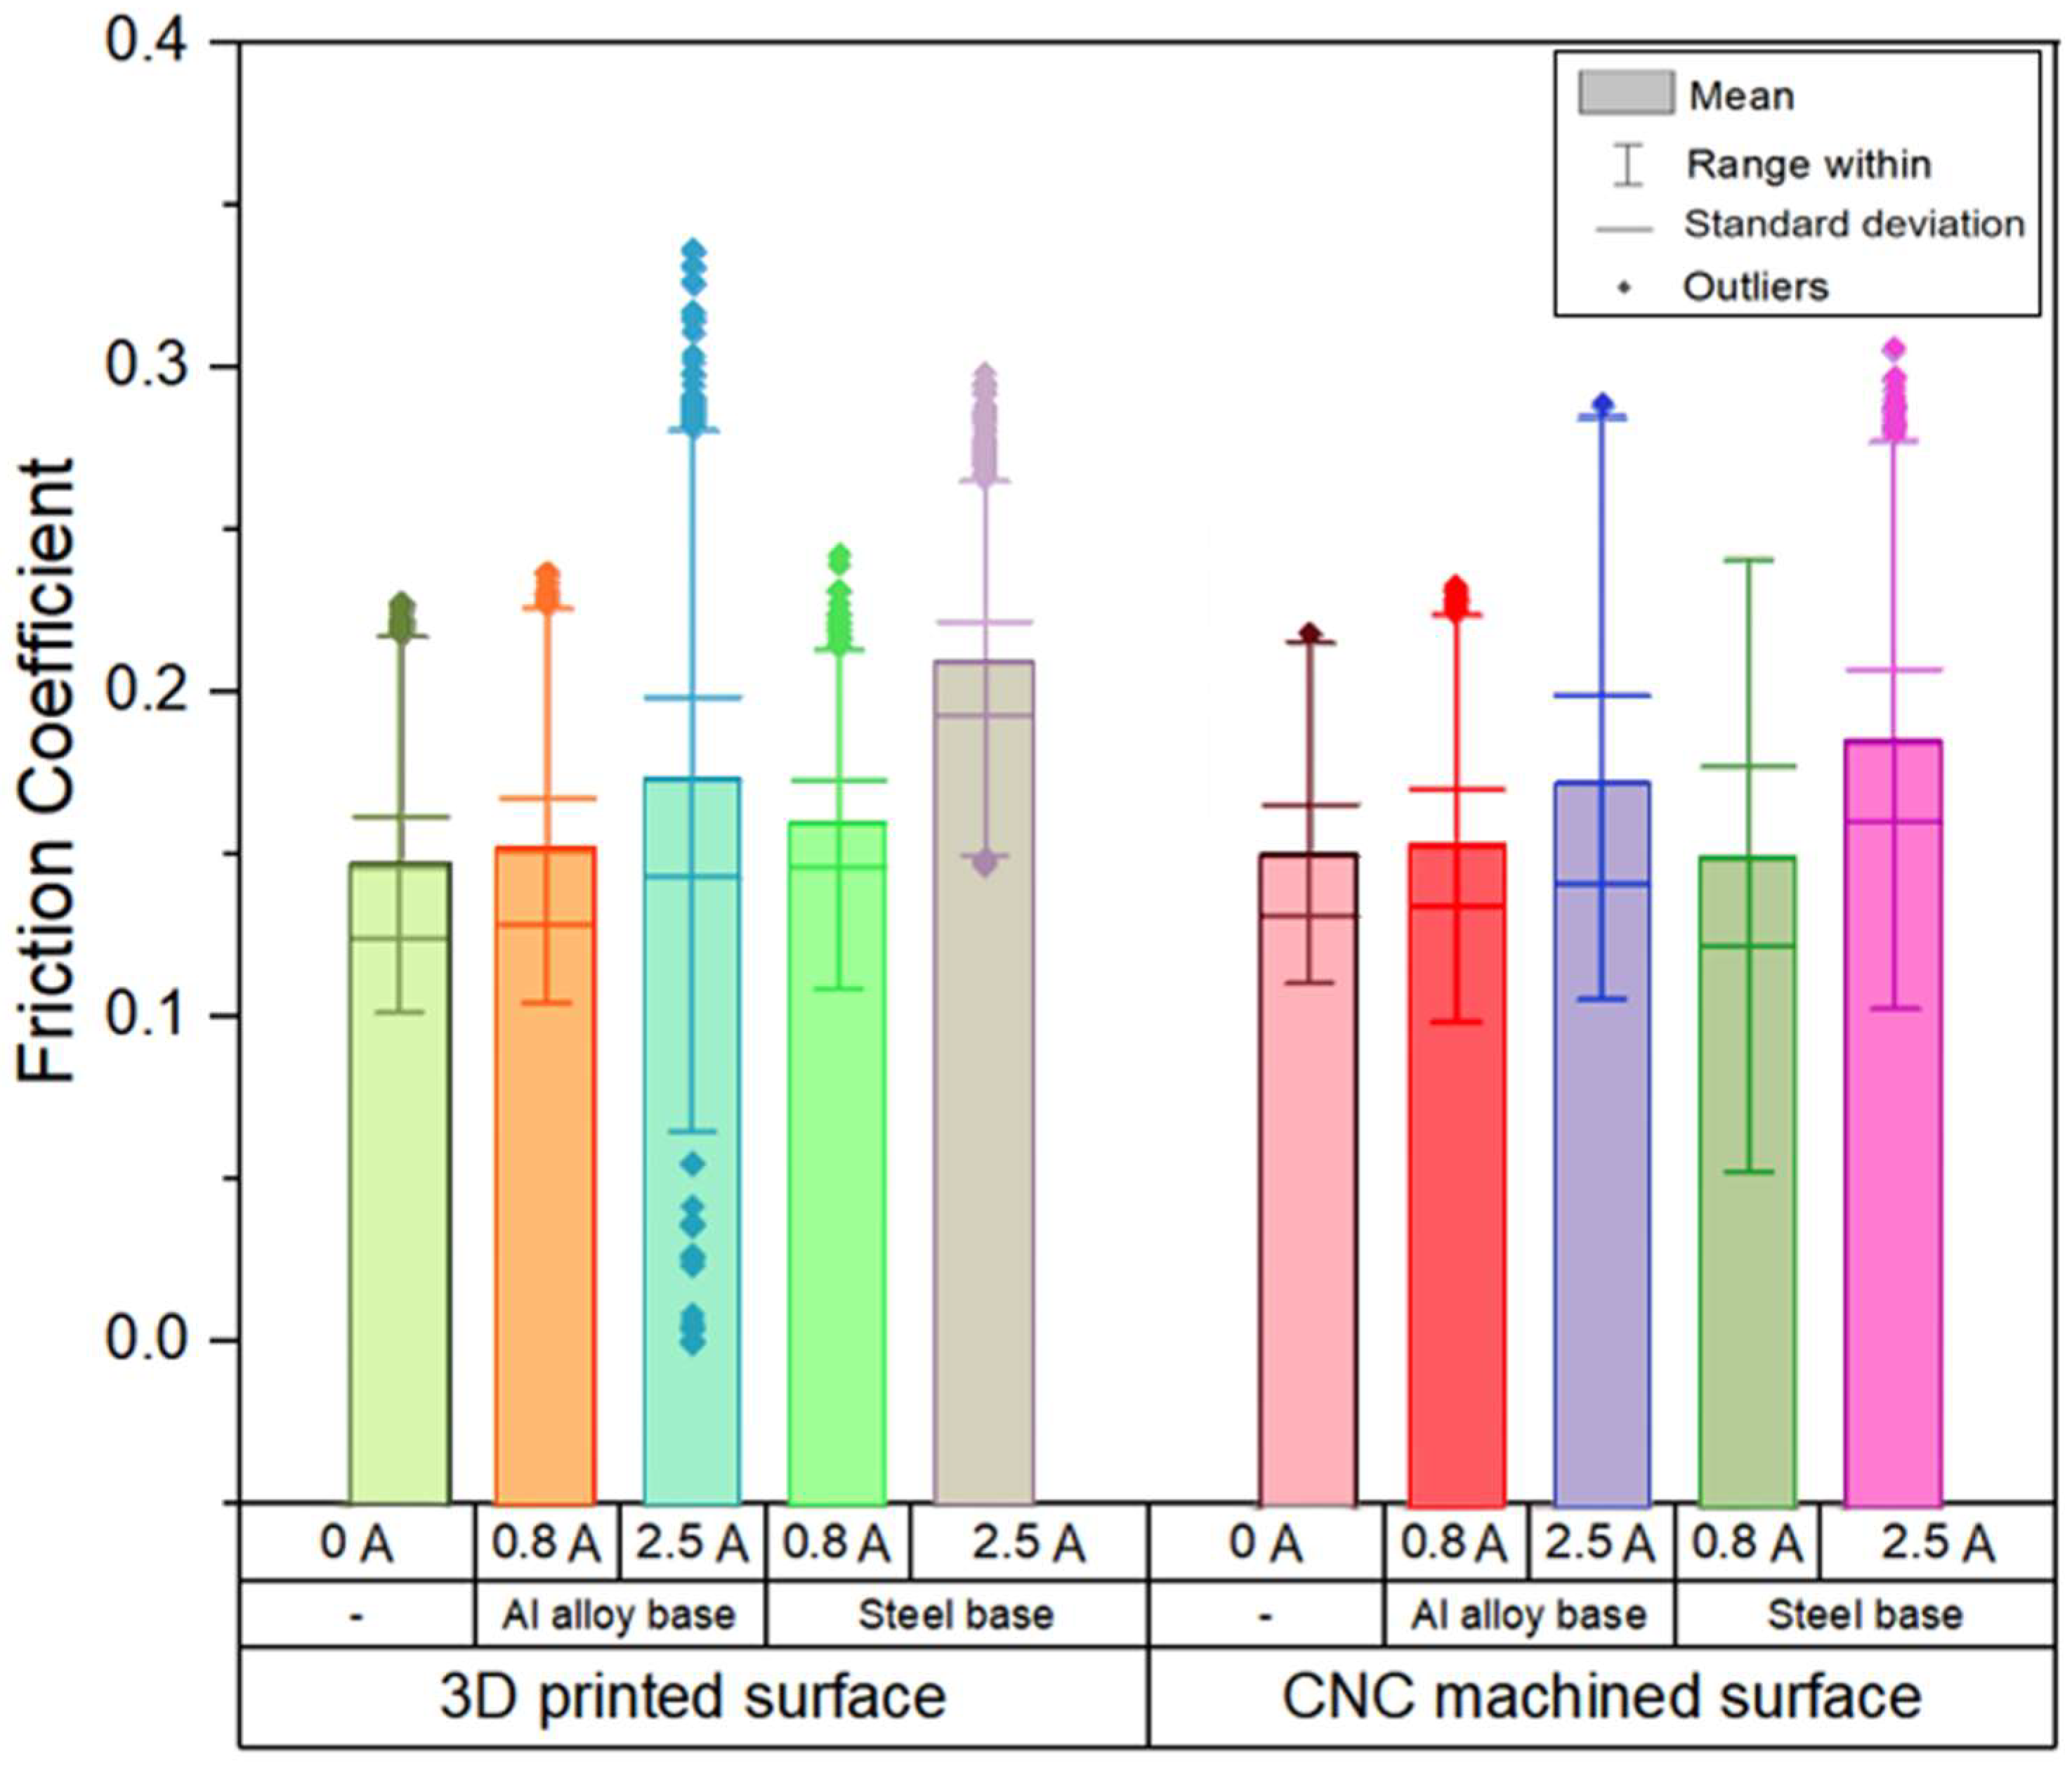
| Metal 3D printing | - | 0 | 0.1459 | 0.0011 | - |
| Metal 3D printing | Aluminum alloy | 0.8 | 0.1509 | 0.0016 | 3.43 |
| Metal 3D printing | Steel | 0.8 | 0.1726 | 0.0018 | 18.30 |
| Metal 3D printing | Aluminum alloy | 2.5 | 0.1595 | 0.0012 | 9.32 |
| Metal 3D printing | Steel | 2.5 | 0.2089 | 0.0013 | 43.18 |
| CNC machining | - | 0 | 0.1493 | 0.0009 | - |
| CNC machining | Aluminum alloy | 0.8 | 0.1525 | 0.0012 | 2.14 |
| CNC machining | Steel | 0.8 | 0.1717 | 0.0019 | 15.00 |
| CNC machining | Aluminum alloy | 2.5 | 0.1671 | 0.0018 | 11.92 |
| CNC machining | Steel | 2.5 | 0.1841 | 0.0016 | 23.31 |
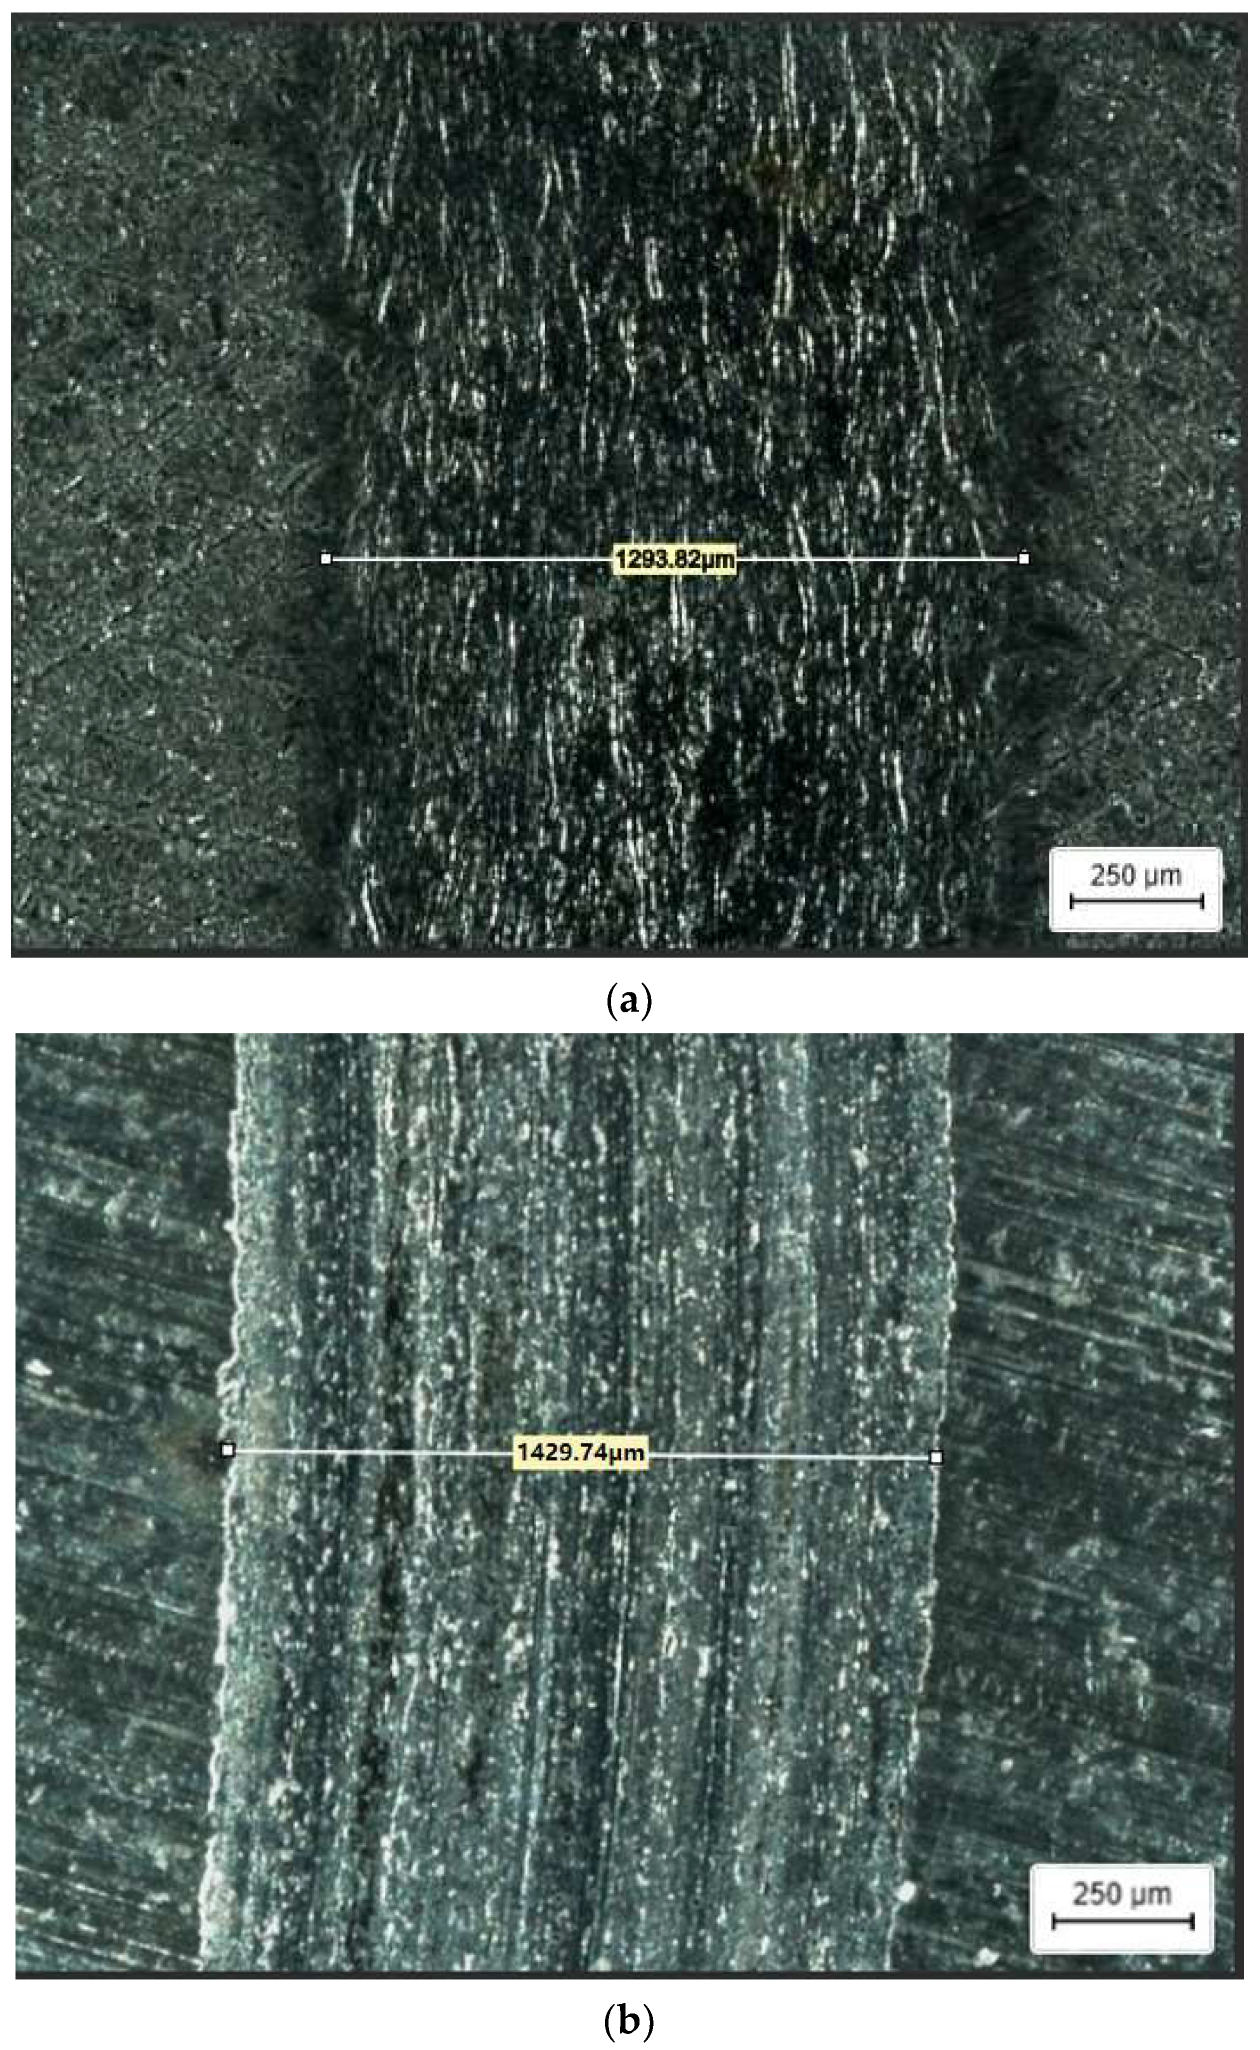
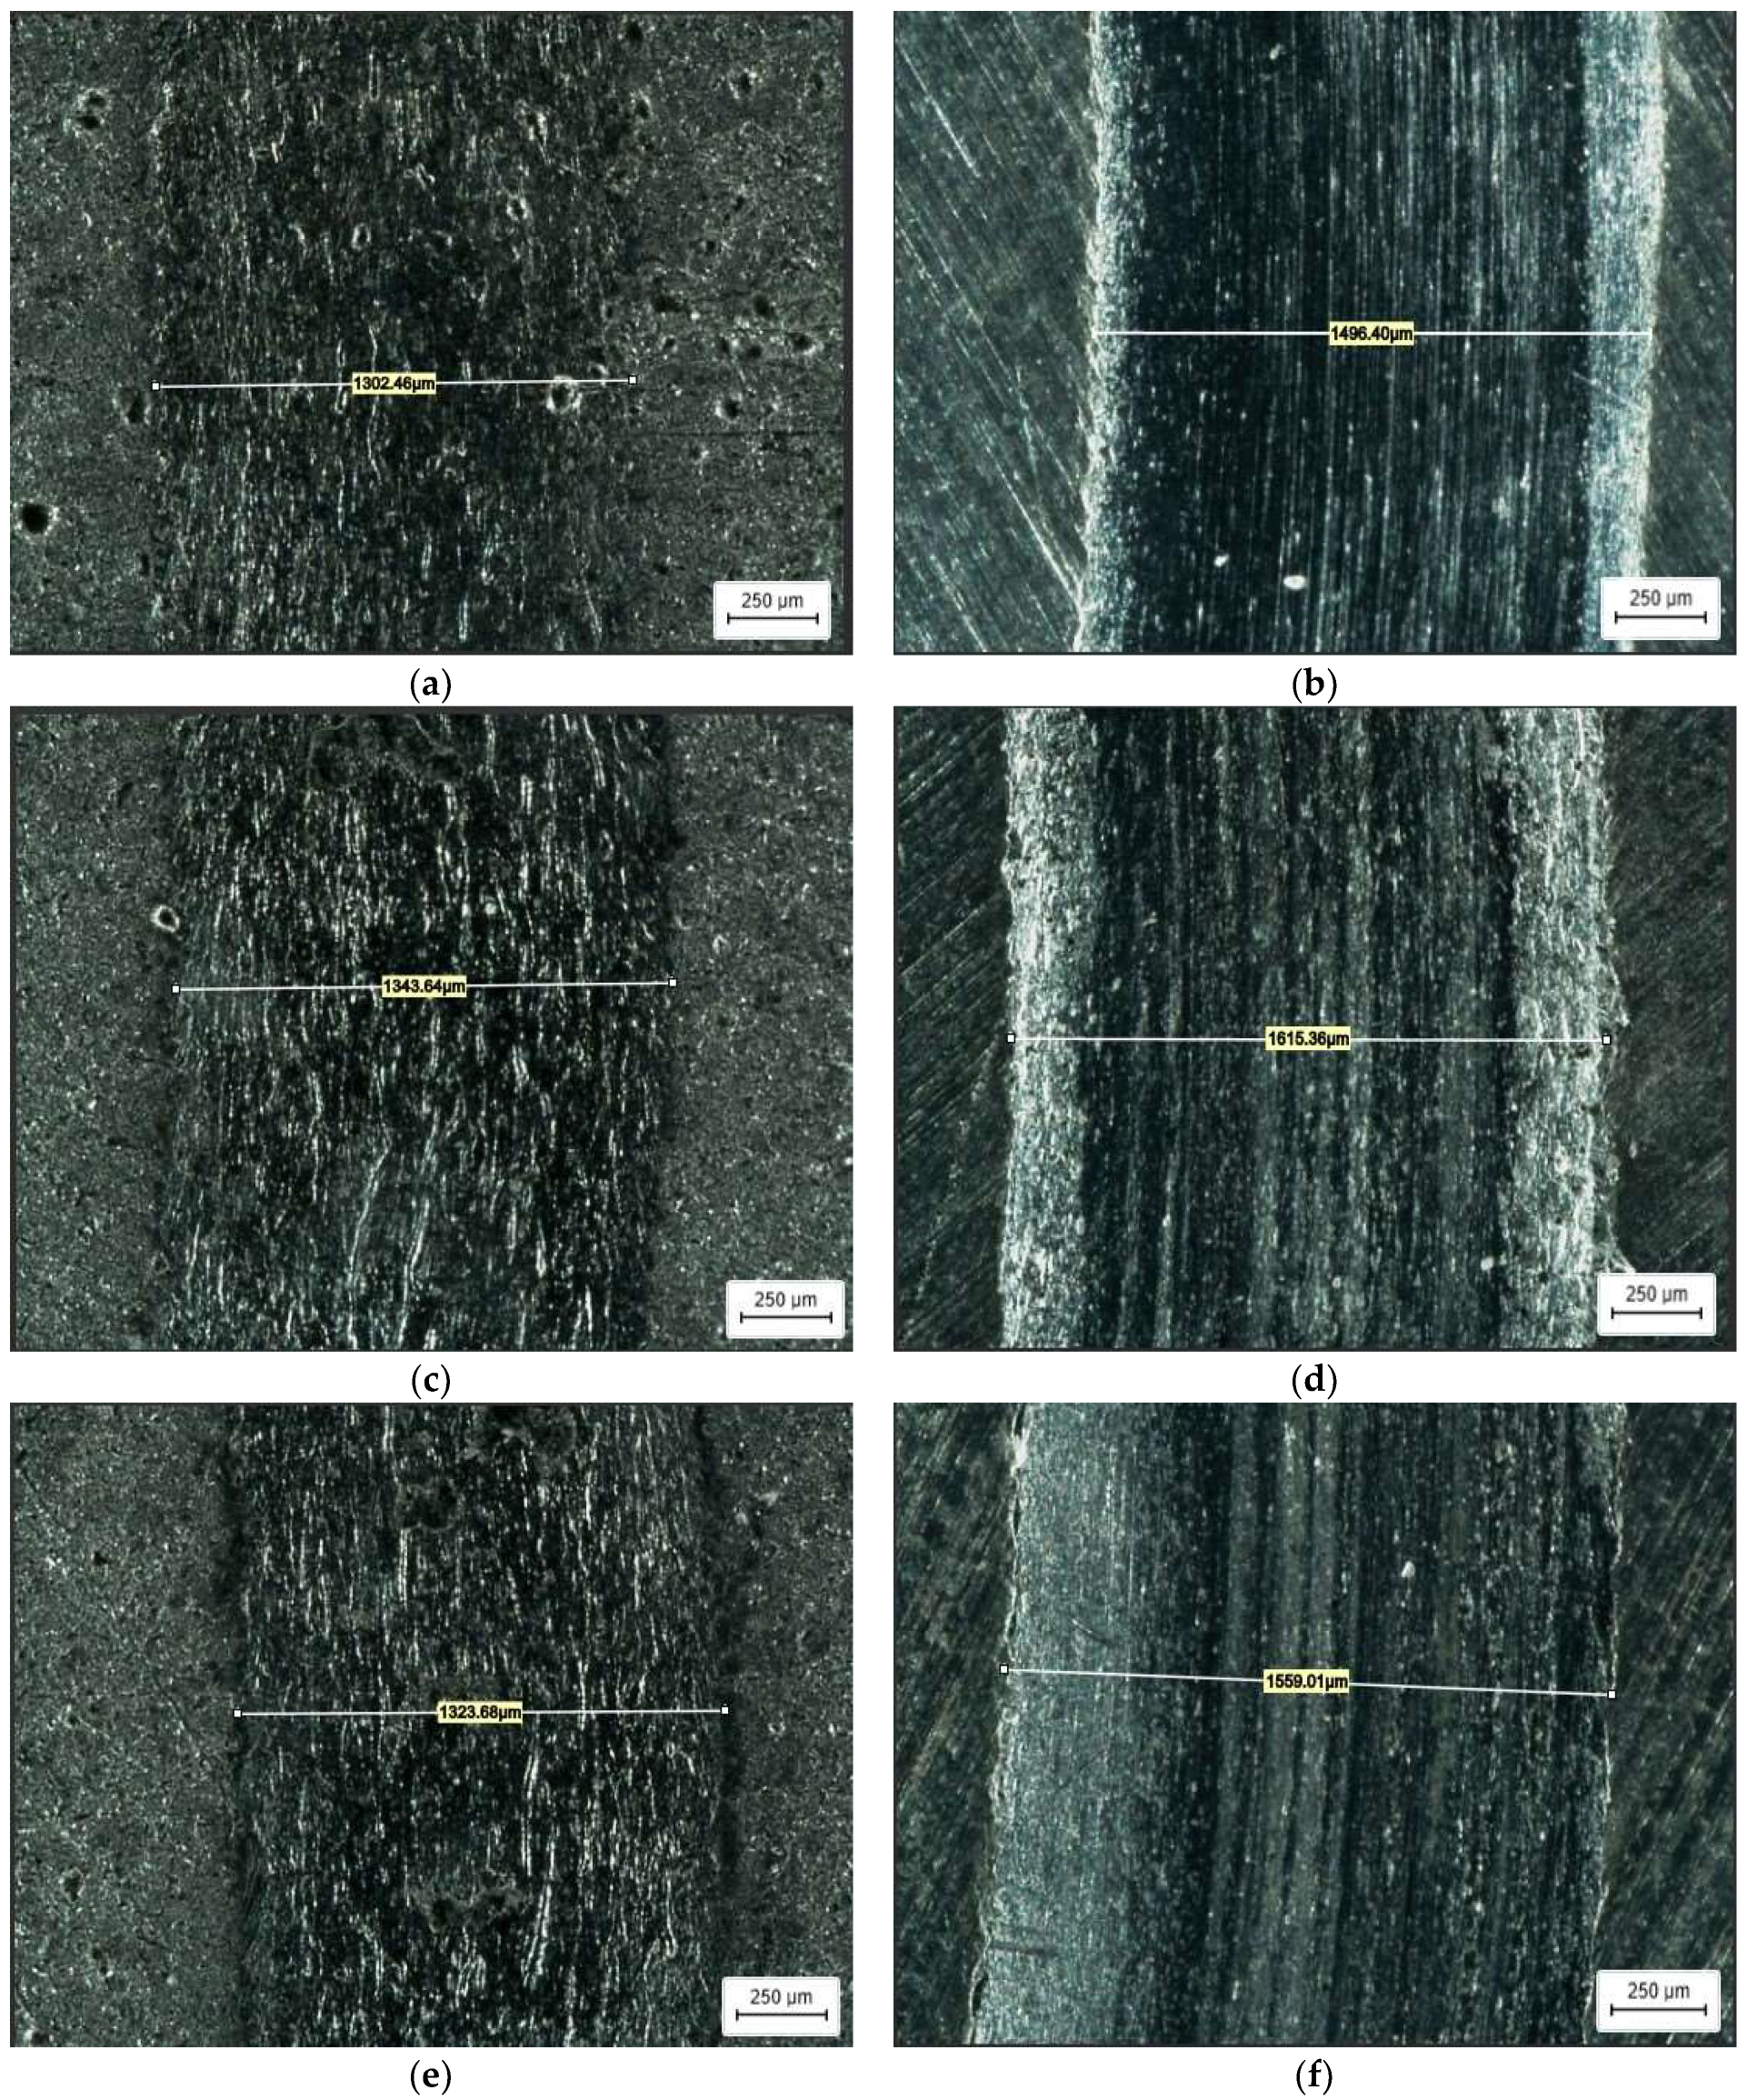
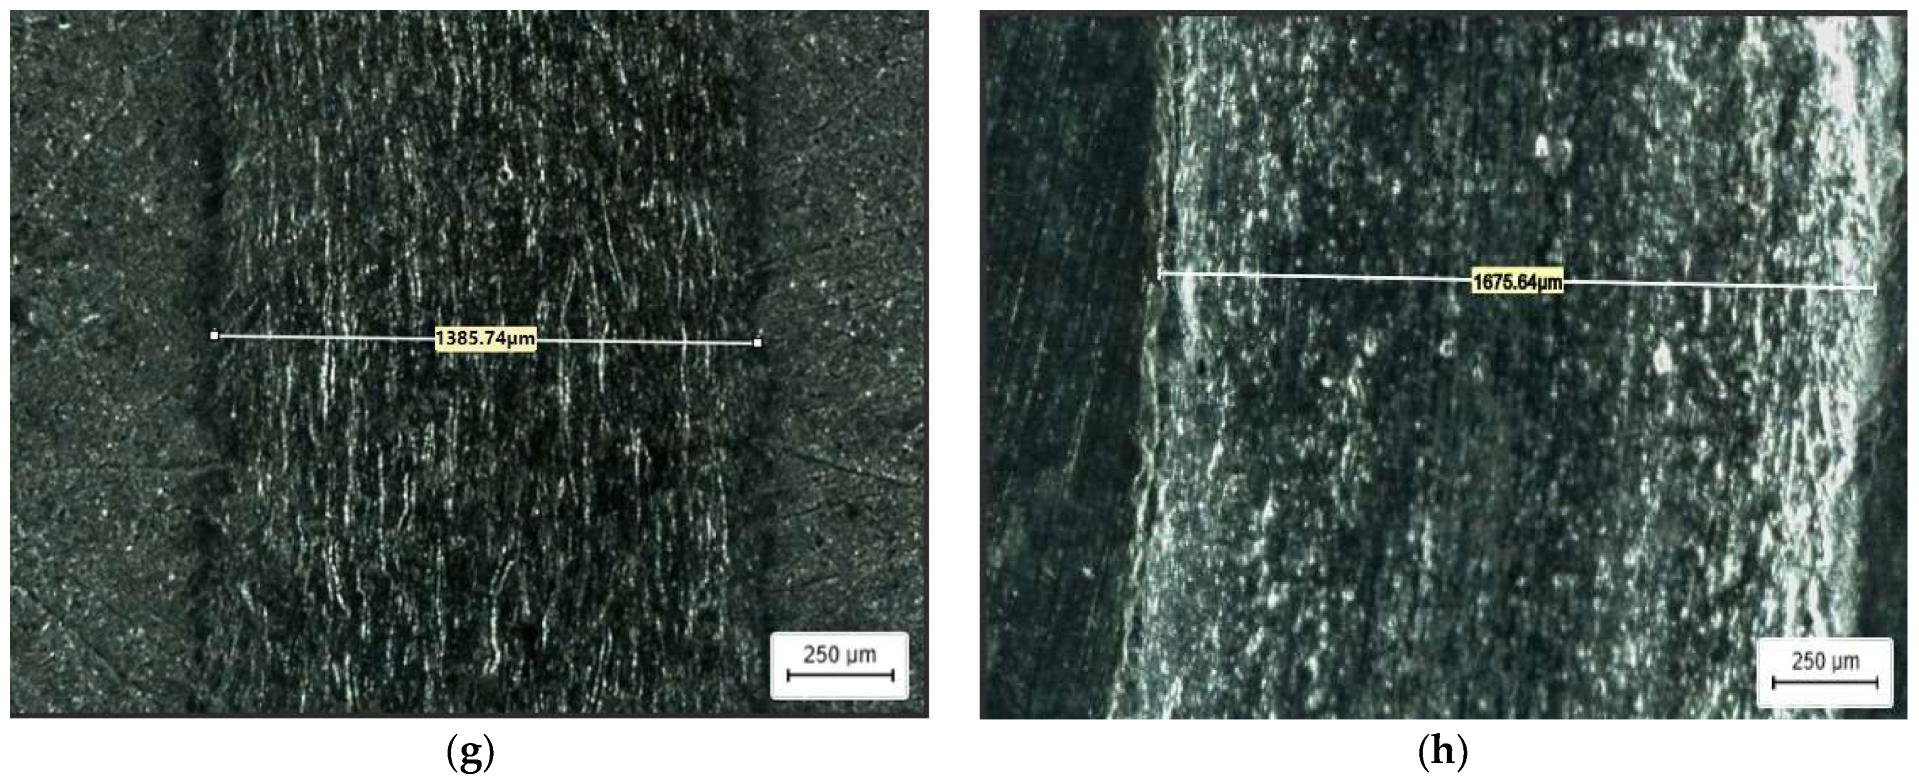
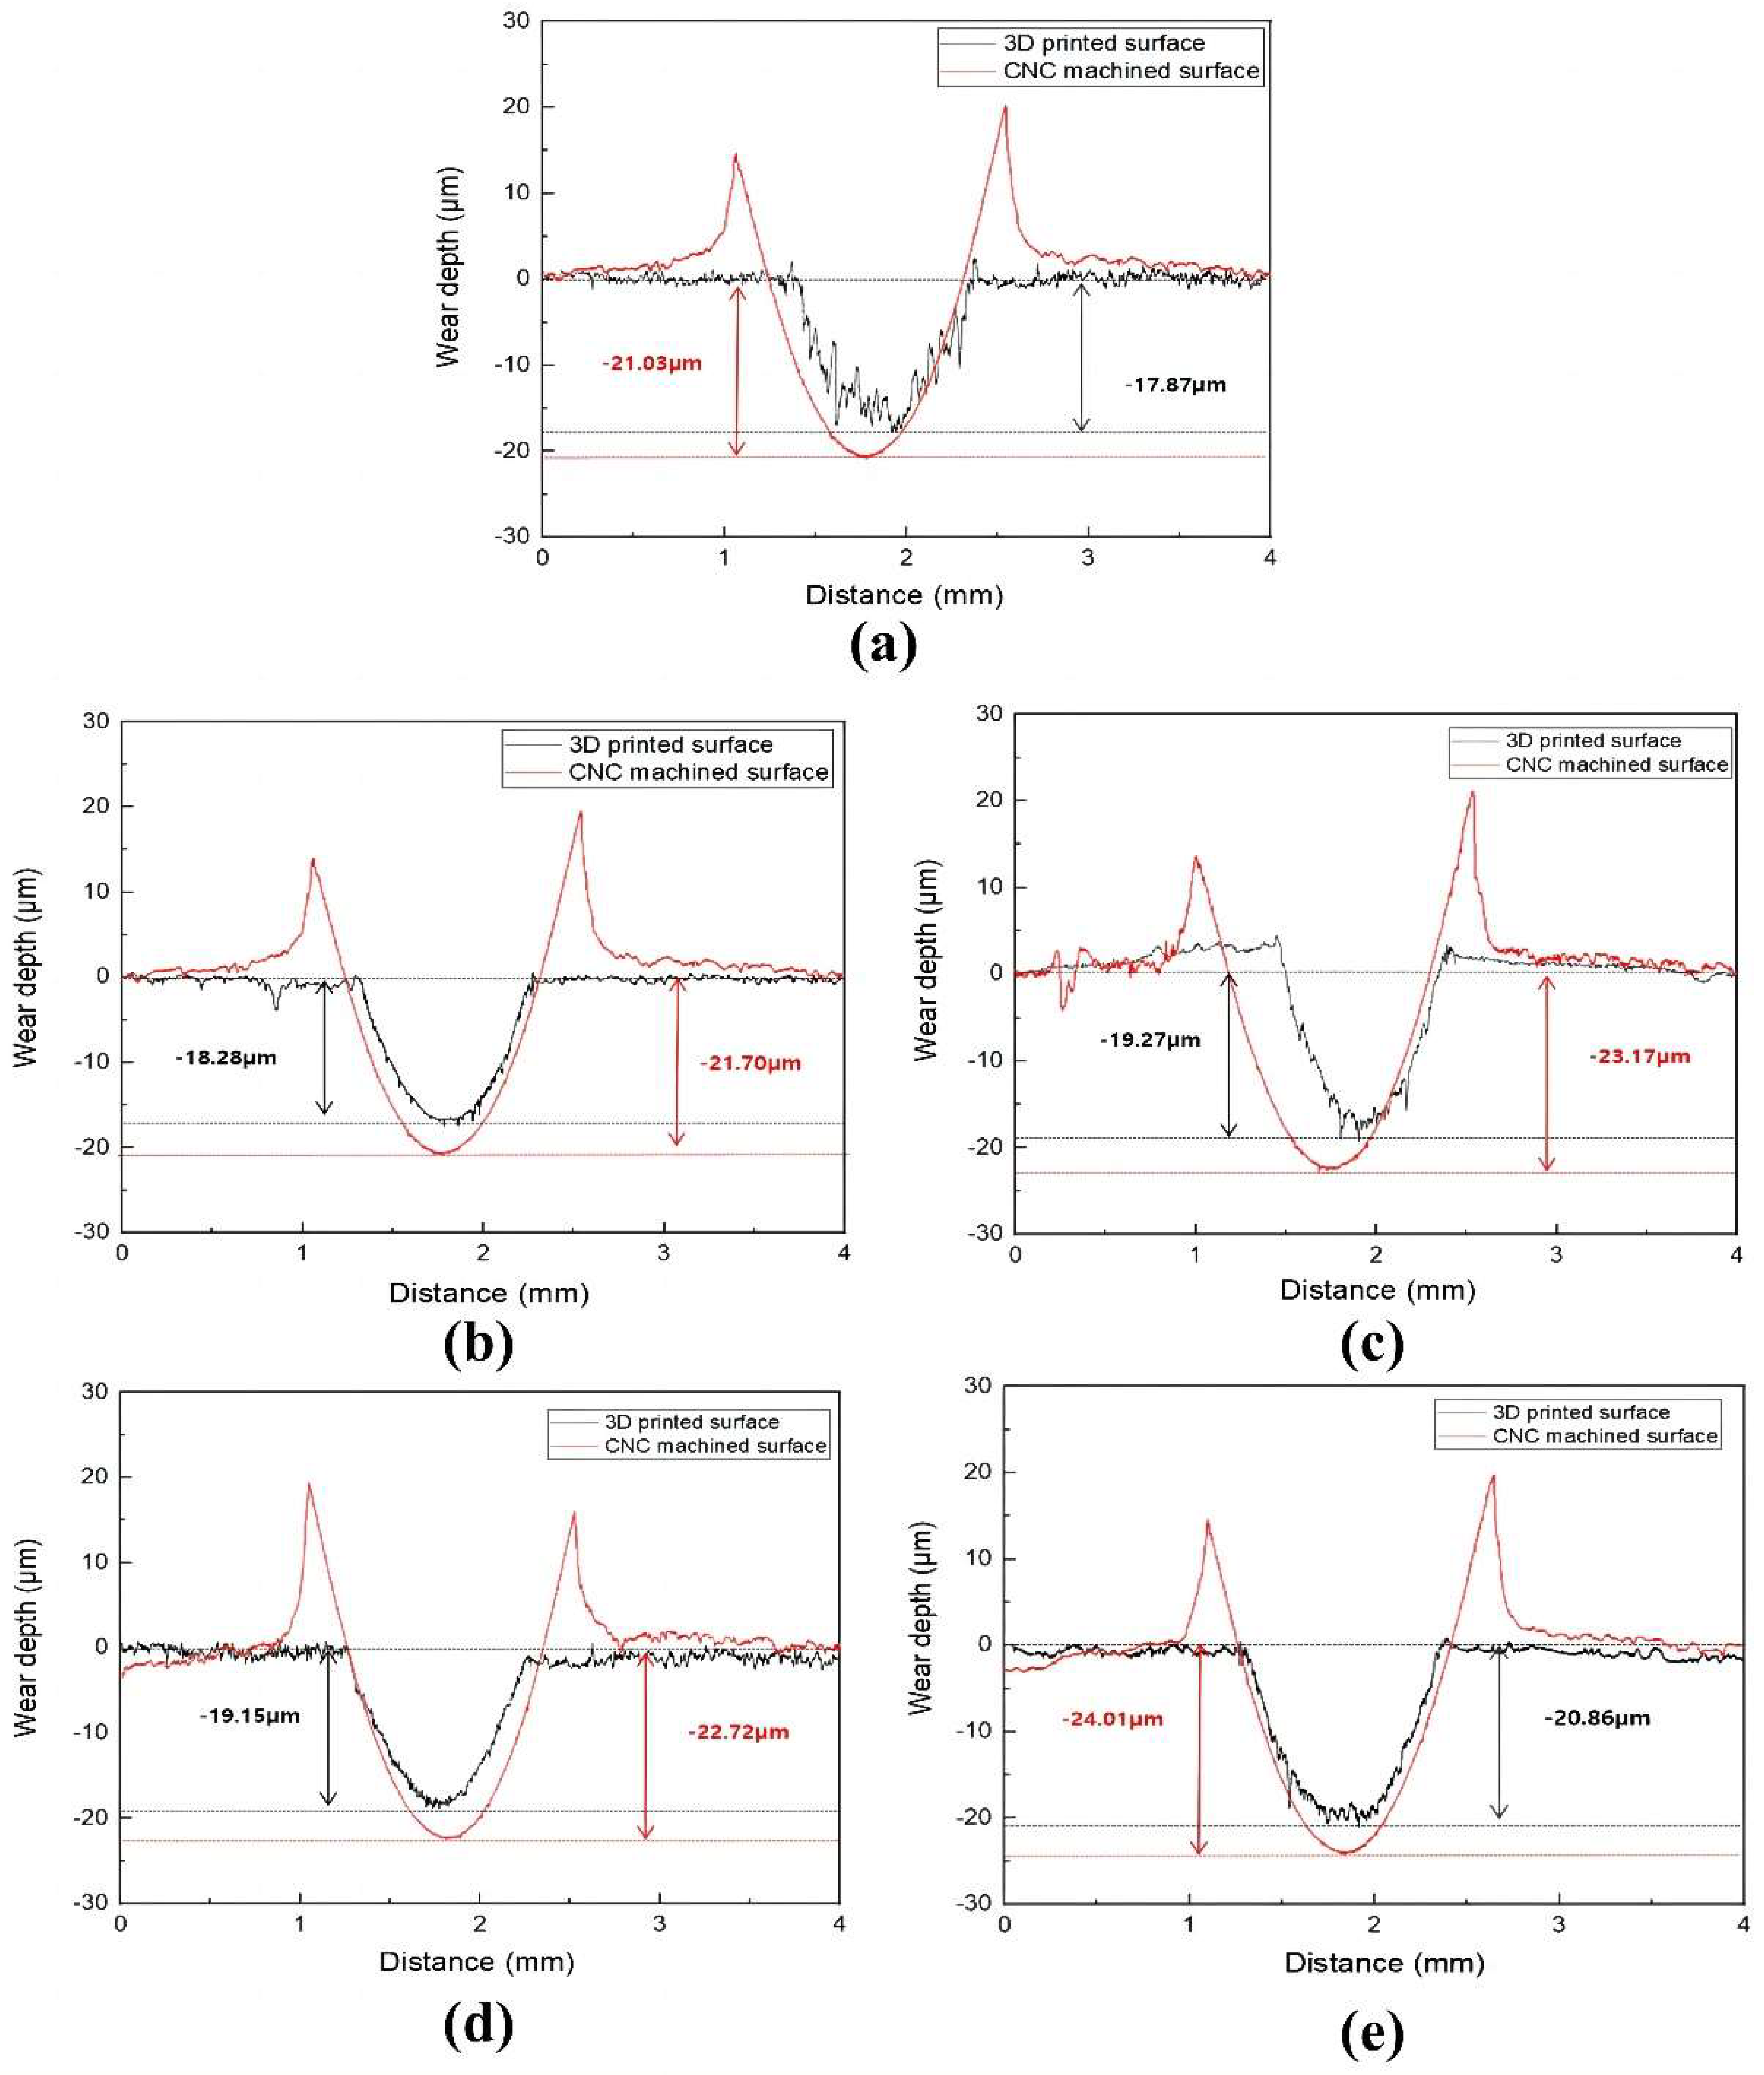
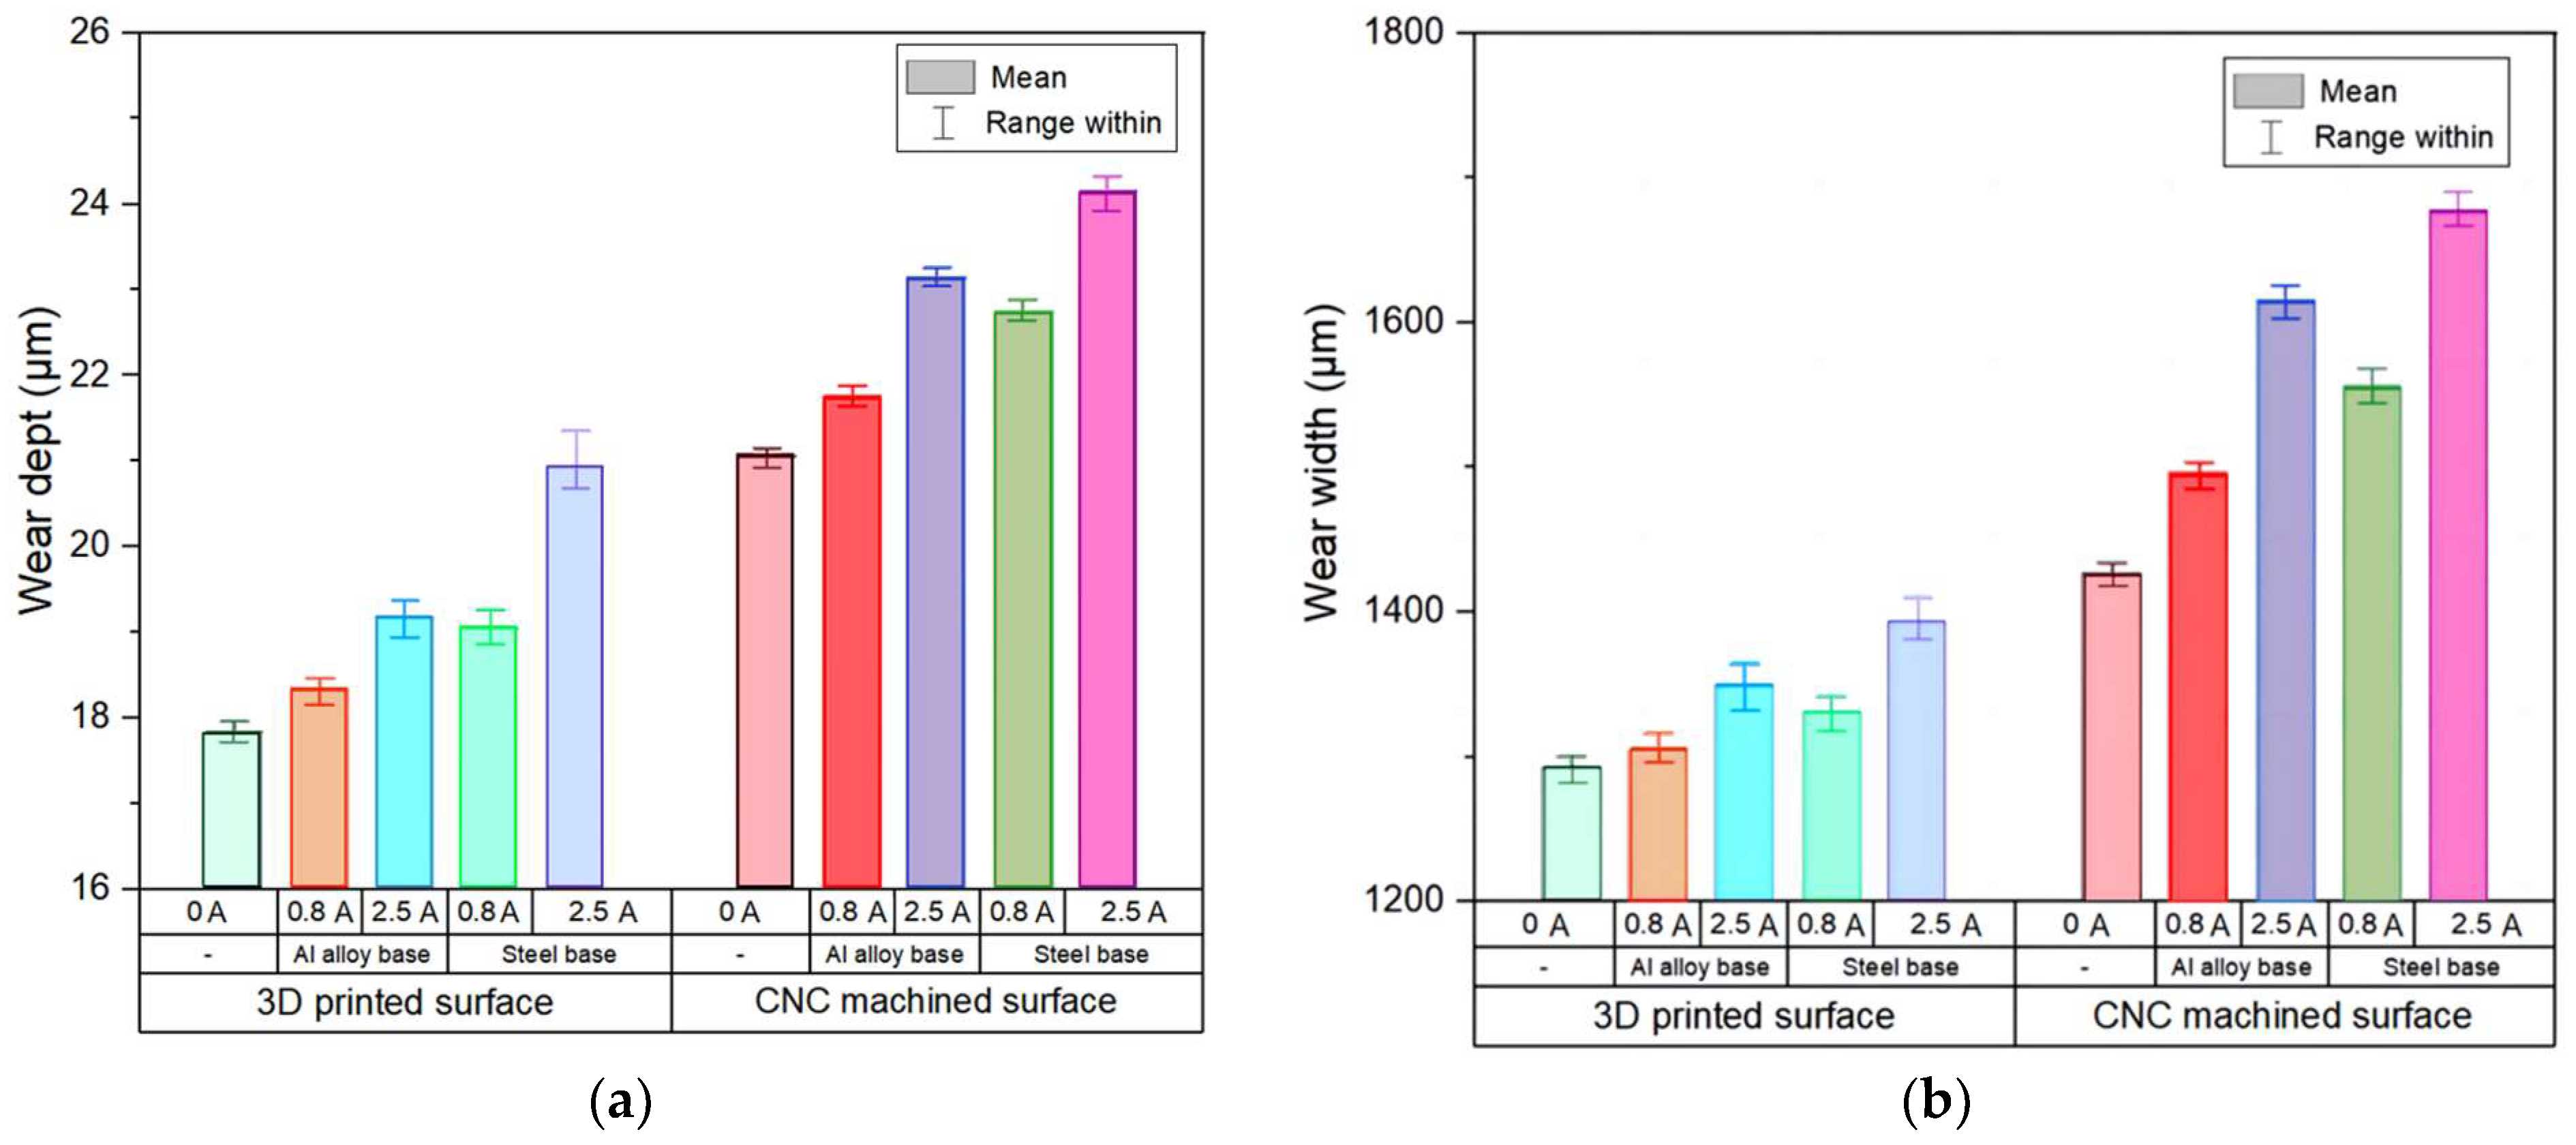
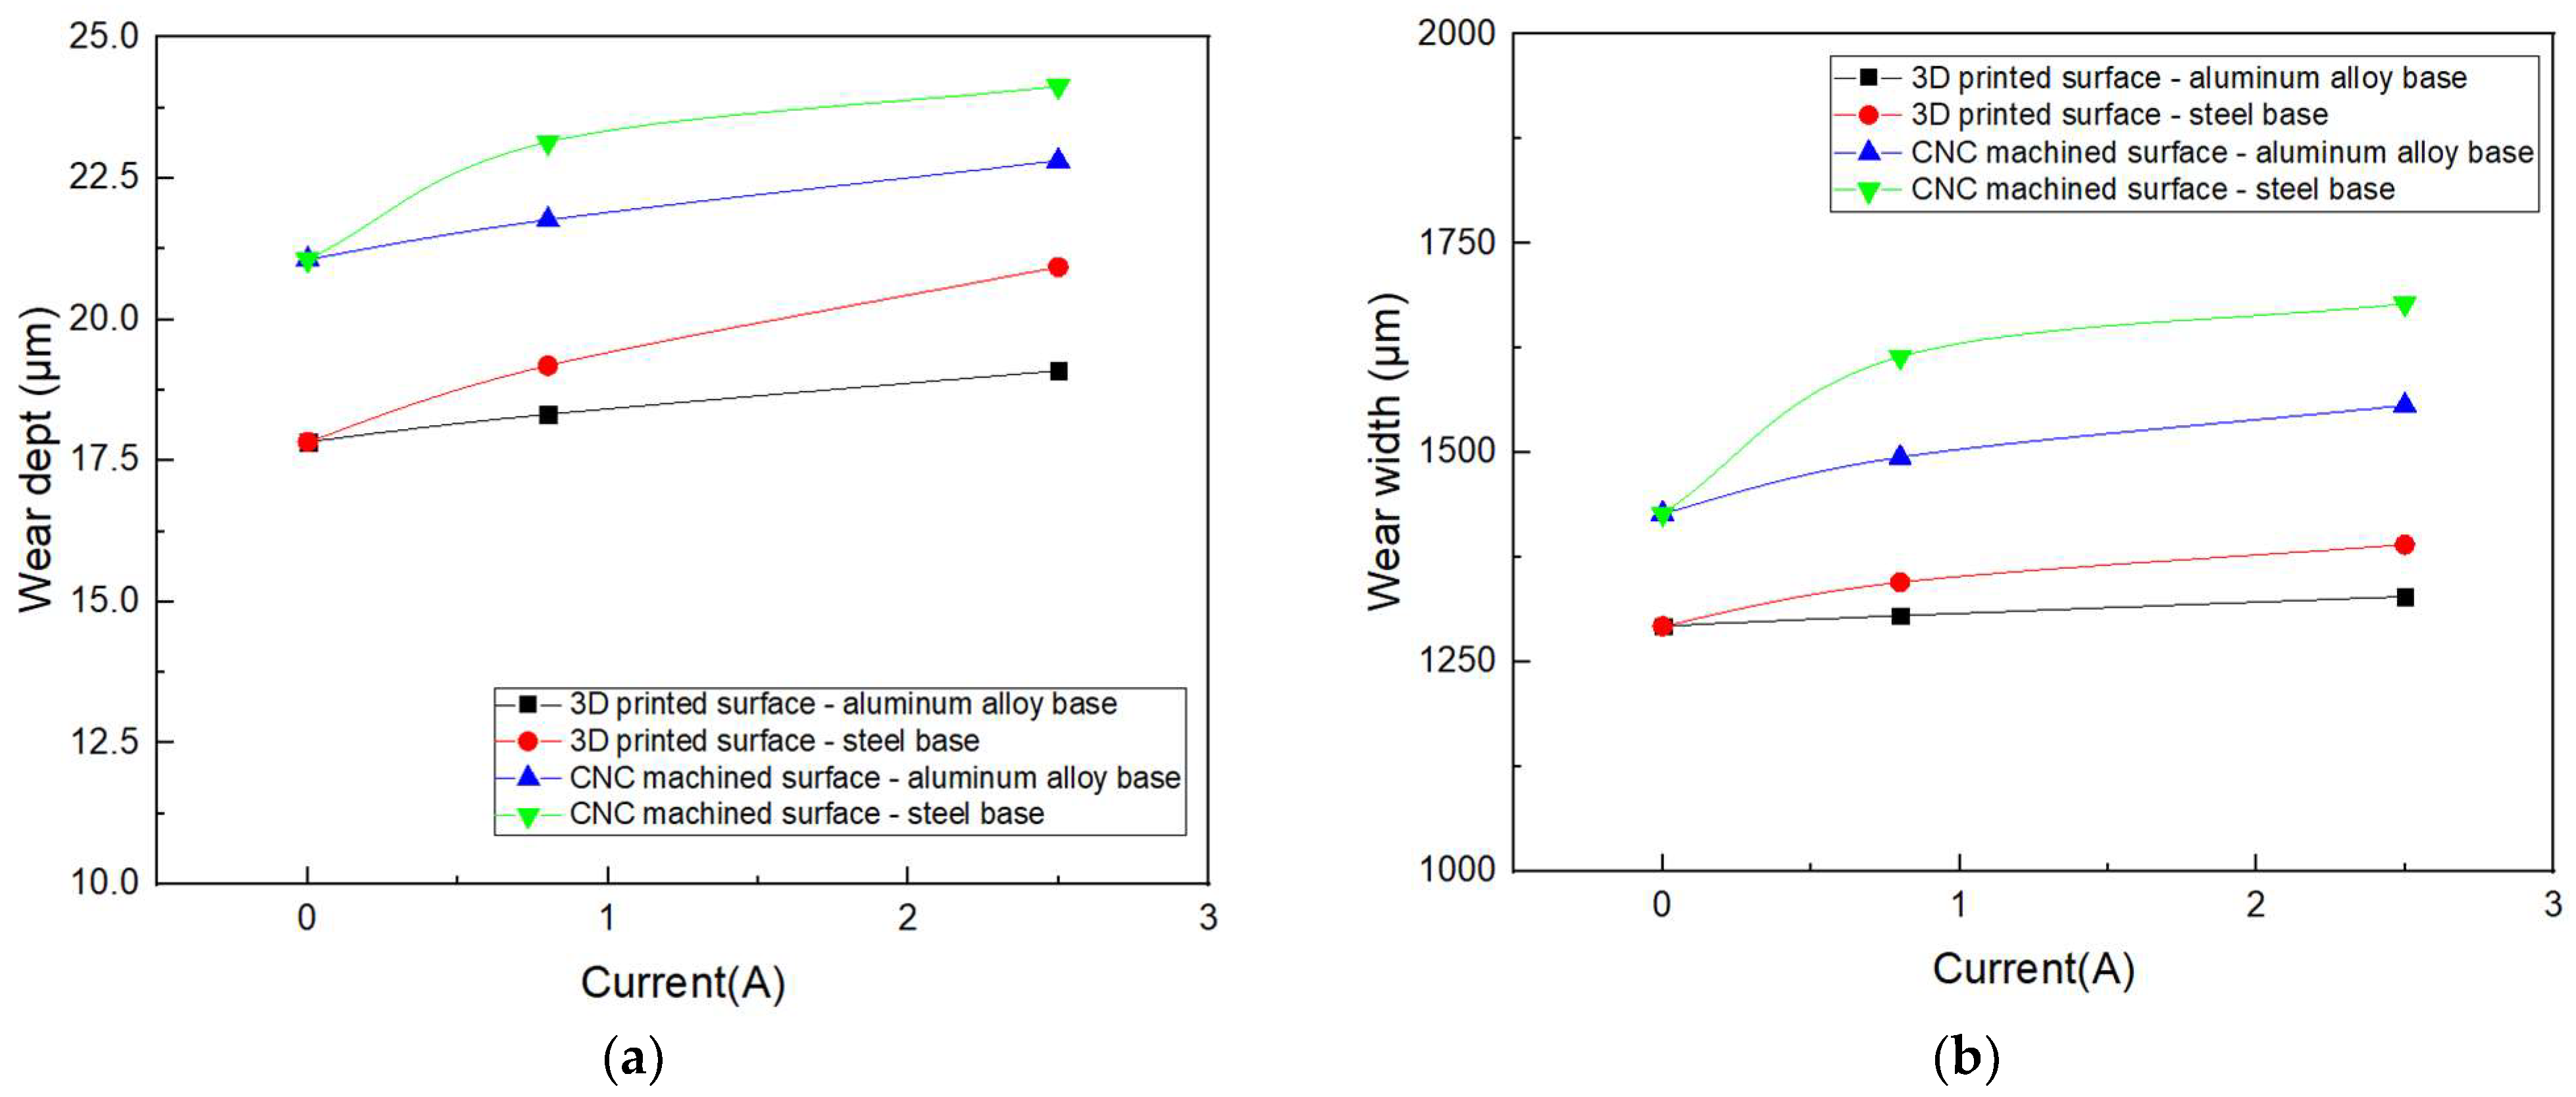
| Surface | Base | Current (A) | Wear Dept (µm) | Wear Width (µm) | ||
|---|---|---|---|---|---|---|
| Avg. | Sta. Dev | Avg. | Sta. Dev | |||
| Metal 3D printing | - | 0 | 17.83 | 0.10 | 1292.84 | 8.43 |
| Metal 3D printing | Aluminum alloy | 0.8 | 18.32 | 0.13 | 1305.36 | 9.71 |
| Metal 3D printing | Steel | 0.8 | 19.18 | 0.18 | 1345.26 | 13.92 |
| Metal 3D printing | Aluminum alloy | 2.5 | 19.09 | 0.12 | 1328.19 | 12.31 |
| Metal 3D printing | Steel | 2.5 | 20.93 | 0.21 | 1390.26 | 14.84 |
| CNC machining | - | 0 | 21.06 | 0.08 | 1427.15 | 6.71 |
| CNC machining | Aluminum alloy | 0.8 | 21.76 | 0.09 | 1494.67 | 7.67 |
| CNC machining | Steel | 0.8 | 23.14 | 0.08 | 1614.64 | 8.98 |
| CNC machining | Aluminum alloy | 2.5 | 22.81 | 0.09 | 1556.49 | 9.04 |
| CNC machining | Steel | 2.5 | 24.13 | 0.14 | 1678.12 | 10.20 |
| Surface | Base | Current(A) | Wear Volume (mm3) | |
|---|---|---|---|---|
| Avg. | Sta. Dev | |||
| Metal 3D printing | - | 0 | 1.7593 | 0.0172 |
| Metal 3D printing | Aluminum alloy | 0.8 | 1.8523 | 0.0184 |
| Metal 3D printing | Steel | 0.8 | 2.0694 | 0.0246 |
| Metal 3D printing | Aluminum alloy | 2.5 | 1.9746 | 0.0228 |
| Metal 3D printing | Steel | 2.5 | 2.6078 | 0.0348 |
| CNC machining | - | 0 | 1.7969 | 0.0054 |
| CNC machining | Aluminum alloy | 0.8 | 1.8699 | 0.0095 |
| CNC machining | Steel | 0.8 | 2.0376 | 0.0106 |
| CNC machining | Aluminum alloy | 2.5 | 1.9879 | 0.0086 |
| CNC machining | Steel | 2.5 | 2.4618 | 0.0118 |
Disclaimer/Publisher’s Note: The statements, opinions and data contained in all publications are solely those of the individual author(s) and contributor(s) and not of MDPI and/or the editor(s). MDPI and/or the editor(s) disclaim responsibility for any injury to people or property resulting from any ideas, methods, instructions or products referred to in the content. |
© 2023 by the authors. Licensee MDPI, Basel, Switzerland. This article is an open access article distributed under the terms and conditions of the Creative Commons Attribution (CC BY) license (https://creativecommons.org/licenses/by/4.0/).
Share and Cite
Li, D.; Li, R.; Lee, C.-H. Effect of Ferromagnetic Metal Base on Friction and Wear of 3D-Printed Aluminum Alloy Surface under Magnetorheological Fluid Action. Lubricants 2023, 11, 273. https://doi.org/10.3390/lubricants11070273
Li D, Li R, Lee C-H. Effect of Ferromagnetic Metal Base on Friction and Wear of 3D-Printed Aluminum Alloy Surface under Magnetorheological Fluid Action. Lubricants. 2023; 11(7):273. https://doi.org/10.3390/lubricants11070273
Chicago/Turabian StyleLi, Deyong, Rui Li, and Chul-Hee Lee. 2023. "Effect of Ferromagnetic Metal Base on Friction and Wear of 3D-Printed Aluminum Alloy Surface under Magnetorheological Fluid Action" Lubricants 11, no. 7: 273. https://doi.org/10.3390/lubricants11070273
APA StyleLi, D., Li, R., & Lee, C.-H. (2023). Effect of Ferromagnetic Metal Base on Friction and Wear of 3D-Printed Aluminum Alloy Surface under Magnetorheological Fluid Action. Lubricants, 11(7), 273. https://doi.org/10.3390/lubricants11070273