Abstract
The major purpose of a gear lubricant is to provide adequate oil film thickness to reduce and prevent gear tooth surface failures. Real time monitoring for gear failures is important in order to predict and prevent unexpected failures which would have a negative impact on the efficiency, performance and safety of the gearbox. This paper presents experimental results on the influence of specific oil film thickness on Acoustic Emission (AE) activity for operational helical gears. Variation in film thickness during operations was achieved by spraying liquid nitrogen onto the rotating gear wheel. The experimental results demonstrated a clear relationship between the root mean square (r.m.s) value of the AE signal and the specific film thickness. The findings demonstrate the potential of Acoustic Emission technology to quantify lubrication regimes on operational gears.
1. Introduction
The rapid development and greatly increased competition in industry has enhanced the importance of gearboxes as vital parts in industrial equipment. Gear failures are generally initiated in the tooth meshing zone. Monitoring for gear failures is important in order to predict and prevent surface failures at their earliest stages. The effectiveness and reliability of a gear depends on its lubricants and the oil film conditions at meshing. Specific oil film thickness (λ), which is the ratio between the oil film thickness (h) and the combined surface roughness (R) of the gears, play a major role in determining the operating life of gears. Maintaining a suitable value for λ helps ensuring good mechanical integrity [1,2]. High λ values (>9.5) are related to full film or hydrodynamic lubrication (HL) which means the solid bodies do not interact. Gears generally operate under lower λ values. Elastohydrodynamic lubrication EHL (h ≈ R), occurs when the λ value lies between 1 and 9.5. In this regime, contact between the asperities is expected to occur; and wear occurs due to physical interaction of both surfaces. Depending on thermal effects and localized pressure peaks, film breakdown occurring at higher asperities may give rise to severe wear, such as scuffing. Boundary and dry lubrication regimes occur at λ values of less than 1. The relationship of different lubrication regimes can be expressed graphically by the “Stribeck Curve” see Figure 1.
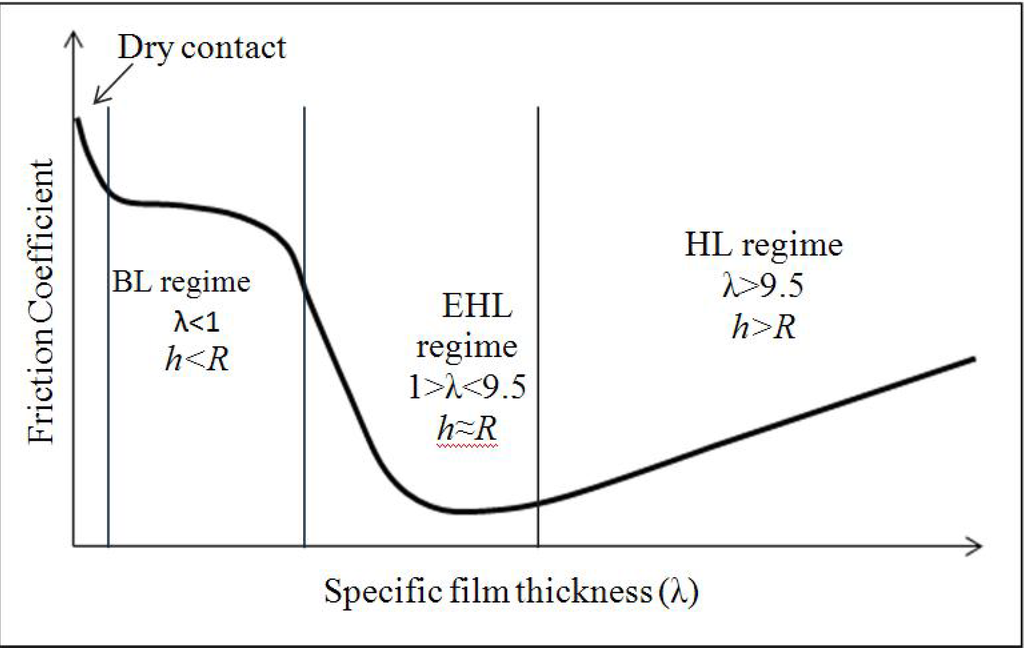
Figure 1.
The Stribeck Curve and specific film thickness (λ).
Elastohydrodynamic (EHL) studies have shown that λ is determined mainly by surface roughness, load, oil temperature and rotational speed of the meshing gears. A change in any one of these parameters will cause λ to change, thus altering the degree of contact between the surface asperities at the gear mesh [3]. It should be noted that helical and spur gears undergo combined rolling and sliding on both sides of the pitch point, and pure rolling at the pitch point. However, due to its geometry, the pitch point contact for the helical gear mesh is progressive, i.e., the pitch point at gear mesh does not occur at the same instance along the width of the gear as in spur gear meshing [4].
Condition monitoring systems for gearboxes based on vibration diagnostics are widely used in industry. The major challenge is the detection of faults in their early stages of occurrence. Vibration systems have shown limitations in detecting incipient faults, whereas the Acoustic Emission (AE) technology, employed in this study has shown potential in detecting faults at an early stage of development [5].
AE is defined as a physical phenomenon occurring within and/or on the surface of materials whereby spontaneous elastic energy is released in the form of transient elastic waves which cover a broad frequency range, typically from 100 kHz to 1 MHz (outside the range of human hearing) [6,7]. Several investigations showed that AE is far more effective as an early indicator for detecting defects in machine components when compared to traditional methods [8].
Bones et al. [9,10] reported that asperity contact for both sliding and rolling metal contact generated AE. That research was extended by Mba et al. [11,12] to include the operation of both spur and helical gears. It was found that the principal AE sources were interactions between asperities on the two surfaces due to their relative motion. The relative proportions of rolling and sliding contact strongly affected the overall level of the AE signal. Ben Abdallah et al. [13] investigated the AE signal from a sliding contact as a function of friction and wear, using a stationary ball sliding over a rotating flat ring. The investigation included dry sliding contact and grease lubrication with presence of small glass particles to simulate contamination. It was found that dry sliding contact generated a continuous AE waveform, the r.m.s value of which was a good measure of the coefficient of friction (μ).
The use of AE for machine condition monitoring has been developing for nearly 50 years; however diagnosis of gearbox faults by application of AE is in its infancy. Mba et al. [14], have provided a comprehensive review of the successful application of AE for condition monitoring of rotating machines and concluded that because there are situations where AE performs much better than vibration monitoring, it is possible that AE could be used to detect incipient faults and the onset of loss of mechanical integrity. If demonstrated this would represent substantial progress in AE monitoring. They noted that the AE signal is characterized by its rapid decay with distance from the source which means that the AE sensor has to be placed in the vicinity of the source to overcome these attenuation problems.
Eftekharnejad et al. [15,16] investigated AE as a means of identifying specific defects seeded onto helical test gears. It was found that the measured AE waveforms were more useful for the detection and identification of the seeded faults than the vibration signals obtained from an accelerometer attached to the bearing pedestal. Toutountzakis et al. [17] used AE for experimentally investigating gear defects. They demonstrated that AE offered a convenient tool for gear health monitoring and showed that AE monitoring using an external sensor placed on the bearing casing was a useful tool for monitoring the health of gears. Raja et al. [18] employed a back-to-back test rig to investigate the effectiveness of operating conditions on AE generation during gear meshing. They established a numerical relationship between observed AE r.m.s, gear speed and load for both spur and helical gears. It was also found that the measured AE r.m.s was sensitive to changes in specific film thickness.
To date, there have been limited investigations focused on studying the relationship between oil lubricants and emitted AE signals from operational gears. For constant temperature conditions, Tan et al. [19] observed that the change in speed had a significant and noticeable effect on the r.m.s level of the AE signal but a change of applied load had little effect. They confirmed that the r.m.s level of the AE signal depended on lubricant film thickness. Subsequently Raja et al. [20] monitored AE levels with changing oil temperature, and it was observed that as the value of (λ) increased the level of AE r.m.s decreased and vice versa. The main focus of previously published work was on the use of the AE technology for the detection of defects on gear tooth surface, and understanding the influence of the operation parameters such as applied load, speed, and surface roughness on the AE signal. Raja et al. [18] focused on the EHL regime only; however the aim of this investigation is to understand how three different lubricating conditions, hydrodynamic (HL), elastohydrodynamic (EHL) and boundary (BL) lubrication influence the generation of AE at the meshing gears. This is the first known attempt that encompasses all three regimes.
In order to achieve these objectives, a specially designed test program was undertaken which involved measuring the AE energy generated during the gear mesh whilst simultaneously varying the specific oil film thickness. The latter was accomplished by injecting liquid nitrogen onto the test gear whilst it was in operation, see Figure 2b. This caused the gear metal temperature to reduce and this reduction also caused the lubricant temperature to reduce, thereby increasing the lubricant viscosity and the specific film thickness. This arrangement allowed the authors to vary the film thickness at the meshing gears in-situ whilst acquiring AE data.
2. Experimental Setup and Procedure
2.1. Experimental Setup
This investigation employed helical gears with a surface finish of 2.5 μm. Mobilgear 636 was used as a lubricant. Table 1, Table 2 show the gear dimensions and Mobilgear 636 specifications. The test-rig employed consisted of two identical oil-bath lubricated gearboxes, connected in a back-to-back arrangement, see Figure 2a. The gearbox can operate at six different torque loadings (60, 120, 180, 250 and 370 nm) and a speed range from 620 to 2800 rpm. The AE sensor employed was a wide-band WD model from Physical Acoustics Corporation with operating frequency range at 100 kHz to 1 MHz. The sensor was placed near to the tooth root of the pinion gear as shown in Figure 2a. The AE sensor was rotating with gear pinion, and measurements were taken via a slip-ring, see Figure 3b.

Table 1.
Lubricant specifications.
| Mobilgear 636 | |
|---|---|
| ISO Viscosity Grade | 680 |
| cSt @ 40 °C | 680 |
| cSt @ 100 °C | 39.2 |
| Viscosity Index, ASTM D 2270 | 90 |
| Pour Point, °C, ASTM D 97 | −9 |
| Flash Point, °C, ASTM D 92 | 285 |
| Density @ 15.6 °C, ASTM D 4052, kg/L | 0.91 |
| Timken OK Load, ASTM D 2782, lb | 65 |
| 4-Ball EP test, ASTM D 2783 | |
| Weld Load, kg | 250 |
| Load Wear Index, kgf | 48 |
| FZG Scuffing, DIN 51534, A/8.3/90, Fail Stage | 12+ |
| Rust protection, ASTM D 665, Sea Water | Pass |
| Copper Strip Corrosion, ASTM D 130, 3 h @ 100 °C | 1B |
| Demulsibility, ASTM D 1401, @ 54 °C Time to 3 mL emulsion, minutes @ 82 °C | 30 |
| Foam Test, ASTM D 892, Seq I and II, Tendency/Stability, mL/mL | 0/0 |

Table 2.
Gear dimensions.
| Gear dimensions | |
|---|---|
| da: tip diameter, pinion | da = 166.65 mm |
| do: base diameter, pinion | do = 150.06 mm |
| d: pitch diameter, pinion | d = 160.65 mm |
| Da: tip diameter, wheel | Da = 226.50 mm |
| Do: base diameter, wheel | Do = 205.97 mm |
| D: pitch diameter, wheel | D = 220.50 mm |
| f: gear face width | f = 25 mm |
| C: center distance | C = 190.58 mm |
| Wheel: 70 teeth | Pinion = 51 teeth |
| σo: base helix angle | σo = 17.75° |
| mn: normal module | mn = 3 |

Figure 2.
Back-to-back gearbox; (a) arrangement of the test-rig; (b) nitrogen tube.

Figure 3.
(a) Acoustic Emission (AE) sensor and thermocouples; (b) Slip ring.
The temperature of the lubricant was reduced by injecting liquid nitrogen onto the wheel gear through a 5 mm diameter steel tube, see Figure 2b. Temperature measurements of the gear metal and lubricant bath were taken with K-type thermocouples, rated from −60 °C to +850 °C, see Figure 3a. The AE sensor and thermocouples were attached to the gear pinion with an adhesive and their cables were fed through the shaft to a silver contact slip ring (D80027/GA electronics ltd), Figure 3b. AE signal loss via the slip ring was measured to be less than 5% in terms of maximum amplitude. The AE signal from the sensor was then pre-amplified at 40 dB. The Data Acquisition System consisted of the “AE Win”. A PCI-2 card was supplied by “Physical Acoustics Corporation” (PAC). AE waveforms were recorded with the MISTRAS AE DSP-32/16 data acquisition card provided by non-destructive testing service MISTRAS group, Inc.
2.2. Experimental Procedure
Two tests were undertaken. The first, Test-1, involved observing AE generation levels under EHL and HL conditions whilst Test-2 involved running from dry conditions through all three lubrication regimes, BL, EHL and HL.
Prior to the start of the first test (Test-1) the gearbox was run for a period of 3 h at 370 nm load and a speed of 670 rpm until the temperature reached thermal balance at 43 °C (−/+ 1 °C). To reduce the lubricant temperature, liquid nitrogen was sprayed onto the rotating wheel gear through a 5 mm diameter steel pipe angled so that no nitrogen directly impinged on the meshing area. While the nitrogen liquid was being sprayed on to the wheel, the temperature and AE r.m.s were measured in real-time, and AE waveforms were captured at different instances during the test. The flow of liquid nitrogen was halted when the temperature of the metal of the gear reached 0 °C. After the supply of nitrogen was stopped the gearbox was allowed to continue operating hence the temperature of the lubricant increased gradually to about the same level as before the liquid nitrogen was introduced.
The second test (Test-2) involved extracting the lubricating oil in the gearbox. To achieve fully dry running conditions the gear teeth surface and gearbox housing were thoroughly cleaned with acetone. The test began by running the gears dry for a period after which oil was slowly injected so that the boundary (BL), elastohydrodynamic (EHL) and hydrodynamic (HL) regimes could be established in succession. The oil was injected through a funnel which was positioned directly above the wheel gear and not at the position at gear mesh.
For both tests the AE r.m.s was measured and recorded in real time over a time constant of 100 ms and at a sampling rate of 100 ms. In addition AE waveforms were recorded every 30 s at a sampling rate of 5 MHz. The AE waveforms captured represented approximately one-quarter of a revolution. The oil viscosity at the measured pinion temperature was calculated by using MacCoull’s equations [21]. The film thickness was calculated from the measured gear temperature, and specific film thickness (λ) for gear metal was obtained by dividing oil film thickness with composite surface roughness (σrms), Dowson and Higginson [1,2,22]. It was assumed the surface roughness remained constant (2.5 μm) throughout the experiment. In this investigation specific film thickness was calculated using the temperature which was measured by thermocouple located on the side of the pinion near the contact area.
3. Results and Discussion
3.1. Test 1: Observations of AE under Lubricated Conditions
Figure 4 shows a typical plot of temperature, specific film thickness and AE r.m.s as a function of time for the first test. It can be seen that at the start of the test (after the gear had run for 3 h and the operating temperature was stable) the AE r.m.s level was constant for approximately 500 s at about 0.155 V, see region A in Figure 4. The corresponding calculated specific film thickness remained below 1 during this period, corresponding to a EHL regime [20,22].
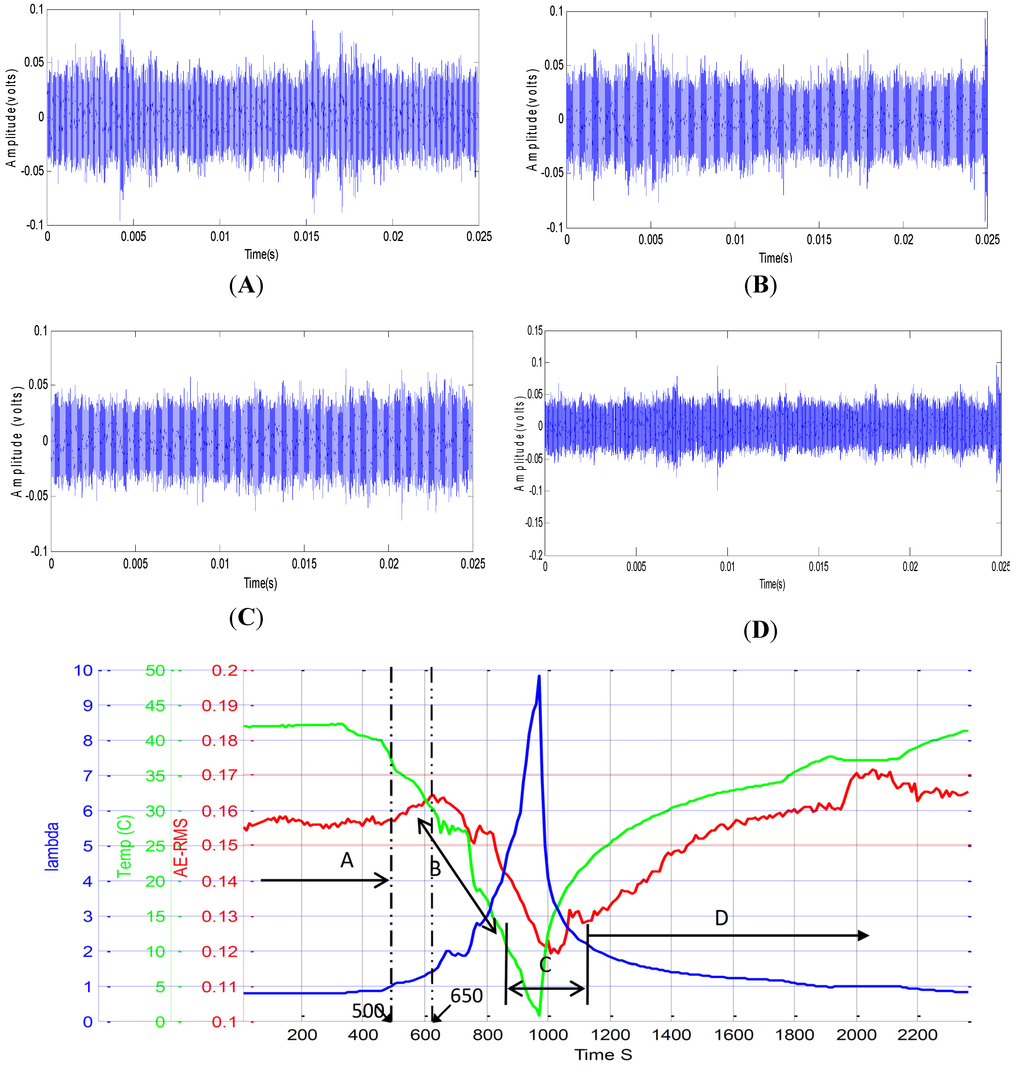
Figure 4.
Influence of gear temperature and specific film thickness on AE r.m.s. (A) Pre-cooling stage; (B) At mid-region of temperature decline; (C) At lowest temperature point; and (D) System returned to initial temperature.
The instant the cooling nitrogen gas was applied (500 s into the test) there was a decrease in gear metal temperature and a rapid fall in AE r.m.s. However, this rapid fall was pre-empted by an initial rise in AE between 500 to 650 s which was attributed to the influence of the cooling on the microstructure of the gear metal, see Figure 4. The drop in AE levels from 650 s was a direct result of the increasing viscosity and film thickness of the oil film at the mesh. The AE r.m.s reached its minimum, approximately 0.12 V when specific film thickness was at its maximum, λ = 9.9. The nitrogen supply was stopped when the gear temperature reached 0 °C. The gearbox continued operating and as such the temperature of lubricant and metal gradually returned to their initial levels, with a corresponding increase in AE levels as the specific film thickness decreased with an increase in temperature, see region C in Figure 4.
Samples of the AE raw waveforms captured at different times during the test are shown in Figure 4. For normal operating conditions (before cooling) the AE waveform showed transient bursts superimposed on a continuous waveform. The rate of generation of the transient bursts corresponded to the gear mesh frequency, see waveform A in Figure 4. Over the time period associated with region B the AE waveform amplitude decreased as specific film thickness increased and the AE bursts were less visible. Waveform C was captured at the minimum temperature region, region C in Figure 4, where specific film thickness was a maximum. At this point the waveform captured showed the lowest amplitude of the AE waveform. It was also noted that the transient bursts were hardly distinguishable from the continuous emissions from background noises such as oil film friction between mating surfaces and supporting bearings in the gearbox.
The reduction in AE amplitude was attributed to no asperity contact at the gear mesh due to increased oil film thickness, similar to what occurs under the hydrodynamic lubrication (HL) regime. At this point the predicted λ value was 9.5, which is considered to be in the HL regime. Hamzah et al. [13] and Bones et al. [14] concluded that asperity contact was non-existent under the hydrodynamic lubrication regime. However, even under HL conditions it is known that shearing of the oil film can generate AE. Mirhadizadeh et al. [23] have confirmed that in a properly maintained HL regime a principal source of AE is the friction in the shearing of the lubricant. After cooling, the system was allowed to return to its original operating conditions and the levels of AE increased as the lubrication regime moved from HL to EHL. As the temperature of the gears increased and the specific film thickness reduced and the transient AE bursts were again observed in the waveform, see waveform D in Figure 4. This confirms that the lubrication regime had now moved from HL back to EHL.
3.2. Test 2: Observations of AE under Unlubricated and Lubricated Conditions
Figure 5 shows AE r.m.s, specific film thickness and temperature as a function of time as the gears go through unlubricated to HL regimes. The rapid increase in AE r.m.s signal during the initial stage of testing, (approximately 1.8 V) was observed due to meshing of the unlubricated gears, see region A in Figure 5. Normally under this condition metal to metal contact dominates. The plot A in Figure 6 shows the AE waveform for dry conditions, it can be clearly observed that the high levels of AE were modulated by the gear mesh frequency. The time intervals between the peaks are corresponded to the gear mesh frequency (520 Hz).
In unlubricated conditions the load is carried by tooth surface asperities which increase friction, energy loss and leads to excessive vibration and destruction of gear teeth [17]. The gears were run dry for 180 s before the addition of a lubricant.
Oil was continuously added to the rotating gear wheel gear at rate of 10 mL/s via a slot in the top gearbox cover. Once the oil touched the wheel teeth and entered the contact area AE r.m.s values decreased rapidly reaching about 0.16 V, see region B in Figure 5, Figure 7. This drop in AE r.m.s was a good indication that the addition of the oil had created a sufficient oil film that caused a reduction in asperity contact.
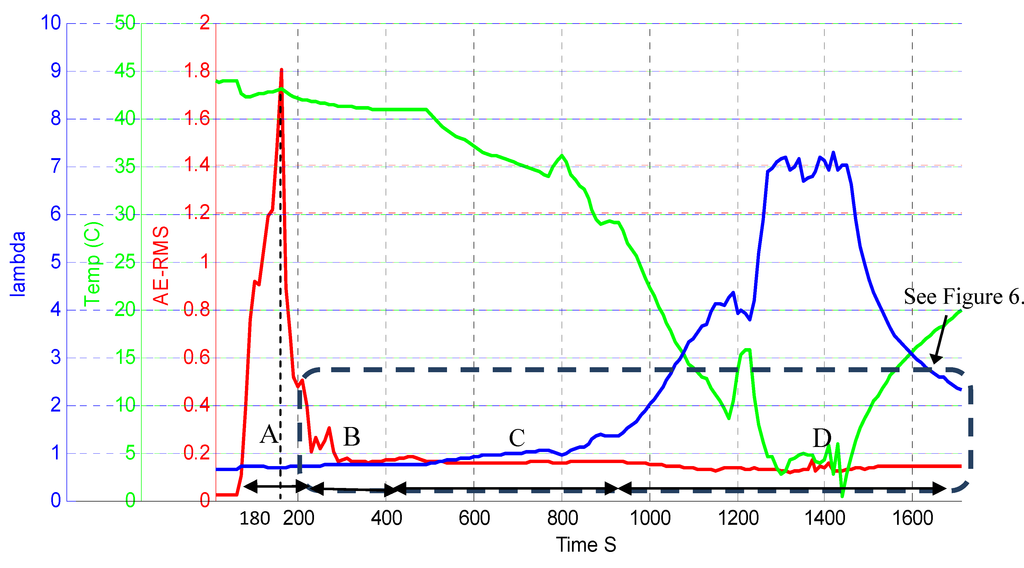
Figure 5.
Influence of gear temperature and specific film thickness on AE r.m.s. Regions started dry, then oil was added and then system cooled: (A) Dry region; (B) Boundary region; (C) Elastohydrodynamic region and (D) Hydrodynamic region.
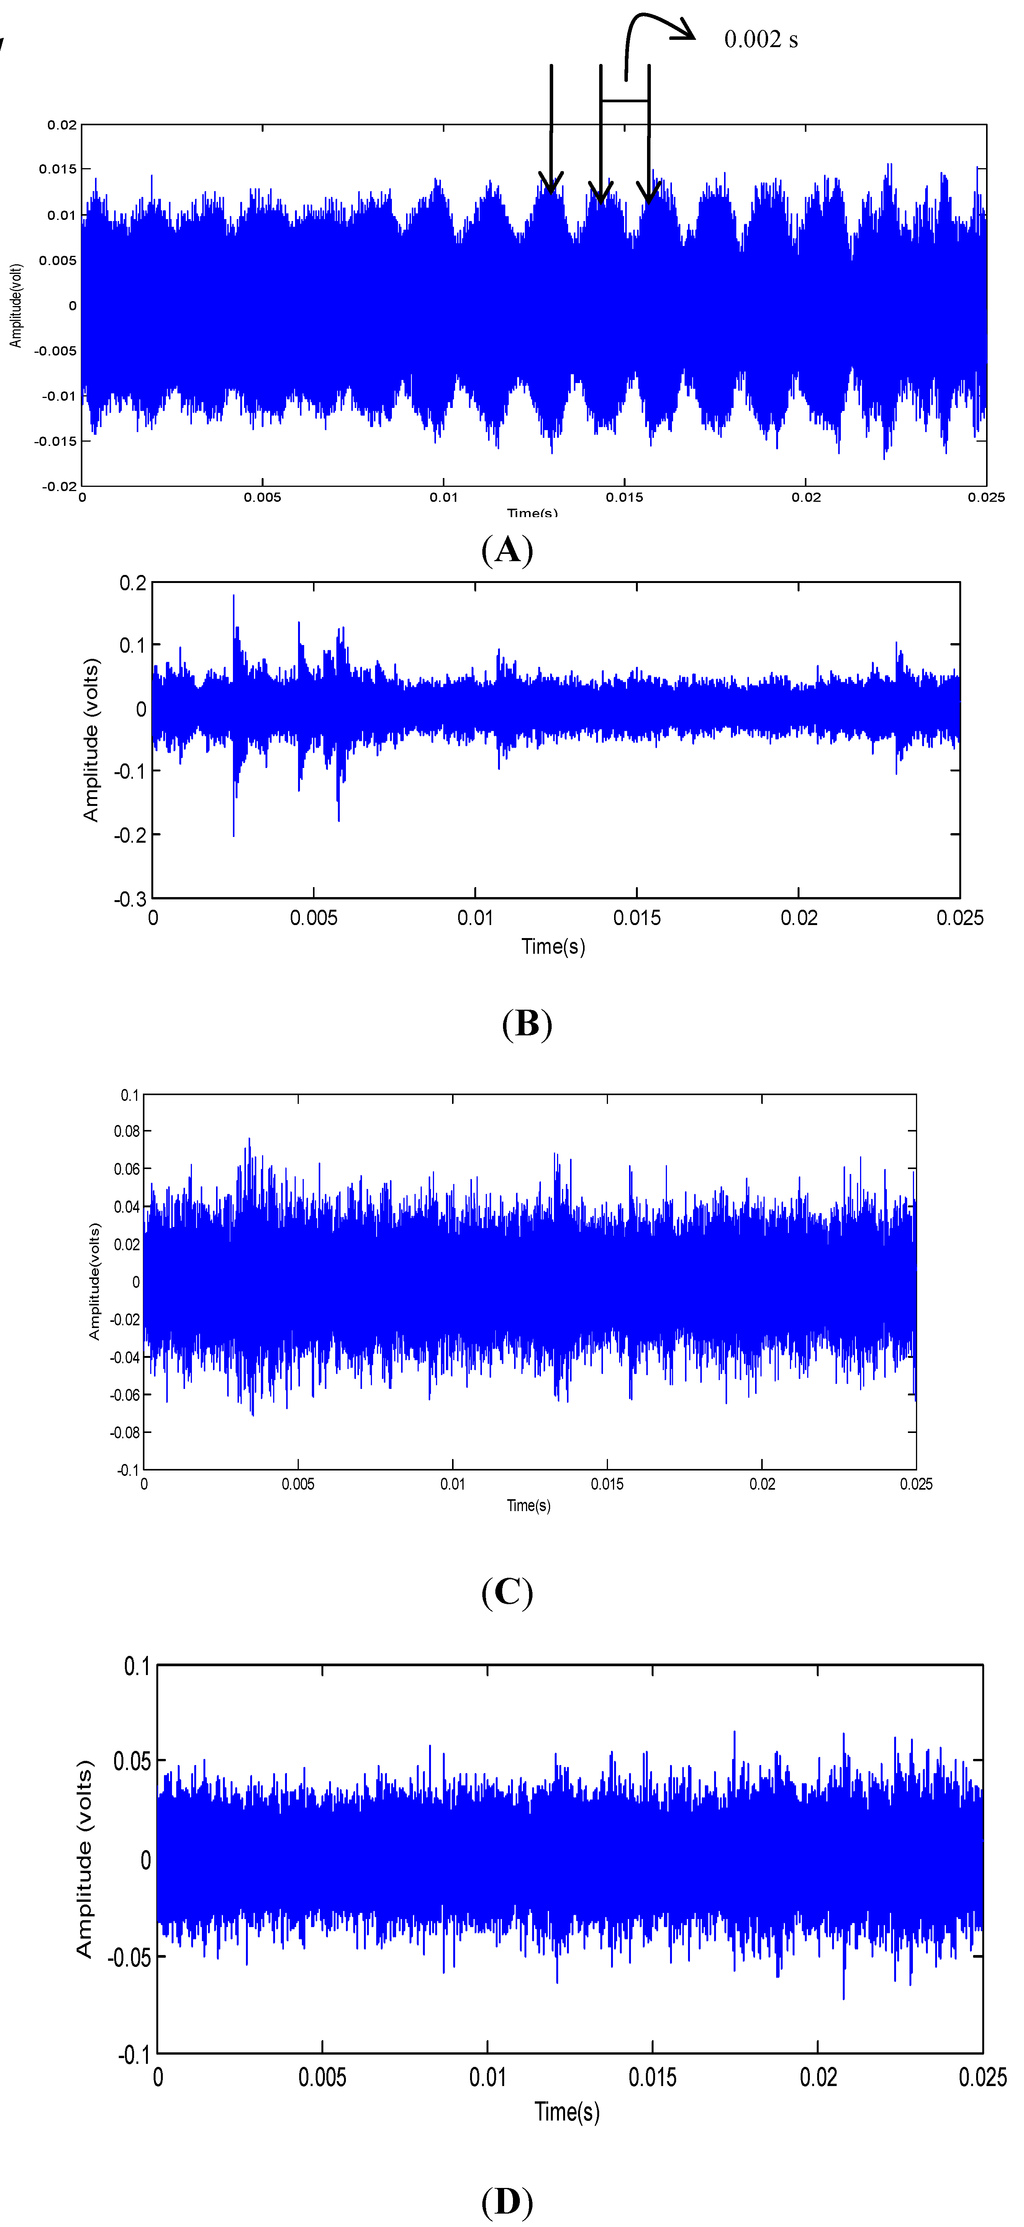
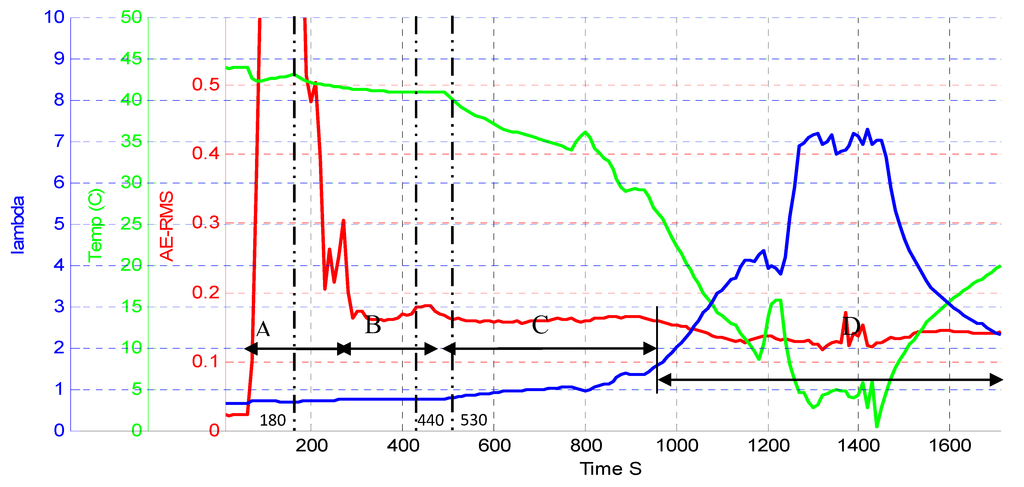
Figure 7.
Influence of gear temperature and specific film thickness on AE r.m.s as in Figure 5 but with enlargement.
Region B of Figure 5, Figure 7 represents the time frame from the instant oil was added to the gearbox to the point where the oil levels had reached a height such that the gear wheel teeth were in continuous contact with the oil in the sump. Within region B, fluctuating levels in AE r.m.s were noted. The calculated λ value was less than 1, suggesting a boundary lubrication regime. In addition, observations of the waveform characteristics associated with this region, see waveform B of Figure 6, showed transient AE bursts at the start of the wave but continuous type characteristics towards the end of the wave. Given it as known that large transient bursts are directly associated with asperity contact at the mesh, this observed characteristic would suggest a contact region of varying levels of asperity contact during the shaft revolution, indicative of a boundary type regime. Region C of Figure 5, Figure 7 is associated with the period when the gears continuously dipped into the oil, i.e., there was now sufficient lubrication supply. The AE r.m.s level in the region was 0.158 V and specific film thickness exceeded unity, λ ≥ 1, see region C in Figure 5 indicative of an elastohydrodynamic regime became dominant.
Subsequently the same procedure as applied with the first test (Test-1) was repeated and very similar results were observed; a decrease in AE r.m.s as specific film thickness increased, and vice versa. These results point to the ability of AE technology to detect and distinguish the difference in oil film thickness and thereby the lubrication regimes (e.g., EHL or HL).
The Kurtosis (K) value was used to compare the effect of film thickness on the acquired AE signatures taken under differing lubrication regimes, see Figure 5, Figure 7. The Kurtosis is a measure of peakness of the AE signatures. It was noted that the highest level of Kurtosis occurred under “dry” conditions. The Kurtosis value decreased as the oil regime proceeded from dry to HL, see Figure 8. Further increases in film thickness resulted in further reductions of Kurtosis values. These results were noted for all experiments and reaffirm the finding that the film thickness influences the generation of AE at the gear mesh.
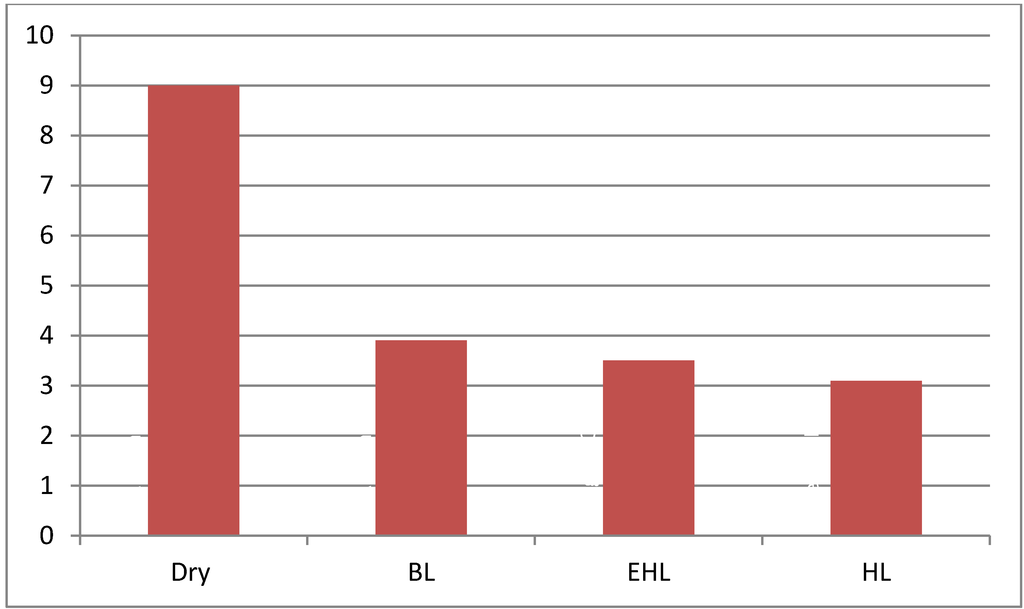
Figure 8.
Kurtosis for AE signals in different oil regimes.
4. Conclusions and Recommendations for Future Work
Results of this study indicate that the direct contact in dry conditions between the helical gears teeth was a significant source of AE energy, confirming that asperity contact is an essential source of AE signals. The results also showed the AE levels could be employed to identify the lubrication film regimes. A reduction in specific film thickness resulted in an increase in AE r.m.s levels and increasing the specific film thickness significantly reduced AE r.m.s levels. The results suggest the potential of AE technology to predict and quantify lubrication film regime under different operating conditions of helical gears.
Acknowledgment
I would like to thank my supervisor David Mba for his support and encouragement during this project.
Conflict of Interest
The authors declare no conflict of interest.
References
- Dowson, D. Elastohydrodynamics and microelastohydrodynamic lubrication. Wear 2005, 190, 125–138. [Google Scholar] [CrossRef]
- Dowson, D.; Higginson, G. Elastohydrodynamic Lubrication, 1st ed.; Pergamon Press: Oxford, UK, 1977; p. 235. [Google Scholar]
- Kutz, M. Mechanical Engineers’ Handbook—Materials and Mechanical Design, 3rd ed.; John Wiley & Sons Inc.: New Jersey, NJ, USA, 2006; p. 840. [Google Scholar]
- Fernandes, P.J.L.; McDuling, C. Surface contact fatigue failures in gear. Eng. Fail. Anal. 1997, 4, 99–103. [Google Scholar] [CrossRef]
- Tan, C.K.; Irving, P.; Mba, D. A Comparative experimental study on the diagnostic and prognostic capabilities of acoustics emission, vibration and spectrometric oil analysis for spur gears. Mech. Syst. Signal Process. 2007, 21, 208–233. [Google Scholar] [CrossRef]
- Miller, R.K.; McIntyre, P. NDT Handbook—Acoustic Emission Testing ; American Society for Nondestructive Testing: Columbus, OH, USA, 1987. [Google Scholar]
- Holroyd, T.J.; Randall, N. Use of acoustic emission for machine condition monitoring. Br. J. Non-Destr.Test. 1993, 35, 75–78. [Google Scholar]
- Toutountzakis, T.; Tan, C.; Mba, D. Application of acoustic emission to seeded gear fault detection. NDT E Int. 2005, 38, 27–36. [Google Scholar] [CrossRef]
- Bones, R. Wear studies using acoustic emission techniques. Tribol. Int. 1990, 23, 291–295. [Google Scholar] [CrossRef]
- Bones, R.; McBride, S. Adhesive and abrasive wear studies using acoustic emission techniques. Wear 1991, 149, 41–53. [Google Scholar] [CrossRef]
- Tan, C.; Mba, D. Identification of the acoustic emission source during a comparative study on diagnosis of a spur gearbox. Tribol. Int. 2005, 38, 469–480. [Google Scholar] [CrossRef]
- Hamzah, R.; Mba, D. Acoustic emission and specific film thickness for operating spur gears. J. Tribol. 2007, 129, 860–867. [Google Scholar] [CrossRef]
- Benabdallah, H.S.; Aguilar, D.A. Acoustic emission and its relationship with friction and wear for sliding contact. Tribol. Trans. 2008, 51, 738–747. [Google Scholar] [CrossRef]
- Mba, D.; Rao, R. Development of acoustic emission technology for condition monitoring and diagnosis of rotating machines: Bearings, pumps, gearboxes, engines and rotating structures. Shock Vib. Dig. 2006, 38, 3–16. [Google Scholar] [CrossRef]
- Eftekharnejad, B.; Mba, D. Acoustic emission signals associated with gears. Appl. Acoust. 2008, 70, 547–555. [Google Scholar] [CrossRef]
- Eftekharnejad, B.; Mba, D. Seeded fault detection on helical gears with acoustic emission. Appl. Acoust. 2009, 70, 547–555. [Google Scholar] [CrossRef]
- Toutountzakis, T.; Mba, D. Observation of acoustic emission activity during gear defect diagnosis. NDT E Int. 2003, 36, 471–477. [Google Scholar] [CrossRef]
- Hamzah, R.; Mba, D. The influence of operating condition on acoustic emission during meshing of helical and spur gear. Tribol. Int. 2009, 42, 3–14. [Google Scholar] [CrossRef]
- Tan, C.; Mba, D. Experimentally established correlation between acoustic emission activity, load, speed and asperity contact of spur gears under partial elastohydrodynamic lubrication. Proc. Inst. Mech. Eng. 2005, 219, 401–409. [Google Scholar]
- Hamzeh, R.I.; Al-Balushi, K.R.; Mba, D. Observations of acoustic emission under conditions of varying specific film thickness for meshing spur and helical gears. J. Tribol. 2008, 130. [Google Scholar] [CrossRef]
- Alexander, D. The viscosity of lubricants. Lubrication 1992, 78, 1–16. [Google Scholar]
- Dowson, D.; Ehret, P. Past, present and future studies in elastohydrodynamics. Proc. Inst. Mech. Eng. 1999, 213, 317–333. [Google Scholar]
- Mirhadizadeh, S.A.; Mba, D. Observations of acoustic emission in a hydrodynamic bearing. J. Qual. Maint. Eng. 2009, 15, 193–201. [Google Scholar] [CrossRef]
© 2013 by the authors; licensee MDPI, Basel, Switzerland. This article is an open access article distributed under the terms and conditions of the Creative Commons Attribution license (http://creativecommons.org/licenses/by/3.0/).