Abstract
HD 50138 is a 6.6 mag emission-line B–type star, whose nature is still controversial. It has been thought to be a pre-main-sequence Herbig Be star and an evolved object with the B[e] phenomenon, possibly a mass-transferring binary system. However, it has mostly been studied on short timescales. We collected ∼1000 medium- and high-resolution spectra and available optical photometric data, which cover a time frame from 1981 to 2025, and extended the study from emission lines to a range of absorption lines. A few episodes of dramatic emission-line strength variations were uncovered as well as fast variations of the absorption line widths on timescales of several days. We also found a few previously unreported fadings of the star’s optical brightness seemingly associated with the Hα line profile changes. At the same time, it is still unclear whether the object is a single star or a binary system, as no regular variations of its observed parameters have been detected.
1. Introduction
HD 50138 (V743 Mon) has been in focus of many researchers for about a century, but its nature and evolutionary status are still a subject of debates. It was first mentioned as an emission-line star with a double-peaked emission in the Hβ line, whose profile exhibited a stronger redshifted peak (violet-to-red peak intensity ratio ) based on two spectra taken in December 1920 by [1]. A few years later, it was included in the first list of B–type stars with emission lines that was compiled to announce the discovery of a new class of stars [2] [Be stars,]. In this list, HD 50138 was classified as a B8e v star with moderately strong Balmer lines, whose profiles varied with a period of ∼12 days.
The first long-term spectroscopic study by [3] based on 76 photographic spectrograms taken between 1920 and 1930 showed strong variations of positions of both absorption (e.g., He i 4471 Å and Mg ii 4482 Å) and emission lines (e.g., H i and [O i] 6300 Å). This study suspected cyclic variations of the positions of different groups of lines with periods of 30 days and 5 years, neither of which was persistent nor consistent with orbital variations. Later, HD 50138 was included in the first Mount Wilson Catalog of stars, whose spectra contain bright hydrogen lines, as MWC 158 [4] and in a list of shell stars that at the time, according to O. Struve meant “a star with an extended atmosphere” [5].
These and more recent spectroscopic investigations of HD 50138 were extensively described to a different extent in [6,7]. The latter two studies analyzed spectra taken with CCDs opposed to mostly photographic plate data of the 20-th century and suspected other cycles in the spectral line variability, but no stable long-term cycles were found. In particular, Borges Fernandes et al. [6] noted an optical brightness drop by mag at the end of the 1970’s and tied it to a possible matter outburst, which was described in [8] based on detection of double-peaked absorption-line profiles in the object’s UV spectrum. This phenomenon was interpreted as the creation of a new circumstellar shell that moved with a different velocity with respect to the previously existing one.
The advent of IR astronomy at the beginning of the 1970’s resulted in a discovery of the IR–excess radiation in the spectral energy distributions (SED) of many emission-line stars (e.g., [9]). In particular, appearance of forbidden emission lines (e.g., [O i] and [Fe ii]) and a large IR-excess due to radiation from circumstellar dust, the features of B–type stars defined as the B[e] phenomenon, landed HD 50138 in the first list of such objects [10].
At the same time, these very properties are similar to those of pre-main-sequence Herbig Ae/Be stars, and the object was sometimes considered a young star (e.g., [11]). Alternatively, based on a too strong an emission-line spectrum for a late B–type star, a fast decline of the IR SED longward of μm, and similarities with most unclassified objects with the B[e] phenomenon, ref. [12] proposed that HD 50138 might be an evolved binary system, whose circumstellar matter was created in an ongoing or past episode of mass-transfer between the stellar components, and included it in a newly defined group of FS CMa type objects.
For nearly 20 years since the introduction of the FS CMa group, some 30% of its ∼50–70 members and candidates were proven to be binary systems see, (e.g., [13,14] for recent reviews). Most of these results were obtained spectroscopically but not for HD 50138, whose binarity was only suggested through spectro-astrometry [15]. The latter method does not allow constraining a binary system’s orbit and consequently refining the knowledge of its evolutionary history. This is why we attempted a longer-term spectroscopic investigation of the object with the aid of all available previously published quantitative information (both spectroscopic and photometric).
In this paper we report new findings on line profile variations, a correlation between the optical brightness and the Hα line strength as well as on a long-term behavior of the latter. The study covers the last 45 years of data taken for HD 50138 and highlights some initial results of their analysis. We anticipate more discoveries in this unprecedented data collection that will be reported in future papers.
2. Observations
Our spectroscopic data have been taken at various telescopes equipped with spectrographs, which are referenced in Table 1 along with the numbers of obtained spectra and time intervals covered. The references typically contain information about data reduction, which was done using all the standard procedures. They included bias subtraction, wavelength calibration, separation of spectral orders, and intensity normalization to the local continuum. Flat fielding was not performed for the OAN SPM and TCO data (see Table 1 caption for the acronyms). Since the Hα line in the spectrum of HD 50138 is very strong, many spectra were taken with two sets of individual exposures: a set of shorter exposures in order not to saturate the Hα and a set with longer exposures with the saturated line but more counts in the continuum.
Also, for this study we gathered all published optical photometric and high-resolution spectroscopic data. The sources of optical photometry taken before the year 2000 are listed in Table 2 of [6]. We complemented these data sets with those from the HIPPARCOS mission (1989–1993 [16]), the ASAS–3 database (V–band, 2000–2009 [17]), and our unpublished multicolor photometry taken at a 0.5 m telescope of the South-African Astronomical Observatory (SAAO) in 1998 (with the photometer described in [8]) and a 1 m telescope of the Tien-Shan Astronomical Observatory (TShAO) located near Almaty, (Kazakhstan 1996–1999, see, e.g., [18] for the instrument description).
Our SAAO photometry was taken in the Johnson-Cousins system (), while the TShAO data were taken in the original Johnson system [19]. The HIPPARCOS photometric data were translated to the Johnson V–band magnitudes using formulae from [20]. The ASAS–3 data taken at 5 different telescopes on each day were averaged. The Kamogata/Kiso/Kyoto Wide-field Survey (KWS) has been recording the object’s brightness since 2010 with two observations taken on most nights which we have averaged. The entire V–band data collection is shown in the bottom panel of Figure 1.
Unfortunately, the star is too bright for the ongoing ASAS SN survey, but the TESS space telescope observed it in three sectors for nearly a month each. TESS data were taken through a red filter, which is centered on the effective wavelength of the Cousins –band (786.5 nm), and retrieved using the TESSExtractor software developed in [21]. The data are shown in the bottom panel of Figure 1 shifted by 0.15 mag to roughly match the V–band data, as a typical color-index see, e.g., [22] varied around this value irrespective of the brightness level, and in Figure 2 in the original TESS magnitudes.

Table 1.
Spectroscopic Observations of HD 50138.
Table 1.
Spectroscopic Observations of HD 50138.
| Observatory | Dates | Telescope/Spectrograph/Location | R | Range (Å) | # sp | Ref. |
|---|---|---|---|---|---|---|
| Mauna Kea | 2004–2022 | 3.6 m, CFHT, ESPaDoNs, Hawaii | 65,000 | 3800–10,500 | 10 | [23] |
| OAN SPM | 2005–2019 | 2 m, REOSC, Baja California, Mexico | 18,000 | 3700–7300 | 32 | [24] |
| McD | 2005–2012 | 2.7 m, TX, USA | 60,000 | 3700–10,500 | 5 | [25] |
| IAO | 2018–2019 | 2 m, HCT, Hanle, India | 25,000 | 4200–10,500 | 3 | [26] |
| ORLM | 2010–2021 | 1.2 m, HERMES, La Palma, Spain | 85,000 | 3800–9000 | 84 * | [27] |
| APO | 2020–2023 | 3.5 m, ARCES, NM, USA | 31,500 | 3600–10,500 | 5 | [28] |
| TCO | 2011–2025 | 0.81 m, Eshel, NC, USA | 12,000 | 3800–7800 | 427 | [29] |
| La Luz | 2023–2024 | 1.2 m, TIGRE, Guanajuato, Mexico | 25,000 | 3750–8750 | 12 | [30] |
Notes: R—resolving power, # sp—total number of spectra taken, Ref.—references to descriptions of the spectrographs. Observatory IDs: OAN SPM—Observatorio Astronómico Nacional San Pedro Martir; CFHT—Canada–France–Hawaii Telescope; McD—McDonald Observatory; ORLM—Observatorio del Roque de Los Muchachos; APO—Apache Point Observatory; TCO—Three College Observatory; HCT—Himalayan Chandra Telescope at the Indian Astronomical Observatory. *—a total of 384 individual spectra were taken in 84 nights.

Figure 1.
Top panel: V/R peak intensity ratio of the Hα line. Symbols: black—data from literature, blue—Ritter Obs., red—Ondřejov Observatory [7], magenta—OAN SPM, maroon—HERMES, indigo—BeSS, orange—TCO data. Middle panel: Equivalent width of the Hα emission lines in 1981–2025. Symbols represent the same datasets as those on top panel. Bottom panel: V–band light curve. Symbols: black—[31], red—[22], orange—[32], indigo—ASAS–3, turquoise—HIPPARCOS, blue—SAAO unpublished, magenta—TShAO unpublished, cyan—KWS [33], and green—TESS (corrected by +0.15 mag to roughly match the V–band brightness level, barely seen through the KWS data, see text for explanation). Vertical dashed lines show central times of the three deepest brightness minima recorded in the ASAS–3 and KWS databases. Red lines with arrowheads show smaller fadings well covered with spectroscopy that show simultaneous increase of the ratio.


Figure 2.
TESS photometry taken in Sectors 6 (left panel, 16 December 2018–6 January 2019, cadence 30 min), 33 (middle panel, 18 December 2020–13 January 2021, cadence 30 min), and 87 (right panel, 24 December 2024–18 January 2025, cadence 200 s).
Figure 2.
TESS photometry taken in Sectors 6 (left panel, 16 December 2018–6 January 2019, cadence 30 min), 33 (middle panel, 18 December 2020–13 January 2021, cadence 30 min), and 87 (right panel, 24 December 2024–18 January 2025, cadence 200 s).

3. Results
The visual light curve of HD 50138 shows brightness variations within ∼0.5 mag, but most of the time the star is in a bright state with mag. The TESS data (see Figure 2) present fast variations with a timescale of a few days and an amplitude of ∼0.05 mag. Neither data set exhibits a strictly regular variability.
As mentioned above, the first noticeable fading in 1982–1983 was recorded in [22] and discussed in [6] as a possible consequence of a 1979–1980 outburst suggested in [8]. Only one visual spectrum [34] that covered the Hα line, which showed a relatively low equivalent width (EW) and an average , was published during this brightness minimum (see top and middle panel of Figure 1).
Two other brief fading episodes, shown in the bottom panel of Figure 1 by vertical dashed lines, were captured by the ASAS–3 survey in March 2007 (∼JD 2454175) and in April 2008 (∼JD 2454580). Several spectra [7] were taken during the first one, which lasted ∼20 days. The Hα line EW was somewhat larger than average (70–80 Å), but this enhancement can be explained by a lower continuum level. At the same time, the ratio exhibited a small increase from ∼0.6 to ∼0.7.
The second fading by mag lasted for ∼35 days but was not covered by spectroscopic observations. Interestingly, the spectrum taken at OAN SPM on 4 October 2008, nearly 5 months later showed a rarely observed not only in the Hα line, but in other Balmer lines and a number of Fe ii lines (see Figure 3). However, the spectrum taken there on 10 October 2008, only six days after the first one, showed a reversal of the ratio in the higher members of the Balmer series (starting from Hβ) and the Fe ii lines, while the Hα lines kept . Also, a number of absorption lines were split into two components (e.g., Fe ii 4923 Å shown in Figure 3, and Ca ii 3933 Å).
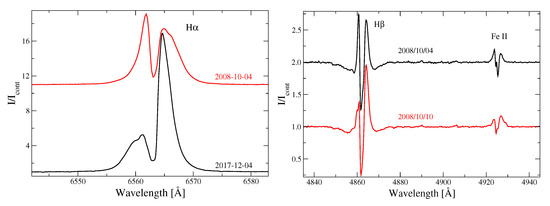
Figure 3.
Left panel: Hα line profiles with very different V/R intensity ratios taken at OAN SPM on the nights shown by each profile. Right panel: Hβ and Fe ii 4923 Å line profiles taken in October 2008, when the Hα lines had . The line profiles are normalized to the local continuum and shifted with respect to one another for a better viewing. The wavelength scale is heliocentric.
The latest strong fading recorded in the KWS database was centered on 21 January 2020 and lasted for ∼20 days. This episode was well covered with spectroscopy from three observatories (TCO, ORLM, and APO). The V–band light curve from the KWS database along with the Hα line dynamics observed around this time are shown in Figure 4. The Hα line profile began changing nearly simultaneously with the V–band brightness: the total energy emitted in the line dropped by ∼40% (EW measured around the strongest fading was about the same as before this time due to the weaker continuum) and the intensity ratio rose to ∼1. When the brightness came back to the normal level, the Hα line parameters (EW and ) followed within about a month.
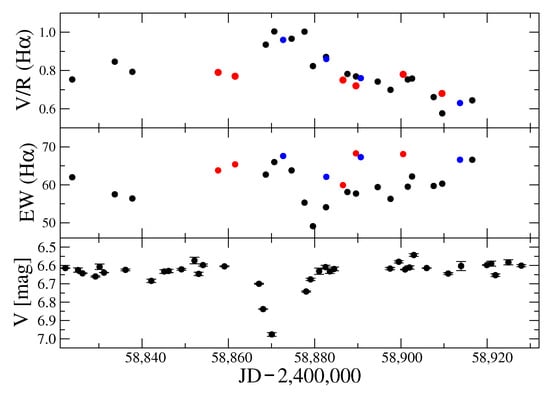
Figure 4.
The visual brightness minimum around 21 January 2020. Top panel: V/R peak intensity ratio of the Hα line. Symbols: black—TCO, red—HERMES, blue—APO. Middle panel: Hα EW in Angstöms. Symbols represent the same datasets as those on top panel. Bottom panel: Part of the V–band light curve from KWS data.
There are a few other, smaller fadings (shown by the red arrowhead lines in Figure 1) well covered with spectroscopy which were accompanied by nearly simultaneous increases of the ratio in the Hα emission line. This phenomenon is observed during all the fadings.
Another phenomenon detected in a number of spectra in the entire range of the spectral resolutions in our collection is line splitting (see Table 1). Although a clear splitting of pure absorption lines, such as that shown in the left panel of Figure 4, was not frequently observed (e.g., in 10 HERMES spectra, only one OAN SPM spectrum, and a handful of TCO spectra), a variable broadening of many absorption lines occurs on a timescale of days (see right panels of Figure 5 and Figure 6).
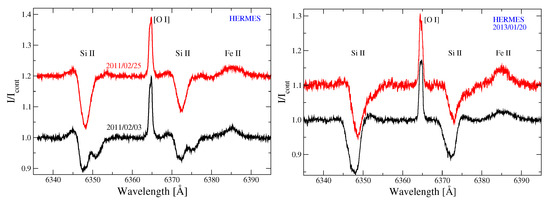
Figure 5.
Line profile variations at the highest spectral resolution (R = 85,000). Left panel: Si ii 6347 & 6371 Å line profiles in two spectra taken with the HERMES spectrograph. Right panel: Comparison of the Si ii line profiles in HERMES spectra taken on 20 January 2013 (JD 2456313). Both spectra are averaged from two subsequent 600-s exposures taken 23 min apart on JD 2456313.597 (black line) and JD 2456313.613 (red line). The profiles are normalized to the local continuum and shifted with respect to one another for a better viewing. The wavelength scale is heliocentric.
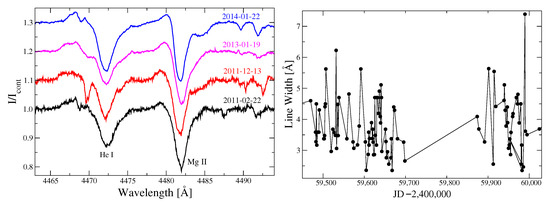
Figure 6.
Left panel: Examples of the variations of some absorption line profiles: He i 4471 Å and Mg ii 4482 Å taken with the HERMES spectrograph. Corresponding dates (year/month/day) are shown at each spectral part. The profiles are normalized to the local continuum and shifted with respect to one another for a better viewing. The wavelength scale is heliocentric. Right panel: Variations of the full-width at the continuum level of the Mg ii 4482 Å line from the TCO spectra taken between September 2021 and March 2023.
Examples of the variability of the He i 4471 Å and Mg ii 4482 Å line profiles are also shown at the highest resolution in the left panel of Figure 6. Temporal and seemingly irregular appearance of weak moving satellite absorption lines is obvious due very high signal-to-noise ratios in the continuum (∼200–400). Examples of fast emission–line profile variations, which include discrete absorption components (e.g., in Hβ) are shown in Figure 7.
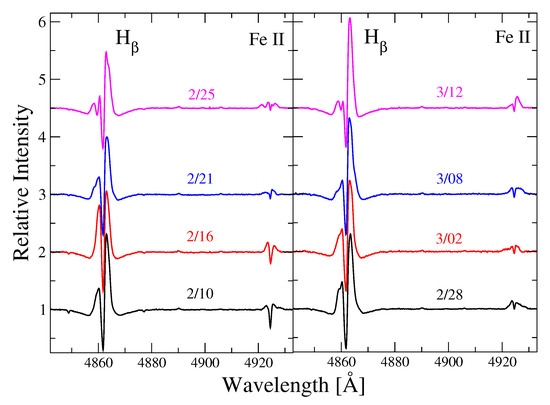
Figure 7.
Short-term variations of some emission line profiles: Hβ and Fe ii 4923 Å taken at TCO in February–March 2025. Corresponding dates (month/day) are shown at each spectral part. The profiles are normalized to the local continuum and shifted with respect to one another for a better viewing. The wavelength scale is heliocentric.
Overall, the emission-line spectrum of HD 50138 is getting stronger with time over the studied period. It is especially noticeable since the time of the fadings detected by ASAS–3 when a significant drop of the Hα EW has occurred (see Figure 1). The TCO data show a gradual increase of the average Hα line EW in the last ∼15 years. This process is illustrated in the left panel of Figure 8, where are only the measurements from the TCO spectra with unsaturated Hα line profiles are summarized. A Lomb-Scargle periodogram for these data with a linear trend removed calculated through a publicly available tool PGRAM (https://exoplanetarchive.ipac.caltech.edu/cgi-bin/Pgram/nph-pgram accessed on 22 October 2025) shows a strong but wide peak at a period of 615.83 days. The de-trended data folded with this period are shown in the right panel of Figure 8.
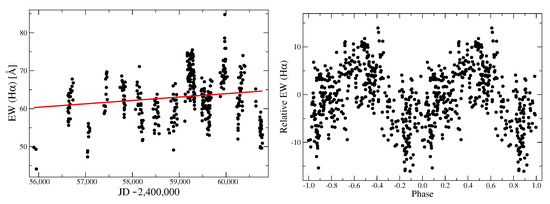
Figure 8.
Left panel: Variations of the Hα line EW in the TCO spectra. The EW in Å is plotted against time (2012–2025). The red line shows a linear trend in the plotted data. Right panel: The same data set with a linear trend removed folded with a period of 615.83 days that corresponds to the highest peak in the power spectrum (see Section 3). The zero-point of phases is arbitrarily chosen to be the date of the first TCO observation.
At the same time, the KWS data show a steady growth of the visual brightness by ∼0.1 mag since 2010. Combined with the TCO data on the Hα ine, this indicates an increase of the amount of circumstellar gas in the disk of HD 50138 that contributes to the optical continuum.
4. Discussion
The phenomena described above reveal a complicated dynamics of the circumstellar gas, which is responsible for the creation of the emission features. It can also play a role in altering the absorption line profiles created in the stellar atmosphere. However, processes operating within the star may also be involved. One of them is the magnetic field action recently discovered in another object that belongs to the FS CMa group, IRAS 17449+2320 [35]. The magnetic field manifests itself in splitting a number of absorption lines in the spectrum of the latter object (e.g., C i, N i Mg i, Fe ii).
HD 50138 demonstrates some line splitting as well, but the observed features of this phenomenon are very different from those in IRAS 17449+2320. The absorption lines in the spectrum of IRAS 17449+2320 are much narrower than those in HD 50138, and the former is noticeably cooler than the latter (Teff K versus ∼ 13,000 K). As a result, the split lines can be resolved at a smaller separation of the components (0.1 to 0.5 Å) in IRAS 17449+2320. In the spectrum of HD 50138, a clear splitting is detected at the line components’ separation of ∼3 Å ( km s−1, see left panel of Figure 4). If such a large separation is attributed to magnetic field, it would require a field strength of ∼160 KGauss, which is much larger than that of any known magnetic Bp/Ap star [36].
As shown in Figure 5, absorption lines in HD 50138 exhibit a very fast and seemingly irregular temporal width variations, while IRAS 17449+2320 displays regular appearance of redshifted absorption components with a period of 36 days connected to the star rotation [37]. We note that the line profile distortion occurs only on the red edge in both objects. Given the faster rotation period of HD 50138 (∼2 days, see below), it cannot be excluded that rotation is the cause of this variability. So far, we have multiple observations for only a few nights, none of which covered those when the splitting was the largest.
There are several periods of 2–3 nights, when HERMES spectra were continuously taken during a few hours. We measured the full-width at the continuum level (FWCL) and EW) of the Si ii lines (6347 and 6371 Å), which showed large and variable broadening in many spectra. Only small variations were found on some nights. For instance, 37 spectra taken during 6 h on 18 January 2013 with an average signal-to-noise ratio of 150–200 in the continuum between the two Si ii lines showed a broad 6347 Å line with an average EW of 0.47 ± 0.03 Å and an average FWCL of 7.2 ± 0.5 Å. However, 18 spectra continuously taken during 5 h on 20 January 2013 showed a sudden jump of both parameters in the last two spectra. In particular, EW changed from 0.46 ± 0.03 to 0.52 ± 0.01 Å and FWCL changed from 5.87 ± 0.15 to 7.8 ± 0.3 Å (see right panel of Figure 5).
The emission-line strength in the spectrum of HD 50138 is obviously much larger than that in many classical Be and Herbig Ae/Be stars of similar Teff see, e.g., [38]. The object’s fundamental parameters were typically estimated from the absorption-line properties. Frémat et al. [39] list Teff = 12,500 K, surface gravity log g = 3.27, projected rotational velocity = 70 km s−1 (using the He i 4471 Å and Mg ii 4482 Å lines), and rotational axis inclination angle . However, these authors mentioned that the spectrum of HD 50138 was considered difficult to model due to the presence of numerous emission lines and that their results could be inaccurate.
Borges Fernandes et al. [6] used both spectroscopic and multicolor photometric data along with estimating a contribution from circumstellar and interstellar extinction to derive the star’s fundamental parameters. They concluded that HD 50138 has a Teff K and assigned it an MK type of B6/7 iii/v. Although other estimates of the object’s Teff were published (e.g., 9450 K [40] or even 6392 K [41]), the above mentioned values are obviously more reasonable because of the presence numerous He i lines that are typical of the B–type star’s spectra.
The second paper by Borges Fernandes et al. [42] devoted to HD 50138 reports IR interferometric data, which were used to derive the inclination angle of the circumstellar disk (). In the third paper of this series, these authors [43] used a set of 8 HERMES spectra (which are part of our collection) to address short-term variations of the absorption lines. They concluded that the variations were possibly caused by pulsations, and measured a projected rotational velocity = 74.7 ± 0.8 km s−1 from the He i 4026 Å line profiles recorded in 4 highest quality spectra. Combining this result with the inclination angle, they calculated a full rotational velocity of the star to be 90.3 ± 4.3 km s−1.
This rotation rate in combination with the Gaia DR3 distance pc, [44] and a luminosity of log L/L⊙ = 2.7 ± 0.1 leads to a star’s rotation period of ∼2 days (given the uncertainty in the Teff). The luminosity is calculated from the average brightness in the normal state , Teff quoted above and a corresponding bolometric correction [45], and an interstellar extinction mag [6]. It does not take into account a possible circumstellar contribution (e.g., due to free-free and free-bound radiation), but such a correction would not make a significant change of the object’s position in the Hertzsprung-Russell diagram (see Figure 16 in [6]). The position is close to the terminal-age main-sequence for a 4–5 M⊙ star and roughly a half-way between the birthline and the zero-age main-sequence if considered as a 5–6 M⊙ pre-main-sequence star. However, its a too strong emission-line spectrum and a fast declining toward longer wavelengths IR excess contradict both possible single-star solutions. At the same time, detection of the putative secondary companion remains elusive.
The detected absorption-line profile variations shown in Figure 5 and Figure 6 may be attributed to a combination of the stellar rotation and variable mass ejection from the stellar surface and falling back on it manifested by temporal appearance of weak emission components on both sides of the line profiles. At the same time, these effects make measurements of the radial velocities very complicated and uncertain. Our initial attempts to conduct such measurements in several spectral regions resulted in a large scatter of values (between ∼20 and ∼100 km s−1) and finding no regular patterns.
Double-peaked emission-line profiles of early-type stars with peak intensity ratios noticeably less than 1 are typically interpreted as being formed in at least two-component circumstellar media that include a disk and a more extended envelope formed by stellar wind [46]. A disk alone produces a profile with two nearly equal peaks, whose intensity ratio slightly varies in binary systems due to density enhancements orbiting in sync with the secondary component (see [47], for binary Be stars).
HD 50138 is a relatively cool star that typically generates a weak stellar wind compared to those of early B–type stars. Therefore, it can be suggested that the weaker blue-shifted components of the emission-line profiles may be due to the radiation passing through a part of the dusty disk. On the other hand, the observed episodes of the ratios may manifest an increased stellar wind probably triggered by occasional matter outbursts from the star’s surface, whose cause is still unclear. We note here that the Hα line EW variations (see right panel of Figure 8) are most likely quasi-periodic because of a large data scatter around the nearly sinusoidal average curve. They may be caused by some rotating density enhancements in the circumstellar gaseous disk which may change their orbits with time. Slower and aperiodic Hα EW variations were noticed in earlier spectroscopic data (included in our collection shown in Figure 1) by Jeřábková et al. [7].
5. Conclusions and Future Studies
In summary, our spectroscopic monitoring of HD 50138 for the last two decades combined with older data and long-term photometric observations showed a number of previously unnoticed phenomena. These include fast variations of the absorption and emission line profiles and clear splitting of some of them, detection of a new possibly quasi-periodic variations of the Hα line EW, and more optical brightness fadings.
The previous studies quoted above dealt with much smaller data sets taken over short periods of time than this study. Our analysis of the data collected over the last 40 years indicates no significant changes to the fundamental parameters of the underlying star. At the same time, even such a large and high-quality spectroscopic material did not allow us to unambiguously conclude on the object’s binarity, which sometimes can be discovered with just a few spectra see, e.g., [48]. HD 50138 might also be a result of a merger in a binary system, as suggested in [49] for some FS CMa–type objects, but we currently do not see any clear confirmation to this scenario.
Although it is currently unclear what causes the line profile variations, it is obvious that HD 50138 is a very active star that requires more attention, which needs to include at least frequent medium-resolution spectroscopy and multicolor photometry. The latter can be done with small telescopes even by amateurs, because the star is bright ( mag) and typically above the saturation limit of automatic sky surveys (e.g., ASAS SN). We continue the spectral monitoring from TCO and try organizing a campaign to extend the yearly coverage and include contemporaneous photometric observations.
Author Contributions
Observations, A.S.M., S.V.Z., S.D., N.M., A.A.K., A.N.A., H.V.W., A.R., G.R. and S.D.C.; Data reduction, A.S.M., S.V.Z., H.V.W., A.R., G.R. and S.D.C.; Data analysis, H.B. and A.S.M.; Software A.S.M.; writing—original draft preparation H.B. and A.S.M.; writing—review and editing, H.B., A.S.M., S.V.Z. and S.D. All authors have read and agreed to the published version of the manuscript.
Funding
The work is carried out within the framework of the Project No. BR24992759 Development of the concept for the first Kazakhstani orbital cislunar telescope—Phase I, financed by the Ministry of Science and Higher Education of the Republic of Kazakhstan. This research was funded by the Science Committee of the Ministry of Education and Science of the Republic of Kazakhstan (Grant No. AP19175392). S.Z. acknowledges PAPIIT grants IN102120 and IN119323.
Data Availability Statement
The spectral and photometric are available on request via email at a_mirosh@uncg.edu.
Acknowledgments
This research has made use of the SIMBAD database, operated at CDS, Strasbourg, France; SAO/NASA ADS, ASAS, and Gaia data products. This paper is partly based on observations obtained at the Canada-France-Hawaii Telescope (CFHT), which is operated by the National Research Council of Canada, the Institut National des Sciences de l’Univers of the Centre National de la Recherche Scientifique de France, and the University of Hawaii, 3.5 m telescope of the Apache Point Observatory (NM, USA), 2.7 m Harlan J. Smith telescope at the McDonald Observatory (TX, USA), the 2.1 m telescope of the Observatorio Astronómico Nacional San Pedro Martir (Baja California, Mexico), the 2 m Chandra Himalayan Telescope (Hanle, India), the Mercator Telescope, operated on the island of La Palma by the Flemish Community, at the Spanish Observatorio del Roque de los Muchachos of the Instituto de Astrofísica de Canarias, the 1.2 m TIGRE telescope located at the La Luiz Observatory (Guanajuato, Mexico), the 0.81 m of the Three College Observatory (NC, USA) the 1 m of the Tien-Shan Astronomical Observatory (Almaty, Kazakhstan), and a 0.5 m telescope of the South-African Astronomical Observatory (Sutherland, South Africa). This paper includes data collected by the TESS mission. Funding for the TESS mission is provided by the NASA’s Science Mission Directorate. A.M. acknowledges technical support from Dan Gray (Sidereal Technology company), Joshua Haislip (University of North Carolina Chapel Hill), and Mike Shelton (University of North Carolina Greensboro) as well as funding from the UNCG College of Arts and Sciences and Department of Physics and Astronomy.
Conflicts of Interest
The authors declare no conflict of interest.
Abbreviations
The following abbreviations are used in this manuscript: V/R—violet-to-red peak intensity ratio in double-peaked emission-line profiles, R—spectral resolving power, SED—spectral energy distribution, OAN SPM—Observatorio Astronómico Nacional San Pedro Martir, CFHT—Canada–France–Hawaii Telescope, McD—McDonald Observatory, ORLM—Observatorio del Roque de Los Muchachos, APO—Apache Point Observatory, TCO—Three College Observatory, HCT—Himalayan Chandra Telescope at the Indian Astronomical Observatory, TShAO—Tien-Shan Astronomical Observatory, KWS—Kamogata/Kiso/Kyoto Wide-field Survey.
References
- Humason, M.L.; Merrill, P.W. Ten Stars of Class B having the Hα Line Bright; 2nd List. Publ. Astron. Soc. Pac. 1921, 33, 112. [Google Scholar] [CrossRef]
- Merrill, P.W.; Humason, M.L.; Burwell, C.G. Discovery and Observations of Stars of Class Be. Astrophys. J. 1925, 61, 389–417. [Google Scholar] [CrossRef]
- Merrill, P.W. The Spectrum of H. D. 50138. Astrophys. J. 1931, 73, 348. [Google Scholar] [CrossRef]
- Merrill, P.W.; Burwell, C.G. Catalogue and Bibliography of Stars of Classes B and A whose Spectra have Bright Hydrogen Lines. APJ 1933, 78, 87. [Google Scholar] [CrossRef]
- Merrill, P.W. Stars Having Shell Spectra. Publ. Astron. Soc. Pac. 1949, 61, 38. [Google Scholar] [CrossRef][Green Version]
- Borges Fernandes, M.; Kraus, M.; Chesneau, O.; Domiciano de Souza, A.; de Araújo, F.X.; Stee, P.; Meilland, A. The galactic unclassified B[e] star HD 50138. I. A possible new shell phase. Astron. Astrophys. 2009, 508, 309–320. [Google Scholar] [CrossRef][Green Version]
- Jeřábková, T.; Korčáková, D.; Miroshnichenko, A.; Danford, S.; Zharikov, S.V.; Kříček, R.; Zasche, P.; Votruba, V.; Šlechta, M.; Škoda, P.; et al. Time-dependent spectral-feature variations of stars displaying the B[e] phenomenon. III. HD 50138. Astron. Astrophys. 2016, 586, A116. [Google Scholar] [CrossRef][Green Version]
- Hutsemekers, D. The ultraviolet spectrum of the Be star HD 50138. Astron. Astrophys. Suppl. Ser. 1985, 60, 373–388. [Google Scholar]
- Allen, D.A. Near infra-red magnitudes of 248 early-type emission-line stars and related objects. Mon. Not. R. Astron. Soc. 1973, 161, 145–166. [Google Scholar] [CrossRef]
- Allen, D.A.; Swings, J.P. The spectra of peculiar Be star with infrared excesses. Astron. Astrophys. 1976, 47, 293–302. [Google Scholar]
- Grady, C.A.; Perez, M.R.; Talavera, A.; Bjorkman, K.S.; de Winter, D.; The, P.S.; Molster, F.J.; van den Ancker, M.E.; Sitko, M.L.; Morrison, N.D.; et al. The β Pictoris phenomenon among Herbig Ae/Be stars. UV and optical high dispersion spectra. Astron. Astrophys. Suppl. Ser. 1996, 120, 157–177. [Google Scholar] [CrossRef]
- Miroshnichenko, A.S. Toward Understanding the B[e] Phenomenon. I. Definition of the Galactic FS CMa Stars. Astrophys. J. 2007, 667, 497–504. [Google Scholar] [CrossRef]
- Miroshnichenko, A.S.; Zharikov, S.V.; Korčaková, D.; Manset, N.; Mennickent, R.; Khokhlov, S.A.; Danford, S.; Raj, A.; Zakhozhay, O.V. Binarity among objects with the Be and B[e] phenomena. Contrib. Astron. Obs. Skaln. Pleso 2020, 50, 513–517. [Google Scholar] [CrossRef]
- Miroshnichenko, A.S.; Zharikov, S.V.; Manset, N.; Khokhlov, S.A.; Nodyarov, A.S.; Klochkova, V.G.; Danford, S.; Kuratova, A.K.; Mennickent, R.; Chojnowski, S.D.; et al. Recent Progress in Finding Binary Systems with the B[e] Phenomenon. Galaxies 2023, 11, 36. [Google Scholar] [CrossRef]
- Baines, D.; Oudmaijer, R.D.; Porter, J.M.; Pozzo, M. On the binarity of Herbig Ae/Be stars. Mon. Not. R. Astron. Soc. 2006, 367, 737–753. [Google Scholar] [CrossRef]
- European Space Agency (Ed.) The HIPPARCOS and TYCHO Catalogues. Astrometric and Photometric Star Catalogues Derived from the ESA HIPPARCOS Space Astrometry Mission; ESA Special Publication: Noordwijk, The Netherlands, 1997; Volume 1200. [Google Scholar]
- Pojmanski, G. The All Sky Automated Survey. Acta Astron. 1997, 47, 467–481. [Google Scholar] [CrossRef]
- Bergner, Y.K.; Miroshnichenko, A.S.; Yudin, R.V.; Kuratov, K.S.; Mukanov, D.B.; Shejkina, T.A. Observations of emission-line stars with IR excesses. II. Multicolor photometry of B[e] stars. Astron. Astrophys. Suppl. Ser. 1995, 112, 221. [Google Scholar]
- Johnson, H.L.; Mitchell, R.I.; Iriarte, B.; Wisniewski, W.Z. UBVRIJKL Photometry of the Bright Stars. Commun. Lunar Planet. Lab. 1966, 4, 99–110. [Google Scholar]
- Harmanec, P. A reliable transformation of HIPPARCOS H_p magnitudes into Johnson V and B magnitudes. Astron. Astrophys. 1998, 335, 173–178. [Google Scholar]
- Brasseur, C.E.; Phillip, C.; Fleming, S.W.; Mullally, S.E.; White, R.L. Astrocut: Tools for Creating Cutouts of TESS Images. Astrophysics Source Code Library, 2019. Available online: https://ui.adsabs.harvard.edu/abs/2019ascl.soft05007B/abstract (accessed on 22 October 2025).
- Kilkenny, D.; Whittet, D.C.B.; Davies, J.K.; Evans, A.; Bode, M.F.; Robson, E.I.; Banfield, R.M. Optical and infrared photometry of southern early-type shell stars and pre-main-sequence variables. S. Afr. Astron. Obs. Circ. 1985, 9, 55–85. [Google Scholar]
- Manset, N.; Donati, J.F. ESPaDOnS; an exhelle spectro-polarimetric device for the observation of stars. In Proceedings of the Society of Photo-Optical Instrumentation Engineers (SPIE) Conference Series; Fineschi, S., Ed.; SPIE: Bellingham, WA, USA, 2003; Volume 4843, pp. 425–436. [Google Scholar] [CrossRef]
- Contarini, G.; Gratton, R. The Instrumental Profile and Straylight in the REOSC Ekar Echelle Spectrograph. In Proceedings of the European Southern Observatory Conference and Workshop Proceedings, Garching, Germany, 27–30 April 1992; Volume 42, p. 737. [Google Scholar]
- Tull, R.G.; MacQueen, P.J.; Sneden, C.; Lambert, D.L. The High-Resolution Cross-Dispersed Echelle White Pupil Spectrometer of the McDonald Observatory 2.7-m Telescope. Publ. Astron. Soc. Pac. 1995, 107, 251. [Google Scholar] [CrossRef]
- Sriram, S.; Kumar, A.; Surya, A.; Sivarani, T.; Giridhar, S.; Kathiravan, S.; Anand, M.N.; Jones, D.; Grobler, D.; Jakobsson, R.; et al. Hanle echelle spectrograph: Design and performance. In Proceedings of the Ground-Based and Airborne Instrumentation for Astronomy VII; Evans, C.J., Simard, L., Takami, H., Eds.; Society of Photo-Optical Instrumentation Engineers (SPIE) Conference Series; SPIE: Bellingham, WA, USA, 2018; Volume 10702, p. 107026K. [Google Scholar] [CrossRef]
- Raskin, G.; van Winckel, H.; Hensberge, H.; Jorissen, A.; Lehmann, H.; Waelkens, C.; Avila, G.; de Cuyper, J.P.; Degroote, P.; Dubosson, R.; et al. HERMES: A high-resolution fibre-fed spectrograph for the Mercator telescope. Astron. Astrophys. 2011, 526, A69. [Google Scholar] [CrossRef]
- Wang, S.i.; Hildebrand, R.H.; Hobbs, L.M.; Heimsath, S.J.; Kelderhouse, G.; Loewenstein, R.F.; Lucero, S.; Rockosi, C.M.; Sandford, D.; Sundwall, J.L.; et al. ARCES: An echelle spectrograph for the Astrophysical Research Consortium (ARC) 3.5 m telescope. In Instrument Design and Performance for Optical/Infrared Ground-Based Telescopes, Proceedings of the Astronomical Telescopes and Instrumentation, Waikoloa, HI, USA, 25–28 August 2002; Iye, M., Moorwood, A.F.M., Eds.; Society of Photo-Optical Instrumentation Engineers (SPIE) Conference Series; SPIE: Bellingham, WA, USA, 2003; Volume 4841, pp. 1145–1156. [Google Scholar] [CrossRef]
- Miroshnichenko, A.S.; Danford, S.; Andronov, I.L.; Aarnio, A.N.; Lauer, D.; Buroughs, H. Refining Orbits of Bright Binary Systems. Galaxies 2023, 11, 8. [Google Scholar] [CrossRef]
- Schmitt, J.H.M.M.; Schröder, K.P.; Rauw, G.; Hempelmann, A.; Mittag, M.; González-Pérez, J.N.; Czesla, S.; Wolter, U.; Jack, D.; Eenens, P.; et al. TIGRE: A new robotic spectroscopy telescope at Guanajuato, Mexico. Astron. Nachrichten 2014, 335, 787. [Google Scholar] [CrossRef]
- de Winter, D.; van den Ancker, M.E.; Maira, A.; Thé, P.S.; Djie, H.R.E.T.A.; Redondo, I.; Eiroa, C.; Molster, F.J. A photometric catalogue of southern emission-line stars. Astron. Astrophys. 2001, 380, 609–614. [Google Scholar] [CrossRef]
- Halbedel, E.M. HD 50138: Photometric Behaviour Connected with its Recent Shell Episode. Inf. Bull. Var. Stars 1991, 3585, 1. [Google Scholar]
- Maehara, H. Automated Wide-Field Survey for Transient Objects with a Small Telescope. J. Space Sci. Inform. Jpn. 2014, 3, 119–127. [Google Scholar]
- Andrillat, Y.; Fehrenbach, C. Etude du profil de la raie H alf dans 72 etoiles Be. Astron. Astrophys. Suppl. Ser. 1982, 48, 93–136. [Google Scholar]
- Korčáková, D.; Sestito, F.; Manset, N.; Kroupa, P.; Votruba, V.; Šlechta, M.; Danford, S.; Dvořáková, N.; Raj, A.; Chojnowski, S.D.; et al. First detection of a magnetic field in low-luminosity B[e] stars. New scenarios for the nature and evolutionary stages of FS CMa stars. Astron. Astrophys. 2022, 659, A35. [Google Scholar] [CrossRef]
- Glagolevskij, Y.V. On Properties of Main Sequence Magnetic Stars. Astrophys. Bull. 2019, 74, 66–79. [Google Scholar] [CrossRef]
- Zharikov, S.; Miroshnichenko, A.; Reva, I.; Kokumbaeva, R.; Omarov, C.; Danford, S.; Aarnio, A.; Manset, N.; Raj, A.; Chojnowski, S.D.; et al. IRAS 17449+2320: A Possible Binary System with the B[e] Phenomenon and a Strong Magnetic Field. Galaxies 2025, 13, 32. [Google Scholar] [CrossRef]
- Miroshnichenko, A. How Strong is Mass Loss from B[e] Stars? In Proceedings of the Mass Loss from Stars and the Evolution of Stellar Clusters, Lunteren, The Netherlands, 29 May–1 June 2006; de Koter, A., Smith, L.J., Waters, L.B.F.M., Eds.; Astronomical Society of the Pacific Conference Series. Mass Loss from Stars and the Evolution of Stellar Clusters: Lunteren, The Netherlands, 2008; Volume 388, p. 205. [Google Scholar]
- Frémat, Y.; Neiner, C.; Hubert, A.M.; Floquet, M.; Zorec, J.; Janot-Pacheco, E.; Renan de Medeiros, J. Fundamental parameters of Be stars located in the seismology fields of COROT. Astron. Astrophys. 2006, 451, 1053–1063. [Google Scholar] [CrossRef]
- Vioque, M.; Oudmaijer, R.D.; Baines, D.; Mendigutía, I.; Pérez-Martínez, R. Gaia DR2 study of Herbig Ae/Be stars. Astron. Astrophys. 2018, 620, A128. [Google Scholar] [CrossRef]
- Jönsson, H.; Holtzman, J.A.; Allende Prieto, C.; Cunha, K.; García-Hernández, D.A.; Hasselquist, S.; Masseron, T.; Osorio, Y.; Shetrone, M.; Smith, V.; et al. APOGEE Data and Spectral Analysis from SDSS Data Release 16: Seven Years of Observations Including First Results from APOGEE-South. Astron. J. 2020, 160, 120. [Google Scholar] [CrossRef]
- Borges Fernandes, M.; Meilland, A.; Bendjoya, P.; Domiciano de Souza, A.; Niccolini, G.; Chesneau, O.; Millour, F.; Spang, A.; Stee, P.; Kraus, M. The Galactic unclassified B[e] star HD 50138. II. Interferometric constraints on the close circumstellar environment. Astron. Astrophys. 2011, 528, A20. [Google Scholar] [CrossRef]
- Borges Fernandes, M.; Kraus, M.; Nickeler, D.H.; De Cat, P.; Lampens, P.; Pereira, C.B.; Oksala, M.E. The Galactic unclassified B[e] star HD 50138. III. The short-term line profile variability of its photospheric lines. Astron. Astrophys. 2012, 548, A13. [Google Scholar] [CrossRef]
- Brown, A.G.A. et al. [Gaia Collaboration] Gaia Early Data Release 3. Summary of the contents and survey properties. Astron. Astrophys. 2021, 649, A1. [Google Scholar] [CrossRef]
- Miroshnichenko, A.S. New photometric calibration of the visual surface brightness method. In Poster Proceedings of IAU Symposium 189 on Fundamental Stellar Properties: The Interaction Between Observation and Theory; Bedding, T.R., Booth, A.J., Davis, J., Eds.; School of Physics, University of Sydney: Camperdown, Australia, 1997; Volume 189, p. 50. [Google Scholar]
- Miroshnichenko, A.S.; Zharikov, S.V.; Danford, S.; Manset, N.; Korčáková, D.; Kříček, R.; Šlechta, M.; Omarov, C.T.; Kusakin, A.V.; Kuratov, K.S.; et al. Toward Understanding the B[e] Phenomenon. V. Nature and Spectral Variations of the MWC 728 Binary System. Astrophys. J. 2015, 809, 129. [Google Scholar] [CrossRef]
- Miroshnichenko, A.S.; Chari, R.; Danford, S.; Prendergast, P.; Aarnio, A.N.; Andronov, I.L.; Chinarova, L.L.; Lytle, A.; Amantayeva, A.; Gabitova, I.A.; et al. Searching for Phase-Locked Variations of the Emission-Line Profiles in Binary Be Stars. Galaxies 2023, 11, 83. [Google Scholar] [CrossRef]
- Nodyarov, A.S.; Miroshnichenko, A.S.; Khokhlov, S.A.; Zharikov, S.V.; Agishev, A.T.; Gabitova, I.A.; Vaidman, N.L.; Manset, N. Properties of Galactic B[e] Supergiants. X. Refined Orbit and Fundamental Parameters of the HD 327083 Binary System. Astrophys. J. 2024, 968, 52. [Google Scholar] [CrossRef]
- Dvořáková, N.; Korčáková, D.; Dinnbier, F.; Kroupa, P. The mass distribution of stellar mergers: A new scenario for several FS CMa stars. Astron. Astrophys. 2024, 689, A234. [Google Scholar] [CrossRef]


Disclaimer/Publisher’s Note: The statements, opinions and data contained in all publications are solely those of the individual author(s) and contributor(s) and not of MDPI and/or the editor(s). MDPI and/or the editor(s) disclaim responsibility for any injury to people or property resulting from any ideas, methods, instructions or products referred to in the content. |
© 2025 by the authors. Licensee MDPI, Basel, Switzerland. This article is an open access article distributed under the terms and conditions of the Creative Commons Attribution (CC BY) license (https://creativecommons.org/licenses/by/4.0/).