Abstract
Deep learning (DL) is the new high-profile technology in medical artificial intelligence (AI) for building screening and diagnosing algorithms for various diseases. The eye provides a window for observing neurovascular pathophysiological changes. Previous studies have proposed that ocular manifestations indicate systemic conditions, revealing a new route in disease screening and management. There have been multiple DL models developed for identifying systemic diseases based on ocular data. However, the methods and results varied immensely across studies. This systematic review aims to summarize the existing studies and provide an overview of the present and future aspects of DL-based algorithms for screening systemic diseases based on ophthalmic examinations. We performed a thorough search in PubMed®, Embase, and Web of Science for English-language articles published until August 2022. Among the 2873 articles collected, 62 were included for analysis and quality assessment. The selected studies mainly utilized eye appearance, retinal data, and eye movements as model input and covered a wide range of systemic diseases such as cardiovascular diseases, neurodegenerative diseases, and systemic health features. Despite the decent performance reported, most models lack disease specificity and public generalizability for real-world application. This review concludes the pros and cons and discusses the prospect of implementing AI based on ocular data in real-world clinical scenarios.
1. Introduction
Deep learning (DL) is a state-of-the-art subset of machine learning that allows computers to automatically learn the features from raw data. It comprises multiple processing layers that transform the data into stratified abstract levels to achieve specific tasks [1]. In recent years, DL has significantly advanced in various fields, such as visual recognition and natural language processing. With its ability to unveil intrinsic characteristics from high-dimensional data, DL has also been widely applied in medical AI to develop disease screening and diagnosis algorithms.
Ophthalmology is a pioneer in the field of medical artificial intelligence (AI). The eye is informative and accessible due to its inherent anatomical features. As an organ located on the body surface, most examinations can be done non-intrusively. Furthermore, the complex anatomy comprising various cells and tissues allows the generation of multimodal data through diverse exam methods. These features provide data scientists and ophthalmologists with easily collectible data of good quality and quantity, making the eye a prime candidate for medical AI.
With the FDA’s approval of IDx-DR [2] as the first autonomous AI system for marketing, the development of ophthalmic AI preemptively entered a new era. Various DL algorithms have been developed for ophthalmic purposes [3], such as for diagnosing diabetic retinopathy [4], glaucoma [5], and age-related macular degeneration [6] based on color fundus photographs. Other forms of ocular examinations were also studied, such as color-coded corneal maps for detecting keratoconus [7] and corneal confocal microscopy for diabetic corneal neuropathy [8]. Beyond ocular diseases, ophthalmic manifestations can also indicate underlying systemic conditions. The innate anatomical structure of the eye provides a window for observing neural and vascular systems in vivo, making it possible to intuitively record physiological and pathological changes in the body. As a result, systemic diseases that induce vascular and neural impairment could present as ophthalmic complications, such as diabetic retinopathy and anemic retinopathy. Recent studies have proven that non-specific pathologies, namely vessel narrowing and retinal thinning, were predictive of systemic disease status and long-term prognostics [9,10]. Aside from the static presentations, there was also evidence for diagnosing neurodegenerative diseases based on specific eye movements [11]. With the help of the ever-developing DL technology, these characteristics can now be identified and utilized for screening and diagnosing purposes.
DL algorithms based on ocular manifestations have opened up new opportunities for managing systemic diseases in rapid, non-invasive manners. Most common ailments have been studied for their correlation with the eye, resulting in a growing number of diverse DL algorithms. However, these AI models are still immature in various aspects to be applied in clinical scenarios. This review aims to conclude and summarize the current DL-based AI models for detecting systemic diseases based on ocular manifestations. We intend to provide a well-rounded overview of the previous works as a reference for future studies.
2. Materials and Methods
This systemic review is conducted and reported in accordance with the Preferred Reporting Items for Systematic Reviews and Meta-Analysis (PRISMA) 2020 guidelines. We searched PubMed®, Embase, and Web of Science for English-language articles published until August 2022. The keywords were designed based on three elements: (1) ocular characteristics, (2) systemic diseases, and (3) artificial intelligence methods. The detailed search strategies are listed in Supplementary Table S1.
2.1. Selection Criteria
Studies were deemed eligible if they (1) were retrospective, cross-sectional, or prospective studies; (2) applied deep learning algorithms to analyze ocular characteristics for identifying systemic diseases; (3) reported the performance of the algorithms with metrics such as accuracy, area under the receiver operating characteristic curve (AUC), sensitivity, and specificity for binary outcomes or mean absolute error (MAE) and R square for regression models; (4) included validation experiment. Reviews, case reports, letters, comments, editorials, meta-analyses, and animal studies were excluded from this systematic review. Full-text revision and reference screening were performed on all qualified articles by two authors (W.C.I. and W.Z.).
2.2. Data Extraction and Quality Assessment
Pertinent data were extracted according to a pre-designed table by W.Z. and W.C.I. Information including the author, publication year, ocular data, DL model, training dataset, testing/validation dataset, external validation, systemic health features/diseases, outcome, and model performance were collected from the selected studies. The Quality Assessment of Diagnostic Accuracy Studies 2 (QUADAS-2) [12] was applied to evaluate the quality and the risk of bias of the included studies.
3. Results
3.1. Study Selection
The flowchart of the selection process is demonstrated in Figure 1. In the searching stage, 2873 articles were identified from the three target databases, with 817 from PubMed, 822 from Embase, and 1234 from Web of Science. After removing 812 duplicates, 1976 reports were excluded by screening the title and abstract. In the 85 studies entering the full-text screening stage, one was unavailable and 26 others were eliminated for various reasons. With the addition of the four studies extended from references, 62 studies were included in this systematic review. The included articles are summarized in Table 1, Table 2 and Table 3.
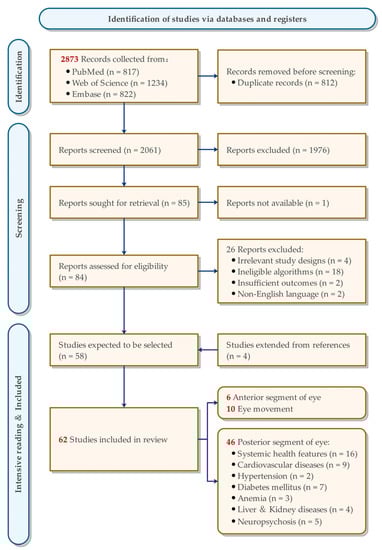
Figure 1.
Flowchart of the study selection process.
The results of the risk of bias evaluation using QUADAS-2 is demonstrated in Figure 2. Most of the studies included had low risk in all categories, while larger proportions of high risk were found in patient selection and index test. The detailed results are shown in Supplementary Table S2.
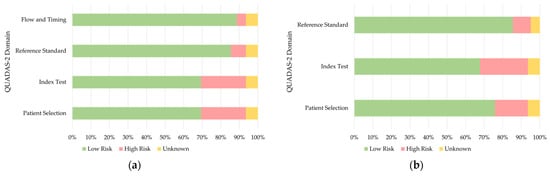
Figure 2.
Stacked bar chart of the QUADAS-2 analysis: (a) Risk of Bias; (b) Applicability Concerns.

Table 1.
Summary of deep learning algorithms identifying systemic diseases from anterior segment of the eye.
Table 1.
Summary of deep learning algorithms identifying systemic diseases from anterior segment of the eye.
| Author, Year | Ocular Data | DL Model | Training Dataset | Testing/Validation Dataset | External Validation | Systemic Health Features/Diseases | Outcome | Performance 1 |
|---|---|---|---|---|---|---|---|---|
| Babenko et al., 2022 [13] | External eye images | DLS | EyePACS (CA): 126,066 patients, 290,642 images | 19,766 patients, 41,928 images | Set A: EyePACS (non-CA): 27,415 patients, 53,861 images; Set B: EyePACS (non-CA): 5058 patients, 9853 images; Set C: 10,402 patients, 19,763 images; Set D: 6266 patients, 12,751 images | HbA1c Total cholesterol Triglycerides | Binary Binary Binary | AUC: 73.4% AUC: 62.3% AUC: 67.1% |
| Li et al., 2022 [14] | Conjunctival images | HMT-Net | 68 patients, 405 images; 62 HC, 206 images | 5-fold cross-validation | N/A | T2DM | Binary | Sensitivity: 78.70% Specificity: 69.08% Accuracy: 75.15% AUC: 0.82 |
| Preston et al., 2022 [15] | CCM images | ResNet-50 | 65 HC images, 63 T1DM, 89 T2DM, 28 prediabetes | Test: 15 HC, 11 T1DM, 10 T2DM, 4 prediabetes; Validation: 10 HC, 14 T1DM, 42 T2DM, 18 prediabetes | N/A | DPN | Ternary | 1. Healthy: F1-score: 0.91 2. No DPN: F1-score: 0.88 3. DPN: F1-score: 0.91 |
| Scarpa et al., 2020 [16] | CCM images | CNN | 40 patients, 240 images; 40 HC, 240 images | 10 patients, 60 images; 10 HC, 60 images; 5-fold cross-validation | N/A | DPN | Binary | Sensitivity: 98% Specificity: 94% Accuracy: 96% |
| Althnian et al., 2021 [17] | Scleral images | VGG-16 | 24 images of patients, 44 images of HC | N/M | N/A | Neonatal jaundice | Binary | Accuracy: 79.03% F1-score: 70.73% AUC: 69.67% |
| Lv et al., 2021 [18] | Scleral images | U-Net, Resnet-18, MIL model | 576 participants, 4608 images | 145 participants, 1160 images; 5-fold cross-validation | N/A | PCOS | Binary | AUC: 0.979 Accuracy: 0.929 F1-score: 0.934 |
1 Only the best performance are presented when there was more than one model. Metadata-based models and hybrid models are not presented in this table. EyePACS, eye picture archive communication system; HbA1c, glycated hemoglobin; AUC, area under curve; HC, healthy control; N/A, not applicable; T2DM, type 2 diabetes mellitus; CCM, corneal confocal microscopy; T1DM, type 1 diabetes mellitus; DPN, diabetic peripheral neuropathy; CNN, convolutional neural network; N/M, not mentioned; PCOS, polycystic ovary syndrome.
3.2. Algorithms Based on the Anterior Segment of the Eye
Most abnormalities of the external eye can be observed intuitively. These manifestations could provide easy access to several systemic diseases and were proven accessible with deep learning models. Babenko et al. [13] developed the DL algorithms based on external eye images taken with fundus cameras to distinguish hemoglobin A1c (HbA1c) ≥ 9% and lipid levels. The former achieved the highest AUC of 0.67 to 0.73, though the latter lacked significance. The models mainly focused on the nasal and temporal scleral areas, indicating that the clue for diagnosis may be conjunctival vessels. The work of Li et al. [14] proved that diabetes could be identified from conjunctival images with an accuracy of 75.15%.
Jaundice is also a distinct symptom often observed from the external eye. Using slit lamp photos as input, Xiao et al. [19] achieved AUCs over 0.90 in diagnosing liver cirrhosis and liver cancer. Another study focusing on neonatal jaundice [17] also attained an accuracy of 79.03% based on smartphone-captured images. On the other hand, the model built by Lv et al. [18] detected polycystic ovary syndrome (PCOS) based on sectioned scleral images. The model attained an accuracy and AUC over 0.90 by focusing on thick and foggy blood vessels in the sclera, which could be caused by sex steroid changes in the patients.
The cornea is densely innervated by the ophthalmic branch of the trigeminal nerves. Corneal confocal microscopy (CCM) allows for non-invasive quantification of the small corneal nerve fibers, providing a rapid evaluation method for various diseases. With CCM images as input, two DL algorithms were developed for the early diagnosis of diabetic neuropathy, one achieving an accuracy of 96% [16] and the other having an F1-score of 0.91 [15]. The Grad-CAM highlighted the absence of nerve fibers in the CCM images, showing that the models are explainable despite the relatively small datasets.
3.3. Algorithms Based on the Posterior Segment of the Eye
The retina provides a window for directly observing neurovascular structures in vivo based on its natural anatomical features. The development of retinal imaging technologies such as color fundus photographs and ultra-widefield fundus (UWF) imaging enabled intuitive en-face records of retinal pathologies. Additionally, optical coherence tomography (OCT) with the interferometry technique allows cross-sectional imaging of the multiple layers of the retina. The multimodal retinal data generated from various imaging methods creates an ideal platform for building DL algorithms for diagnosing systemic diseases.
Table 2.
Summary of deep learning algorithms identifying systemic diseases from posterior segment of the eye.
Table 2.
Summary of deep learning algorithms identifying systemic diseases from posterior segment of the eye.
| Author, Year | Ocular Data | DL Model | Training Dataset | Testing/Validation Dataset | External Validation | Systemic Health Features/Diseases | Outcome | Performance 1 |
|---|---|---|---|---|---|---|---|---|
| Betzler et al., 2021 [20] | Retinal images | VGG-16 | SEED: 7969 participants, 137,511 images | 1987 participants, 34,659 images | N/A | Gender | Binary | AUC: 0.94 |
| Corbin et al., 2022 [21] | Fundus images | EfficientNet | 14,711 participants for all datasets; 18,000 images for training | Validation: 3860 images; Test: 3877 images | N/A | Age SBP DBP BMI Sex (image) Sex (individual) APOE4 (image) APOE4 (individual) | Regression Regression Regression Regression Binary Binary Binary Binary | R2: 0.778, MAE: 3.24 R2: 0.229, MAE: 10.94 R2: 0.227, MAE: 6.80 R2: 0.032, MAE: 3.99 AUC: 0.84 AUC: 0.85 AUC: 0.47 AUC: 0.50 |
| Gerrits et al., 2020 [22] | Retinal images | MobileNet-V2 | Qatar Biobank: 1800 participants, 7200 images | Validation: 600 participants, 2400 images Test: 600 participants, 2400 images | N/A | Age Sex SBP DBP HbA1c BMI RFM Glucose Insulin SHBG Estradiol Testosterone Tch HDL LDL Tg Smoking status | Regression Binary Regression Regression Regression Regression Regression Regression Regression Regression Regression Regression Regression Regression Regression Regression Binary | MAE: 2.78, R2: 0.89 AUC: 0.97 MAE: 8.96, R2: 0.40 MAE: 6.84, R2: 0.24 MAE: 0.61, R2: 0.34 MAE: 4.31, R2: 0.13 MAE: 5.68, R2: 0.43 MAE: 1.06, R2: 0.12 MAE: 7.15, R2: −0.04 MAE: 21.09, R2: 0.06 MAE: 154.18, R2: −0.03 MAE: 3.76, R2: 0.54 MAE: 0.75, R2: 0.03 MAE: 0.31, R2: 0.05 MAE: 0.72, R2: −0.03 MAE: 0.49, R2: 0.03 AUC: 0.78 |
| Hu et al., 2022 [23] | Retinal images | DL | UK Biobank: 11,052 participants, 19,200 images | 35,834 participants | N/A | Retinal age | Regression | MAE: 3.55 |
| Khan et al., 2022 [24] | Retinal images | DenseNet-201 | 760 participants for all datasets; 1021 images for training | 256 images for testing | N/A | Gender ARB Smoking status ACEi LDL Hypertension HDL Cardiac disease HbA1c Age Aspirin Ethnicity | Binary Binary Binary Binary Binary Binary Binary Binary Binary Binary Binary Binary | AUC: 0.852 AUC: 0.783 AUC: 0.732 AUC: 0.815 AUC: 0.766 AUC: 0.687 AUC: 0.756 AUC: 0.7 AUC: 0.708 AUC: 0.902 AUC: 0.696 AUC: 0.926 |
| Kim et al., 2020 [25] | Retinal images | ResNet-152 | 155,449 participants for all datasets; 216,866 HC images for training | Validation: 2436 HC images; Test: 24,366 HC images, 40,659 hypertension, 14,189 DM, 113,510 smoking | N/A | Age Sex | Regression Binary | MAE: 3.06, R2: 0.92 AUC: 0.969 |
| Korot et al., 2021 [26] | Retinal images | CFDL | UK Biobank: 84,743 patients, 173,819 images | 728 patients, 1287 images | 252 patients, 252 images | Sex | Binary | Sensitivity: 83.9% Specificity: 72.2% Accuracy: 78.6% |
| Mendoza et al., 2021 [27] | OCT | DL | 1772 patients, 52,552 circle B-scans; 730 patients, 111,456 radial B-scans; 85% for training | 5% for validation, 10% for testing | N/A | Age Axial length Sex Race Diabetes Hypertension CVD | Regression Regression Binary Binary Binary Binary Binary | MAE: 5.4, R2: 0.73 MAE: 0.7, R2: 0.3 AUC: 0.72 AUC: 0.96 AUC: 0.65 AUC: 0.71 AUC: 0.56 |
| Munk et al., 2021 [28] | Fundus images, OCT | ResNet-152 | 16,196 participants, 135,667 fundus images; 5578 participants, 85,536 OCT scans; 80% for training | 10% for validation, 10% for testing | N/A | Age Sex | Binary Regression | 1. Fundus images: MAE: 6.328, AUC: 0.80 2. OCT cross sections: MAE: 5.625, AUC: 0.84 3. OCT volumes: MAE: 4.541, AUC: 0.90 |
| Nusinovici et al., 2022 [29] | Retinal images | RetiAGE | 36,432 participants, 116,312 images | Validation: 4048 participants, 12,924 images; Test: 10,171 participants, 32,318 images | UK Biobank: 56,301 participants | Age | Binary | AUC: 0.756 |
| Poplin et al., 2018 [30] | Retinal images | Inception-v3 | UK Biobank: 48,101 patients, 96,082 images; EyePACS: 236,234 patients, 1,682,938 images | UK Biobank: 12,026 patients, 24,008 images; EyePACS-2K: 999 patients, 1958 images | N/A | Age Gender Smoking status HbA1c BMI SBP DBP | Regression Binary Binary Regression Regression Regression Regression | MAE: 3.26, R2: 0.74 AUC: 0.97 AUC: 0.71 MAE: 1.39, R2: 0.09 MAE: 3.29, R2: 0.13 MAE: 11.35, R2: 0.36 MAE: 6.42, R2: 0.32 |
| Rim et al., 2020 [31] | Retinal images | VGG-16 | 27,516 participants, 86,994 images | 6879 participants, 21,698 images | Set 1: 4343 participants, 9324 images; Set 2: BES: 1060 participants, 4234 images; Set 3: SEED: 7726 participants, 63,275 images; Set 4: UK Biobank: 25,366 participants, 50,732 images | Sex Age BMM Height Bodyweight PBF BMI Creatinine DBP SBP Hematocrit Hemoglobin RBC count | Binary Regression Regression Regression Regression Regression Regression Regression Regression Regression Regression Regression Regression | AUC: 0.91, Accuracy: 0.85 MAE: 3.78, R2: 0.36 MAE: N/A, R2: N/A MAE: 5.48, R2: 0.23 MAE: 8.28, R2: 0.17 MAE: N/A, R2: N/A MAE: 2.90, R2: 0.06 MAE: 0.11, R2: 0.12 MAE: 8.09, R2: 0.2 3MAE: 13.20, R2: 0.19 MAE: N/A, R2: N/A MAE: N/A, R2: N/A MAE: N/A, R2: N/A |
| Tham et al., 2019 [32] | Fundus images | ResNet, DenseNet | 13,937 participants, 25,637 images | 3485 participants, 6830 images | N/A | HbA1c | Regression | MAE: 0.87% |
| Vaghefi et al., 2019 [33] | Retinal images | CNN | 81,711 participants, 165,104 images; 60% for training | 20% for validation, 20% for testing | N/A | Smoking | Binary | Accuracy: 88.88% Specificity: 93.87% Sensitivity: 62.62% AUC: 0.86 |
| Yang et al., 2020 [34] | Retinal images | VGG-16 | SEED: 9748 participants, 110,099 images; 80% for training | 20% for testing | N/A | Race | Ternary | Accuracy: 95.1% |
| Zhang et al., 2020 [35] | Retinal images | Inception-v3 | 625 participants, 1222 images; 80% for training | 10% for validation, 10% for testing | N/A | Hyperglycemia Hypertension Dyslipidemia Age Gender Drinking status Salty taste Smoking status BMI WHR HCT MCHC T-BIL D-BIL | Binary Binary Binary Binary Binary Binary Binary Binary Binary Binary Binary Binary Binary Binary | AUC: 0.880 AUC: 0.766 AUC: 0.703 AUC: 0.850 AUC: 0.704 AUC: 0.948 AUC: 0.809 AUC: 0.794 AUC: 0.731 AUC: 0.704 AUC: 0.759 AUC: 0.686 AUC: 0.764 AUC: 0.703 |
| Al-Absi et al., 2022 [36] | Retinal images | ResNet-34 | Qatar Biobank: 233 patients, 874 images; 250 HC, 931 images | 5-fold cross-validation | N/A | CVD | Binary | Accuracy: 75.6% |
| Mellor et al., 2019 [37] | Fundus images | ResNet | 4782 participants | 5-fold cross-validation | N/A | CVD | Binary | AUC: 0.77 |
| Chang et al., 2019 [38] | Retinal images | NASNet-Large | 33,025 participants, 96,968 images | 6597 participants, 13,373 images | N/A | FAD | Regression | MAE: 2.74 |
| Ng et al., 2022 [39] | Retinal images | DLPPC | 58 patients, 116 images; 80% for training | 20% for testing | N/A | SpO2 LICUS PC OT CBT ABT | Binary Binary Binary Binary Binary Binary | AUC: 0.712 AUC: 0.731 AUC: 0.722 AUC: 0.581 AUC: 0.800 AUC: 0.767 |
| Mueller et al., 2022 [40] | Fundus images | MIL | 97 patients, 34 HC; 83,126 images for training | 9237 images for validation | N/A | PAD | Binary | Accuracy: 0.837 F1-score: 0.883 AUC: 0.89 |
| Chang et al., 2020 [41] | Retinal images | DL-FAS | 5296 participants, 12,362 images | Validation: 647 participants, 1526 images; Test: 654 participants, 1520 images | N/A | Atherosclerosis | Binary | AUC: 0.713 Accuracy: 0.583 Sensitivity: 0.891 Specificity: 0.404 |
| Barriada et al., 2022 [42] | Retinal images | VGG-16 | 76 patients, 152 images | 5-fold cross-validation | N/A | CACS | Binary | Accuracy: 0.72 F1-score: 0.62 |
| Rim et al., 2021 [43] | Retinal images | RetiCAC | 15,911 participants, 36,034 images | 3965 participants, 8930 images | Set 1: 8707 participants, 18,920 images; Set 2: 527 participants, 1054 images | CACS | Binary | AUC: 0.742 |
| Son et al., 2020 [44] | Retinal images | Inception-v3 | 20,130 participants, 44,184 images; 80% for training | 20% for training; 5-fold cross-validation | N/A | CACS | Binary | AUC: 83.2% |
| Dai et al., 2020 [45] | Retinal images | CNN | 735 patients, 684 HC; 60% for training | 20% for validation, 20% for testing; 5-fold cross-validation | N/A | Hypertension | Binary | Accuracy: 60.94% Specificity: 63.80% AUC: 0.6506 |
| Lo et al., 2021 [46] | Fundus images | AML-Net | 200 patient images, 200 HC; 70% for training | 30% for validation | N/A | Mild hypertension | Binary | Accuracy: 93.75% |
| Islam et al., 2021 [47] | Retinal images | DiaNet | EyePACS: over 80,000 images; Qatar Biobank: 246 patients, 246 controls, total 1852 images | 5-fold cross-validation | N/A | Diabetes | Binary | Accuracy: 84.47% Specificity: 83.06% AUC: 84.46% |
| Wang et al., 2022 [48] | Retinal images | CNN | 10,766 images | N/M | N/A | Short-term readmission risk in diabetes | Binary | Specificity: 0.79 Accuracy: 0.837 |
| Zhang et al., 2018 [49] | Fundus images | ResNet | 79 patients, 79 HC; 80% for training | 20% for testing | N/A | Diabetes | Binary | Accuracy: 84.7% |
| Abbasi-Sureshjani et al., 2018 [50] | Retinal images | ResNet | 5791 HC images, 3133 T2DM; 80% for training | 20% for validation | N/A | T2DM | Binary | F1-score: 0.758 |
| Heslinga et al., 2020 [51] | Retinal images | VGG-19 | 1376 participants, 5222 images | Validation: 464 participants, 1802 images; Test: 496 participants, 1900 images; | N/A | T2DM | Binary | AUC: 0.746 |
| Yun et al., 2022 [52] | Retinal images | ResNet-18 | UK Biobank: 37,904 patients, 69,639 images | Test: 12,173 patients, 22,342 images; Validation: 12,185 patients, 22,394 images | 6575 images | T2DM | Binary | AUC: 0.731 Sensitivity: 0.662 Specificity: 0.662 |
| Cervera et al., 2021 [53] | Retinal images | Squeezenet v1.0 | 1081 patients, 17,028 images | 121 patients, 1892 images; 5-fold cross-validation | N/A | DPN | Binary | AUC: 0.8013 |
| Mitani et al., 2020 [54] | Retinal images | Inception-v4 | UK Biobank: 40,041 participants, 80,006 images | Validation: 11,388 participants, 22,742 images; Test: 5734 participants, 11,457 images | N/A | Hemoglobin Anemia | Regression Binary | MAE: 0.67 AUC: 0.87 |
| Wei et al., 2021 [55] | OCT | AneNet | 17 patients, 221 images; 13 HC, 207 images | 5-fold cross-validation | N/A | Anemia | Binary | Accuracy: 0.9865 Sensitivity: 0.9838 Specificity: 0.9594 AUC: 0.9983 |
| Zhao et al., 2022 [56] | UWF Fundus images | ASModel_ UWF, ASModel_ CroppedUWF | 2445 participants, 9221 images | Validation: 213 participants, 577 images; Test: 565 participants, 1730 images | N/A | Hemoglobin Anemia | Regression Binary | MAE: 0.83 AUC: 0.93 Sensitivity: 91.2% Specificity: 80.00% |
| Kang et al., 2020 [57] | Retinal images | VGG-19 | 4970 patients, 20,787 images | Validation: 621 patients, 2189 images; Test: 621 patients, 2730 images | N/A | Early renal function impairment | Binary | AUC: 0.81 Sensitivity: 0.83 Specificity: 0.62 Accuracy: 0.73 |
| Sabanayagam et al., 2020 [58] | Retinal images | CondenseNet | SEED: 5188 participants, 10,376 images | 1297 participants, 2594 images; 5-fold cross-validation | 1. 3735 participants, 7470 images; 2. BES: 1538 participants, 3076 images | CKD | Binary | AUC: 0.835 Sensitivity: 0.75 Specificity: 0.75 |
| Zhang et al., 2021 [59] | Retinal images | ResNet-50 | 30,122 participants, 60,244 images | Validation: 4307 participants, 8614 images; Test: 8727 participants, 17,454 images | 1. 8059 participants, 16,118 images; 2. 3081 participants, 6162 images | CKD Early CKD T2DM | Binary Binary Binary | AUC: 0.885 AUC: 0.834 AUC: 0.854 |
| Xiao et al., 2021 [19] | Retinal imagesSlit-lamp images | ResNet-101 | 1252 participants, 2481 slit-lamp images, 1989 retinal images; 75% for training | 25% for tuning | 537 participants, 1069 slit-lamp images, 800 retinal images | Liver cancer Liver cirrhosis Chronic viral hepatitis Non-alcoholic fatty liver disease Cholelithiasis Hepatic cyst | Binary Binary Binary Binary Binary Binary | Slit-lamp; Retinal images: AUC: 0.93; 0.84 AUC: 0.90; 0.83 AUC: 0.69; 0.62 AUC: 0.63; 0.70 AUC: 0.58; 0.68 AUC: 0.66; 0.69 |
| Cho et al., 2022 [60] | Retinal images | DenseNet-201, EfficientNet-B7 | 1703 patients, 3353 images | 189 patients, 373 images; 10-fold cross-validation | N/A | WMH | Binary | Sensitivity: 66.1 Specificity: 71.3 AUC: 0.736 |
| Appaji et al., 2022 [61] | Retinal images | CNN | 116 patients, 82 HC | Validation: 33 patients, 23 HC; Test: 17 patients, 13 HC; Confirmatory: 21 patients, 22 HC | N/A | SCZ | Binary | Accuracy: 95% AUC: 0.98Sensitivity: 91.66% Specificity: 95% |
| Lai et al., 2020 [62] | Retinal images | ResNet-50 | 46 patients, 24 HC | 10-fold cross-validation | N/A | ASD | Binary | Sensitivity: 82.6% Specificity: 91.3% AUC: 0.907 |
| Wisely et al., 2019 [63] | Retinal images | ResNet-18 | 36 patients, 117 HC for all datasets; 57 patient eyes, 198 HC eyes for training | 6 patient eyes, 24 control eyes for testing; 9-fold cross validation | N/A | AD | Binary | AUC: 0.74 Accuracy: 0.79 |
| Huang et al., 2020 [64] | Retinal images | EfficientNet-B1 | 144 patients, 74 HC, total 342 images; Training and validation: 187 participants | Training and validation: 187 participants Testing: 31 participants | N/A | Axial spondyloarthritis | Binary | AUC: 0.735 Sensitivity: 87% Specificity: 62.5% |
1 Only the best performance is presented when there was more than one model. Metadata-based models and hybrid models are not presented in this table. SEED, Singapore Epidemiology of Eye Diseases; N/A, not applicable; AUC, area under curve; SBP, systolic blood pressure; DBP, diastolic blood pressure; BMI, body mass index; APOE4, apolipoprotein E4; MAE, mean absolute error; RFM, relative fat mass; SHBG, sex hormone binding globulin; Tch, total cholesterol; HDL, high density lipoprotein; LDL, low density lipoprotein; Tg, triglyceride; ARB, angiotensin receptor blocker; ACEi, angiotensin-converting enzyme inhibitor; HC, healthy control; DM, diabetes mellitus; OCT, optical coherence tomography; CVD, cardiovascular diseases; EyePACS, eye picture archive communication system; BES, Beijing Eye Study; BMM, body muscle mass; PBF, percentage body fat; RBC, red blood cell; WHR, waist–hip ratio; HCT, hematocrit; MCHC, mean corpuscular hemoglobin concentration; T-BIL, total bilirubin; D-BIL, direct bilirubin; FAD, fundus age difference; SpO2, oxygen saturation; LICUS, length of ICU stay; PC, perioperative complications; OT, operation time; CBT, cardiopulmonary bypass time; ABT, arterial blocking time; PAD, peripheral arterial disease; CACS, coronary artery calcium score; N/M, not mentioned; T2DM, type 2 diabetes mellitus; DPN, diabetic peripheral neuropathy; UWF, ultra-wide-field; CKD, chronic kidney disease; WMH, white matter hyperintensity; SCZ, schizophrenia; ASD, autistic spectrum disorder; AD, Alzheimer disease.
3.3.1. Systemic Health Features
Systemic health features, such as age, gender, smoking status, blood pressure, and glucose level, are indicative and predictive of various disorders. The pioneering work of Poplin et al. [30] unveiled the possibility of using deep learning algorithms based on fundus photographs to predict systemic risk factors, giving rise to a series of works with akin goals. These models successfully predicted age with the mean absolute error (MAE) ranging from 2.43 to 6.328 [22,24,25,28,30,31]. As for identifying gender, the models also achieved satisfying AUCs ranging from 0.85 to 0.97 [20,22,24,25,26,28,30,31,52], with a few studies highlighting the optic disc and the macula as regions of interest [20,26,30]. Ethnicities could also be categorized from fundus images with AUC and accuracy surpassing 0.90 [24,34].
Other than fundus images, OCT scans were also proven to be suggestive of patients’ age and gender. The result from Munk et al. [28] indicated that prediction performance with OCT C-Scans or B-Scans of the macular region outperformed fundus images, achieving AUCs of 0.90 and 0.84 in detecting gender and obtaining the MAEs of 5.625 and 4.541 in predicting age. Mendoza et al. [27] proposed that circle and radial scans of the optic nerve head incorporate the potential for predicting age, gender, and race, among which race prediction achieved the best performance with an AUC of 0.96. The authors also illustrated that circle scans have better predictive value in DL algorithms.
As a notorious risk factor for various systemic diseases, smoking is deleterious since it impacts systemic vascular structure and function [65]. Recent studies have demonstrated that DL diagnostic models based on retinal images could achieve AUCs between 0.71 and 0.78 by capturing the pathological changes, as retinal circulation characteristics were marked in the attention maps [22,24,30]. Contrast-enhanced photographs emphasizing the vessel structure could significantly boost the model’s performance and reach an accuracy of 88.88% [33].
Based on the parallel decrepitude of the body and the retina, several researchers proposed the idea of “retinal age” as a novel feature in disease monitoring. Chang et al. [38] suggested that a higher algorithm-predicted age than the chronological age translates into higher all-cause mortality. Nusinovici et al. [29] interpreted it with a different approach by defining “RetiAGE” as the probability of age being ≥65 years, and their study obtained similar results. The work of Hu et al. [23] extended the application of this method, proving that the model based on retinal age is predictive of the future risk of Parkinson’s disease with an AUC of 0.71.
3.3.2. CVD
Cardiovascular diseases (CVD) cause the most significant proportion of deaths among non-communicable diseases. Studies have proven that the presence and severity of CVD are associated with retinal vascular morphology [66], providing the theoretical basis for building AI diagnosing models with retinal images.
The coronary artery calcium score (CACS) is a non-invasive assessment system that quantifies the prognostic risks of CVD [67]. Two studies have applied DL to predict CAC cores based on retinal images. One of the algorithms attained the highest accuracy of 0.72 in predicting CACS >0 despite a small sample size [42], and both studies suggested that the AUC improved as the diagnosing threshold increased [44].
Alternatively, several researchers have developed unique retinal scoring systems to use as CVD indicators. The RetiCAC score, the probability score of the DL binary classification task, could predict the presence of coronary artery calcium with an AUC over 0.70 [43] and was comparable with the traditional CAC risk stratification in predicting disease prognosis. Another scoring system based on retinal images, namely the DL fundoscopic atherosclerosis score (DL-FAS), achieved akin results in predicting carotid artery atherosclerosis and all-cause mortality [41].
For direct classification of CVD, Al-Absi et al. [36] achieved an accuracy of 75.6% using only retinal images, and the region of interest of the model was mainly the central retinal area. Another study recruiting type 1 diabetes mellitus patients achieved an AUC of 0.77 in diagnosing CVD [37]. Peripheral artery disease (PAD), also attributed to atherosclerosis, was proven to be detectable from fundus images with an AUC reaching 0.89 [40]. Furthermore, there was evidence of applying retinal image-based AI in predicting perioperative parameters of congenital heart diseases [39], with the AUC of detecting cardiopulmonary bypass time reaching 0.80 and that of oxygen saturation, arterial blocking time, length of ICU stay, and perioperative complications surpassing 0.70.
3.3.3. Hypertension
Hypertension causes microvascular dysfunction. Morphological retinal vascular changes, such as narrower arteries and wider venules, could be observed in hypertensive patients [68]. In algorithms predicting biomarkers, the MAE was from 8.96 to 11.35 for systolic blood pressure (BP) and 6.42 to 7.20 for diastolic BP [22,30,31]. Interestingly, the studies applying DL to diagnose hypertension concomitantly preprocessed the input photographs to augment the vessel structures and erase background noise. The models based on processed images achieved AUC values of 0.65% and 0.77%, respectively [35,45], and the work predicting mild hypertension reached an accuracy of 93.75% [46] based on only 400 photographs.
3.3.4. Diabetes Mellitus
Diabetic retinopathy, with its rocketing prevalence and distinct fundus pathologies, has become the pilot field of ophthalmic AI. Aside from diagnosing typical retinopathy, there have been multiple attempts at employing DL to predict diabetic mellitus (DM) as a disease. Kang et al. reached the highest AUC of 0.92 [59], and the performance of other approaches was no worse than 0.73 [35,47,50,51,52]. When evaluated for accuracy, the models reached from 83.7% to 85.0% [48,49]. One study that applied Xception and dense neural network (DNN) achieved a training accuracy of 96.68% and a validation accuracy of 66.82% although only 220 images were put into model training.
Hemoglobin A1c (HbA1c) is an essential biomarker for long-term glucose monitoring [69]. Tham et al. have proven that retinal images contain information indicating HbA1c level by achieving an MAE of 0.87% with the DL algorithm [32]. Notably, it was suggested that diabetic neuropathy could also be detected from fundus photographs, with the AUC reaching 0.71 [53].
3.3.5. Anemia
Anemia is a common disease and a symptom of various systemic disorders. DL based on fundus images was proven sufficient in predicting hemoglobin concentration and diagnosing anemia [54,56], thus could be considered a novel non-invasive method for disease management. Explanation methods showed that the models focused on the optic disc and the retinal vessels, which is consistent with the typical ocular symptoms such as pale discs and narrower arteries in anemic patients.
Wei et al. [55] tackled the problem from a different perspective by using OCT images that displayed the cross-section of retinal vessels as the model input. Although the algorithm achieved excellent results, the dataset was diminutive and external validation was not applied.
3.3.6. Hepatobiliary Diseases and Kidney Diseases
The liver and the kidney share multiple essential physiological functions, including metabolism and maintaining homeostasis. Recent studies have suggested that diseases of both organs can be observed with deep learning algorithms based on fundus photos. Xiao et al. [19] proved that hepatobiliary diseases, especially liver cancer and liver cirrhosis, could be diagnosed with an AUC over 0.80 from fundus images. In the case of chronic kidney disease (CKD), the algorithms obtained excellent performance in predicting early CKD and CKD [57,58,59]. Color fundus images could provide intuitive observation of the systemic microvasculature, enabling the detection of vascular defects in CKD patients.
3.3.7. Neurological Disorders
A diversity of neurological diseases can be detected from the morphological changes of the retina. White matter hyperintensity, referring to the lesions caused by cerebral small vessel diseases, is predicted from fundus photos with an AUC of approximately 0.70 [60]. As for cognitive impairment, previous studies indicated that DL with retinal images alone was limited in predicting cognition status [21]; however, UWF combined with OCTA and autofluorescence (FAF) could achieve an AUC of 0.74 in detecting Alzheimer’s disease (AD) [63]. Likewise, autoimmune diseases such as axial spondyloarthritis [64] could also be distinguished with a fair AUC of 0.74. On the contrary, studies focusing on autism spectrum disorder (ASD) [62] and schizophrenia [61] obtained an AUC of over 0.97, possibly attributable to the fact that both models applied cross-validation methods for performance evaluation. These results have proven that several categories of neurological disorders demonstrate retinal changes, although the DL models based on fundus images are not yet sufficiently developed to perform diagnostic tasks individually.
3.4. Algorithms Based on the Movements of the Eye
Eye movements are coordinative actions dominated by cognitive processes and behavior mechanisms [70]. Previous studies have proven that the specific gaze patterns captured by eye-tracking devices could be predictive of neurodegenerative diseases, such as Parkinson’s disease (PD), dementia, and autism spectrum disorders (ASD). With the advancements in hardware and algorithms, the current eye-tracking methods have achieved explicit temporal resolutions and could provide additional information unattainable by traditional imaging techniques.
3.4.1. Dementia and Parkinson’s Disease
Dementia is a global health issue in the aging society. It was suggested that eye-tracking tests could provide a rapid and objective method for assessing patients’ cognitive functions, such as memory and attention [11]. Mengoudi et al. [71] designed a test to trace the participants’ sight while presenting images with different stimuli, and the model achieved an accuracy of 78.3% in classifying dementia. Alternatively, Biondi et al. [72] developed a resolution based on eye movement during reading tasks. Their result had a decent performance with an accuracy of 89.8%, and the severity scaled by model output was comparable with psychiatrists’ scoring.
PD is another neurodegenerative disease affecting a large population worldwide. As previous studies implied fixational defects in PD patients, Archila et al. [73] developed an algorithm based on fixational performances to distinguish and stage PD. Their model achieved relatively good specificities, and the performance advanced after combining gait data.
Table 3.
Summary of deep learning algorithms identifying systemic diseases from eye movements.
Table 3.
Summary of deep learning algorithms identifying systemic diseases from eye movements.
| Author, Year | Ocular Data | DL Model | Training Dataset | Testing/Validation Dataset | External Validation | Systemic Health Features/Diseases | Outcome | Performance 1 |
|---|---|---|---|---|---|---|---|---|
| Li et al., 2022 [74] | Gaze estimation videos | AttentionGazeNet, LSTM | 50 participants, 64,000 images | 1. 15 participants, about 1500 images; 2. 16 participants | 405 participants, 405 videos | ASD | Binary | Accuracy: 94.8% Sensitivity: 91.1% Specificity: 96.7% |
| Li et al., 2020 [75] | Eye movement videos | LSTM | 136 patients, 136 videos; 136 HC, 136 videos | 10-fold cross-validation | N/A | ASD | Binary | Accuracy: 92.7% Sensitivity: 91.9% Specificity: 93.4% |
| Varma et al., 2022 [76] | Eye movement videos | LSTM | 68 patients and 27 HC in all datasets; 324 videos for training | Validation: 71 videos; Test: 54 videos | N/A | ASD | Binary | Recall: 0.656 Precision: 0.661 |
| Xie et al., 2022 [77] | Eye movement data | VGG-16 | 20 patients, 19 HC | Leave-one-out and 13-fold cross-validation | N/A | ASD | Binary | Accuracy: 0.95 Sensitivity: 1.00 Specificity: 0.89 AUC: 0.93 |
| Jiang et al., 2017 [78] | Eye movement data | VGG-16 | 39 participants, 100 images | Leave-one-subject-out cross-validation | N/A | ASD | Binary | Accuracy: 0.92 Sensitivity: 0.93 Specificity: 0.92 AUC: 0.92 |
| Mengoudi et al., 2020 [71] | Eye movement data | Self-Supervised Learning, SVM | 432 HC | 30 patients, 144 HC | N/A | Dementia | Binary | Accuracy: 78.3% Sensitivity: 89.7% Specificity: 67.6% |
| Biondi et al., 2018 [72] | Eye movement data | Sparse-Autoencoders | 22 patients, 39 HC, total 2922 trials | 4 patients, 4 HC, total 313 trials | N/A | AD | Binary | Accuracy: 89.78% |
| Archila et al., 2021 [73] | Eye movement videos | LSTM | 12 patients, 144 videos; 13 HC, 156 videos | Leave-one-patient-out cross-validation | N/A | PD | Ternary | Specificity: Control: 1, Stage2: 0.87, Stage3: 0.86 F1-score: Control: 0.81, Stage2: 0.57, Stage3: 0.72 |
| Mao et al., 2020 [79] | Eye movement data | LSTM | 34 HC, 34 patients with brain injury, and 30 patients with vertigo; 64 subjects for training | 34 subjects for testing | N/A | Brain injury and vertigo | Ternary | Accuracy: 0.9412 |
| Ahmadi et al., 2020 [80] | Eye movement data | RF, ANN, SingleGMC, MultiGMC | 40 patients with vestibular stroke, 68 patients with peripheral AVS; 90% for training | 10% for testing | N/A | AVS | Binary | Accuracy: 82% AUC: 0.96 |
1 Only the best performance is presented when there was more than one model. Metadata-based models and hybrid models are not presented in this table. ASD, autism spectrum disorder; HC, healthy control; N/A, not applicable; AUC, area under curve; AD, Alzheimer disease; PD, Parkinson’s disease; AVS, acute vestibular syndrome.
3.4.2. Autism Spectrum Disorders
Visual attention characteristics are among the most specific traits obtained from eye movement data. Such hallmarks could be applied in ASD screening, which distinctively presents changes in attention patterns towards certain visual elements. Jiang et al. [78] discovered that ASD patients mainly focused on non-social subjects while presented with a variety of pictures, and their model achieved an AUC of 0.92. Xie et al. [77] further distinguished several categories of image features, such as outdoor objects and food and drinks, that poses importance in identifying ASD. The model based on the top features also performed excellently with an AUC of 0.92.
Li et al. adopted a different method by displaying the mother’s image and tracking the children’s gaze patterns [74,75]. By applying appearance-based gaze estimation, their models achieved high accuracies of over 90%. Besides the reaction to still images, Varma et al. [76] captured the gaze fixation and visual scanning methods in socially motivated gameplay. The developed algorithm showed mild predictive power in identifying ASD in children.
3.4.3. Other Disorders
Vestibular disorders could cause significant ocular presentations, namely abnormal nystagmus and saccade. It usually requires an experienced specialist for evaluation in clinical settings to help diagnose vestibular diseases. With the advancement of DL, a few studies utilized eye movement data for discrimination between systemic diseases. Ahmadi et al. [80] identified vestibular strokes and peripheral acute vestibular syndrome with an AUC of 0.96. Mao et al. [79], on the other hand, obtained eye motion during gazing tasks and achieved an AUC of 0.94 in differentiating controls, brain injury, and vertigo patients.
4. Discussion
This systematic review concludes the performances of deep learning algorithms based on ocular data in evaluating systemic health conditions. Overall, most systemic diseases proven to be detectable from static ocular manifestations impact neurovascular structures, which project changes to the eye in areas such as retinal vessels and corneal nerves. Most studies used colored photographs as input; however, depth-resoluted OCT images were also applicable. Alternatively, neurodegenerative disorders mainly present as defects in eye movements, and eye-tracking data in specific tasks or spontaneous abnormalities were obtained as model inputs. The reported algorithms achieved fair results, with AUCs and accuracies exceeding 0.7 in most studies despite small datasets. The saliency maps and heatmaps also showed that the models were built on rational reasoning despite the “black box” process of deep learning. Regardless of the outstanding performances presented in mostly retrospective datasets and with handpicked participants, several aspects should be advanced before putting the models in real-world application.
4.1. Present and Prospects
Systemic health features could have significant latent effects on the primeval ocular characteristics. Features such as age, sex, and ethnicity were proven to be credibly identified from ophthalmic data. While predicting age, the algorithms mainly focused on retinal vessels and the optic nerve head (ONH) areas [25,30], which are concordant with the aging of the retina [81,82]. Sex, on the other hand, was identified based on the ONH and the macular area, where innate gender differences in ONH blood supply [83] and FAZ area [84] exist. Besides being the baseline characteristics of the patients, these features could concurrently be risk factors for many systemic diseases. Former reports [7,8] proved that age and sex are interrelated with cardiometabolic risk factors and conditions in retinal image-based DL algorithms, possibly due to their mutual effect on fundus vessels. Therefore, studies targeting diseases with sex or age differences should control for these confounders to prevent overestimating the model’s performance.
Ethnicity was another critical factor proven to be distinguishable from ophthalmic presentations. Aside from affecting the retinal structure [85], ethnicity is also a determinant of the ocular disease spectrum. However, most algorithms were trained on datasets with little to no diversity, affecting the generalizability in real-world scenarios. We suggest that researchers consider data with racial diversity as external validation, and more multi-ethnic datasets should be established to produce generalizable DL models.
Regarding algorithms for diagnosing neurodegenerative diseases based on gazing patterns and eye movements, the communal issues are the limited datasets and the lack of external validation. With video data as input in most cases, these algorithms must be robust against significantly greater interferences to be applied in different real-world scenarios. A large-scale validation in the generalized public would be much preferred for further approval of the DL algorithms.
DL is known for its representation-learning nature. The ocular vasculature, including the conjunctival and the retinal vessels, were some of the most conspicuous and vulnerable structures and were often identified as the focused feature in saliency maps. For instance, metabolic syndrome [86] presented as hypertension, hyperglycemia, and dyslipidemia was found to cause retinal arteriolar narrowing [87]. Arterial defects in these conditions were reported to be caused by a few shared pathophysiology, such as oxidative stress, glutathione peroxidase, and impaired acetylcholine-mediated vasodilatation. As a result, algorithms predicting hypertension, diabetes, and CVD simultaneously highlighted the retinal vessels as the area of interest. On the other hand, CKD causes systemic atherosclerosis and vascular calcification [88], which could also present in the retina as arteriolar thinning and sparse capillaries. Since current studies mainly focused on discriminating the target disease from healthy controls, the algorithms were likely to identify universal pathologies instead of exclusive characteristics of each condition. Therefore, these DL models could lack specificity if applied in real-world scenarios where all systemic diseases coexist. Future studies aiming to distinguish between diseases with similar pathological characteristics would greatly favor the implementation of DL algorithms in real-world screening and diagnosis.
4.2. Advantages and Drawbacks of AI in Clinical Settings
The application of AI algorithms in clinical settings has been a controversial topic. AI models benefit disease screening, diagnosing, and management in several aspects: (a) improve efficiency compared with human graders and enable large-scale screening programs; (b) allow advanced medical technology to reach remote areas with algorithms deployed in portable devices; (c) reduce health-care expenses by saving human resources; and (d) discover preclinical changes for early disease screening. Implementing ophthalmic examinations in disease screening algorithms further provides several advantages. Ophthalmic examinations are non-invasive and rapid compared with other traditional tests; therefore, the screening procedure can be simplified to a great extent. Moreover, the neurovascular structures could be observed intuitively from the ocular anatomy, offering a window for analyzing the underlying morphological and pathological features.
Nonetheless, there are primary disputes about launching AI algorithms in clinical settings. First and foremost is the debate on AI ethics. Models should be thoroughly investigated before being assigned with allowance for real-world tasks. Secondly, the robustness of AI models is often questioned in actual practice. Despite data with varied baseline characteristics, the algorithms could also encounter a variety of low-quality inputs. Researchers should ensure the algorithm can adapt to widely-varied datasets to offer a generalizable and reliable program.
4.3. Strengths and Limitations
This systematic review is the first to conclude deep learning algorithms for systemic disease screening and diagnosing based on ocular data. It provides a comprehensive view of the current trend and methodology in observing various systemic conditions from eye manifestations. We believe this work could be a valuable reference for subsequent studies.
There are some limitations in the current study. According to our selection criteria, studies utilizing DL for feature extraction and statistical methods for condition diagnosis were excluded. This may lead to information loss, as several studies achieving decent results were eliminated. Secondly, our study included meeting abstracts to involve up-to-date research works that have not yet been published. However, the lack of detailed information in the study design translates into unknown risks of bias. Lastly, this review did not inspect the development of deep learning algorithms in detail. Future reviews focusing on AI techniques are preferred to provide further information for computer scientists and program developers.
5. Conclusions
Deep learning has been shown to be beneficial in identifying systemic diseases from ocular presentations. Despite presenting decent performance in the articles, the algorithms still have several shortcomings for clinical application. Future studies should aim at improving the disease specificity and generalizability of the DL models for implementation in real-world screening tasks.
Supplementary Materials
The following supporting information can be downloaded at: https://www.mdpi.com/article/10.3390/diagnostics13050900/s1; Table S1: The search strategy used for obtaining research articles in the three selected databases; Table S2: The detailed results of the QUADAS-2 analysis.
Author Contributions
Conceptualization, H.L. and D.L.; formal analysis, W.C.I., W.Z. and Y.W.; investigation, W.C.I. and W.Z.; data curation, W.C.I. and W.Z.; writing—original draft preparation, W.C.I.; writing—review and editing, H.L., D.L. and X.W.; visualization, W.Z. and W.C.I.; supervision, H.L.; project administration, D.L. and X.W.; funding acquisition, H.L. All authors have read and agreed to the published version of the manuscript.
Funding
This research was funded by the National Natural Science Foundation of China (82171035), the National Natural Science Foundation of China (82000946), the Natural Science Foundation of Guangdong Province (2021A1515012238), the Science and Technology Program of Guangzhou (202201020337), the Guangzhou Science and Technology Project (202201020522), the Science and Technology Planning Projects of Guangdong Province (2021B1111610006), and the Key-Area Research and Development of Guangdong Province (2020B1111190001). The funders had no role in the study design, data collection, data analysis, data interpretation, or writing of the report.
Institutional Review Board Statement
Not applicable.
Informed Consent Statement
Not applicable.
Data Availability Statement
Not applicable.
Acknowledgments
This project is supported by Hainan Province Clinical Medical Center.
Conflicts of Interest
The authors declare no conflict of interest.
References
- LeCun, Y.; Bengio, Y.; Hinton, G. Deep learning. Nature 2015, 521, 436–444. [Google Scholar] [CrossRef]
- van der Heijden, A.A.; Abramoff, M.D.; Verbraak, F.; van Hecke, M.V.; Liem, A.; Nijpels, G. Validation of automated screening for referable diabetic retinopathy with the IDx-DR device in the Hoorn Diabetes Care System. Acta Ophthalmol. 2018, 96, 63–68. [Google Scholar] [CrossRef]
- Ting, D.S.W.; Pasquale, L.R.; Peng, L.; Campbell, J.P.; Lee, A.Y.; Raman, R.; Tan, G.S.W.; Schmetterer, L.; Keane, P.A.; Wong, T.Y. Artificial intelligence and deep learning in ophthalmology. Br. J. Ophthalmol. 2019, 103, 167–175. [Google Scholar] [CrossRef]
- Gargeya, R.; Leng, T. Automated Identification of Diabetic Retinopathy Using Deep Learning. Ophthalmology 2017, 124, 962–969. [Google Scholar] [CrossRef]
- Li, Z.; He, Y.; Keel, S.; Meng, W.; Chang, R.T.; He, M. Efficacy of a Deep Learning System for Detecting Glaucomatous Optic Neuropathy Based on Color Fundus Photographs. Ophthalmology 2018, 125, 1199–1206. [Google Scholar] [CrossRef] [PubMed]
- Burlina, P.M.; Joshi, N.; Pekala, M.; Pacheco, K.D.; Freund, D.E.; Bressler, N.M. Automated Grading of Age-Related Macular Degeneration From Color Fundus Images Using Deep Convolutional Neural Networks. JAMA Ophthalmol. 2017, 135, 1170–1176. [Google Scholar] [CrossRef]
- Chen, X.; Zhao, J.; Iselin, K.C.; Borroni, D.; Romano, D.; Gokul, A.; McGhee, C.N.J.; Zhao, Y.; Sedaghat, M.R.; Momeni-Moghaddam, H.; et al. Keratoconus detection of changes using deep learning of colour-coded maps. BMJ Open Ophthalmol. 2021, 6, e000824. [Google Scholar] [CrossRef] [PubMed]
- Williams, B.M.; Borroni, D.; Liu, R.; Zhao, Y.; Zhang, J.; Lim, J.; Ma, B.; Romano, V.; Qi, H.; Ferdousi, M.; et al. An artificial intelligence-based deep learning algorithm for the diagnosis of diabetic neuropathy using corneal confocal microscopy: A development and validation study. Diabetologia 2020, 63, 419–430. [Google Scholar] [CrossRef] [PubMed]
- Yau, J.W.; Xie, J.; Kawasaki, R.; Kramer, H.; Shlipak, M.; Klein, R.; Klein, B.; Cotch, M.F.; Wong, T.Y. Retinal arteriolar narrowing and subsequent development of CKD Stage 3: The Multi-Ethnic Study of Atherosclerosis (MESA). Am. J. Kidney Dis. 2011, 58, 39–46. [Google Scholar] [CrossRef] [PubMed]
- Zhou, Y.; Zhu, W.; Wang, C. Relationship between retinal vascular occlusions and incident cerebrovascular diseases: A systematic review and meta-analysis. Med. (Baltim.) 2016, 95, e4075. [Google Scholar] [CrossRef]
- Anderson, T.J.; MacAskill, M.R. Eye movements in patients with neurodegenerative disorders. Nat. Rev. Neurol. 2013, 9, 74–85. [Google Scholar] [CrossRef]
- Whiting, P.F.; Rutjes, A.W.; Westwood, M.E.; Mallett, S.; Deeks, J.J.; Reitsma, J.B.; Leeflang, M.M.; Sterne, J.A.; Bossuyt, P.M.; Group, Q. QUADAS-2: A revised tool for the quality assessment of diagnostic accuracy studies. Ann. Intern Med. 2011, 155, 529–536. [Google Scholar] [CrossRef] [PubMed]
- Babenko, B.; Mitani, A.; Traynis, I.; Kitade, N.; Singh, P.; Maa, A.Y.; Cuadros, J.; Corrado, G.S.; Peng, L.; Webster, D.R.; et al. Detection of signs of disease in external photographs of the eyes via deep learning. Nat. Biomed. Eng. 2022, 6, 1370–1383. [Google Scholar] [CrossRef] [PubMed]
- Li, X.; Xia, C.; Li, X.; Wei, S.; Zhou, S.; Yu, X.; Gao, J.; Cao, Y.; Zhang, H. Identifying diabetes from conjunctival images using a novel hierarchical multi-task network. Sci. Rep. 2022, 12, 264. [Google Scholar] [CrossRef] [PubMed]
- Preston, F.G.; Meng, Y.; Burgess, J.; Ferdousi, M.; Azmi, S.; Petropoulos, I.N.; Kaye, S.; Malik, R.A.; Zheng, Y.; Alam, U. Artificial intelligence utilising corneal confocal microscopy for the diagnosis of peripheral neuropathy in diabetes mellitus and prediabetes. Diabetologia 2022, 65, 457–466. [Google Scholar] [CrossRef] [PubMed]
- Scarpa, F.; Colonna, A.; Ruggeri, A. Multiple-Image Deep Learning Analysis for Neuropathy Detection in Corneal Nerve Images. Cornea 2020, 39, 342–347. [Google Scholar] [CrossRef] [PubMed]
- Althnian, A.; Almanea, N.; Aloboud, N. Neonatal Jaundice Diagnosis Using a Smartphone Camera Based on Eye, Skin, and Fused Features with Transfer Learning. Sensors 2021, 21, 7038. [Google Scholar] [CrossRef]
- Lv, W.; Song, Y.; Fu, R.; Lin, X.; Su, Y.; Jin, X.; Yang, H.; Shan, X.; Du, W.; Huang, Q.; et al. Deep Learning Algorithm for Automated Detection of Polycystic Ovary Syndrome Using Scleral Images. Front. Endocrinol. 2021, 12, 789878. [Google Scholar] [CrossRef]
- Xiao, W.; Huang, X.; Wang, J.H.; Lin, D.R.; Zhu, Y.; Chen, C.; Yang, Y.H.; Xiao, J.; Zhao, L.Q.; Li, J.O.; et al. Screening and identifying hepatobiliary diseases through deep learning using ocular images: A prospective, multicentre study. Lancet. Digit. Health 2021, 3, e88–e97. [Google Scholar] [CrossRef]
- Betzler, B.K.; Yang, H.H.S.; Thakur, S.; Yu, M.; Quek, T.C.; Soh, Z.D.; Lee, G.; Tham, Y.C.; Wong, T.Y.; Rim, T.H.; et al. Gender Prediction for a Multiethnic Population via Deep Learning Across Different Retinal Fundus Photograph Fields: Retrospective Cross-sectional Study. JMIR Med. Inf. 2021, 9, e25165. [Google Scholar] [CrossRef]
- Corbin, D.; Lesage, F. Assessment of the predictive potential of cognitive scores from retinal images and retinal fundus metadata via deep learning using the CLSA database. Sci. Rep. 2022, 12, 5767. [Google Scholar] [CrossRef] [PubMed]
- Gerrits, N.; Elen, B.; Craenendonck, T.V.; Triantafyllidou, D.; Petropoulos, I.N.; Malik, R.A.; De Boever, P. Age and sex affect deep learning prediction of cardiometabolic risk factors from retinal images. Sci. Rep. 2020, 10, 9432. [Google Scholar] [CrossRef] [PubMed]
- Hu, W.; Wang, W.; Wang, Y.; Chen, Y.; Shang, X.; Liao, H.; Huang, Y.; Bulloch, G.; Zhang, S.; Kiburg, K.; et al. Retinal age gap as a predictive biomarker of future risk of Parkinson’s disease. Age Ageing 2022, 51, afac062. [Google Scholar] [CrossRef]
- Khan, N.C.; Perera, C.; Dow, E.R.; Chen, K.M.; Mahajan, V.B.; Mruthyunjaya, P.; Do, D.V.; Leng, T.; Myung, D. Predicting Systemic Health Features from Retinal Fundus Images Using Transfer-Learning-Based Artificial Intelligence Models. Diagnostics 2022, 12, 1714. [Google Scholar] [CrossRef]
- Kim, Y.D.; Noh, K.J.; Byun, S.J.; Lee, S.; Kim, T.; Sunwoo, L.; Lee, K.J.; Kang, S.H.; Park, K.H.; Park, S.J. Effects of Hypertension, Diabetes, and Smoking on Age and Sex Prediction from Retinal Fundus Images. Sci. Rep. 2020, 10, 4623. [Google Scholar] [CrossRef]
- Korot, E.; Pontikos, N.; Liu, X.; Wagner, S.K.; Faes, L.; Huemer, J.; Balaskas, K.; Denniston, A.K.; Khawaja, A.; Keane, P.A. Predicting sex from retinal fundus photographs using automated deep learning. Sci. Rep. 2021, 11, 10286. [Google Scholar] [CrossRef]
- Mendoza, L.; Christopher, M.; Brye, N.; Proudfoot, J.A.; Belghith, A.; Bowd, C.; Rezapour, J.; Fazio, M.A.; Goldbaum, M.H.; Weinreb, R.N.; et al. Deep learning predicts demographic and clinical characteristics from optic nerve head OCT circle and radial scans. Investig. Ophthalmol. Vis. Sci. 2021, 62, 2120. [Google Scholar]
- Munk, M.R.; Kurmann, T.; Márquez-Neila, P.; Zinkernagel, M.S.; Wolf, S.; Sznitman, R. Assessment of patient specific information in the wild on fundus photography and optical coherence tomography. Sci. Rep. 2021, 11, 8621. [Google Scholar] [CrossRef]
- Nusinovici, S.; Rim, T.H.; Yu, M.; Lee, G.; Tham, Y.-C.; Cheung, N.; Chong, C.C.Y.; Soh, Z.D.; Thakur, S.; Lee, C.J.; et al. Retinal photograph-based deep learning predicts biological age, and stratifies morbidity and mortality risk. Age Ageing 2022, 51, afac065. [Google Scholar] [CrossRef]
- Poplin, R.; Varadarajan, A.V.; Blumer, K.; Liu, Y.; McConnell, M.V.; Corrado, G.S.; Peng, L.; Webster, D.R. Prediction of cardiovascular risk factors from retinal fundus photographs via deep learning. Nat. Biomed. Eng. 2018, 2, 158–164. [Google Scholar] [CrossRef]
- Rim, T.H.; Lee, G.; Kim, Y.; Tham, Y.-C.; Lee, C.J.; Baik, S.J.; Kim, Y.A.; Yu, M.; Deshmukh, M.; Lee, B.K.; et al. Prediction of systemic biomarkers from retinal photographs: Development and validation of deep-learning algorithms. Lancet Digit. Health 2020, 2, E526–E536. [Google Scholar] [CrossRef] [PubMed]
- Tham, Y.C.; Liu, Y.; Ting, D.; Tjio, G.C.e.; Anees, A.; Tan, G.S.W.; Sabanayagam, C.; Goh, R.; Wong, T.Y.; Cheng, C.-Y. Estimation of Haemoglobin A1c from Retinal photographs via Deep Learning. Investig. Ophthalmol. Vis. Sci. 2019, 60, 1456. [Google Scholar]
- Vaghefi, E.; Yang, S.; Hill, S.; Humphrey, G.; Walker, N.; Squirrell, D. Detection of smoking status from retinal images; a Convolutional Neural Network study. Sci. Rep. 2019, 9, 7180. [Google Scholar] [CrossRef]
- Yang, H.H.S.; Rim, T.H.; Tham, Y.C.; Yoo, T.K.; Lee, G.; Kim, Y.; Wong, T.Y.; Cheng, C.-Y. Deep learning system differentiates ethnicities from fundus photographs of a multi-ethnic Asian population. Investig. Ophthalmol. Vis. Sci. 2020, 61, 5248. [Google Scholar]
- Zhang, L.; Yuan, M.; An, Z.; Zhao, X.; Wu, H.; Li, H.; Wang, Y.; Sun, B.; Li, H.; Ding, S.; et al. Prediction of hypertension, hyperglycemia and dyslipidemia from retinal fundus photographs via deep learning: A cross-sectional study of chronic diseases in central China. PLoS ONE 2020, 15, e0233166. [Google Scholar] [CrossRef]
- Al-Absi, H.R.H.; Islam, M.T.; Refaee, M.A.; Chowdhury, M.E.H.; Alam, T. Cardiovascular Disease Diagnosis from DXA Scan and Retinal Images Using Deep Learning. Sensors 2022, 22, 4310. [Google Scholar] [CrossRef]
- Mellor, J.; Storkey, A.; Colhoun, H.M.; McKeigue, P.; Investigators, S.B. Predicting cardiovascular disease from fundus images using deep learning. Diabetologia 2019, 62, S37. [Google Scholar]
- Chang, J.; Ko, A.; Park, S.M.; Choi, S.; Kim, K.; Kim, S.M.; Yun, J.M.; Kang, U.; Shin, I.H.; Shin, J.Y.; et al. Association of DeepLearning-Based Fundus Age Difference with Carotid Atherosclerosis and Mortality. In Proceedings of the IEEE International Conference on Bioinformatics and Biomedicine (BIBM), San Diego, CA, USA, 18–21 November 2019; pp. 1179–1181. [Google Scholar]
- Ng, W.W.Y.; Liang, H.; Peng, Q.; Zhong, C.; Dong, X.; Huang, Z.; Zhong, P.; Li, C.; Xu, M.; Sun, Y.; et al. An automatic framework for perioperative risks classification from retinal images of complex congenital heart disease patients. Int. J. Mach. Learn. Cybern. 2022, 13, 471–483. [Google Scholar] [CrossRef]
- Mueller, S.; Wintergerst, M.W.M.; Falahat, P.; Holz, F.G.; Schaefer, C.; Schahab, N.; Finger, R.P.; Schultz, T. Multiple instance learning detects peripheral arterial disease from high-resolution color fundus photography. Sci. Rep. 2022, 12, 1389. [Google Scholar] [CrossRef]
- Chang, J.; Ko, A.; Park, S.M.; Choi, S.; Kim, K.; Kim, S.M.; Yun, J.M.; Kang, U.; Shin, I.H.; Shin, J.Y.; et al. Association of Cardiovascular Mortality and Deep Learning-Funduscopic Atherosclerosis Score derived from Retinal Fundus Images. Am. J. Ophthalmol. 2020, 217, 121–130. [Google Scholar] [CrossRef]
- Barriada, R.G.; Simo-Servat, O.; Planas, A.; Hernandez, C.; Simo, R.; Masip, D. Deep Learning of Retinal Imaging: A Useful Tool for Coronary Artery Calcium Score Prediction in Diabetic Patients. Appl. Sci. 2022, 12, 1401. [Google Scholar] [CrossRef]
- Rim, T.H.; Lee, C.J.; Tham, Y.C.; Cheung, N.; Yu, M.; Lee, G.; Kim, Y.; Ting, D.S.W.; Chong, C.C.Y.; Choi, Y.S.; et al. Deep-learning-based cardiovascular risk stratification using coronary artery calcium scores predicted from retinal photographs. Lancet. Digit. Health 2021, 3, e306–e316. [Google Scholar] [CrossRef]
- Son, J.; Shin, J.Y.; Chun, E.J.; Jung, K.-H.; Park, K.H.; Park, S.J. Predicting High Coronary Artery Calcium Score From Retinal Fundus Images With Deep Learning Algorithms. Transl. Vis. Sci. Technol. 2020, 9, 28. [Google Scholar] [CrossRef] [PubMed]
- Dai, G.; He, W.; Xu, L.; Pazo, E.E.; Lin, T.; Liu, S.; Zhang, C. Exploring the effect of hypertension on retinal microvasculature using deep learning on East Asian population. PLoS ONE 2020, 15, e0230111. [Google Scholar] [CrossRef] [PubMed]
- Lo, Y.; Qu, L.; Li, C.; Yang, C.; Qin, P.; Dong, Y. AML-Net: A Preliminary Screening Model for Mild Hypertension. In Proceedings of the 14th International Congress on Image and Signal Processing, BioMedical Engineering and Informatics (CISP-BMEI), Shanghai, China, 23–25 October 2021. [Google Scholar]
- Islam, M.T.; Al-Absi, H.R.H.; Ruagh, E.A.; Alam, T. DiaNet: A Deep Learning Based Architecture to Diagnose Diabetes Using Retinal Images Only. IEEE Access 2021, 9, 15686–15695. [Google Scholar] [CrossRef]
- Wang, R.; Li, P.; Yang, Z. Analysis and Recognition of Clinical Features of Diabetes Based on Convolutional Neural Network. Comput. Math. Methods Med. 2022, 2022, 7902786. [Google Scholar] [CrossRef] [PubMed]
- Zhang, J.; Deng, K.; Chen, B.; Lan, H.; Zhou, M.; Gao, F. Pathology Study for Blood Vessel of Ocular Fundus Images by Photoacoustic Tomography. In Proceedings of the IEEE International Ultrasonics Symposium (IUS), Kobe, Japan, 22–25 October 2018. [Google Scholar]
- Abbasi-Sureshjani, S.; Dashtbozorg, B.; Romeny, B.M.t.H.; Fleuret, F. Exploratory Study on Direct Prediction of Diabetes Using Deep Residual Networks. In Proceedings of the 6th ECCOMAS Thematic Conference on Computational Vision and Medical Image Processing (VipIMAGE), Porto, Portugal, 18–20 October 2017; pp. 797–802. [Google Scholar]
- Heslinga, F.G.; Pluim, J.P.W.; Houben, A.J.H.M.; Schram, M.T.; Henry, R.M.A.; Stehouwer, C.D.A.; van Greevenbroek, M.J.; Berendschot, T.T.J.M.; Veta, M. Direct Classification of Type 2 Diabetes From Retinal Fundus Images in a Population-based Sample From The Maastricht Study. In Proceedings of the Conference on Medical Imaging—Computer-Aided Diagnosis, Houston, TX, USA, 16–19 February 2020. [Google Scholar]
- Yun, J.S.; Kim, J.; Jung, S.H.; Cha, S.A.; Ko, S.H.; Ahn, Y.B.; Won, H.H.; Sohn, K.A.; Kim, D. A deep learning model for screening type 2 diabetes from retinal photographs. Nutr. Metab. Cardiovasc. Dis. NMCD 2022, 32, 1218–1226. [Google Scholar] [CrossRef]
- Cervera, D.R.; Smith, L.; Diaz-Santana, L.; Kumar, M.; Raman, R.; Sivaprasad, S. Identifying peripheral neuropathy in colour fundus photographs based on deep learning. Diagnostics 2021, 11, 1943. [Google Scholar] [CrossRef]
- Mitani, A.; Huang, A.; Venugopalan, S.; Corrado, G.S.; Peng, L.; Webster, D.R.; Hammel, N.; Liu, Y.; Varadarajan, A.V. Detection of anaemia from retinal fundus images via deep learning. Nat. Biomed. Eng. 2020, 4, 18–27. [Google Scholar] [CrossRef]
- Wei, H.; Shen, H.; Li, J.; Zhao, R.; Chen, Z. AneNet: A lightweight network for the real-time anemia screening from retinal vessel optical coherence tomography images. Opt. Laser Technol. 2021, 136, 106773. [Google Scholar] [CrossRef]
- Zhao, X.; Meng, L.; Su, H.; Lv, B.; Lv, C.; Xie, G.; Chen, Y. Deep-Learning-Based Hemoglobin Concentration Prediction and Anemia Screening Using Ultra-Wide Field Fundus Images. Front. Cell Dev. Biol. 2022, 10, 888268. [Google Scholar] [CrossRef]
- Kang, E.Y.-C.; Hsieh, Y.-T.; Li, C.-H.; Huang, Y.-J.; Kuo, C.-F.; Kang, J.-H.; Chen, K.-J.; Lai, C.-C.; Wu, W.-C.; Hwang, Y.-S. Deep Learning-Based Detection of Early Renal Function Impairment Using Retinal Fundus Images: Model Development and Validation. JMIR Med. Inform. 2020, 8, e23472. [Google Scholar] [CrossRef] [PubMed]
- Sabanayagam, C.; Xu, D.; Ting, D.S.W.; Nusinovici, S.; Banu, R.; Hamzah, H.; Lim, C.; Tham, Y.C.; Cheung, C.Y.; Tai, E.S.; et al. A deep learning algorithm to detect chronic kidney disease from retinal photographs in community-based populations. Lancet. Digit. Health 2020, 2, e295–e302. [Google Scholar]
- Zhang, K.; Liu, X.; Xu, J.; Yuan, J.; Cai, W.; Chen, T.; Wang, K.; Gao, Y.; Nie, S.; Xu, X.; et al. Deep-learning models for the detection and incidence prediction of chronic kidney disease and type 2 diabetes from retinal fundus images. Nat. Biomed. Eng. 2021, 5, 533–545. [Google Scholar] [CrossRef]
- Cho, B.-J.; Lee, M.; Han, J.; Kwon, S.; Oh, M.S.; Yu, K.-H.; Lee, B.-C.; Kim, J.H.; Kim, C. Prediction of White Matter Hyperintensity in Brain MRI Using Fundus Photographs via Deep Learning. J. Clin. Med. 2022, 11, 3309. [Google Scholar]
- Appaji, A.; Harish, V.; Korann, V.; Devi, P.; Jacob, A.; Padmanabha, A.; Kumar, V.; Varambally, S.; Venkatasubramanian, G.; Rao, S.V.; et al. Deep learning model using retinal vascular images for classifying schizophrenia. Schizophr. Res. 2022, 241, 238–243. [Google Scholar] [CrossRef] [PubMed]
- Lai, M.; Lee, J.; Chiu, S.; Charm, J.; So, W.Y.; Yuen, F.P.; Kwok, C.; Tsoi, J.; Lin, Y.; Zee, B. A machine learning approach for retinal images analysis as an objective screening method for children with autism spectrum disorder. EClinicalMedicine 2020, 28, 100588. [Google Scholar] [CrossRef]
- Wisely, C.E.; Wang, D.; Henao, R.; Grewal, D.S.; Yoon, S.P.; Polascik, B.; Thompson, A.C.; Burke, J.R.; Carin, L.; Fekrat, S. Deep learning algorithm for diagnosis of Alzheimer’s disease using multimodal retinal imaging. Investig. Ophthalmol. Vis. Sci. 2019, 60, 1461. [Google Scholar]
- Huang, Y.J.; Kuo, C.F.; Huang, Y.H.; Hwang, Y.S.; Lin, C. Detecting Subtle Changes in Fundoscopic Retinal Images in Patients with Axial Spondyloarthritis with Deep Learning. Arthritis Rheumatol. 2020, 72 (Suppl. S10), 2629–2630. [Google Scholar]
- Esen, A.M.; Barutcu, I.; Acar, M.; Degirmenci, B.; Kaya, D.; Turkmen, M.; Melek, M.; Onrat, E.; Esen, O.B.; Kirma, C. Effect of smoking on endothelial function and wall thickness of brachial artery. Circ. J. 2004, 68, 1123–1126. [Google Scholar]
- Wang, S.B.; Mitchell, P.; Liew, G.; Wong, T.Y.; Phan, K.; Thiagalingam, A.; Joachim, N.; Burlutsky, G.; Gopinath, B. A spectrum of retinal vasculature measures and coronary artery disease. Atherosclerosis 2018, 268, 215–224. [Google Scholar] [CrossRef]
- Polonsky, T.S.; McClelland, R.L.; Jorgensen, N.W.; Bild, D.E.; Burke, G.L.; Guerci, A.D.; Greenland, P. Coronary artery calcium score and risk classification for coronary heart disease prediction. Jama 2010, 303, 1610–1616. [Google Scholar] [CrossRef]
- Ding, J.; Wai, K.L.; McGeechan, K.; Ikram, M.K.; Kawasaki, R.; Xie, J.; Klein, R.; Klein, B.B.; Cotch, M.F.; Wang, J.J.; et al. Retinal vascular caliber and the development of hypertension: A meta-analysis of individual participant data. J. Hypertens. 2014, 32, 207–215. [Google Scholar] [CrossRef] [PubMed]
- Ang, S.H.; Thevarajah, M.; Alias, Y.; Khor, S.M. Current aspects in hemoglobin A1c detection: A review. Clin. Chim. Acta 2015, 439, 202–211. [Google Scholar] [CrossRef]
- Eckstein, M.K.; Guerra-Carrillo, B.; Miller Singley, A.T.; Bunge, S.A. Beyond eye gaze: What else can eyetracking reveal about cognition and cognitive development? Dev. Cogn. Neurosci. 2017, 25, 69–91. [Google Scholar] [CrossRef] [PubMed]
- Mengoudi, K.; Ravi, D.; Yong, K.X.X.; Primativo, S.; Pavisic, I.M.; Brotherhood, E.; Lu, K.; Schott, J.M.; Crutch, S.J.; Alexander, D.C. Augmenting dementia cognitive assessment with instruction-less eye-tracking tests. IEEE J. Biomed. Health Inform. 2020, 24, 3066–3075. [Google Scholar] [CrossRef] [PubMed]
- Biondi, J.; Fernandez, G.; Castro, S.; Agamennoni, O. Eye movement behavior identification for Alzheimer’s disease diagnosis. J. Integr. Neurosci. 2018, 17, 349–354. [Google Scholar]
- Archila, J.; Manzanera, A.; Martinez, F. A recurrent approach for predicting Parkinson stage from multimodal videos. In Proceedings of the 17th International Symposium on Medical Information Processing and Analysis, Campinas, Brazil, 17–19 November 2021. [Google Scholar]
- Li, J.; Chen, Z.; Zhong, Y.; Lam, H.-K.; Han, J.; Ouyang, G.; Li, X.; Liu, H. Appearance-Based Gaze Estimation for ASD Diagnosis. Ieee Trans. Cybern. 2022, 52, 6504–6517. [Google Scholar] [CrossRef] [PubMed]
- Li, J.; Zhong, Y.; Han, J.; Ouyang, G.; Li, X.; Liu, H. Classifying ASD children with LSTM based on raw videos. Neurocomputing 2020, 390, 226–238. [Google Scholar] [CrossRef]
- Varma, M.; Washington, P.; Chrisman, B.; Kline, A.; Leblanc, E.; Paskov, K.; Stockham, N.; Jung, J.Y.; Sun, M.W.; Wall, D.P. Identification of Social Engagement Indicators Associated With Autism Spectrum Disorder Using a Game-Based Mobile App: Comparative Study of Gaze Fixation and Visual Scanning Methods. J. Med. Internet Res. 2022, 24, e31830. [Google Scholar] [CrossRef] [PubMed]
- Xie, J.; Wang, L.; Webster, P.; Yao, Y.; Sun, J.; Wang, S.; Zhou, H. Identifying Visual Attention Features Accurately Discerning Between Autism and Typically Developing: A Deep Learning Framework. Interdiscip. Sci. -Comput. Life Sci. 2022, 14, 639–651. [Google Scholar] [CrossRef]
- Jiang, M.; Zhao, Q. Learning Visual Attention to Identify People with Autism Spectrum Disorder. In Proceedings of the 2017 IEEE International Conference on Computer Vision (ICCV), Venice, Italy, 22–29 October 2017; pp. 3287–3296. [Google Scholar]
- Mao, Y.; He, Y.; Liu, L.; Chen, X. Disease Classification Based on Synthesis of Multiple Long Short-Term Memory Classifiers Corresponding to Eye Movement Features. IEEE Access 2020, 8, 151624–151633. [Google Scholar] [CrossRef]
- Ahmadi, S.A.; Vivar, G.; Navab, N.; Möhwald, K.; Maier, A.; Hadzhikolev, H.; Brandt, T.; Grill, E.; Dieterich, M.; Jahn, K.; et al. Modern machine-learning can support diagnostic differentiation of central and peripheral acute vestibular disorders. J. Neurol. 2020, 267, 143–152. [Google Scholar] [CrossRef] [PubMed]
- Grossniklaus, H.E.; Nickerson, J.M.; Edelhauser, H.F.; Bergman, L.A.; Berglin, L. Anatomic alterations in aging and age-related diseases of the eye. Investig. Ophthalmol. Vis. Sci. 2013, 54, ORSF23–ORSF27. [Google Scholar] [CrossRef]
- Ehrlich, R.; Kheradiya, N.S.; Winston, D.M.; Moore, D.B.; Wirostko, B.; Harris, A. Age-related ocular vascular changes. Graefe’s Arch. Clin. Exp. Ophthalmol. = Albrecht Von Graefes Arch. Fur Klin. Und Exp. Ophthalmol. 2009, 247, 583–591. [Google Scholar] [CrossRef] [PubMed]
- Kobayashi, T.; Shiba, T.; Kinoshita, A.; Matsumoto, T.; Hori, Y. The influences of gender and aging on optic nerve head microcirculation in healthy adults. Sci. Rep. 2019, 9, 15636. [Google Scholar] [CrossRef] [PubMed]
- Gomez-Ulla, F.; Cutrin, P.; Santos, P.; Fernandez, M.; Abraldes, M.; Abalo-Lojo, J.M.; Gonzalez, F. Age and gender influence on foveal avascular zone in healthy eyes. Exp. Eye Res. 2019, 189, 107856. [Google Scholar] [CrossRef] [PubMed]
- Tariq, Y.M.; Samarawickrama, C.; Pai, A.; Burlutsky, G.; Mitchell, P. Impact of ethnicity on the correlation of retinal parameters with axial length. Investig. Ophthalmol. Vis. Sci. 2010, 51, 4977–4982. [Google Scholar] [CrossRef]
- Alberti, K.G.; Zimmet, P.; Shaw, J. Metabolic syndrome—a new world-wide definition. A Consensus Statement from the International Diabetes Federation. Diabet. Med. 2006, 23, 469–480. [Google Scholar] [CrossRef]
- Wang, S.B.; Mitchell, P.; Plant, A.J.; Phan, K.; Liew, G.; Thiagalingam, A.; Burlutsky, G.; Gopinath, B. Metabolic syndrome and retinal microvascular calibre in a high cardiovascular disease risk cohort. Br. J. Ophthalmol. 2016, 100, 1041–1046. [Google Scholar] [CrossRef]
- Dusing, P.; Zietzer, A.; Goody, P.R.; Hosen, M.R.; Kurts, C.; Nickenig, G.; Jansen, F. Vascular pathologies in chronic kidney disease: Pathophysiological mechanisms and novel therapeutic approaches. J. Mol. Med. 2021, 99, 335–348. [Google Scholar] [CrossRef] [PubMed]


Disclaimer/Publisher’s Note: The statements, opinions and data contained in all publications are solely those of the individual author(s) and contributor(s) and not of MDPI and/or the editor(s). MDPI and/or the editor(s) disclaim responsibility for any injury to people or property resulting from any ideas, methods, instructions or products referred to in the content. |
© 2023 by the authors. Licensee MDPI, Basel, Switzerland. This article is an open access article distributed under the terms and conditions of the Creative Commons Attribution (CC BY) license (https://creativecommons.org/licenses/by/4.0/).