Abstract
The present study aimed to evaluate the effectiveness of different filters in improving the quality of myocardial perfusion single-photon emission computed tomography (SPECT) images. Data were collected using the Siemens Symbia T2 dual-head SPECT/Computed tomography (CT) scanner. Our dataset included more than 900 images from 30 patients. The quality of the SPECT was evaluated after applying filters such as the Butterworth, Hamming, Gaussian, Wiener, and median–modified Wiener filters with different kernel sizes, by calculating indicators such as the signal-to-noise ratio (SNR), peak signal-to-noise ratio (PSNR), and contrast-to-noise ratio (CNR). SNR and CNR were highest with the Wiener filter with a kernel size of 5 × 5. Additionally, the Gaussian filter achieved the highest PSNR. The results revealed that the Wiener filter, with a kernel size of 5 × 5, outperformed the other filters for denoising images of our dataset. The novelty of this study includes comparison of different filters to improve the quality of myocardial perfusion SPECT. As far as we know, this is the first study to compare the mentioned filters on myocardial perfusion SPECT images, using our datasets with specific noise structures and mentioning all the elements necessary for its presentation within one document.
1. Introduction
It is estimated that 17.9 million deaths are caused each year by the cardiovascular diseases, including coronary artery diseases (CAD) such as angina and myocardial infarction [1]. Non-invasive myocardial perfusion imaging (MPI) plays an important role in the diagnosis of CAD [2]. By MPI tests, regional changes in blood flow patterns can be assessed during various physiological conditions of rest and cardiovascular stress (e.g., normal vs. ischemic and fibrotic scar) [3]. Additionally, it provides information on the myocardial function that is superior to anatomic assessment alone [4]. MPI can be completed with positron emission tomography (PET), single-photon emission computed tomography (SPECT), magnetic resonance imaging (MRI), or computed tomography (CT) tests. Among the mentioned non-invasive methods, PET is considered the gold standard. However, it is not widely used since it is expensive in terms of purchasing equipment compared to PET; SPECT-MPI is cheaper and more readily available. SPECT-MPI is widely used to diagnose patients with or suspected of having CAD. It can provide important information about myocardial perfusion and function [5]. SPECT images are commonly noisy, because gamma rays are attenuated and scattered before they hit the detector [6]. In digital image processing, finding a technique that can remove noise from SPECT images has been a long-term issue, because these images have high noise level and low contrast.
Noise in nuclear medicine images is identified as random and structural noises. Random noise results from statistical variations in the count rate, which is related to the information density measured as counts per unit area. While structural noise can be described as non-random asymmetries in the distribution of radioactivity, which reduces the structural information of the target organ [7]. The main noise sources in SPECT images include inherent random changes in the unlimited photon count, electronic tracking, and data recording systems, and limited time for preparing each slice [8,9]. Therefore, investigating the types of noises and their sources requires designing a noise-removal algorithm for SPECT images. Usually, SPECT images contain noise with an independent and uniform distribution, which has a Gaussian nature throughout the image [8]. Filtering is a technique used to modify or improve image quality. For instance, an image can be filtered to emphasize some features or remove other features. The image processing operations involved in filtering include smoothing, sharpening, and edge enhancement. Filtering is a neighborhood operation in which the value of any given pixel in the output image is determined by applying an algorithm to the values of the neighboring pixels of the corresponding input pixel. Occasionally, the low-frequency signals of noisy images must be preserved, and high-frequency signals are removed for optimal filtering. Consequently, a low-pass filter is appropriate for this task [10].
Masoomi et al. (2019) [11] conducted phantom chest imaging to re-evaluate 92 male and female patients (41–77 years) with suspected CAD. They determined that among the Hanning, Hamming, Parzen, Butterworth, Metz, and Wiener filters, the Wiener filter produced the highest contrast results for cold and warm spheres in the phantom and for the patient. Sayed and Ismail (2020) [12] investigated the effects of two types of reconstruction filters, namely Butterworth and Hamming, on the quality of images in hot and cold regions. In their study, the Butterworth filter showed more hot and cold regions in the reconstructed images. It also had higher contrast values than those of the Hamming filter. However, with the Butterworth filter, a reduction in the signal-to-noise ratio (SNR) was achieved for both regions, as the cut-off frequency increased relative to the Hamming filter. Kim et al. (2021) [13] investigated the usefulness of the MMWF algorithm for improving SPECT images using a three-dimensional Hoffmann brain phantom injected with radioisotope . They showed that brain images were improved using the MMWF algorithm. A more comprehensive comparison of the literature is presented in Table 1.

Table 1.
Literature table.
Despite these efforts, limited studies have been accomplished to assess the application of the modified–median Wiener (MMWF) filter to myocardial perfusion SPECT images. Therefore, the present study aimed to evaluate the effectiveness of using these filters to increase the quality of myocardial perfusion SPECT images by comparing their signal-to-noise ratio (SNR), peak signal-to-noise ratio (PSNR), and contrast-to-noise ratio (CNR).
2. Materials and Methods
2.1. Materials
Image Preparation and Data Collection
Nuclear cardiology is expanding within nuclear medicine applications, even today. Identifying each patient’s characteristics and conditions permits nuclear medicine technologists to adjust the protocol, resulting in significant advantages for every patient. In this regard, the Technologist Committee of the European Association of Nuclear Medicine (EANM) proposed recommendations for best practice in computed tomography applied to attenuation correction and calcium score in myocardial perfusion imaging, which defines the set of knowledge, skills, and competencies for nuclear medicine technologists [15].
Our dataset was provided according to EANM procedural guidelines for radionuclide myocardial perfusion imaging with SPECT and SPECT/CT [16]. Thirty-two patients, including 17 women and 15 men, were considered. Two women were excluded from our dataset due to pregnancy. Accordingly, myocardial perfusion SPECT images of 30 patients (15 men and 15 women) aged 47–75 years with a body mass index of 28.3 ± 4.1 were included. These images were obtained at the Shahid Chamran Hospital of Isfahan, Iran, using a Siemens Symbia T2 dual-head SPECT/CT scanner. Imaging was performed in two phases: rest and stress tests. In the rest test, based on the patient’s weight, 15–20 mCi (99m Tc-methoxy isobutyl isonitrile) was injected intravenously into the patient, and imaging was repeated after 45 min. In the stress test, the patient’s heart rate was increased by exercise (treadmill) or by administering special drugs, such as dipyridamole, and then 20–25 mCi was injected into the patient. Subsequently, another image was captured after 15–45 min. Table 2 lists the specifications of the imaging performed in this study. The , or -sestamibi, is used for diagnostic purposes in cardiac, breast, and parathyroid tissues. As is released slowly from myocardial tissue after cellular uptake, higher-quality imaging is facilitated [17].
Table 2.
Characteristics of myocardial perfusion SPECT images.
2.2. Methods
The steps of this study are as follows: first, data were collected at Chamran Hospital, Iran. Second, filters such as Butterworth, Hamming, Gaussian, and Wiener, with different kernel sizes, and MMWF with different kernel sizes were applied to enhance the quality of myocardial perfusion SPECT images. Third, the qualities of the SPECT images were evaluated by calculating indicators, such as SNR, PSNR, and CNR. Moreover, statistical analysis was performed using one way-ANOVA test. Finally, the obtained indicators were compared and the best filter for denoising our dataset was selected and introduced. These steps are demonstrated in Figure 1.
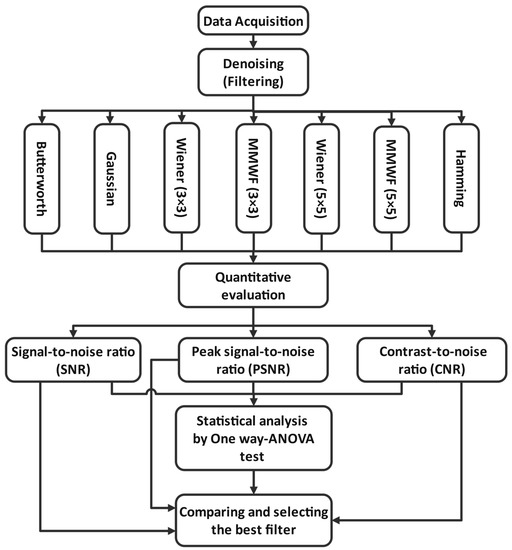
Figure 1.
Steps followed in this study (x × x represents the kernel size).
2.2.1. Filtering
Filters such as Butterworth, Hamming Gaussian, Wiener, and MMWF are often used for SPECT image denoising, to limit the effect of noise on the interpretation and analysis of images [18]. These filters can be applied in both spatial and frequency domains. They were used in this study, which is briefly explained below.
- (1)
- Butterworth filter
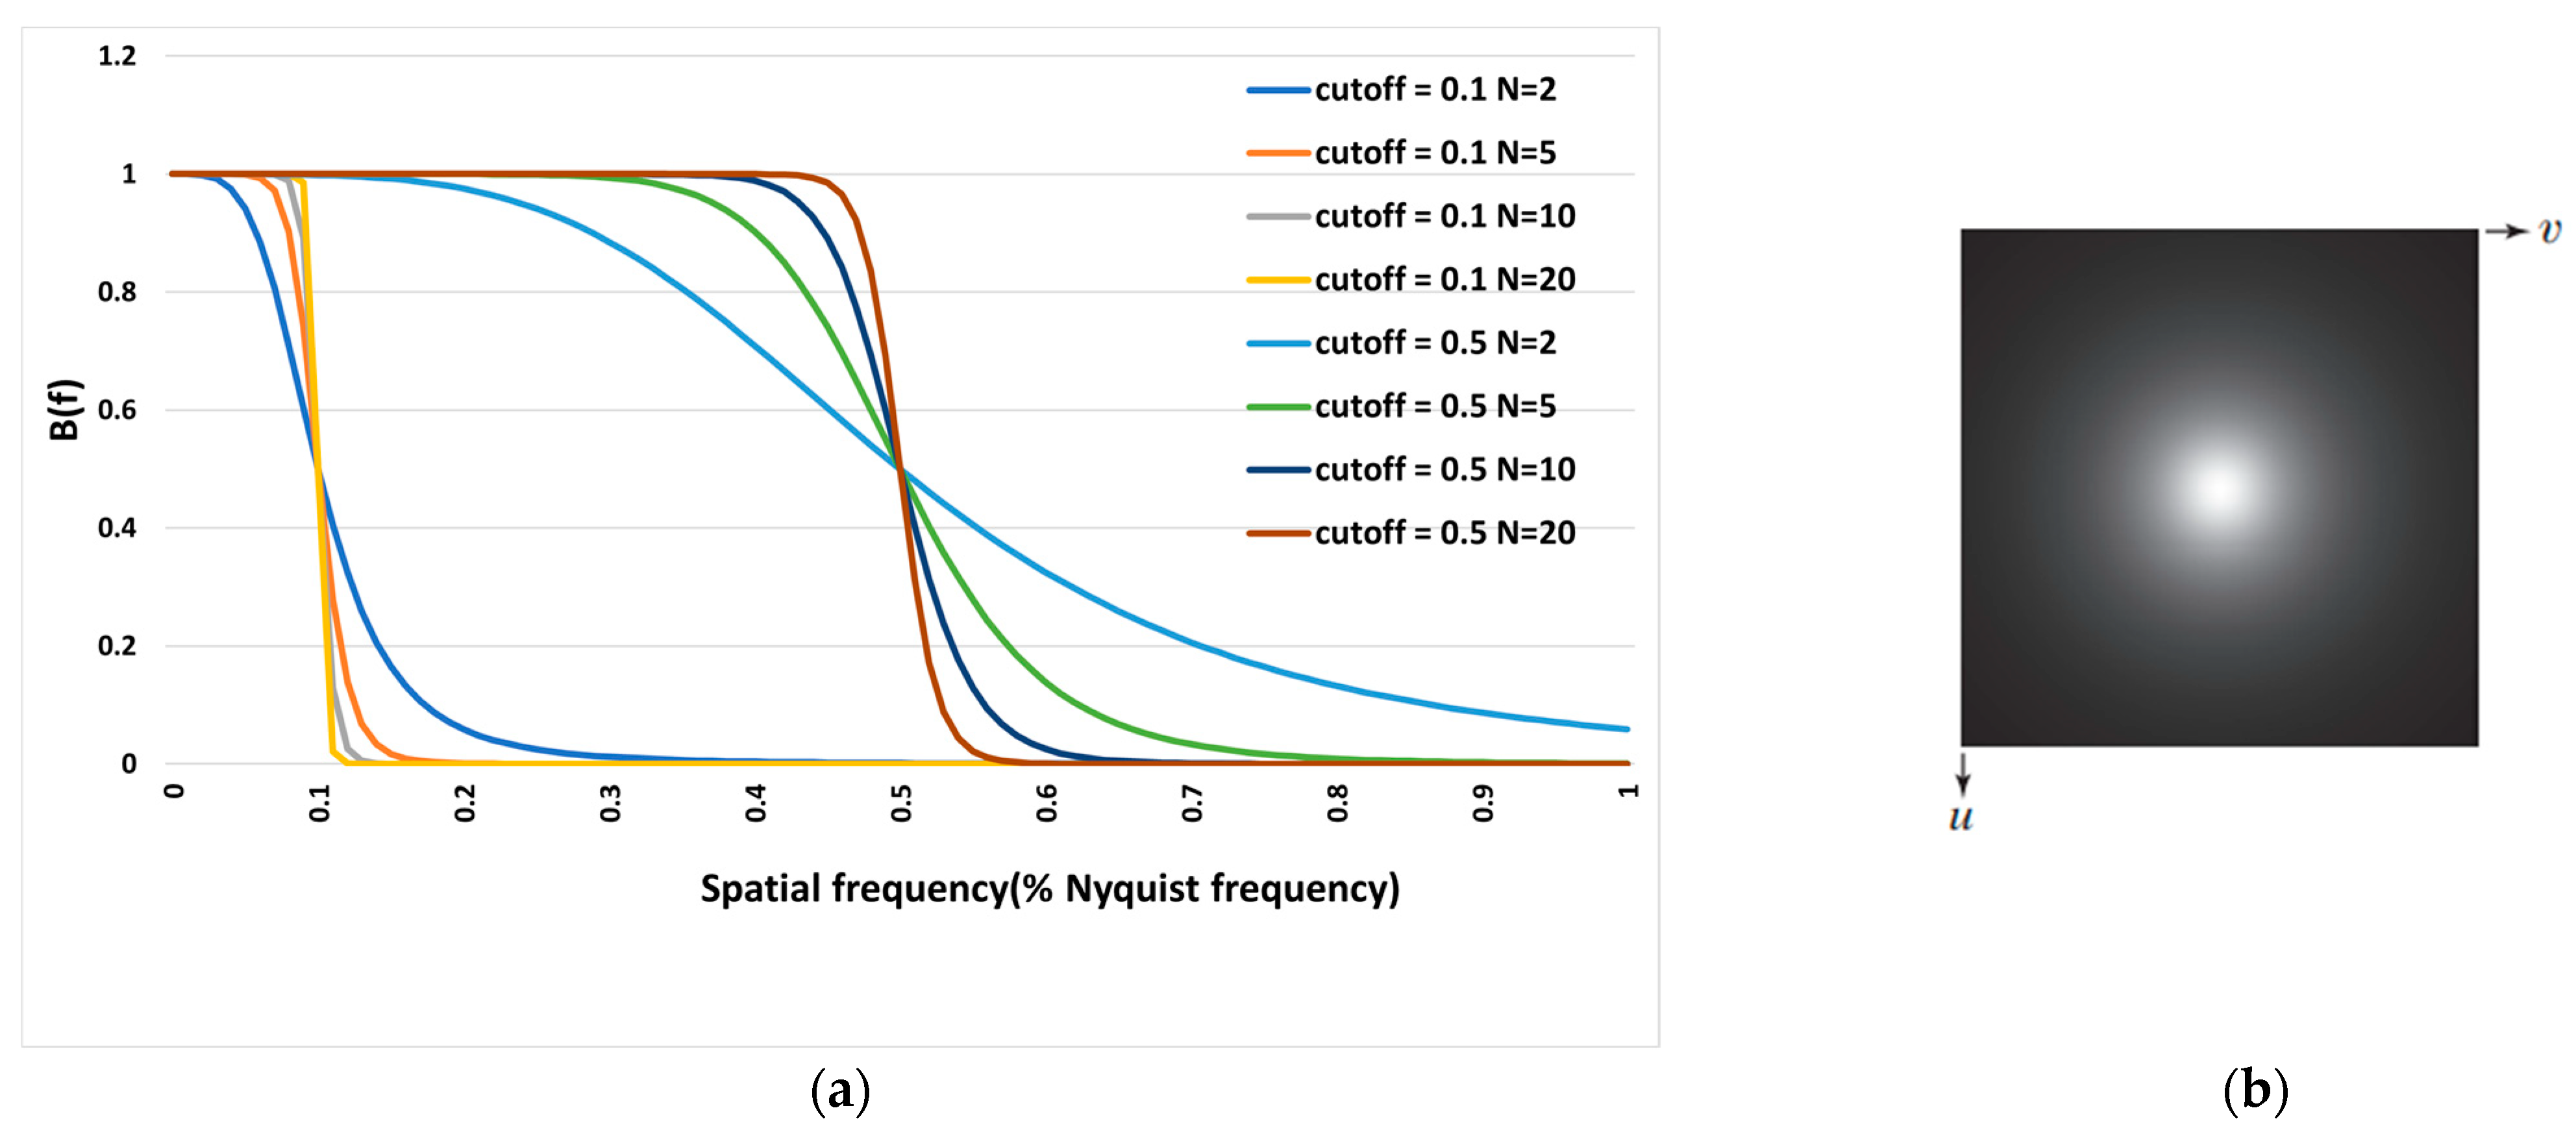
The Butterworth filter is the most common low-pass filter in nuclear medicine and is characterized by two parameters: (1) cut-off frequency, which is the frequency at which the filter function goes to zero; and (2) order, which changes the slope of the filter [19]. Regarding the ability to change the cut-off frequency and the filter’s slope, the Butterworth filter can reduce noise and maintain image clarity. The Butterworth filter in the frequency domain is defined as:
where is the spatial frequency domain, is the cut-off frequency, and n is the filter order.
As shown in Figure 2, as n approaches infinity, the Butterworth function becomes a rectangular function, and frequencies lower than are transferred while frequencies higher than are removed. The larger n becomes, the sharper the filter function, and vice versa. In addition, with increasing the cut-off frequency increases, more frequencies are transmitted. In this study, we investigated n levels ranging from 5 to 10 and cut-off frequencies from 0.3 Nq (Nyquist frequency) to 0.7 Nq.
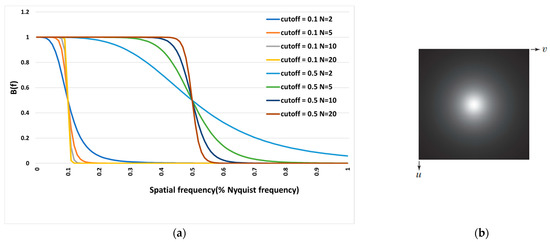
Figure 2.
Diagram (a) of the Butterworth filter in terms of spatial frequency (Nyquist frequency percentage) and (b) the representation of the Butterworth filter function as an image.
- (2)
- Gaussian filter
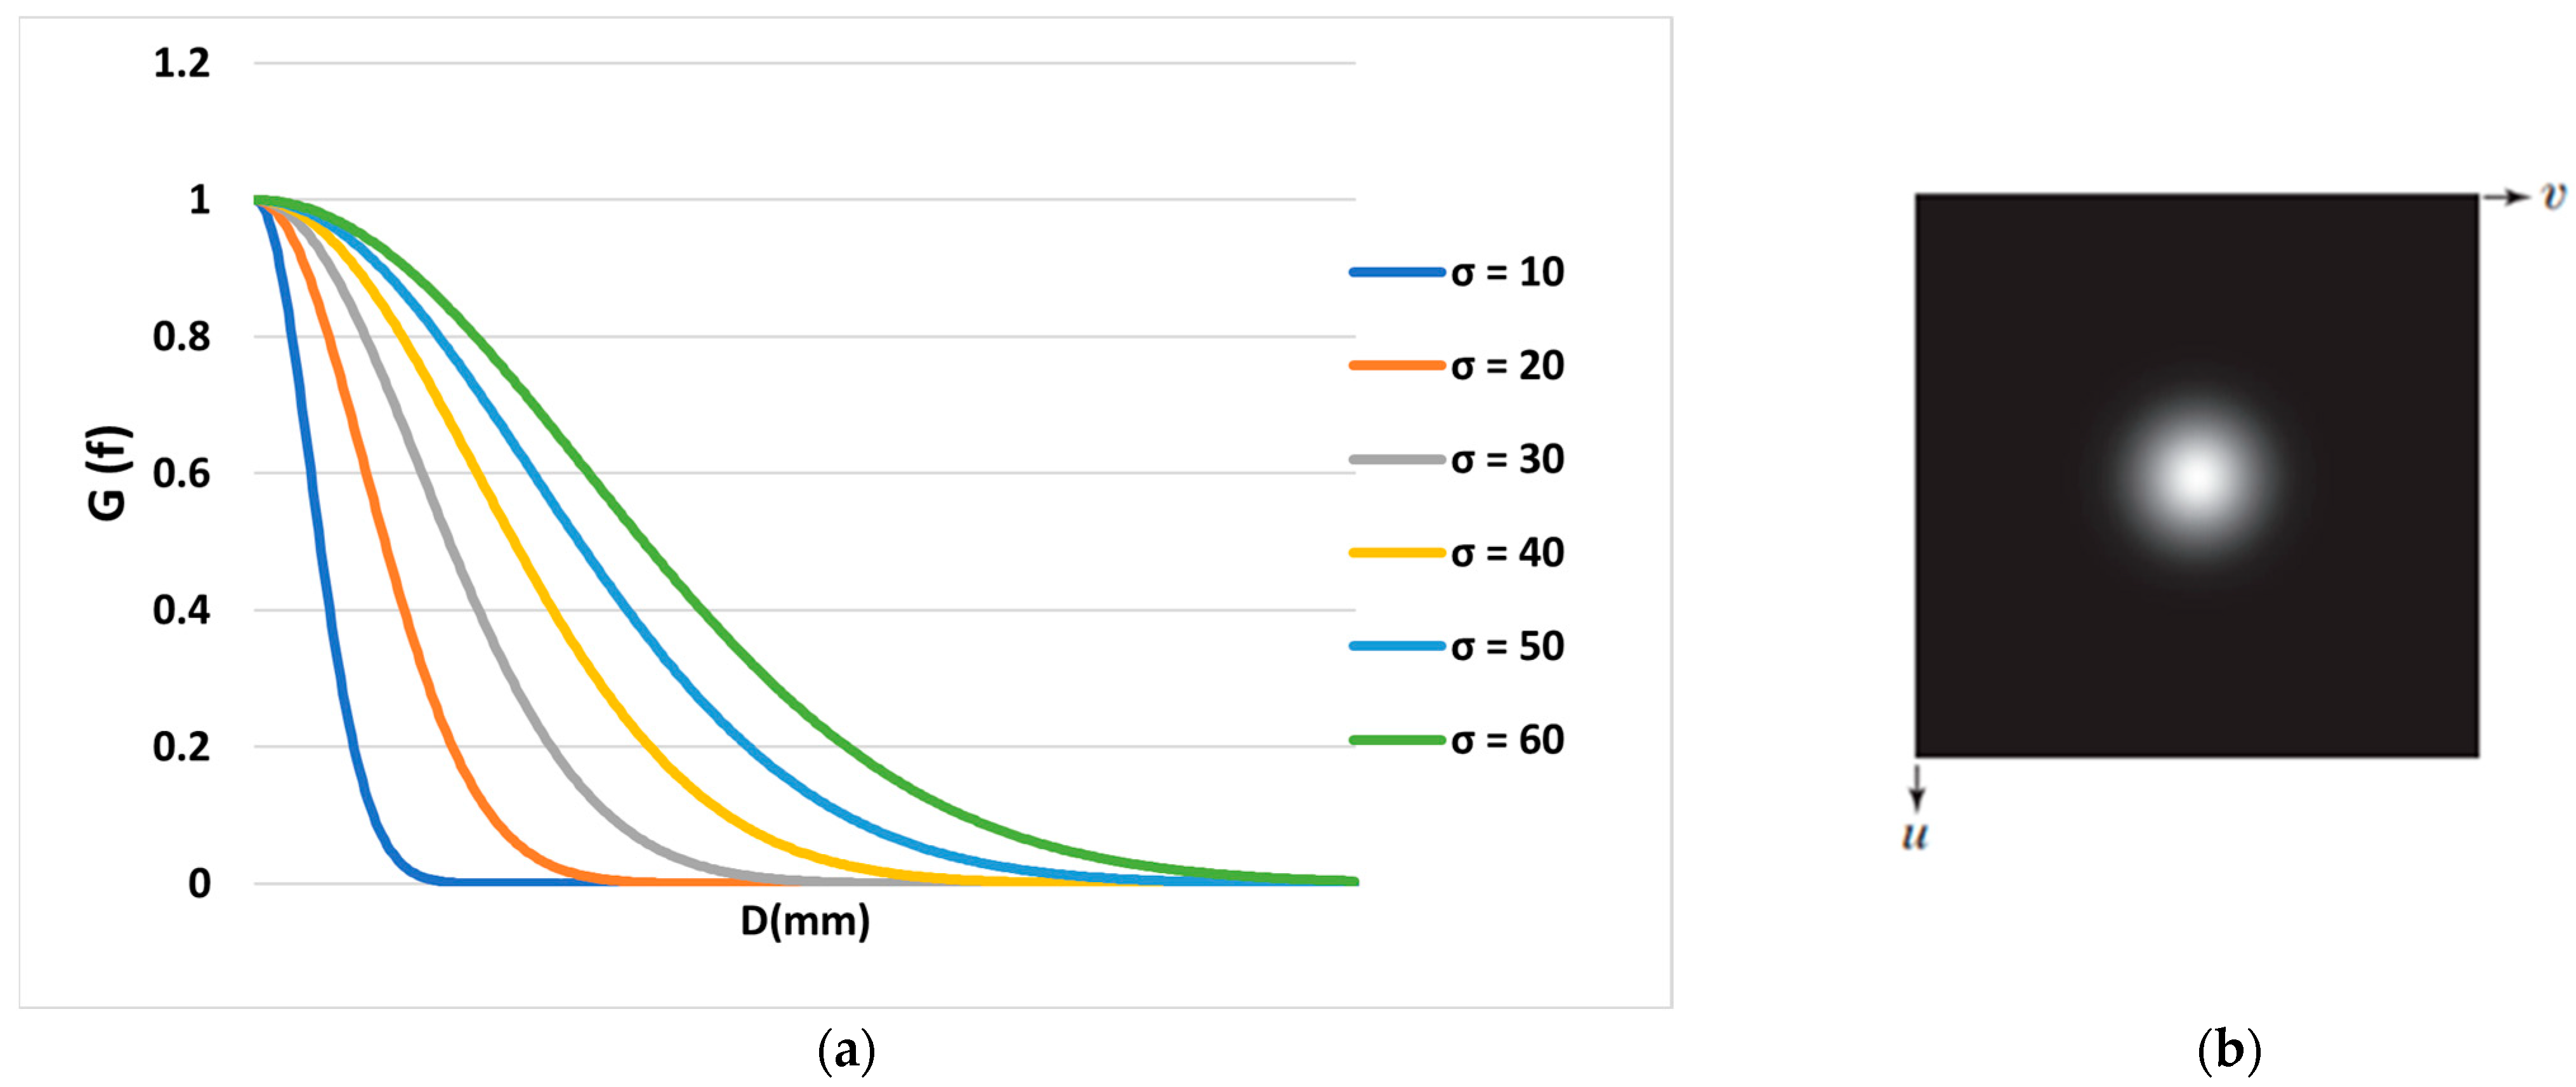
This filter, which is used to remove noise or high-frequency components of an image, is defined as follows [20]:
where is the distance between points to the center of the filter and is the standard deviation. When applied in two dimensions, this formula produces a surface whose lines are concentric circles with a Gaussian distribution from the center point. As shown in Figure 3, with an increase in σ, the slope of the graph decreases, and more frequencies are transmitted.

Figure 3.
(a) Gaussian filter diagram according to the distance from the point to the center of the filter and (b) Gaussian filter function display as an image.
- (3)
- Wiener filter
By considering the characteristics of statistical noise in a degraded image, the Wiener filter reduces the noise distribution in the frequency domain and works based on the principle of local image variance calculation. Therefore, if the local variance of the image is high, denoising is performed poorly; when the local variance is small, a more accurate image can be obtained. However, it requires more computing time [21]. The filter is defined as follows:
where μ is the mean value of the pixel, is the variance of the Gaussian noise in the image, and is the size of the neighborhood area in the kernel size η. is the noise variance in kernel size. If the noise variance is not provided as an input, the average of all local variances estimated for each kernel is used [22]. In this study, we used the second variance adjustment.
- (4)
- MMWF filter
Cannistraci et al. [22] designed the MMWF filter to reduce noise distribution in degraded images. The MMWF filter is beneficial, because it can be easily used in the spatial domain. Moreover, edges are better preserved in an image than those in other common noise reduction filters, such as averaging filters. The MMWF, a filter based on the Wiener filter, replaces the pixel values of the kernel matrix with median values, thereby reducing noise in the degraded image [23,24]. The MMWF filter is defined as follows:
where is the median value of kernel sizes.
- (5)
- Hamming filter
The Hamming filter is a low-pass filter with one variable parameter called the cut-off frequency. It is defined as follows [25]:
where f is the spatial frequency of the image and fm is the cut-off frequency. In this study, the cut-off frequencies of 0.3 Nq to 0.7 Nq was investigated.
2.2.2. Quantitative Indicators Calculations
Several quantitative indices, such as SNR, CNR, and PSNR, are available to evaluate the quality of the filtered images. The higher the SNR value, the stronger the signal in relation to the noise levels will be. Conversely, more useful information is received as a signal than unwanted information or noise. CNR is similar to the SNR used to determine the image quality; however, it subtracts one term before obtaining the ratio. This issue is important when there is a significant bias in an image, such as fog. Thus, an image may have a high SNR but a low CNR.
This study used these three indices to evaluate the quality of SPECT images. (Regions of interest), or target regions, and , or background regions, were selected, as shown in Figure 4 for a SPECT image. The SNR and CNR values were obtained as follows:
where and represent the mean and standard deviation for , respectively. Additionally, and represent the mean and standard deviation for , respectively. Moreover, the size of and is equal to 10 × 10.
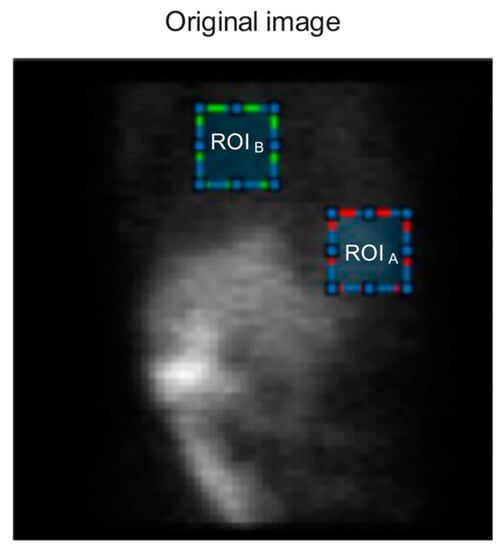
Figure 4.
A SPECT image showing region of interest A with a highlighted red square, as well as the background region ( with a highlighted green square, for calculation of the signal-to-noise ratio (SNR) and contrast-to-noise ratio (CNR) indicators.
The PSNR is a measure of the ratio of the maximum possible value of the signal to the power of noise distortion, which affects the display quality. Because many signals have a wide dynamic range (the ratio of the largest and smallest possible values of a variable quantity), the PSNR is usually expressed in a logarithmic decibel scale. The PSNR equation is as follows [26]:
The mean square error (MSE) is defined as follows:
M and N represent the size of the image matrix, and G and X represent the filtered and unfiltered images, respectively. The novelty of this study lies in the following: (1) comparison of different filters to improve the quality of myocardial perfusion SPECT images and (2) using our datasets with specific noise structures.
2.2.3. Statistical Analysis
Analysis of PSNR, SNR, and CNR was achieved using IBM SPSS software, version 26. It is worth nothing that one way-ANOVA test was used in this study, with p < 0.05.
3. Results
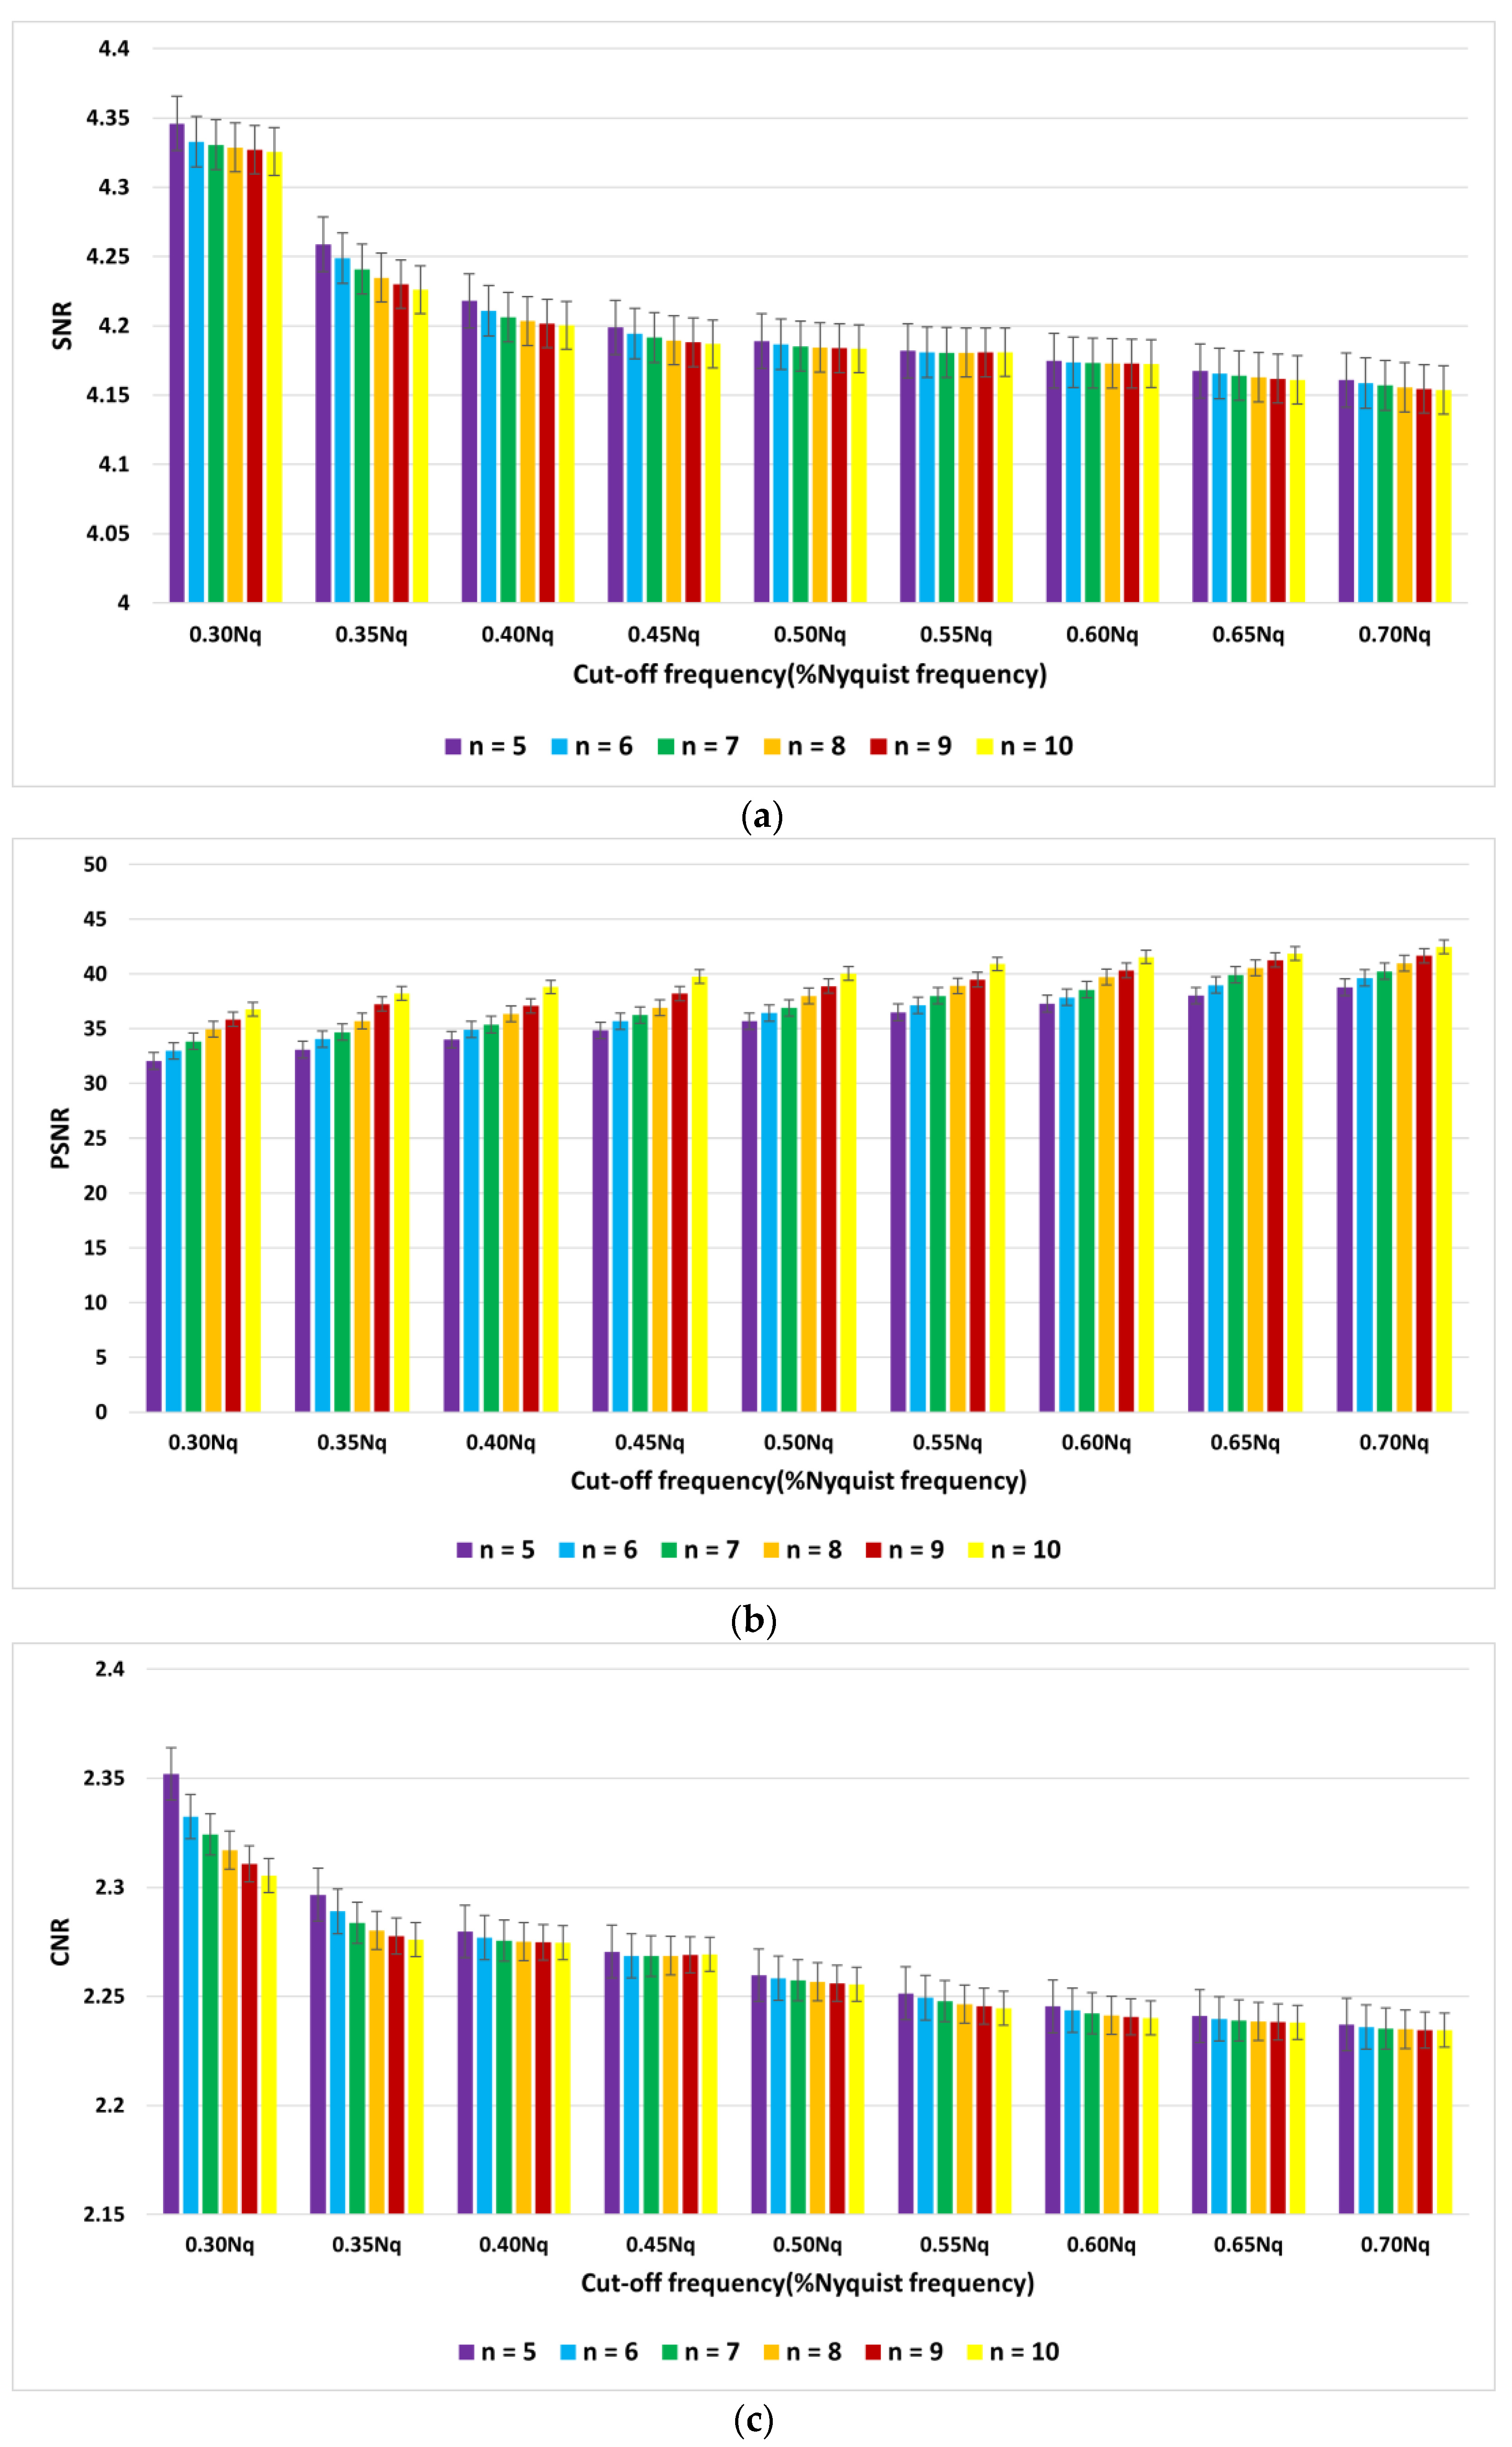
The average indices of SNR, PSNR, and CNR for myocardial perfusion SPECT images of 30 patients with the Hamming filter and the cut-off frequencies of 0.3 Nq to 0.7 Nq are demonstrated in Figure 5. Moreover, they are presented in Figure 6 for the Butterworth filter of order 5 to 10 and cut-off frequencies of 0.3 Nq to 0.7 Nq.
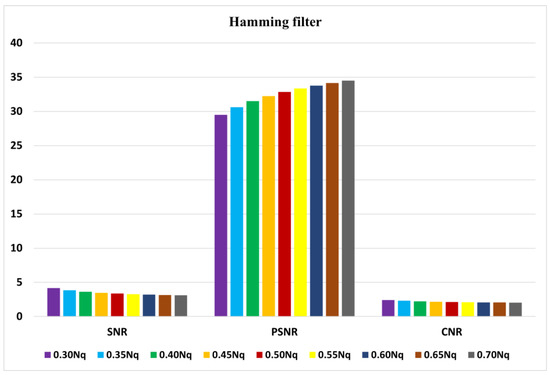
Figure 5.
Graph of average of signal-to-noise ratio (SNR), peak signal-to-noise ratio (PSNR), and contrast-to-noise ratio (CNR) using the Hamming filter.
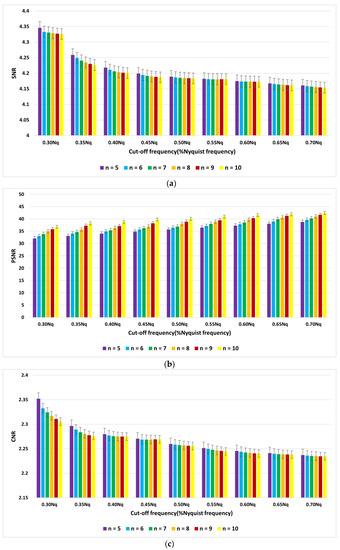
Figure 6.
Graph of average of (a) signal-to-noise ratio (SNR), (b) peak signal-to-noise ratio (PSNR), and (c) contrast-to-noise ratio (CNR) using the Butterworth filter.
Figure 7 shows the original and denoised images using Butterworth (n = 5, fc = 0.3 Nq), Gaussian, Wiener (3 × 3), MMWF (3 × 3), Wiener (5 × 5), MMWF (5 × 5), and Hamming filters.
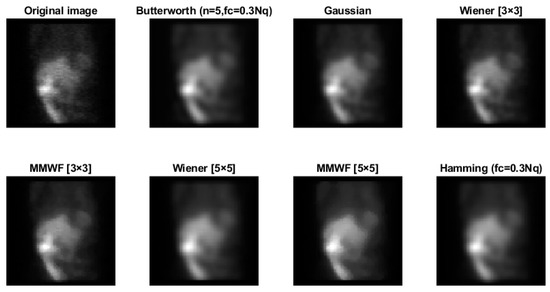
Figure 7.
Images obtained by filtering the image of Figure 3 with Butterworth (n = 5, fc = 0.3 Nq), Gaussian, Wiener (3 × 3), MMWF (3 × 3), Wiener (5 × 5), MMWF (5 × 5), and Hamming (fc = 0.3 Nq) filters (x × x represents the kernel size).
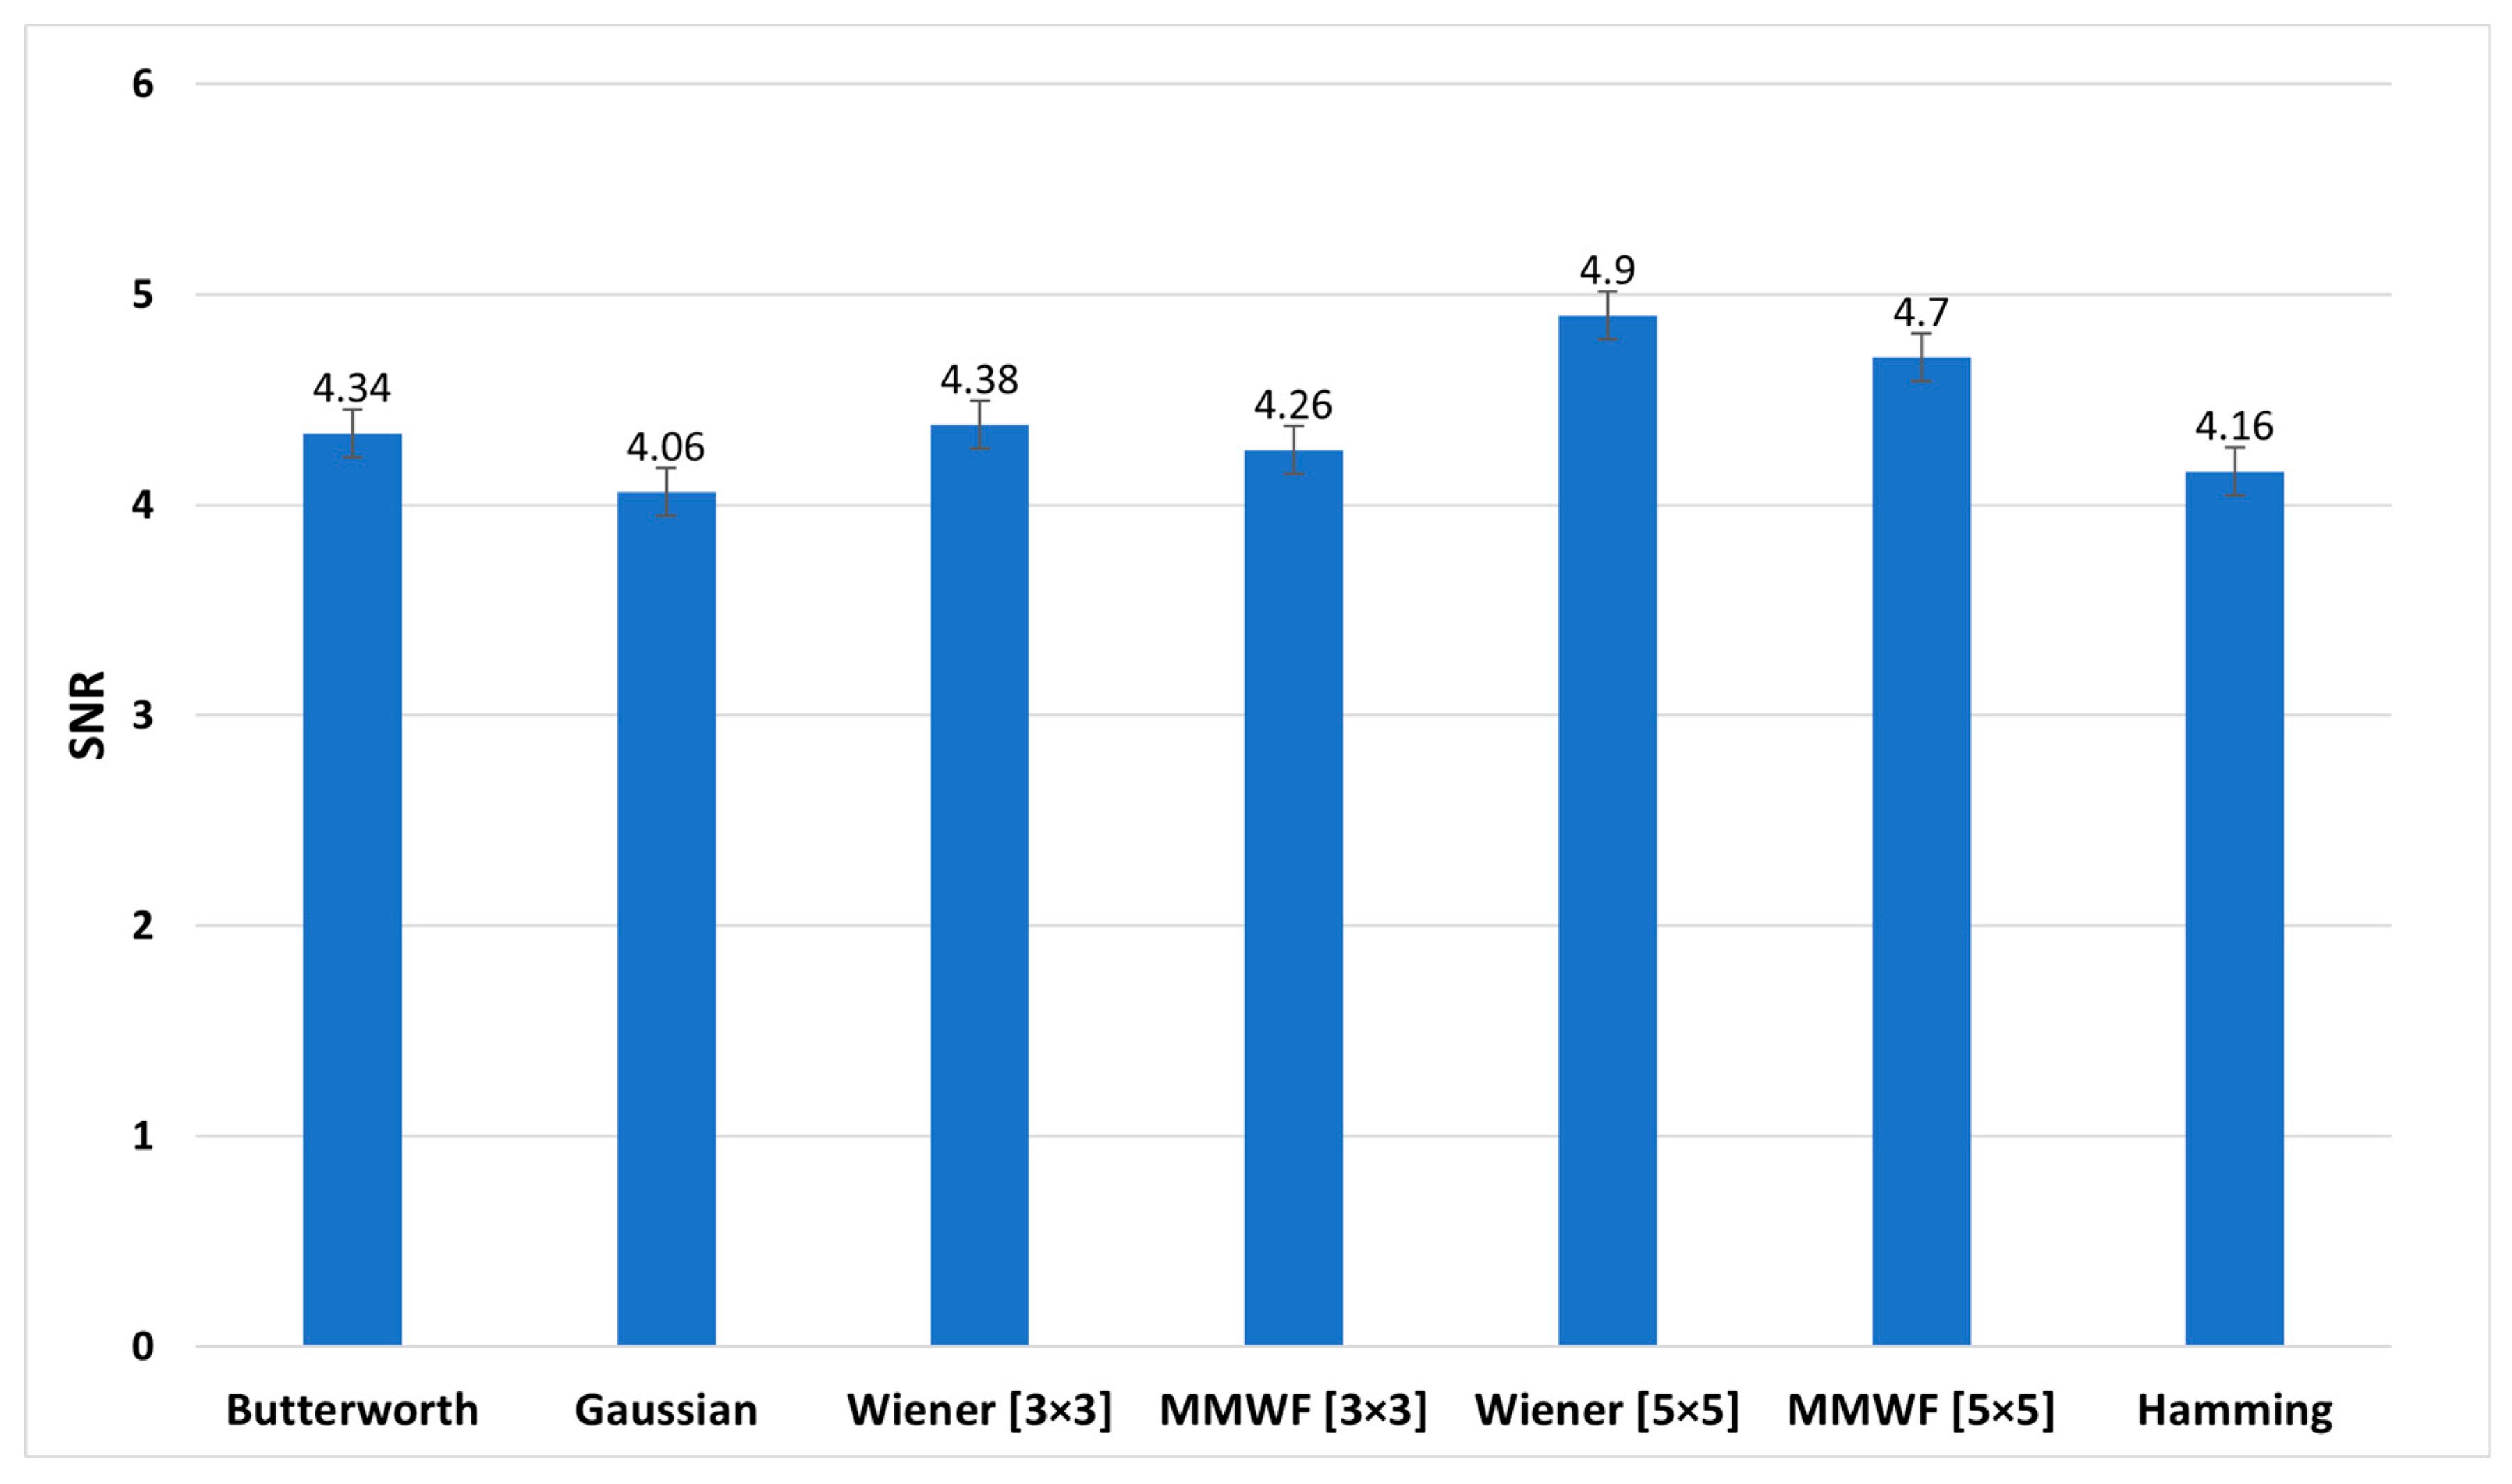
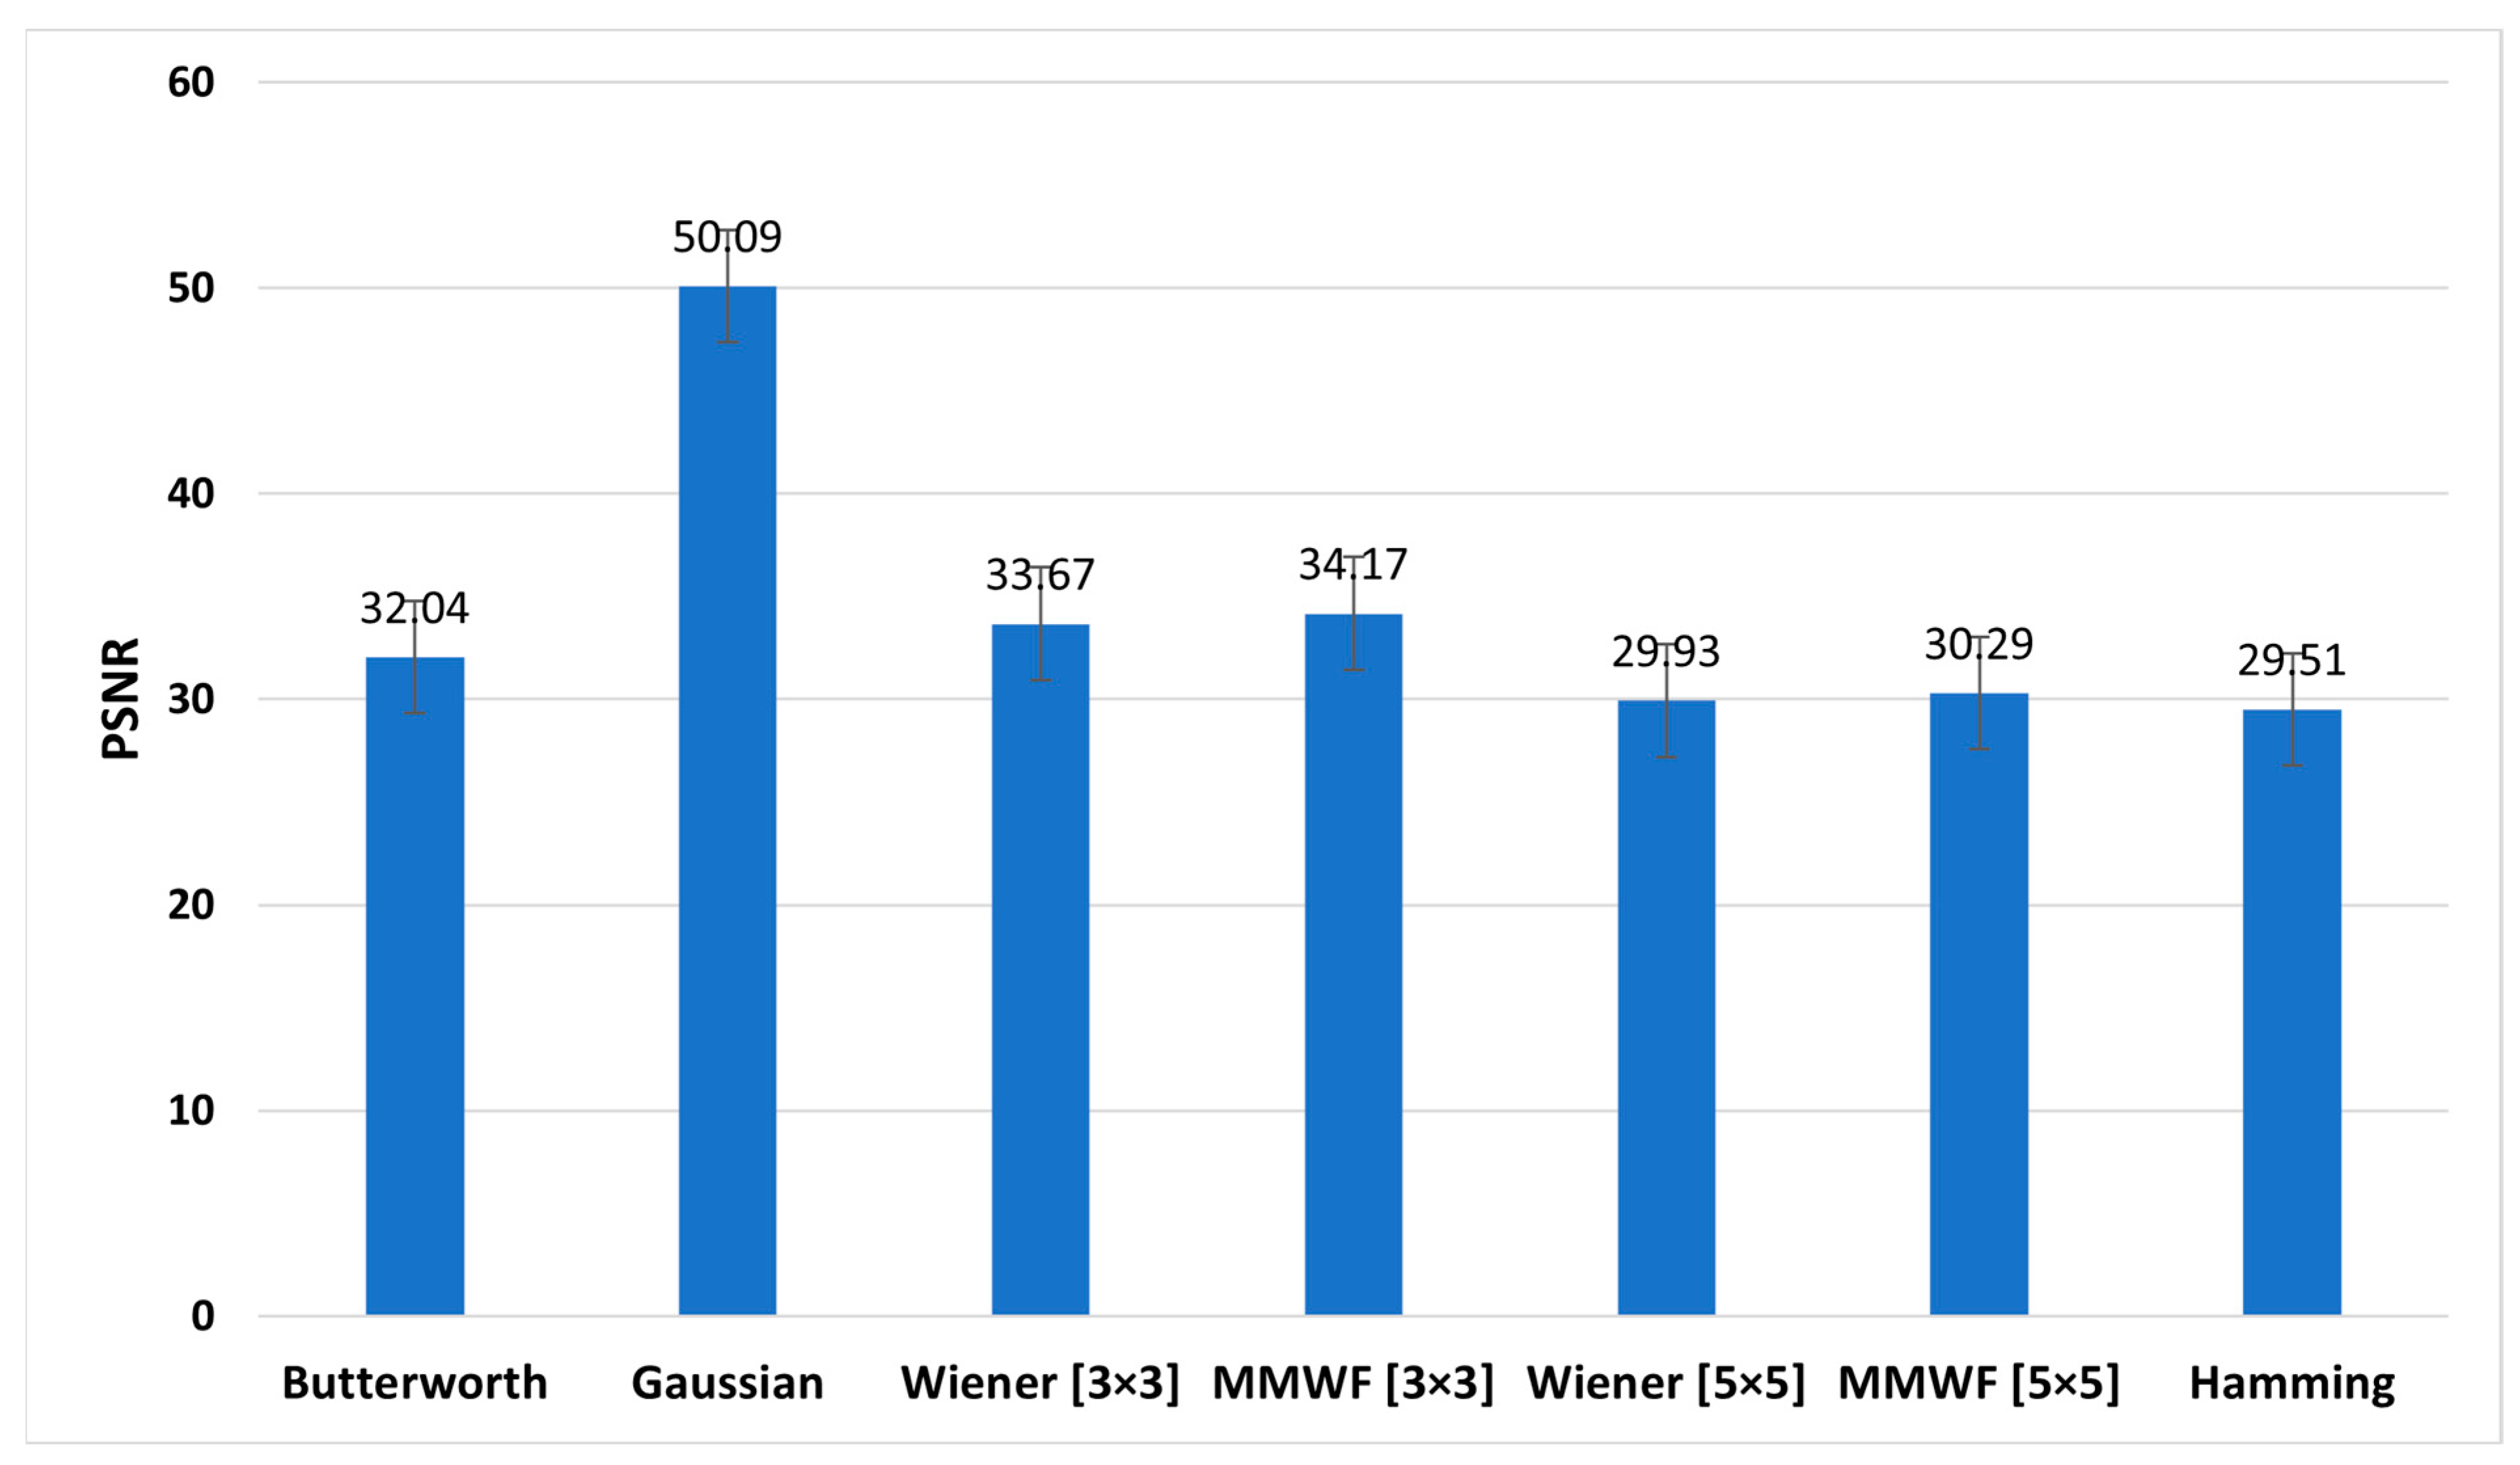
Figure 8, Figure 9 and Figure 10 show the graphs of the average SNR, PSNR, and CNR obtained by Butterworth (n = 5, fc = 0.3 Nq), Gaussian, Wiener (3 × 3), MMWF (3 × 3), Wiener (5 × 5), MMWF (5 × 5), and Hamming filters, respectively. Additionally, their numerical values can be seen and compared in Table 3, and the statistical analysis results using one way-ANOVA are demonstrated in Table 4.
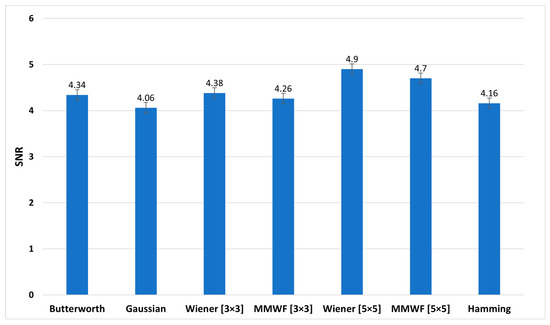
Figure 8.
Comparison of the average signal-to-noise (SNR) graph of different filters for the studied myocardial perfusion SPECT images.
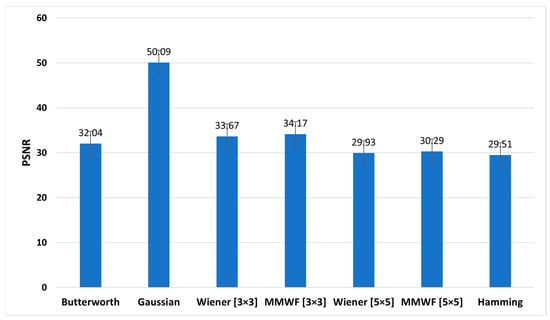
Figure 9.
Comparison of the average peak signal-to-noise (PSNR) graph of different filters for the studied myocardial perfusion SPECT images.

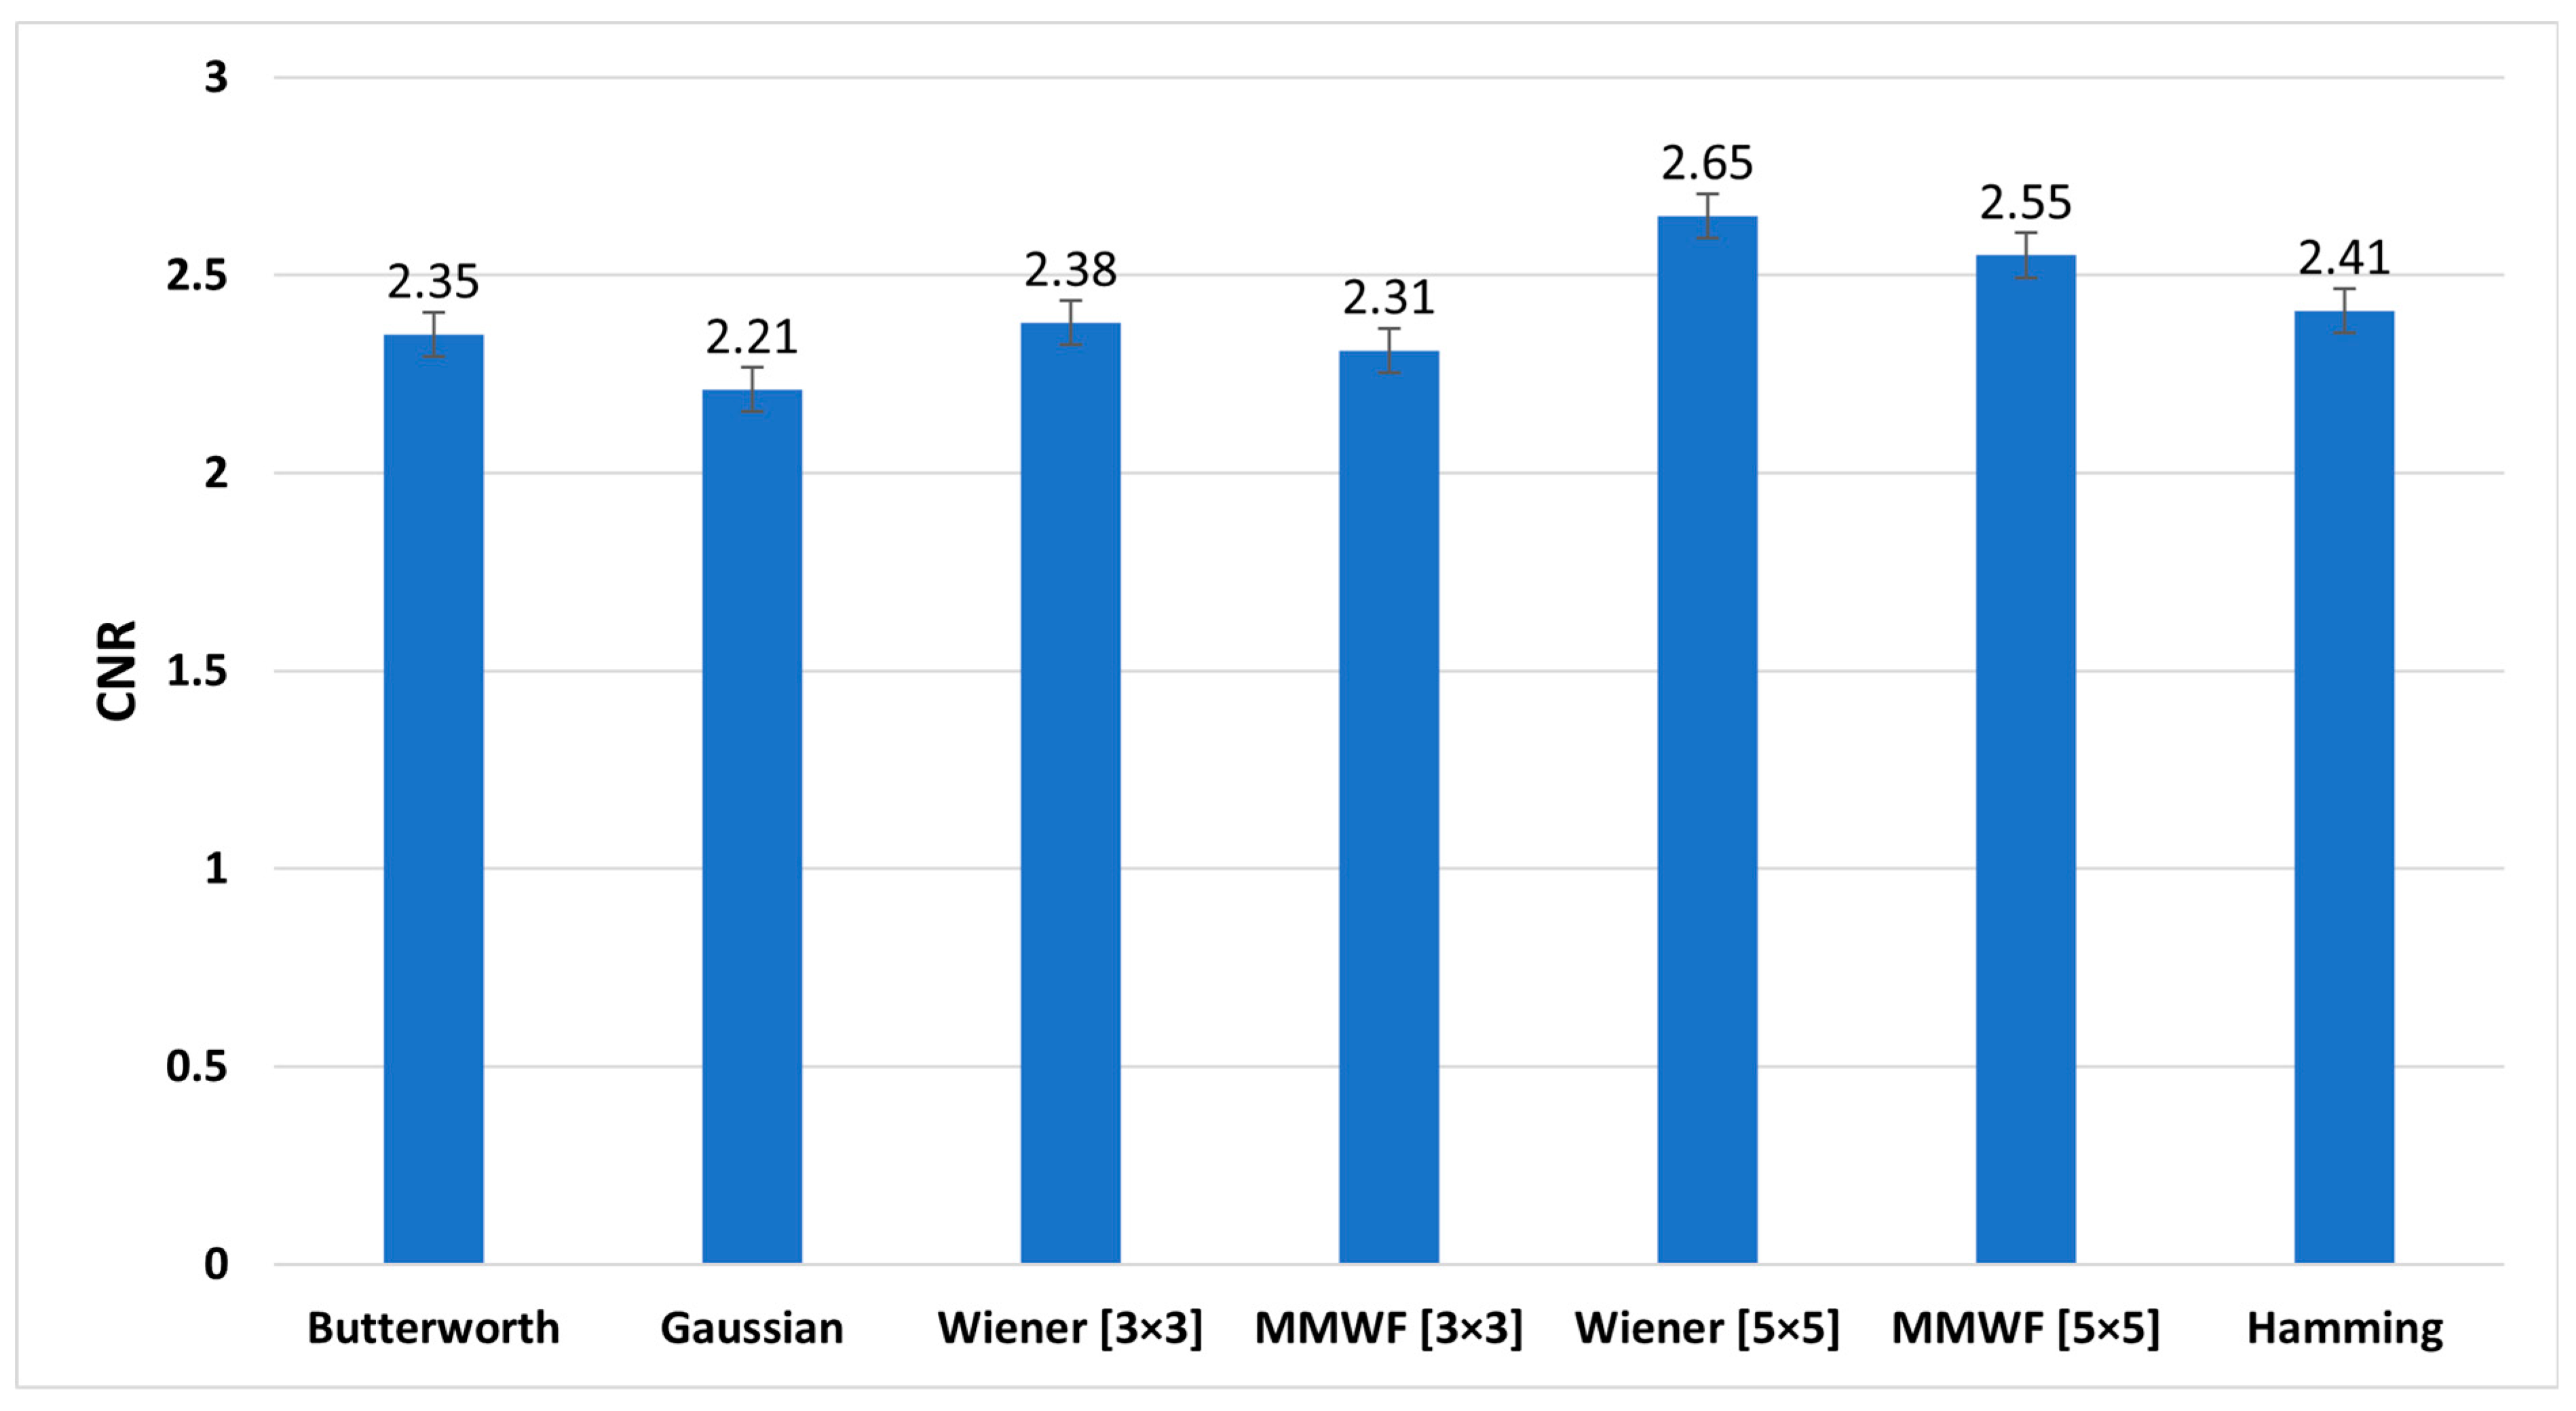
Figure 10.
Comparison of average contrast-to-noise (CNR) graph of different filters for studied myocardial perfusion SPECT images.
Table 3.
Average (standard deviation (SD)) indices of signal-to-noise (SNR), peak signal-to-noise (PSNR), and contrast-to-noise (CNR) of different filters for the studied myocardial perfusion SPECT images.
Table 4.
p-values obtained using one way-ANOVA test to compare different filters for the studied myocardial perfusion SPECT images (p-values in bold are less than 0.05.).
4. Discussion
The parameters that are effective in choosing the type of filter for SPECT images are: (1) isotope energy, number of counts per unit area; (2) amount of statistical noise and background noise; (3) type of organ to be imaged; (4) type of information required from the images; and (5) the collimator used in imaging [27,28].
Park et al. (2020) [14], in a study based on the NEMA IEC body phantom, showed that the MMWF filter outperforms the Wiener, Gaussian, and median filters in reducing noise distribution in gamma camera images. The image quality improved from 20.6% to 65.5%, 7.4% to 40.3%, and 12.7% to 44.7% for the SNR, COV (Coefficients of variation), and CNR values, respectively, when using the MMWF filter. Since the parameters chosen in our study were not the same as those used in Park et al.’s study, our results were not the same as theirs. Notably, we used myocardial perfusion SPECT images, whereas Park et al. used the NEMA IEC body phantom image. In addition, in their study, the activity concentration ratio of in the to was 8:1. However, calculation of this ratio was one of the limitations of our study. Using a gamma camera, these authors determined the image recording time to be 50 min. In contrast, in our study, each image took 20 s as it was registered.
According to Figure 5, the Hamming filter with a cut-off frequency of 0.3 Nq obtained the highest SNR and CNR indices of 4.16 and 2.41, respectively. The highest PSNR index of 34.49 (dB) was achieved with a cut-off frequency of 0.7 Nq. As we can see from Figure 6, the Butterworth filter of 5th order and a cut-off frequency of 0.3 Nq obtained the highest SNR and CNR indices of 4.34 and 2.35, respectively. Additionally, the highest value of the PSNR index corresponded to the 10th order and a cut-off frequency of 0.7 Nq was 42.46 (dB). As shown in Figure 7, the Wiener filter (5 × 5) does not preserve the edges as clearly as the MMWF (5 × 5) filter does; however, it outperformed the Butterworth, Gaussian, MMWF (3 × 3), MMWF (5 × 5), and Hamming filters, with greater SNR and CNR indices improving the qualities of our SPECT dataset.
According to Table 3 and Table 4, the Wiener (5 × 5) filter has the highest value of SNR index, which was equal to 4.90 ± 0.69. In addition, it had statistically significant differences with other filters (p < 0.05). In this index, Butterworth, Wiener (3 × 3), and MMWF (3 × 3) filters had no significant differences (p > 0.05). In addition, Table 3 shows that the highest value of the PSNR index corresponds to the Gaussian filter with a value of 50.09 ± 10.63 (dB). However, this filter was significantly different from other filters (p < 0.05). It is worth noting that the lowest value of PSNR index, with the value of 29.93 ± 3.13 (dB), corresponds to the Wiener (5 × 5) filter. In this index, there was no significant difference between the Wiener (5 × 5) and MMWF (5 × 5) (p = 0.281) filters, or between the Wiener (3 × 3) and MMWF (3 × 3) (p = 0.143). Additionally, the highest value of the CNR index was related to the Wiener (5 × 5), with a value of 2.65 ± 0.57. Significant differences were observed between the Wiener (5 × 5) and other filters (p < 0.05), but no significant differences were observed between Butterworth, Wiener (3 × 3) and MMWF (3 × 3) filters, or between Gaussian and MMWF (3 × 3) filters (p > 0.05). For SNR and CNR indices, there was no significant difference between the Hamming filter and the MMWF (3 × 3). However, the MMWF (3 × 3) filter not only preserved the edge of the image better than the Hamming filter, but also obtained a higher value in the PSNR index. Therefore, it can be concluded that the MMWF (3 × 3) filter performed better than the Hamming filter when denoising myocardial perfusion SPECT images. According to Table 3, the Butterworth filter achieved higher SNR and PSNR values than the Hamming filter, which was statistically significant. Although the Hamming filter obtained a higher CNR index than the Butterworth filter, there was no statistically significant difference (p = 0.329). Therefore, the Butterworth filter performed better than the Hamming filter, as concluded by the study conducted by Sayed and Ismail (2020) [12].
5. Conclusions
The results show that the Wiener filter, with a kernel size of 5 × 5, outperformed other filters like Butterworth, Hamming, Gaussian, and Wiener, with a kernel size of 3 × 3, and MMWF, with kernel sizes of 3 × 3 and 5 × 5, when denoising the myocardial perfusion SPECT images with that were investigated in this study.
Author Contributions
Conceptualization, A.R. and M.E.; Methodology, A.R. and M.E.; Formal analysis, A.R.; Investigation, M.E. and E.Y.K.N.; Data curation, M.M.; Writing—review & editing, E.Y.K.N.; Supervision, M.E.; Funding acquisition, M.E. All authors have read and agreed to the published version of the manuscript.
Funding
This research received no specific grant from any funding agency in the public, commercial, or not-for-profit sectors.
Institutional Review Board Statement
The study was performed following the Helsinki Declaration on ethical principles for medical research involving human subjects and was approved by the Institutional Committee for Ethics in Biomedical Research of the Isfahan University of Medical Sciences (approval ID: IR.MUl.MED.REC.1400.790).
Informed Consent Statement
Written informed consent was obtained from all individual participants to be included in the study and to publish the accompanying images.
Data Availability Statement
The data presented in this study are available on request from the corresponding author.
Acknowledgments
This article is the result of the thesis entitled “Review and comparison of pseudo-coloring techniques of single-photon emission computed tomography (SPECT) images of heart images” with the code 3400838, which was approved in Isfahan University of Medical Sciences and with the financial support of the University of Medical Sciences. Isfahan has been completed. The efforts of the research assistant of Isfahan University of Medical Sciences are hereby appreciated and thanked. Additionally, the cooperation of nuclear medicine department personnel of Shahid Chamran Hospital in Isfahan is appreciated and acknowledged.
Conflicts of Interest
The authors have no conflicts of interest related to this publication.
References
- Bauersachs, R.; Zeymer, U.; Briere, J.-B.; Marre, C.; Bowrin, K.; Huelsebeck, M. Burden of Coronary Artery Disease and Peripheral Artery Disease: A Literature Review. Cardiovasc. Ther. 2019, 2019, 8295054. [Google Scholar] [CrossRef] [PubMed]
- Knuuti, J.; Wijns, W.; Saraste, A.; Capodanno, D.; Barbato, E.; Funck-Brentano, C.; Prescott, E.; Storey, R.F.; Deaton, C.; Cuisset, T.; et al. 2019 ESC Guidelines for the diagnosis and management of chronic coronary syndromes. Eur. Heart J. 2020, 41, 407–477. [Google Scholar] [CrossRef] [PubMed]
- Klein, R.; Celiker-Guler, E.; Rotstein, B.H.; Dekemp, R.A. PET and SPECT Tracers for Myocardial Perfusion Imaging. Semin. Nucl. Med. 2020, 50, 208–218. [Google Scholar] [CrossRef] [PubMed]
- van Nunen, L.X.; Zimmermann, F.M.; Tonino, P.A.L.; Barbato, E.; Baumbach, A.; Engstrøm, T.; Klauss, V.; MacCarthy, P.A.; Manoharan, G.; Oldroyd, K.G.; et al. Fractional flow reserve versus angiography for guidance of PCI in patients with multivessel coronary artery disease (FAME): 5-year follow-up of a randomised controlled trial. Lancet 2015, 386, 1853–1860. [Google Scholar] [CrossRef]
- Slomka, P.J.; Miller, R.J.; Hu, L.-H.; Germano, G.; Berman, D.S. Solid-State Detector SPECT Myocardial Perfusion Imaging. J. Nucl. Med. 2019, 60, 1194–1204. [Google Scholar] [CrossRef]
- Tsui, B. The AAPM/RSNA physics tutorial for residents. Physics of SPECT. Radiographics 1996, 16, 173–183. [Google Scholar] [CrossRef] [PubMed]
- Cherry, S.R.; Sorenson, J.A.; Phelps, M.E. Physics in Nuclear Medicine; Elsevier/Saunders: Philadelphia, PA, USA, 2012. [Google Scholar] [CrossRef]
- Goyal, B.; Dogra, A.; Agrawal, S.; Sohi, B.S. Noise Issues Prevailing in Various Types of Medical Images. Biomed. Pharmacol. J. 2018, 11, 1227–1237. [Google Scholar] [CrossRef]
- SPECT Imaging Characteristics. Available online: http://www.people.vcu.edu/~mhcrosthwait/clrs322/SPECTimagingparameters.html (accessed on 22 May 2022).
- Hansen, C.L. Digital image processing for clinicians, part II: Filtering. J. Nucl. Cardiol. 2002, 9, 429–437. [Google Scholar] [CrossRef]
- Masoomi, M.A.; Al-Shammeri, I.; Kalafallah, K.; Elrahman, H.M.; Ragab, O.; Ahmed, E.; Al-Shammeri, J.; Arafat, S. Wiener filter improves diagnostic accuracy of CAD SPECT images—Comparison to angiography and CT angiography. Medicine 2019, 98, e14207. [Google Scholar] [CrossRef]
- Sayed, I.S.; Ismail, S.S. Comparison of Low-Pass Filters for SPECT Imaging. Int. J. Biomed. Imaging 2020, 2020, 9239753. [Google Scholar] [CrossRef]
- Kim, E.S.; Lee, Y.; Park, C.R. Feasibility of MMWF noise reduction algorithm in brain SPECT images according to various reconstruction methods: A phantom study. Optik 2021, 247, 167909. [Google Scholar] [CrossRef]
- Park, C.R.; Kang, S.-H.; Lee, Y. Median modified wiener filter for improving the image quality of gamma camera images. Nucl. Eng. Technol. 2020, 52, 2328–2333. [Google Scholar] [CrossRef]
- Camoni, L.; on behalf of the Technologist Committee of the European Association of Nuclear Medicine (EANM); Santos, A.; Attard, M.; Mada, M.O.; Pietrzak, A.K.; Rac, S.; Rep, S.; Terwinghe, C.; Costa, P.F. Best practice for the nuclear medicine technologist in CT-based attenuation correction and calcium score for nuclear cardiology. Eur. J. Hybrid Imaging 2020, 4, 11. [Google Scholar] [CrossRef] [PubMed]
- Verberne, H.J.; Acampa, W.; Anagnostopoulos, C.; Ballinger, J.; Bengel, F.; De Bondt, P.; Buechel, R.R.; Cuocolo, A.; van Eck-Smit, B.L.F.; Flotats, A.; et al. EANM procedural guidelines for radionuclide myocardial perfusion imaging with SPECT and SPECT/CT: 2015 revision. Eur. J. Nucl. Med. 2015, 42, 1929–1940. [Google Scholar] [CrossRef] [PubMed]
- Javadi, H.; Porpiranfar, M.A.; Semnani, S.; Jallalat, S.; Yavari, P.; Mogharrabi, M.; Hooman, A.; Amini, A.; Barekat, M.; Iranpour, D.; et al. Scintigraphic parameters with emphasis on perfusion appraisal in rest 99mTc-sestamibi SPECT in the recovery of myocardial function after thrombolytic therapy in patients with ST elevation myocardial infarction (STEMI). Perfusion 2011, 26, 394–399. [Google Scholar] [CrossRef]
- Protonotarios, N.E.; Fokas, A.S.; Kostarelos, K.; Kastis, G.A. The attenuated spline reconstruction technique for single photon emission computed tomography. J. R. Soc. Interface 2018, 15, 20180509. [Google Scholar] [CrossRef]
- Khalil, M.M.; Tremoleda, J.L.; Bayomy, T.B.; Gsell, W. Molecular SPECT Imaging: An Overview. Int. J. Mol. Imaging 2011, 2011, 796025. [Google Scholar] [CrossRef]
- Gonzalez, R.C.; Woods, R.E.; Eddins, S.L. Digital Image Processing Using MATLAB; Pearson/Prentice Hall: Upper Saddle River, NJ, USA, 2004. [Google Scholar]
- Kulkarni, P.; Madathil, D. A review on echocardiographic image speckle reduction filters. Biomed. Res. 2018, 29, 2582–2589. [Google Scholar] [CrossRef]
- Cannistraci, C.V.; Montevecchi, F.M.; Alessio, M. Median-modified Wiener filter provides efficient denoising, preserving spot edge and morphology in 2-DE image processing. Proteomics 2009, 9, 4908–4919. [Google Scholar] [CrossRef]
- Lee, S.; Cho, H.; Lee, Y. High-energy industrial 2D X-ray imaging system with effective nonlocal means denoising for nondestructive testing. Nucl. Instrum. Methods Phys. Res. Sect. A Accel. Spectrometers Detect. Assoc. Equip. 2019, 925, 212–216. [Google Scholar] [CrossRef]
- Kim, K.; Lee, Y. Effects of total variation regularization noise reduction algorithm in improved K-edge log-subtraction X-ray images with photon-counting cadmium telluride detectors. Optik 2020, 206, 164380. [Google Scholar] [CrossRef]
- Salihin Yusoff, M.N.; Zakaria, A. Determination of the optimum filter for qualitative and quantitative 99mTc myocardial SPECT imaging. Iran. J. Radiat. Res. 2009, 6, 173–181. [Google Scholar]
- Horé, A.; Ziou, D. Image Quality Metrics: PSNR vs. SSIM. In Proceedings of the 2010 20th International Conference on Pattern Recognition, Istanbul, Turkey, 23–26 August 2010; pp. 2366–2369. [Google Scholar] [CrossRef]
- Vandenberghe, S.; D’Asseler, Y.; Van de Walle, R.; Kauppinen, T.; Koole, M.; Bouwens, L.; Van Laere, K.; Lemahieu, I.; Dierckx, R. Iterative reconstruction algorithms in nuclear medicine. Comput. Med. Imaging Graph. 2000, 25, 105–111. [Google Scholar] [CrossRef] [PubMed]
- Heller, G.V.; Mann, A.; Hendel, R.C. Nuclear Cardiology: Technical Applications; McGraw-Hill Medical: New York, NY, USA, 2009. [Google Scholar]


Disclaimer/Publisher’s Note: The statements, opinions and data contained in all publications are solely those of the individual author(s) and contributor(s) and not of MDPI and/or the editor(s). MDPI and/or the editor(s) disclaim responsibility for any injury to people or property resulting from any ideas, methods, instructions or products referred to in the content. |
© 2023 by the authors. Licensee MDPI, Basel, Switzerland. This article is an open access article distributed under the terms and conditions of the Creative Commons Attribution (CC BY) license (https://creativecommons.org/licenses/by/4.0/).