
From Myofascial Chains to the Polyconnective Network: A Novel Approach to Biomechanics and Rehabilitation Based on Graph Theory

 ,
, 
 ,
,  and
and 
Abstract
1. Introduction
2. Materials and Methods
2.1. Network Model Description
2.2. Data Source
2.3. Network Construction
- A list of nodes with unique identifiers and descriptions;
- A list of connections as node pairs (source and target), with optional weights indicating relationship strength.
- Construct the graph;
- Calculate degree, betweenness, and closeness centralities;
- Generate the adjacency matrix for structural analysis.
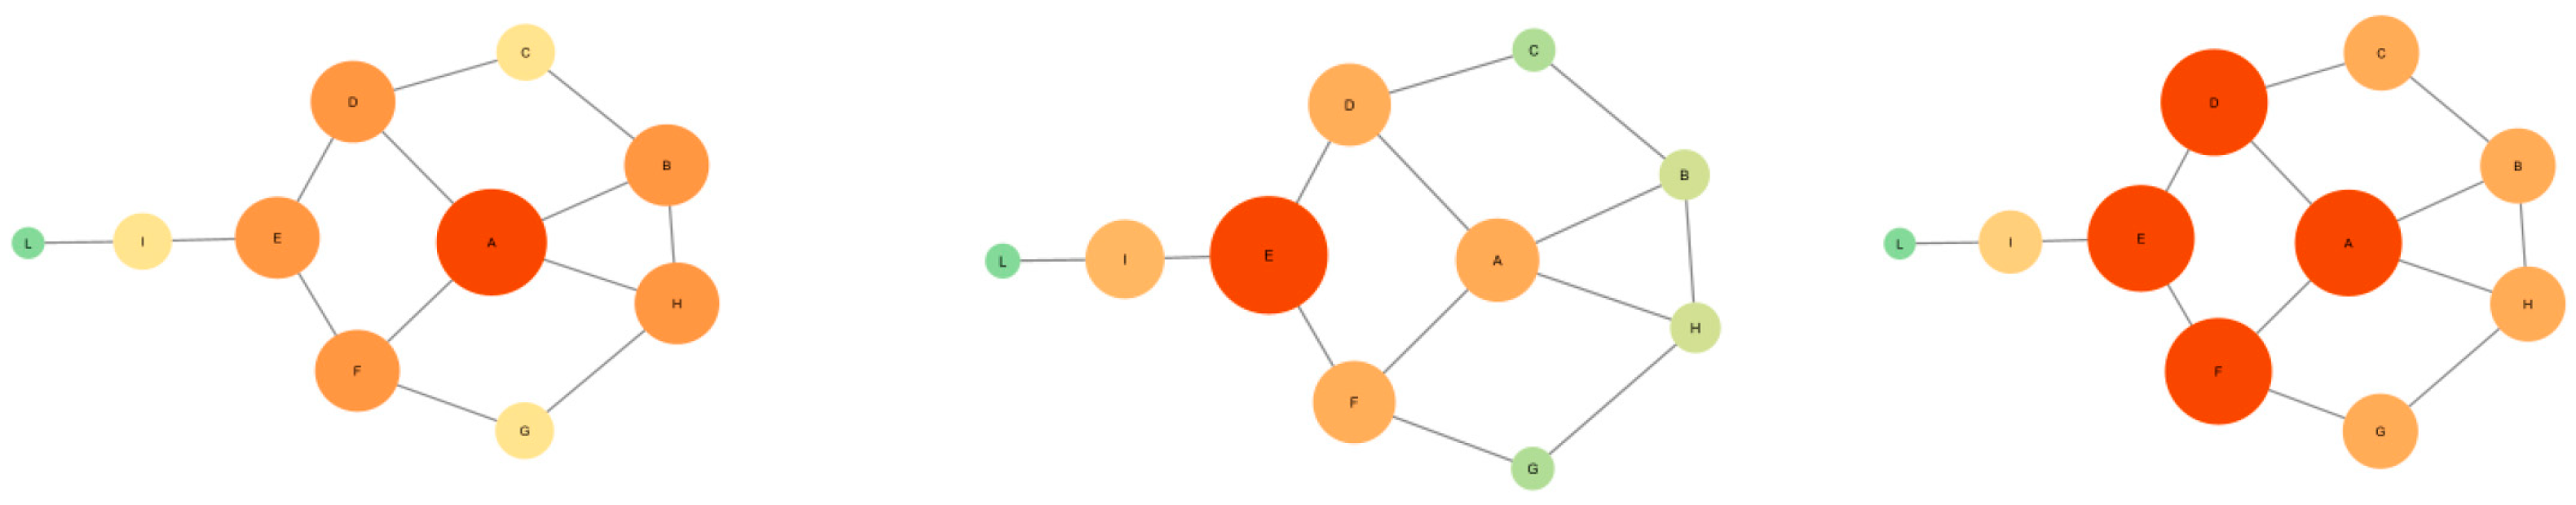
2.4. Centrality Metrics Applied
- Degree Centrality
- Betweenness Centrality
- Closeness Centrality
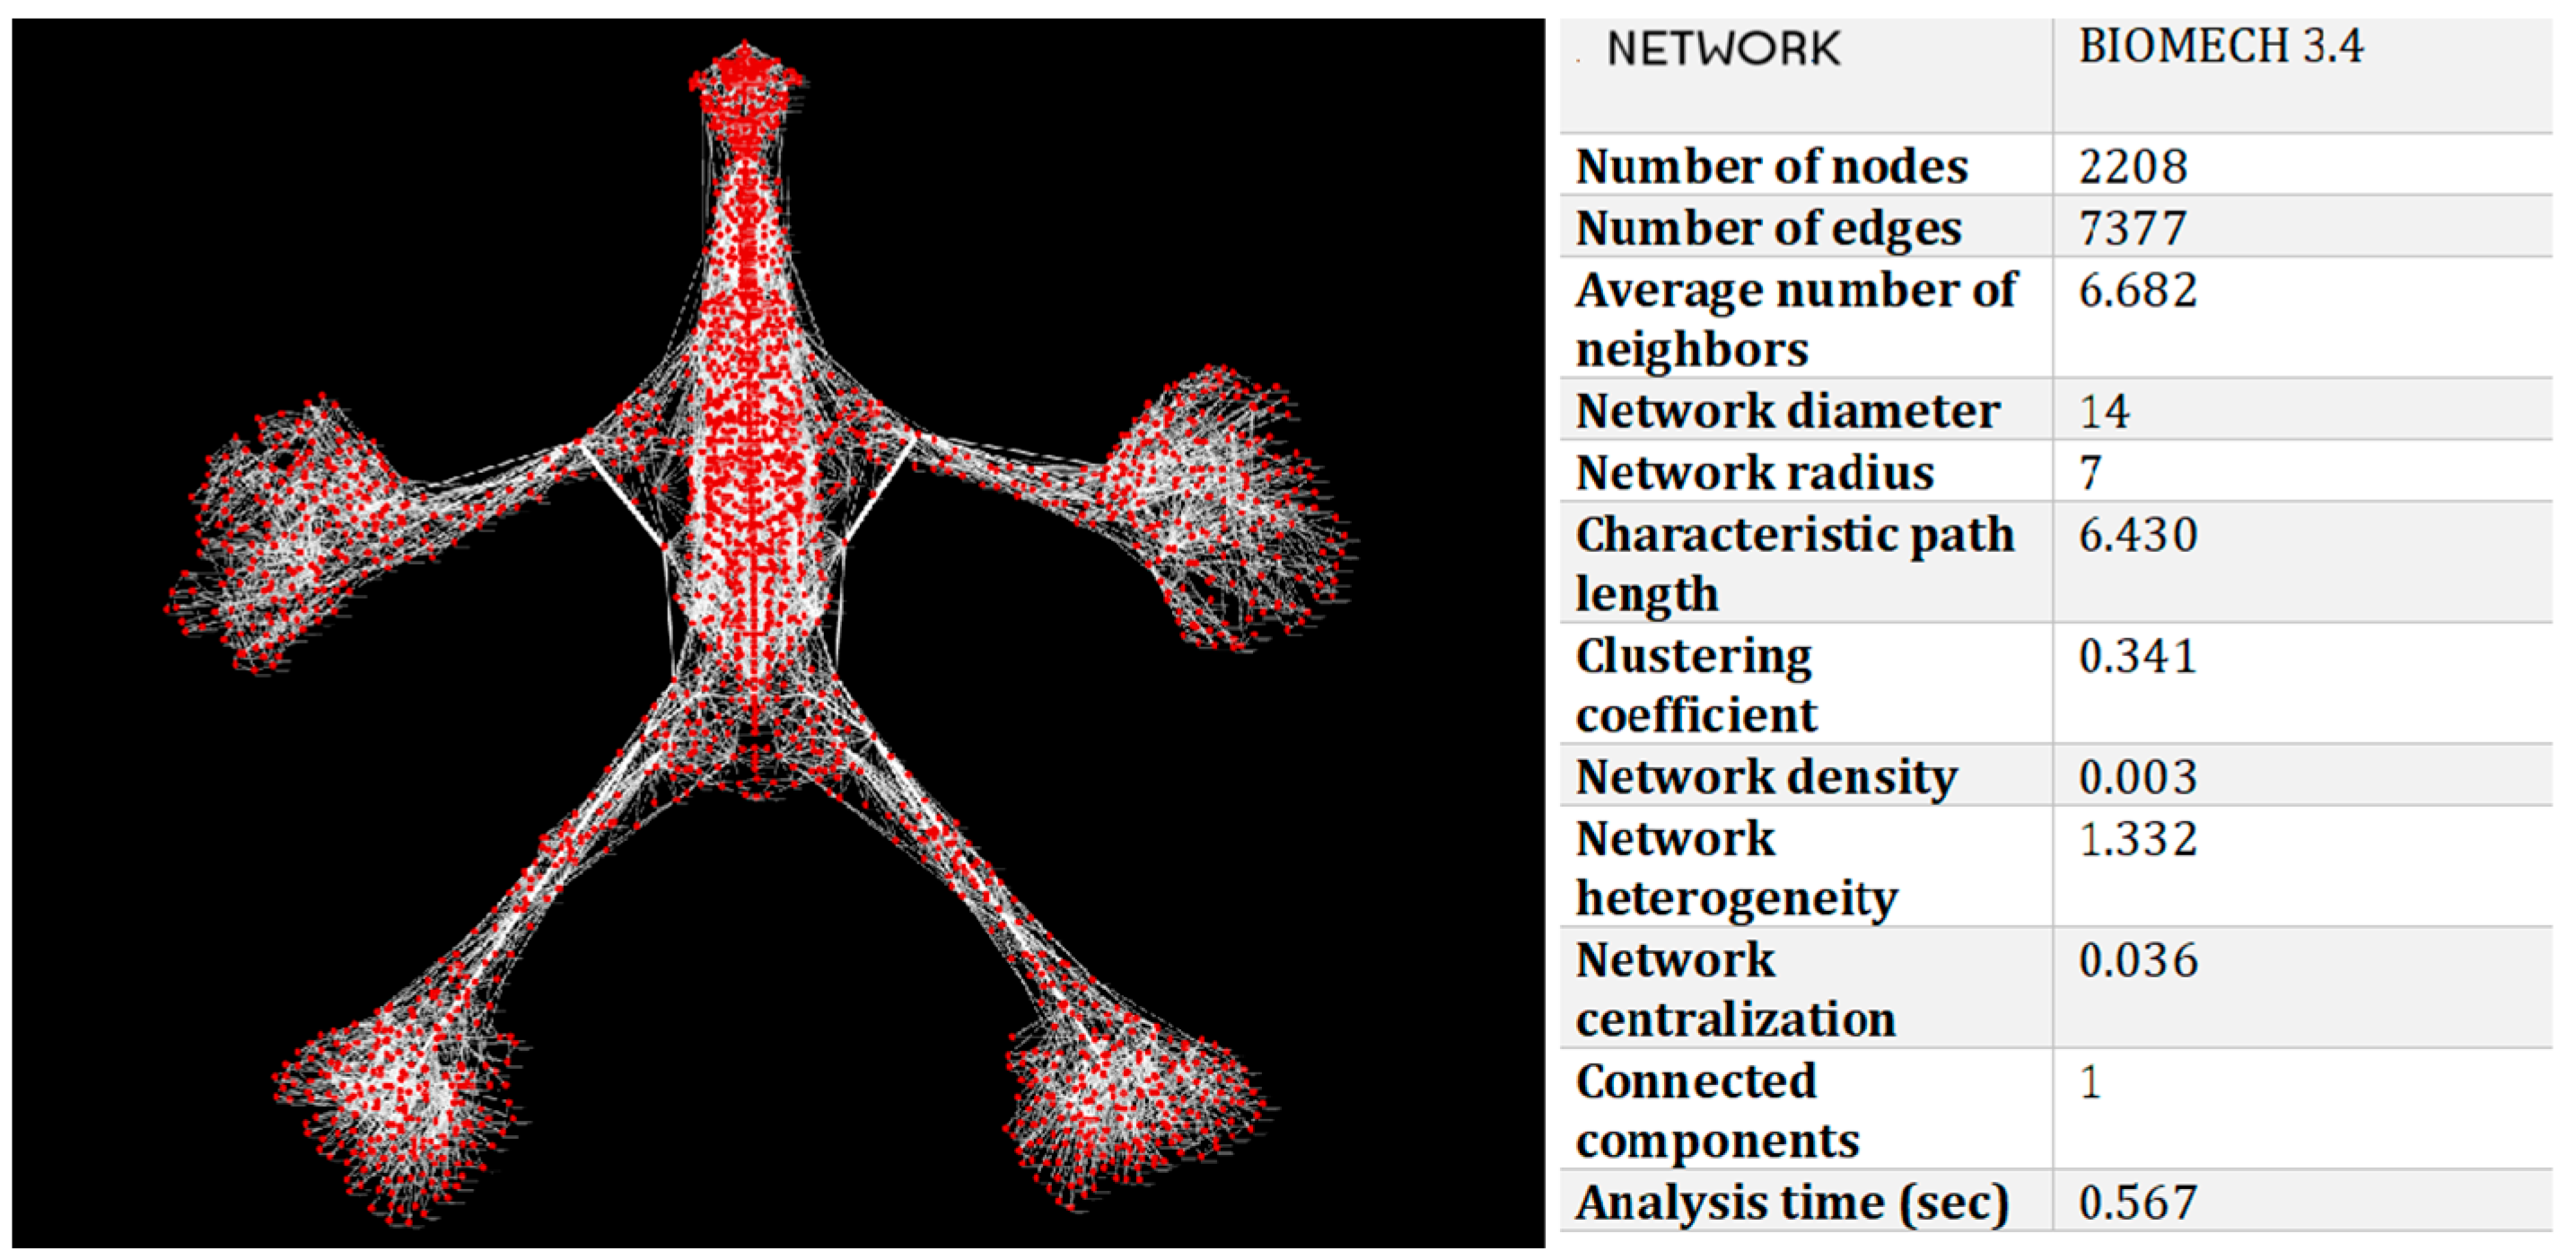
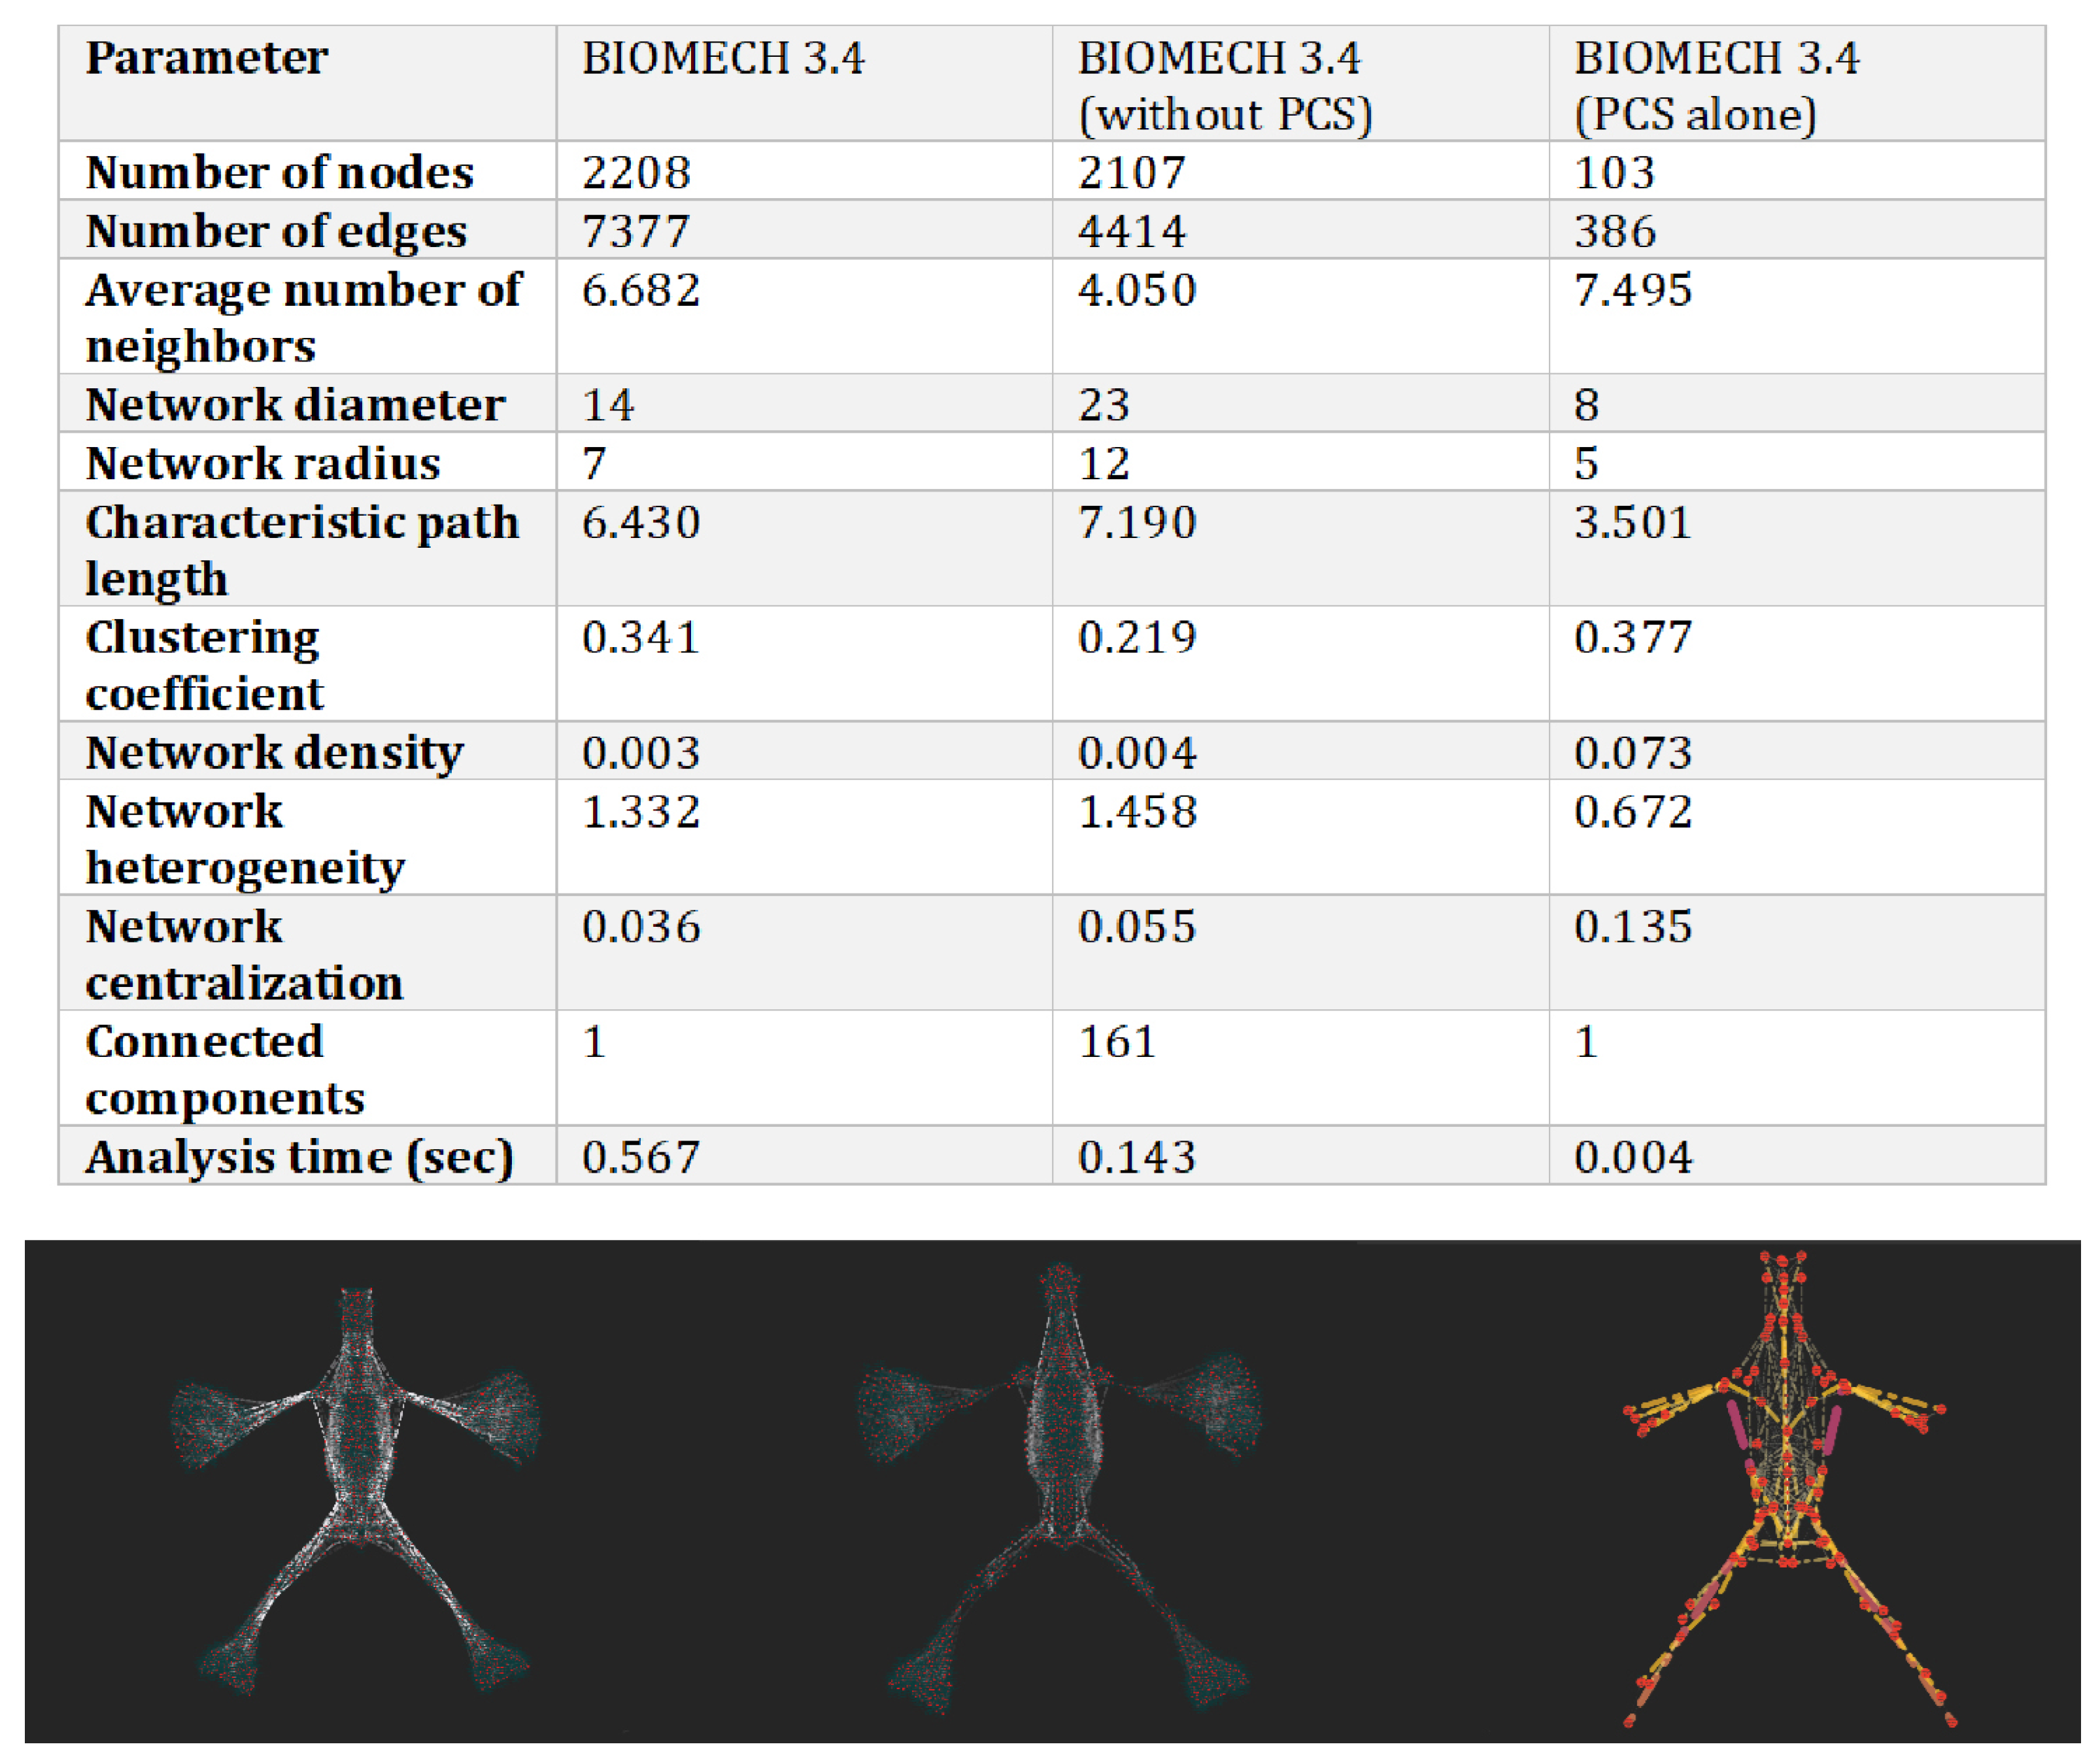
3. Results
- 2208 nodes (anatomical structures);
- 7377 edges (biomechanical relationships).
3.1. Degree Centrality
- Improve local mobility;
- Release regional tension;
- Strengthen adjacent structural integrity [22].
3.2. Betweenness Centrality
- The humerus;
- The iliotibial tract (fascia lata).
- Reduce compensatory postures;
- Optimize load transfer;
- Enhance functional integration [23].
3.3. Closeness Centrality
- Lumbar vertebrae;
- The sacroiliac region.
- Improve coordination;
- Enhance movement fluidity;
3.4. Interpretation of Results and Clinical Considerations
4. Discussion
5. Conclusions
Author Contributions
Funding
Institutional Review Board Statement
Informed Consent Statement
Data Availability Statement
Conflicts of Interest
References
- Mézières, F. Revolution in Orthopedic Gymnastics; Desclée de Brouwer: Paris, France, 1949. [Google Scholar]
- Denys-Struyf, G. Muscle and Articulation Chains; Frison-Roche: Brussels, Belgium, 1986; ISBN 978-2-9510513-1-7. [Google Scholar]
- Busquet, L. Physiological Chains; Frison-Roche: Paris, France, 1992; ISBN 978-88-941445-2-9. [Google Scholar]
- Rolf, I.P. Rolfing: Reestablishing the Natural Alignment and Structural Integration of the Human Body for Vitality and Well-Being; Healing Arts Press: Rochester, VT, USA, 1989; ISBN 978-0-89281-335-3. [Google Scholar]
- Stecco, L. Fascial Manipulation; Piccin: Padua, Italy, 2004; ISBN 978-88-299-2926-9. [Google Scholar]
- Paoletti, S. The Fasciae: Anatomy Dysfunction and Treatment; Eastland Press: Paris, France, 2006; ISBN 978-0-939616-53-4. [Google Scholar]
- Esteve-Altava, B.; Molnar, J.L.; Johnston, P.; Hutchinson, J.R.; Diogo, R. Anatomical Network Analysis of the Musculoskeletal System Reveals Integration Loss and Parcellation Boost during the Fins-to-Limbs Transition. Evolution 2018, 72, 601–618. [Google Scholar] [CrossRef] [PubMed]
- Esteve-Altava, B.; Diogo, R.; Smith, C.; Boughner, J.C.; Rasskin-Gutman, D. Anatomical Networks Reveal the Musculoskeletal Modularity of the Human Head. Sci. Rep. 2015, 5, 8298. [Google Scholar] [CrossRef] [PubMed]
- Kerkman, J.N.; Daffertshofer, A.; Gollo, L.L.; Breakspear, M.; Boonstra, T.W. Network Structure of the Human Musculoskeletal System Shapes Neural Interactions on Multiple Time Scales. Sci. Adv. 2018, 4, eaat0497. [Google Scholar] [CrossRef] [PubMed]
- Paternostro, F.; Santosuosso, U.; Della Posta, D.; Francia, P. An Application of the Graph Theory to the Study of the Human Locomotor System. Ital. J. Anat. Embryol. 2019, 124, 353–363. [Google Scholar] [CrossRef]
- Della Posta, D. Network e Regolazione in Terapia Manuale; A.I.R.O.P.: Rome, Italy, 2021; ISBN 978-88-949401-4-5. [Google Scholar]
- Carmichael, S.; Gest, T. Terminologia Anatomica Second Edition International Anatomical Terminology; FCAT Thieme: Stuttgart, Germany, 2019. [Google Scholar]
- Shannon, P.; Markiel, A.; Ozier, O.; Baliga, N.S.; Wang, J.T.; Ramage, D.; Amin, N.; Schwikowski, B.; Ideker, T. Cytoscape: A Software Environment for Integrated Models of Biomolecular Interaction Networks. Genome Res. 2003, 13, 2498–2504. [Google Scholar] [CrossRef] [PubMed]
- Bastian, M.; Heymann, S.; Jacomy, M. Gephi: An Open Source Software for Exploring and Manipulating Networks. ICWSM 2009, 3, 361–362. [Google Scholar] [CrossRef]
- Murphy, A.C.; Muldoon, S.F.; Baker, D.; Lastowka, A.; Bennett, B.; Yang, M.; Bassett, D.S. Structure, Function, and Control of the Human Musculoskeletal Network. PLoS Biol. 2018, 16, e2002811. [Google Scholar] [CrossRef] [PubMed]
- Bullmore, E.; Sporns, O. Complex Brain Networks: Graph Theoretical Analysis of Structural and Functional Systems. Nat. Rev. Neurosci. 2009, 10, 186–198. [Google Scholar] [CrossRef] [PubMed]
- Barabási, A.-L.; Albert, R. Emergence of Scaling in Random Networks. Science 1999, 286, 509–512. [Google Scholar] [CrossRef] [PubMed]
- Brandes, U. A Faster Algorithm for Betweenness Centrality. J. Math. Sociol. 2001, 25, 163–177. [Google Scholar] [CrossRef]
- Rubinov, M.; Sporns, O. Complex Network Measures of Brain Connectivity: Uses and Interpretations. NeuroImage 2010, 52, 1059–1069. [Google Scholar] [CrossRef] [PubMed]
- Della Posta, D.; Branca, J.J.V.; Guarnieri, G.; Veltro, C.; Pacini, A.; Paternostro, F. Modularity of the Human Musculoskeletal System: The Correlation between Functional Structures by Computer Tools Analysis. Life 2022, 12, 1186. [Google Scholar] [CrossRef] [PubMed]
- Barabási, A.L. Network Science, 1st ed.; Cambridge University Press: Cambridge, UK, 2016; ISBN 978-1-107-07626-6. [Google Scholar]
- Szalay-Bekő, M.; Palotai, R.; Szappanos, B.; Kovács, I.A.; Papp, B.; Csermely, P. ModuLand Plug-in for Cytoscape: Determination of Hierarchical Layers of Overlapping Network Modules and Community Centrality. Bioinformatics 2012, 28, 2202–2204. [Google Scholar] [CrossRef] [PubMed]
- Freeman, L.C. Centrality in Social Networks Conceptual Clarification. Soc. Netw. 1978, 1, 215–239. [Google Scholar] [CrossRef]
- Campi, G.; Ricci, A.; Costa, N.; Genovesi, F.; Branca, J.J.V.; Paternostro, F.; Della Posta, D. Dynamic Correlations and Disorder in the Masticatory Musculature Network. Life 2023, 13, 2107. [Google Scholar] [CrossRef] [PubMed]
- Willard, F.H.; Vleeming, A.; Schuenke, M.D.; Danneels, L.; Schleip, R. The Thoracolumbar Fascia: Anatomy, Function and Clinical Considerations. J. Anat. 2012, 221, 507–536. [Google Scholar] [CrossRef] [PubMed]


| Feature | Static Networks | Dynamic Networks |
|---|---|---|
| Node and edge change | Fixed over time | Evolving over time |
| Best use case | Structural/topological analysis | Temporal evolution and interactions |
| Example | Anatomical relationships | Neuromuscular adaptations |
| Metric | Value | Interpretation |
|---|---|---|
| Characteristic path length | 6.43 | Efficient transmission of biomechanical tension |
| Clustering coefficient | 0.341 | Presence of local functional clusters (e.g., muscle groups, fascial systems) |
| Network density | 0.003 | Selective and functionally relevant connections |
| Diameter | 14 | Longest path between two nodes |
| Radius | 7 | Shortest maximum distance to all other nodes |
| Network centralization | 0.036 | Highly decentralized structure → high resilience to localized perturbations |
| Heterogeneity | 1.332 | Presence of key anatomical hubs |
| Connected components | 1 | The entire system is globally integrated |
| Degree Centrality | Betweenness Centrality | Closeness Centrality |
|---|---|---|
| Right Humerus | Pectoralis Major—Right | Gluteus Maximus—Right |
| Left Humerus | Pectoralis Major—Left | Gluteal Aponeurosis—Left |
| Right Crural Fascia | L2 | Gluteal Aponeurosis—Right |
| Left Crural Fascia | Spinal Dura Mater | Iliac Fascia—Left |
| Right Scapula | L4 | Iliac Fascia—Right |
| Left Scapula | L3 | Semispinalis Dorsi—Left |
| Left Tibia | Right Femur | Semispinalis Dorsi—Right |
| Right Tibia | Left Femur | Deep Cervical Fascia |
| Palmar Aponeurosis—Left | Gluteus Maximus—Left | Right Scapula |
| Palmar Aponeurosis—Right | Gluteus Maximus—Right | Left Scapula |
| Right Ilium | D7 | Spinal Rotator Muscles (Dorsal)—Left |
| Left Ilium | Occiput | Thoracic Interspinales—Right |
| Tarsometatarsal Joint Capsule—Right | Dorsal Foot Fascia—Right | Thoracic Interspinales—Left |
| Tarsometatarsal Joint Capsule—Left | Dorsal Foot Fascia—Left | Spinal Rotator Muscles (Dorsal)—Right |
| Right Longissimus Dorsi | D8 | Psoas Major—Right |
| Left Longissimus Dorsi | Left Sartorius | Psoas Major—Left |
| Left Antebrachial Fascia | Right Sartorius | Intervertebral Disc D12–L1 |
| Right Antebrachial Fascia | D9 | Intervertebral Disc D11–D12 |
| Right Temporal | D10 | Middle Cervical Fascia—Right |
| Left Temporal | Mandible | Middle Cervical Fascia—Left |
| Left Fascia Lata | Extensor Digitorum—Right | Right Ilium |
| Right Fascia Lata | Extensor Digitorum—Left | Left Ilium |
| Left Ulna | Gluteal Aponeurosis—Left | Renal Fascia—Left |
| Right Ulna | Gluteal Aponeurosis—Right | Renal Fascia—Right |
| Left Plantar Aponeurosis | L5 | Psoas Minor—Right |
| Right Plantar Aponeurosis | D11 | Psoas Minor—Left |
| Pubis—Left | Right Calcaneus | Pectoralis Major—Right |
| Pubis—Right | Left Calcaneus | Pectoralis Major—Left |
| Thoracic Fascia—Left | Nuchal Fascia—Left | 2nd Rib—Right |
| Thoracic Fascia—Right | Nuchal Fascia—Right | 2nd Rib—Left |
| Hyoid Bone | D6 | Sacrotuberous Ligament—Left |
| Superficial Cervical Fascia—Left | Epicranial Aponeurosis | Sacrotuberous Ligament—Right |
| Superficial Cervical Fascia—Right | Iliocostalis Lumborum—Right | Intervertebral Disc L1–L2 |
| Right Fibula | Iliocostalis Lumborum—Left | Intervertebral Disc L2–L3 |
| Left Fibula | Frontal Bone | Occiput |
| Dorsal Hand Fascia—Right | D1 | Intervertebral Disc L3–L4 |
| Dorsal Hand Fascia—Left | Rectus Abdominis—Right | Intervertebral Disc L4–L5 |
| Frontal Bone | Rectus Abdominis—Left | 4th Rib—Left |
| 3rd Metatarsal—Left | Flexor Carpi Ulnaris—Left | 4th Rib—Right |
| 3rd Metatarsal—Right | Flexor Carpi Ulnaris—Right | 3rd Rib—Left |
| 10th Rib—Left | Cranial Dura Mater—Left | 3rd Rib—Right |
| 10th Rib—Right | Cranial Dura Mater—Right | Thoracolumbar Fascia (Middle Lamina)—Right |
| Right Calcaneus | D3 | Thoracolumbar Fascia (Middle Lamina)—Left |
| Left Calcaneus | D2 | Serratus Posterior Inferior—Left |
| Middle Cervical Fascia—Right | Right Trapezius Muscle | Serratus Posterior Inferior—Right |
| Middle Cervical Fascia—Left | Left Trapezius Muscle | Intervertebral Disc L5–S1 |
| 2nd Rib—Right | Right Longissimus Dorsi | Supraspinous Ligament D5–D6 |
| 2nd Rib—Left | Left Longissimus Dorsi | Supraspinous Ligament D12–L1 |
| 2nd Metatarsal—Right | Right Fibula | Supraspinous Ligament D6–D7 |
| 2nd Metatarsal—Left | Left Fibula | Supraspinous Ligament D11–D12 |
| 4th Metatarsal—Left | Left Deltoid Fascia | 7th Costal Cartilage—Right |
| 4th Metatarsal—Right | Right Deltoid Fascia | 7th Costal Cartilage—Left |
| 9th Rib—Left | Flexor Retinaculum—Left | Supraspinous Ligament D7–D8 |
| 9th Rib—Right | Flexor Retinaculum—Right | Supraspinous Ligament D8–D9 |
| 11th Rib—Left | Middle Cervical Fascia—Right | Supraspinous Ligament D9–D10 |
| 11th Rib—Right | Middle Cervical Fascia—Left | Supraspinous Ligament D10–D11 |
| 12th Rib—Right | Left Ulna | D3 |
| 12th Rib—Left | Right Ulna | D1 |
| Flexor Retinaculum—Left | Right Temporal | D2 |
| Flexor Retinaculum—Right | Left Temporal | D5 |
| Centrality Type | Function | Example Structures | Clinical Applications |
|---|---|---|---|
| Degree Centrality | Local force distribution | Sternum, sacrum, vertebrae | Mobility, decompression, regional integration |
| Betweenness Centrality | Bridge between modules | Humerus, fascia lata | Postural balance, load transfer, movement continuity |
| Closeness Centrality | Global coordination | Lumbar spine, sacroiliac joint | Systemic tension control, motor synchronization |
Disclaimer/Publisher’s Note: The statements, opinions and data contained in all publications are solely those of the individual author(s) and contributor(s) and not of MDPI and/or the editor(s). MDPI and/or the editor(s) disclaim responsibility for any injury to people or property resulting from any ideas, methods, instructions or products referred to in the content. |
© 2025 by the authors. Licensee MDPI, Basel, Switzerland. This article is an open access article distributed under the terms and conditions of the Creative Commons Attribution (CC BY) license (https://creativecommons.org/licenses/by/4.0/).
Share and Cite
Della Posta, D.; Belviso, I.; Branca, J.J.V.; Paternostro, F.; Stecco, C. From Myofascial Chains to the Polyconnective Network: A Novel Approach to Biomechanics and Rehabilitation Based on Graph Theory. Life 2025, 15, 1200. https://doi.org/10.3390/life15081200
Della Posta D, Belviso I, Branca JJV, Paternostro F, Stecco C. From Myofascial Chains to the Polyconnective Network: A Novel Approach to Biomechanics and Rehabilitation Based on Graph Theory. Life. 2025; 15(8):1200. https://doi.org/10.3390/life15081200
Chicago/Turabian StyleDella Posta, Daniele, Immacolata Belviso, Jacopo Junio Valerio Branca, Ferdinando Paternostro, and Carla Stecco. 2025. "From Myofascial Chains to the Polyconnective Network: A Novel Approach to Biomechanics and Rehabilitation Based on Graph Theory" Life 15, no. 8: 1200. https://doi.org/10.3390/life15081200
APA StyleDella Posta, D., Belviso, I., Branca, J. J. V., Paternostro, F., & Stecco, C. (2025). From Myofascial Chains to the Polyconnective Network: A Novel Approach to Biomechanics and Rehabilitation Based on Graph Theory. Life, 15(8), 1200. https://doi.org/10.3390/life15081200