1. Introduction
Myopia is a prevalent refractive error in which distant objects appear blurred because light focuses in front of the retina, usually due to axial elongation [
1]. It affects about one third of children and adolescents worldwide, with rates approaching 45–47% in some groups, and its prevalence is projected to reach 40% by 2050 [
2]. Diagnosis typically relies on visual acuity testing, cycloplegic refraction, and axial length measurements. Recently, artificial intelligence (AI) has been investigated as a tool to develop alternative diagnostic methods, enabling earlier detection [
3]. Early myopia diagnosis is recommended to reduce the burden of side-eye threatening conditions [
4].
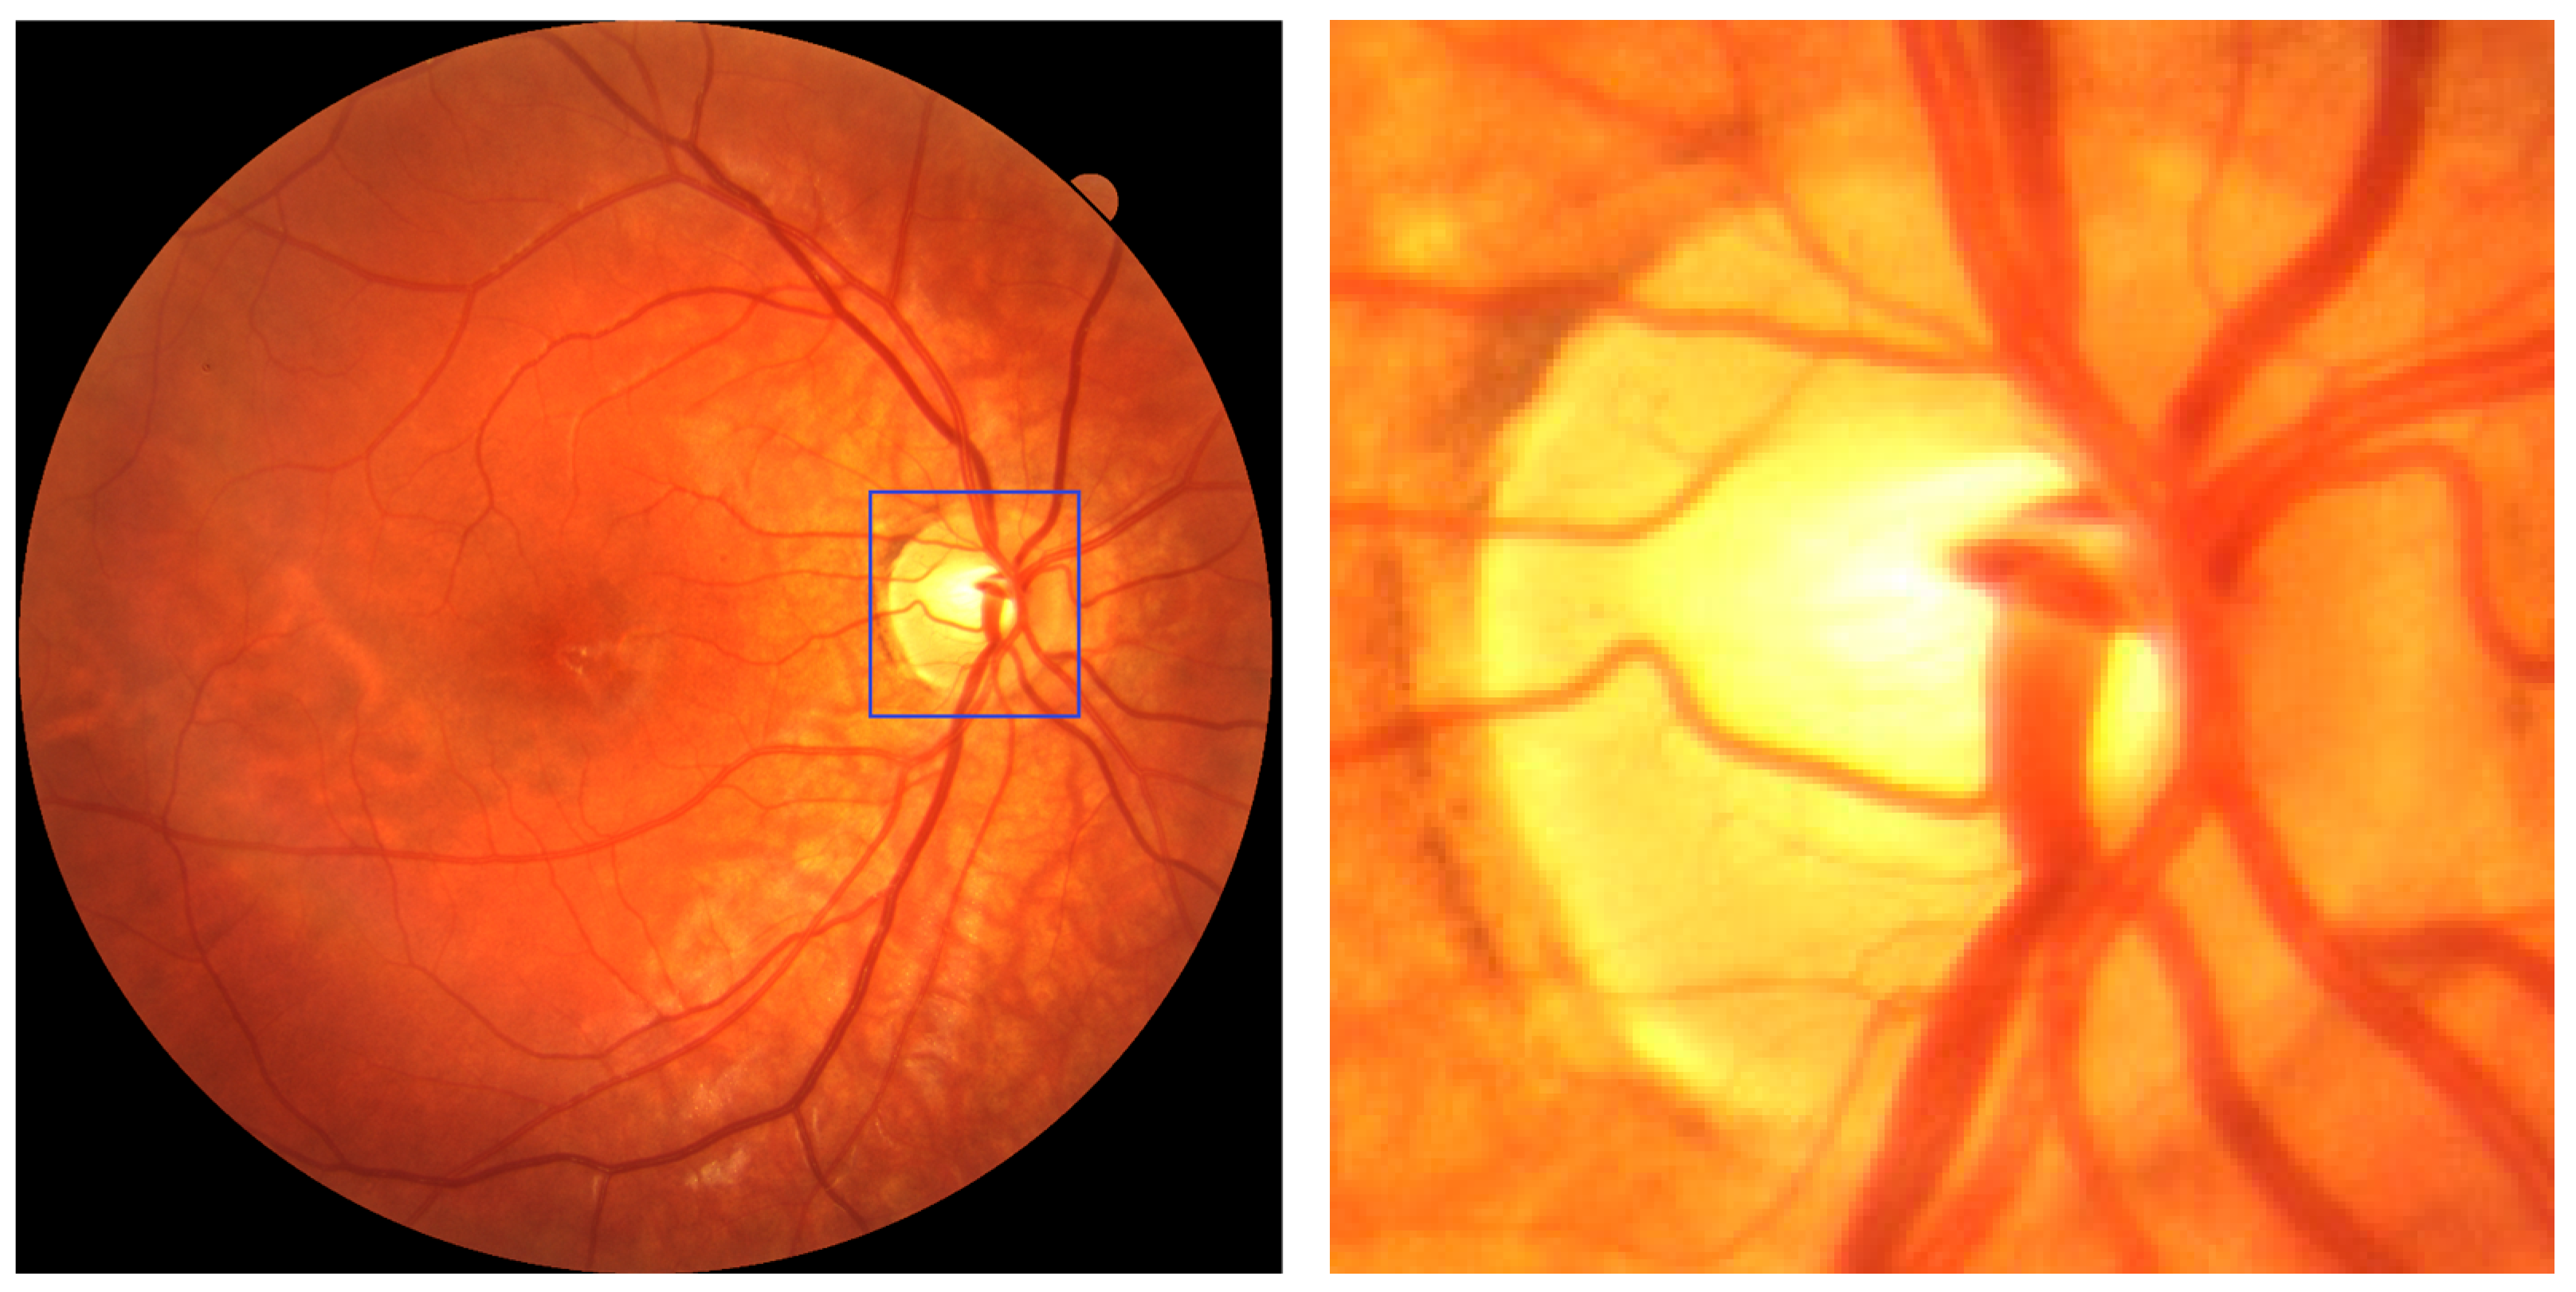
Characteristic fundus changes in myopic eyes include an elliptical, tilted optic disc (quantified by the ovality index), myopic crescent, and parapapillary atrophy (PPA), which enlarges with increasing axial length [
5,
6,
7]. These features correlate with disease severity and provide useful landmarks for automated image analysis based on fundus photography or optical coherence tomography (OCT).
Several studies have investigated the potential of fundus features for the automated diagnosis of myopia. For instance, studies using deep learning on fundus images have demonstrated robust detection of disc tilt patterns, achieving an area under the receiver operating characteristic curve (AUC) of ~0.98 [
2]. Similarly, automated segmentation of fundus tessellation, optic disc area, PPA and tessellated density using convolutional neural networks (CNNs) has shown significant correlations with refractive error and axial length in young adults [
3]. In the context of high myopia and pathologic myopia, other works have applied CNN models for optic disc and lesion segmentation, such as in the PALM (Pathologic Myopia) challenge [
5], reaching an AUC ~0.99 for pathological myopia. Varadarajan et al. developed deep learning models to predict refractive error from fundus photographs, achieving a mean absolute error of less than 1 diopter [
6].
The development and validation of AI-driven software for medical applications is a complex and multidisciplinary task that typically demands a solid foundation in programming, data processing, algorithm design, and machine learning (ML) theory. These competencies, however, are not commonly found among healthcare professionals, whose training is usually focused on clinical knowledge and patient care rather than computational methodologies. This knowledge gap can significantly hinder the adoption and development of AI tools in clinical environments. To mitigate these barriers and democratise access to artificial intelligence in medicine, we leveraged a pre-trained online application programming interface (API) incorporating state-of-the-art machine learning capabilities. These APIs abstract away the technical complexities of model architecture, training pipelines, and parameter tuning, allowing users with only basic computer literacy to build, train, and deploy functional predictive models with minimal coding. This approach enables faster prototyping and broader clinical engagement, especially in settings with limited technical support [
7].
In a previously published paper related to this work, we investigated the potential of AI to analyze retinal fundus images for the detection of myopia [
8]. The study achieved a promising overall accuracy of 84%, with a recall of 97% and an F1 score of 89.5%, indicating excellent sensitivity in detecting myopic cases. The AUC reached 82%, underscoring the robustness of the best-performing model.
These results validate the feasibility of combining optic disc localization with AI-powered classification algorithms to support accurate and scalable myopia screening. By utilizing accessible AI tools such as pre-trained APIs, non-experts can now participate meaningfully in the development of diagnostic software, thus bridging the gap between clinical expertise and technological innovation [
9,
10]. This shift has the potential to accelerate the integration of machine learning into everyday clinical practice, particularly for resource-limited or underserved areas.
Building on this evidence, the present study introduces an automated and user-friendly diagnostic pipeline, enabling healthcare professionals with no computer science background to (i) develop their own algorithm with data coming from their practice; (ii) extract the optic disc using a custom YOLOv8 model [
11]; and (iii) classify the presence of myopia by analyzing the extracted optic disc with its intrinsic characteristics, as described above.
The aim is to create an accessible, scalable AI pipeline suitable for early myopia screening in routine clinical settings by healthcare personnel without specialized informatics training.
The study is structured as follows:
Section 2 reviews related work on the use of the YOLO architecture and briefly discusses previous research using YOLOv8.
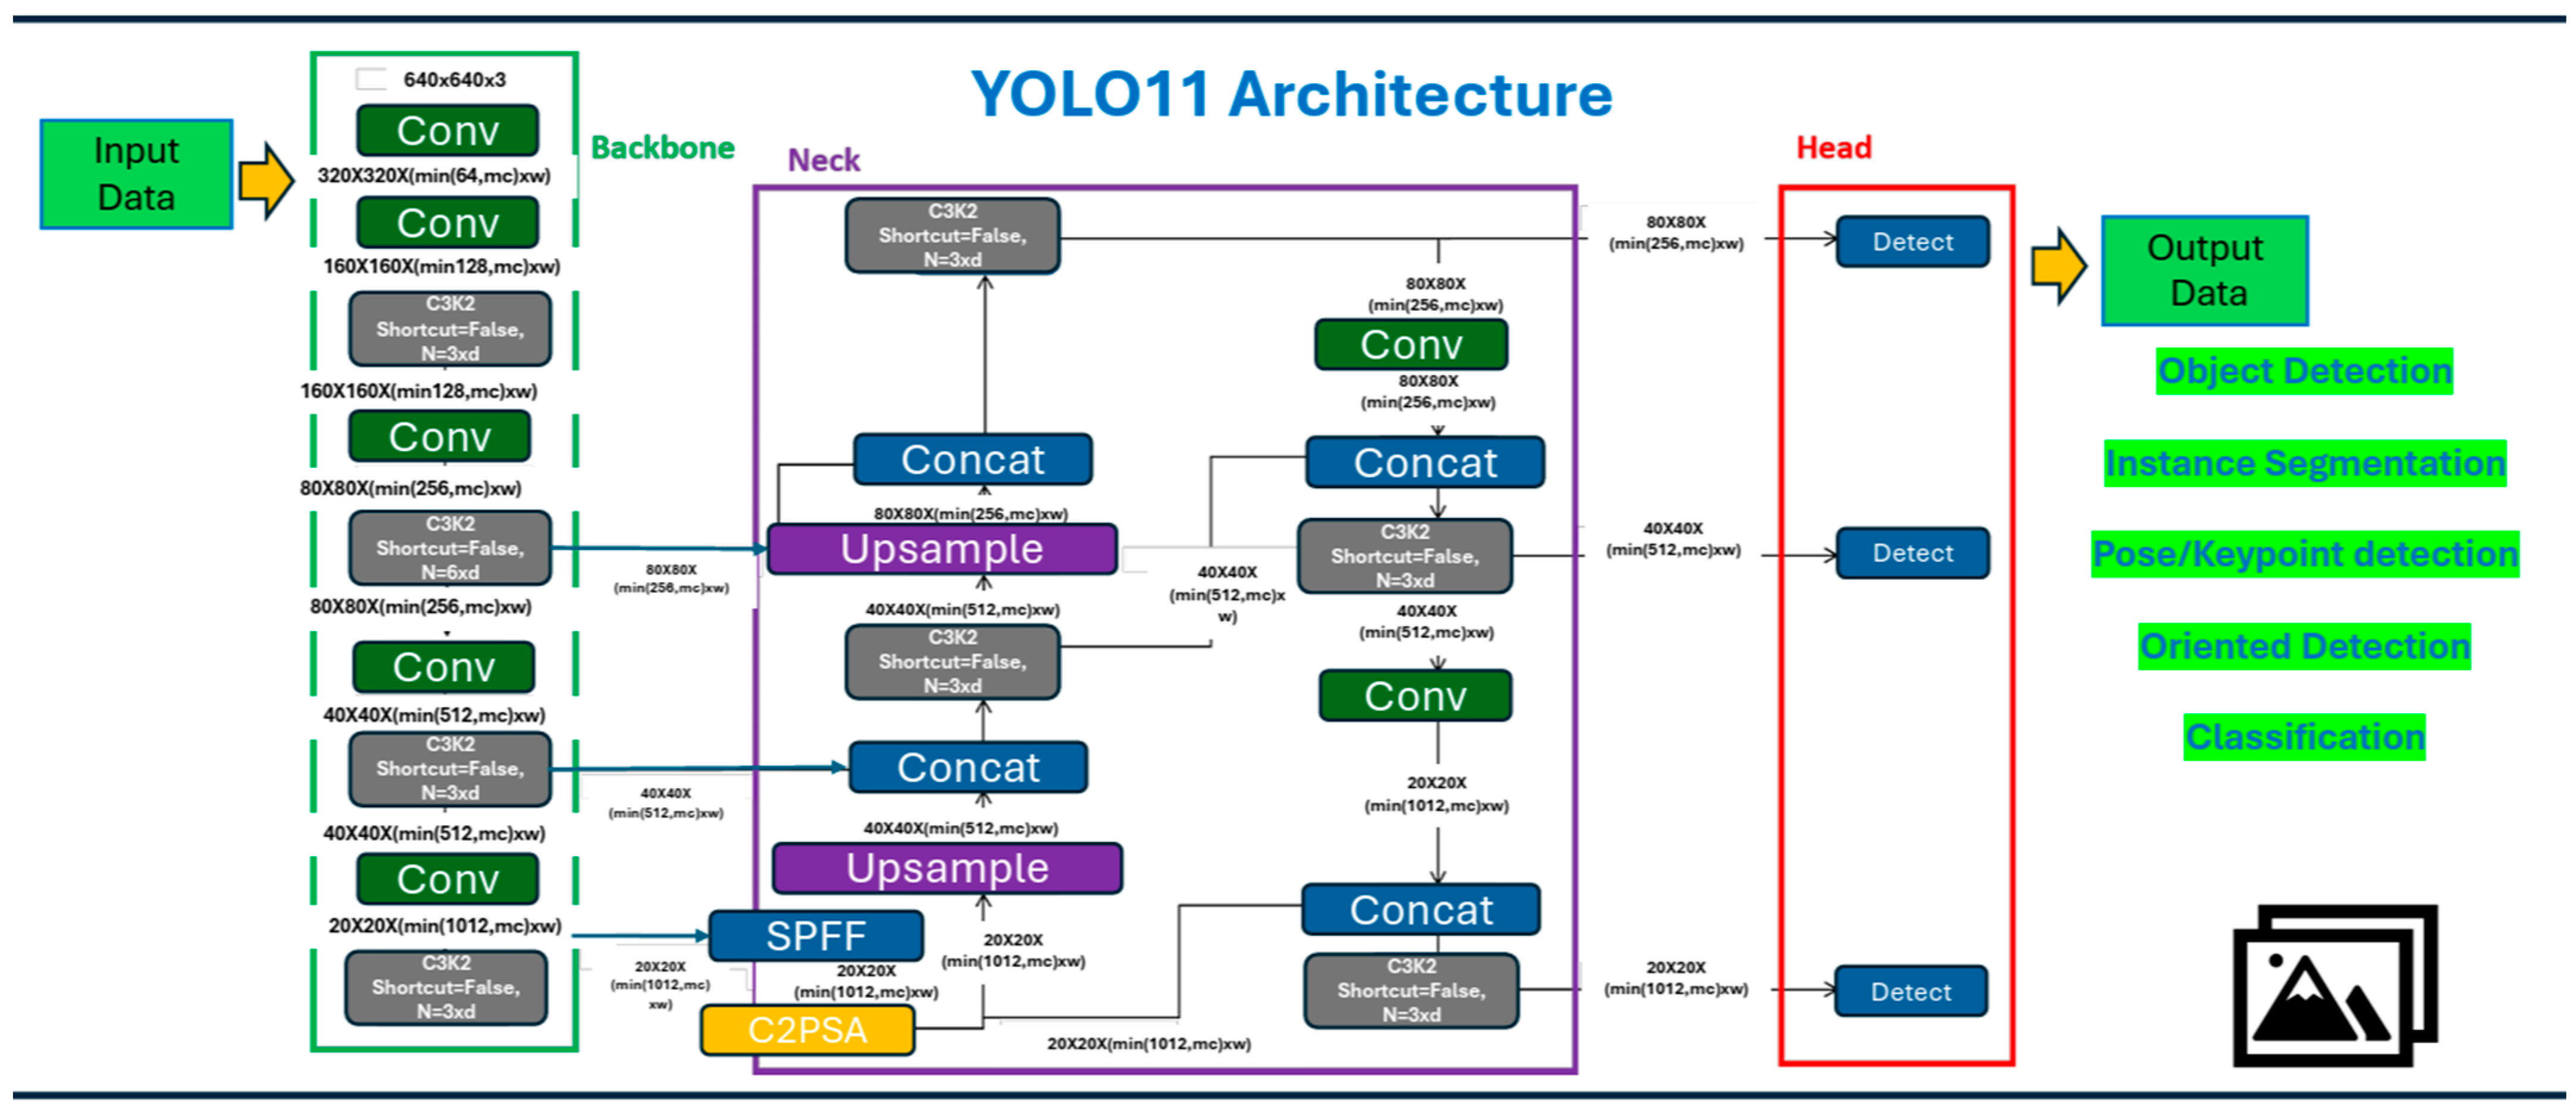
Section 3 outlines the proposed methodology, dataset preparation, and describes the characteristics of YOLOv11. The findings are presented in
Section 4.
Section 5 discusses our study and provides conclusions.
2. Related Work
In [
12], the authors tested three CNN architectures (VGG16, VGG19, and InceptionV3) for myopia classification on the Retinal Fundus Multi-Disease Image Dataset (RFMID) [
13]. From 495 fundus images, expanded to 2025 through augmentation, models were trained to distinguish normal from myopic eyes. With standard settings (224 × 224 input, 32 batch size, 20 epochs, Adam optimizer), accuracies ranged from 66% to 96% on the original dataset and up to 99.5% after augmentation. Although the strong potential of deep learning for myopia detection was demonstrated, the approach required advanced programming skills, limiting accessibility for non-technical clinicians.
The YOLO (You Only Look Once) family of models represents a widely adopted framework for real-time object detection, known for its speed and competitive accuracy [
14,
15]. Introduced by [
16], YOLO applies a single neural network to the full image, predicting bounding boxes and class probabilities in one evaluation. Over time, several versions of YOLO have been released, each improving on architecture, scalability, and performance trade-offs [
17]. The use of the YOLO family ranges from vehicle automation and safety control to surveillance and security, to agricultural applications for plant diseases detection and enhanced fruitlet thinning in commercial orchards, and up to healthcare and medicine, which is our primary area of interest [
17,
18].
Our previous work with YOLO version 8 and version 9 is extensively documented in [
8,
11,
19,
20], where we evaluated these architectures across various optometric and ophthalmologic applications, with particular attention to their accessibility for users without programming expertise. In [
11], we explored the segmentation of diabetic retinopathy features—including microaneurysms, hemorrhages, and exudates—using both YOLOv8 and YOLOv9. A custom, manually annotated dataset was developed using Roboflow’s integrated annotation platform [
21], which facilitated the labelling process even for non-technical users. We also included optic disc segmentation, given its clinical relevance as a key anatomical landmark of the posterior pole. The best-performing model from YOLOv8 achieved a mean average precision (mAP) of 58.4, with specific average precisions of 98.2% for the optic disc, 50.6% for hemorrhages, and 26.5% for microaneurysms. Notably, when microaneurysms were excluded from the segmentation task, the mAP increased to 77%, highlighting the model’s robustness when focusing on larger or more distinct retinal features. These results demonstrated YOLO’s strong spatial precision and suitability for clinical image analysis, even when used by individuals without prior coding experience. Due to the model’s outstanding performance in localizing the optic disc, we chose to retain and adapt the same detection framework for further research.
Building on these results, in [
8], we expanded our investigation by employing YOLOv8 in a novel classification task aimed at diagnosing myopia using full-field fundus photographs. This study marked the first time we applied a YOLO-based detector to perform binary image-level classification, rather than object detection. Despite YOLO’s typical use in detection, the model demonstrated strong generalization capabilities, reaching an accuracy of 84%, recall of 97%, and an F1 score of 89%. These results underscore the model’s potential as a screening tool in clinical settings.
Overall, our findings confirm the versatility of YOLO architectures—especially version 8—not only for precise localization of anatomical structures but also for broader diagnostic applications. Most importantly, the user-friendly design of modern platforms integrating YOLO (such as Roboflow and other no-code tools) makes it possible for clinicians and researchers without a programming background to develop, train, and deploy effective AI-based models. This significantly lowers the barrier to entry for implementing AI in healthcare, especially in resource-limited environments or early-stage research settings.
4. Results
4.1. Internal Validation Outcomes
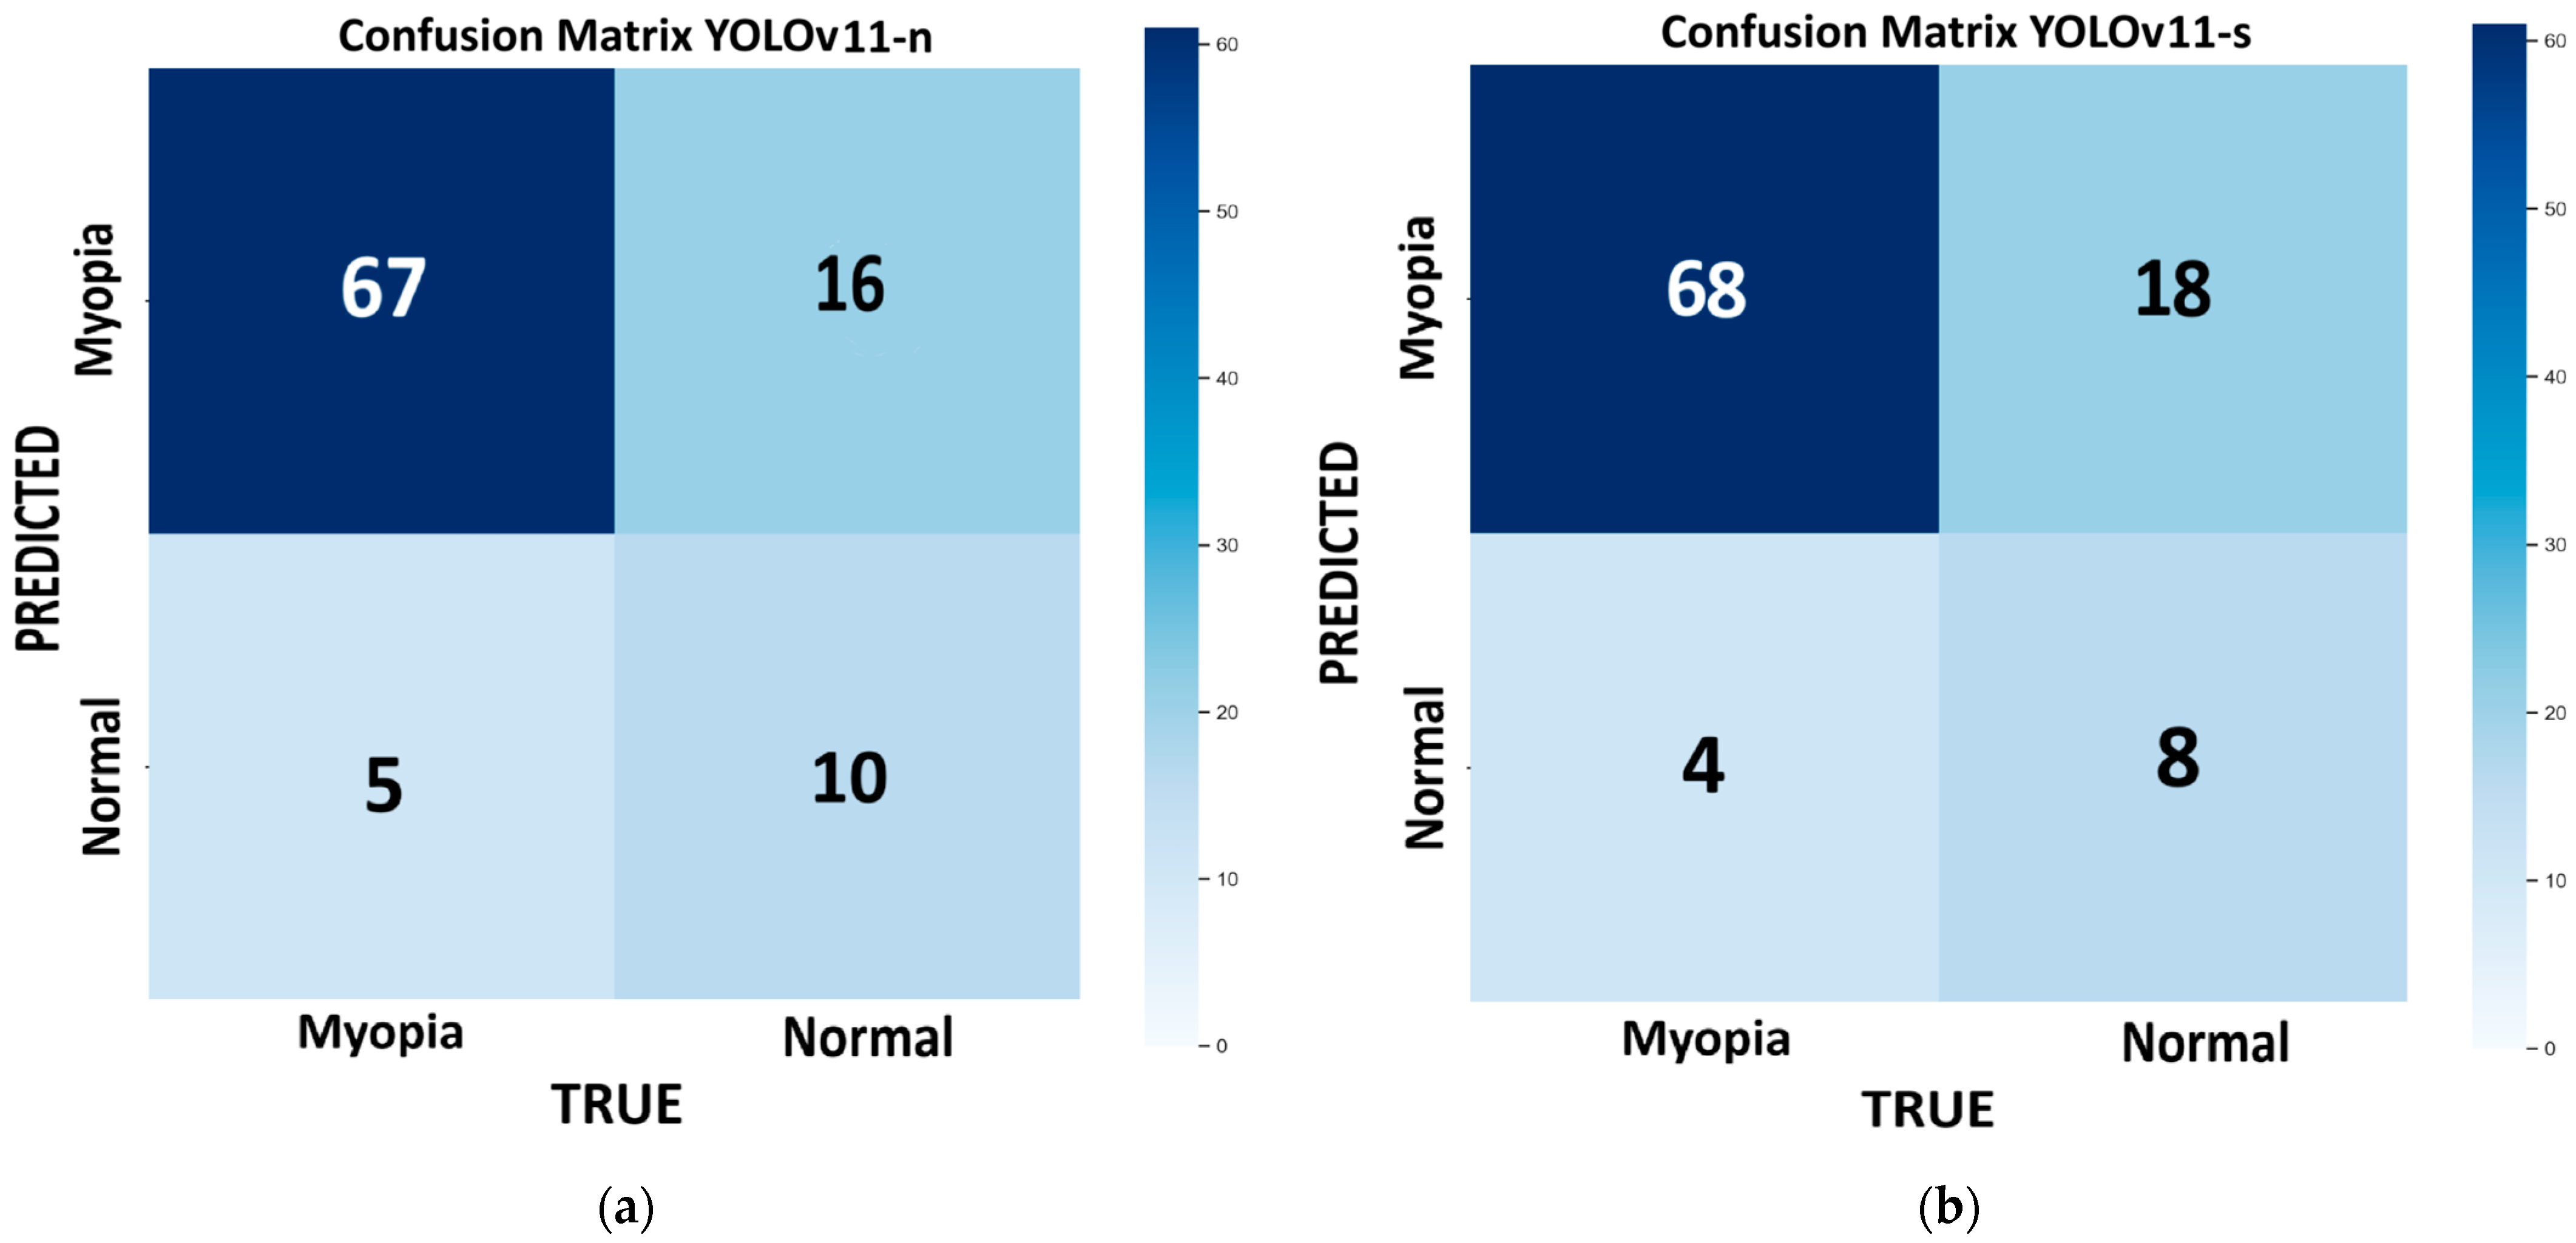
Figure 3 shows the confusion matrix for each model of YOLOv11 tested on the internal validation dataset: nano (
Figure 3a), small (
Figure 3b), medium (
Figure 3c), large (
Figure 3d), and extra large (
Figure 3e). This dataset consists of 98 images, with 72 for myopic eyes and 26 for healthy eyes. Since we had only one value per model, we used the bootstrap method, which revealed no statistically significant differences in the performance metrics across the different models, except for the m model, which provides the highest recall (100%) but has low precision (78.4%) and very low specificity (23%). With this model, the number of false positives is the highest (FP = 20), and it is not suitable for efficient screening purposes. In medicine, recall is crucial for minimizing false negatives and preventing misdiagnosis. The best-performing model, which combines higher recall, accuracy, and F1 score, with lower computational time, is the large variant (R = 93%; ACC = 82%; F1 score = 88%).
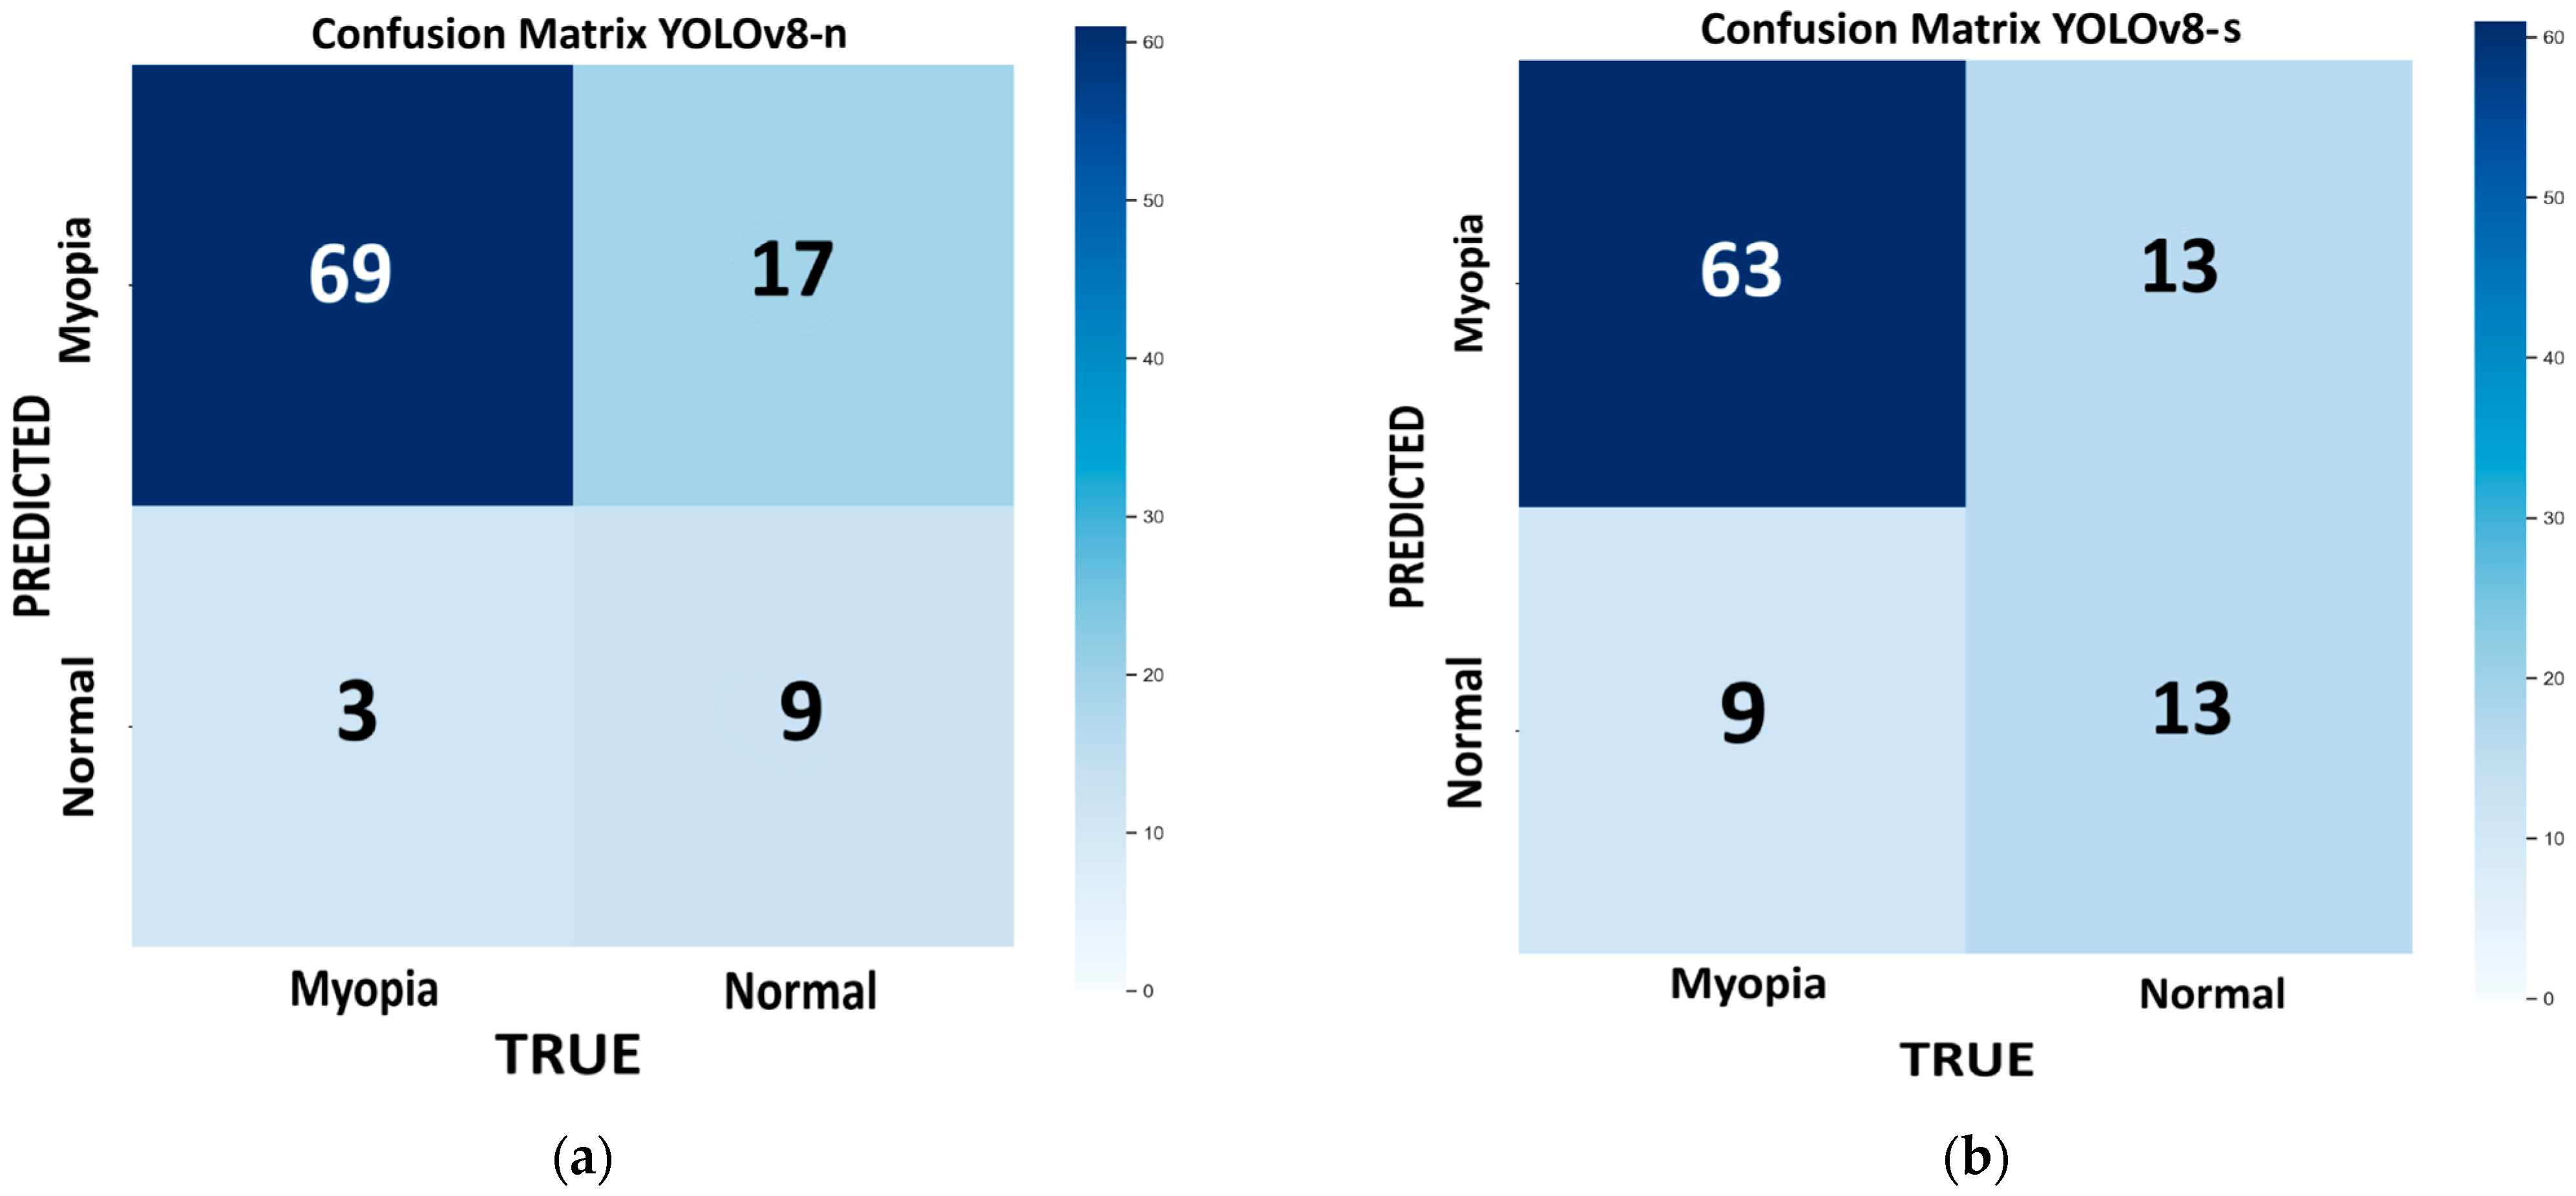
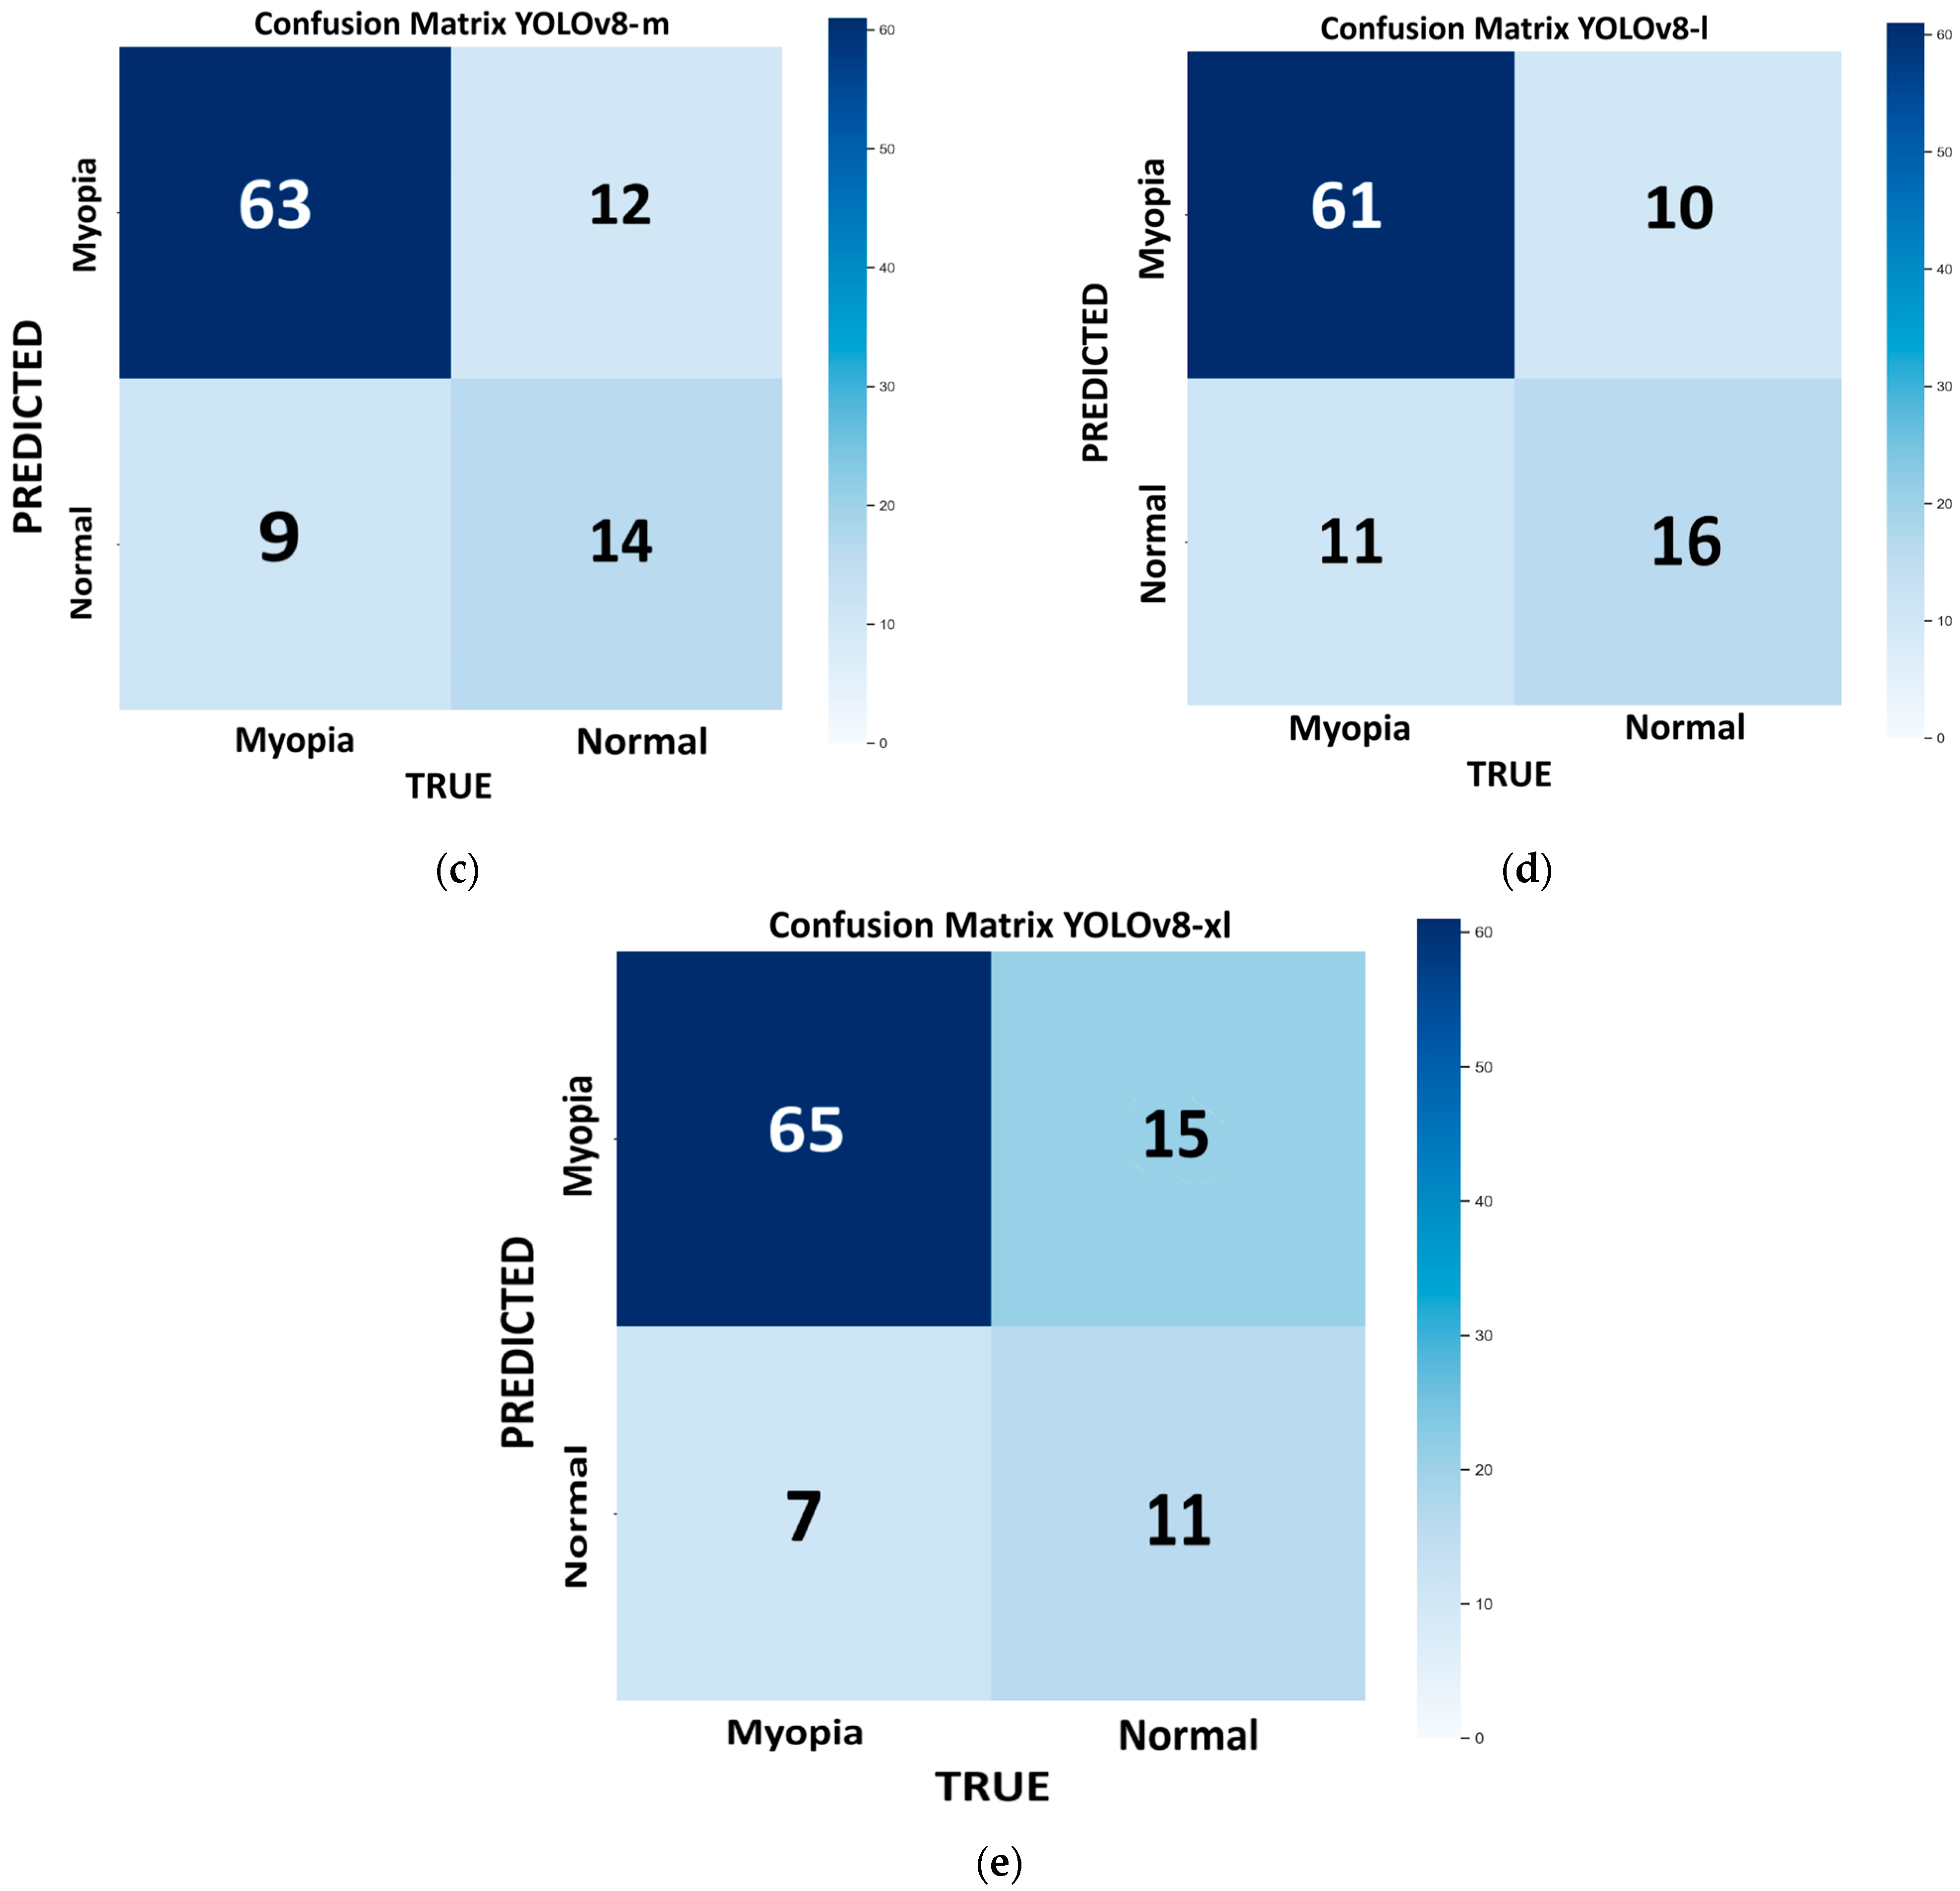
Figure 4 shows the confusion matrix for each model of YOLOv8 tested on the internal validation dataset: nano (
Figure 4a), small (
Figure 4b), medium (
Figure 4c), large (
Figure 4d), and extra large (
Figure 4e). The bootstrap method revealed no statistically significant differences in the performance metrics across the different models. The best-performing model, which combines higher recall, accuracy, and F1 score with a lower computational time, is the n variant (96%, 80%, and 87%, respectively). However, this model has the highest number of false positives (FP = 17), which can interfere with the proper screening process flow. If we consider a more balanced approach (F1 score = 86%), with a reduced number of false positives (FP = 12), keeping a high recall and accuracy (R = 88% and ACC = 79%), and with reasonable low computational time, the m model provides a good compromise.
Table 3 reports the performance metric results for YOLOv8 and v11 variants.
The best-performing models from the YOLOv11 and YOLOv8 families on the internal validation set were YOLOv11-l and YOLOv8-m, respectively. Both offered high recall, accuracy, and F1 score, while maintaining fast inference times. As shown in
Table 4, YOLOv11-l outperformed YOLOv8-m in terms of accuracy (82% vs. 79%), recall (93% vs. 88%), and F1 score (88% vs. 86%). Although YOLOv8-m exhibited slightly higher precision (84% vs. 83.8%), YOLOv11-l demonstrated a superior ability to detect true positives, as reflected in its higher MCC (0.542 vs. 0.468). This suggests that YOLOv11-l is better suited for applications where sensitivity is critical, such as in medical diagnoses. Supporting this, the NPV of YOLOv11-l was also higher (0.722 vs. 0.609), indicating greater reliability in ruling out the presence of pathology in negative cases. Overall, the results highlight the robustness of YOLOv11-l, which combines higher sensitivity with a more balanced error profile, making it a strong candidate in settings with class imbalances or where false negatives carry higher clinical risks.
4.2. Testing Dataset Results
Table 5 summarizes the performance metrics of the different YOLOv8 and v11 models achieved on the external testing dataset, which consists of 50 images, with 35 images from myopic eyes and 15 from healthy eyes. Among all variants evaluated on the test set, the YOLOv11-l model achieved the best overall performance across all metrics. Specifically, it obtained the highest accuracy (92%), a perfect recall (100%), and the best F1 score (95%), indicating an excellent balance between sensitivity and precision (90%). Notably, it also achieved the highest specificity (73%) alongside YOLOv11-xl, suggesting a reduced rate of false positives and thus a more reliable model in distinguishing negative cases. The YOLOv11-xl model performed similarly well, with slightly lower recall (97%) and F1 score (93%), reflecting a minor compromise in sensitivity but maintaining strong precision (90%) and specificity. The smaller models, YOLOv11-n and YOLOv11-s, also demonstrated high recall (97% and 100%, respectively), confirming their ability to detect positive cases effectively. However, their lower specificity (60% for YOLOv11-n and 53% for YOLOv11-s) and moderate precision (85% and 83%, respectively) suggest a tendency toward false positives, which may limit their suitability in applications where diagnostic certainty is required. The YOLOv11-m variant showed the weakest performance, with the lowest specificity (27%) and accuracy (78%), despite achieving perfect recall. This imbalance indicates that YOLOv11-m is prone to over predicting the positive class, leading to a high rate of false alarms. Overall, YOLOv11-l emerges as the most balanced and robust model, especially in settings where both high sensitivity and high specificity are critical—such as in medical image diagnosis—providing confident positive detections while minimizing false positives.
While the YOLOv11-large clearly outperforms the other models tested, we compared it with the variant that we consider to be the second-best overall—YOLOv11-nano—based on its performance in terms of accuracy, sensitivity, and F1 score, as well as its faster inference speed.
First of all, a direct bootstrap comparison between the nano and small models revealed no statistically significant differences across the performance metrics (p > 0.05), so the MCC and NPV were calculated to choose the best between them.
While YOLOv11-small achieved higher values in both NPV (1.00 vs. 0.90) and MCC (0.667 vs. 0.655) compared to YOLOv11-nano, bootstrap analysis showed that these differences were not statistically significant (p = 0.4846). These results suggest that, despite small numerical advantages, the two models perform comparably within the limits of the current dataset. Thus, we decided to compare the large variant of YOLOv11 with the nano model.
YOLOv11-large demonstrated significantly better performance than YOLOv11-nano in terms of both MCC (0.811 vs. 0.450; p = 0.0445) and accuracy (0.920 vs. 0.860; p = 0.0436). The NPV of YOLOv11-large was 100% compared to 90% for YOLOv11-nano, with a mean difference of 0.098, indicating a numerical improvement that was not statistically significant. Overall, these results suggest that YOLOv11-large provides a statistically significant performance gain over YOLOv11-nano in terms of classification consistency and accuracy, while the advantage in NPV, although numerically evident, does not reach statistical significance given the current dataset size. The large model of YOLOv11is still our best choice at this stage of the testing phase.
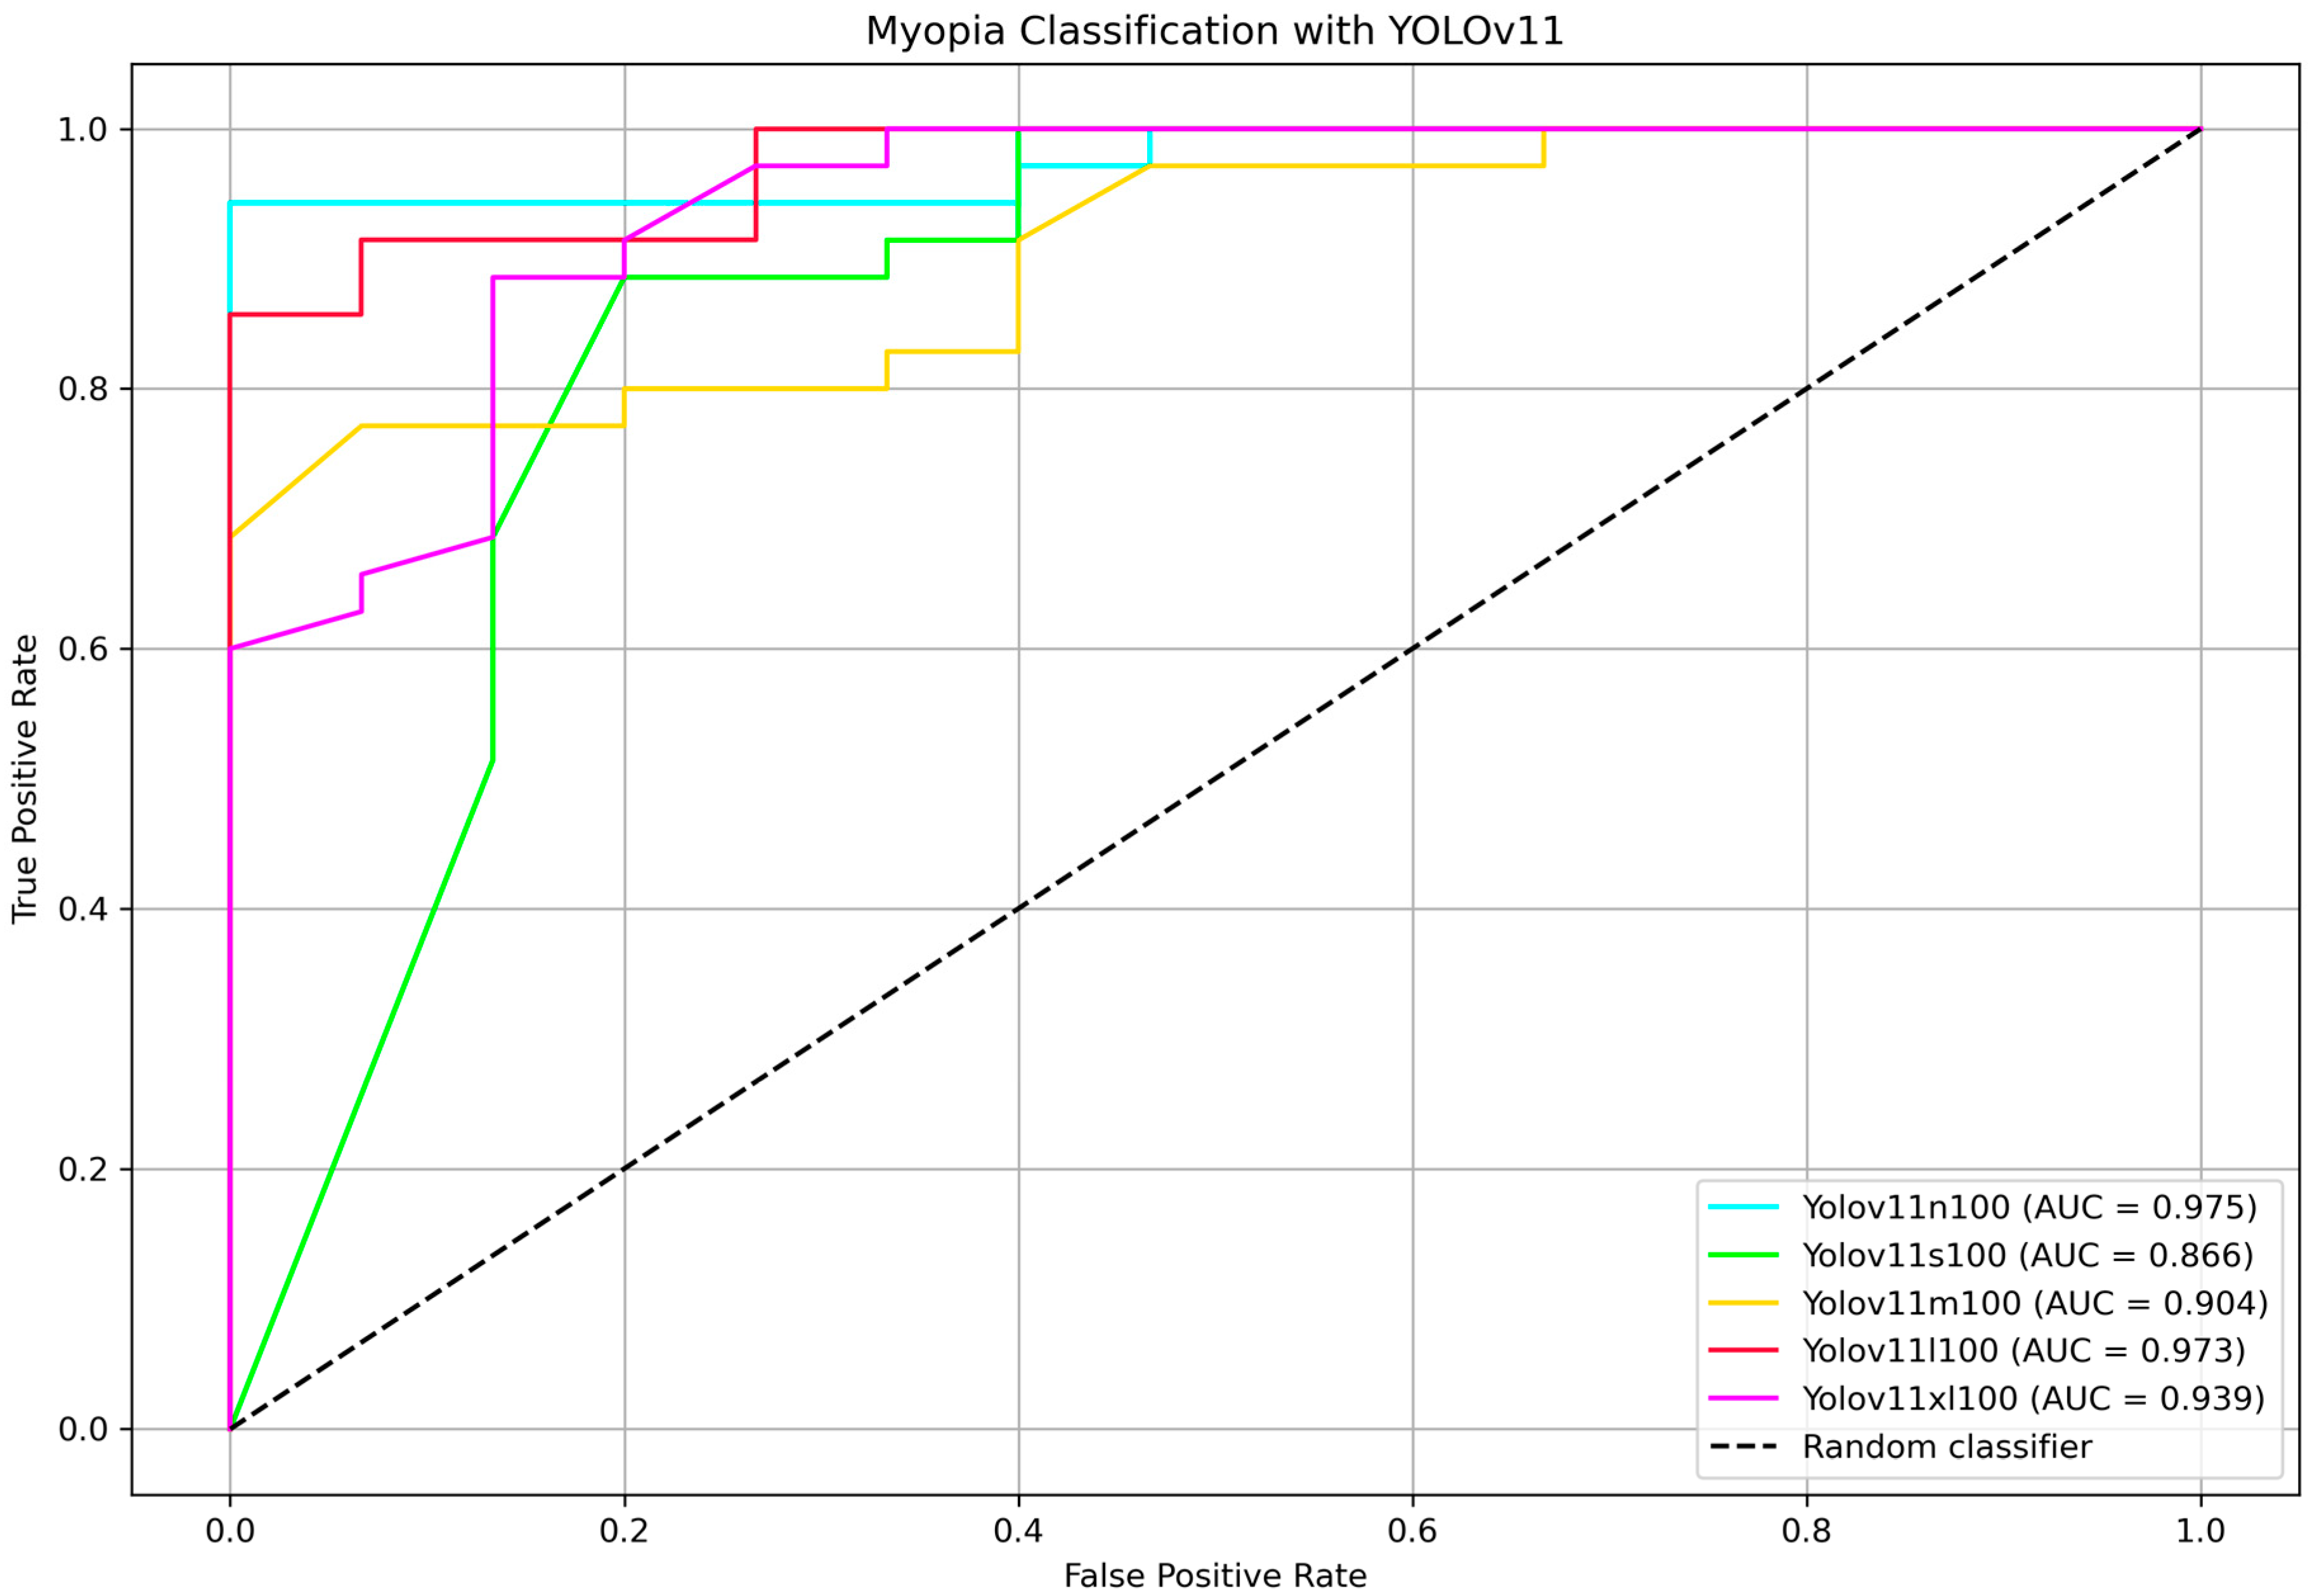
To further identify the most efficient model for distinguishing between myopia and non-myopia from the optic disc picture, ROC curves and corresponding AUC values were computed for all YOLOv11 variants.
Figure 5 shows the ROC curve comparison highlighting the AUC values. Bootstrap-based pairwise comparisons of AUC between YOLOv11 variants revealed no statistically significant differences (all
p > 0.05). Although some comparisons showed marginal trends (e.g., nano vs. medium,
p = 0.080), the results suggest that the discriminative performance of these models, as measured by AUC, is statistically comparable within the external testing set. The two highest AUC belongs to the nano and the large models, 97.5% and 97.3%, respectively, showing that the two classifier are comparable (
p = 0.962). The DeLong test for nano vs. large variants confirmed that they are not statistically different (
p = 0.990).
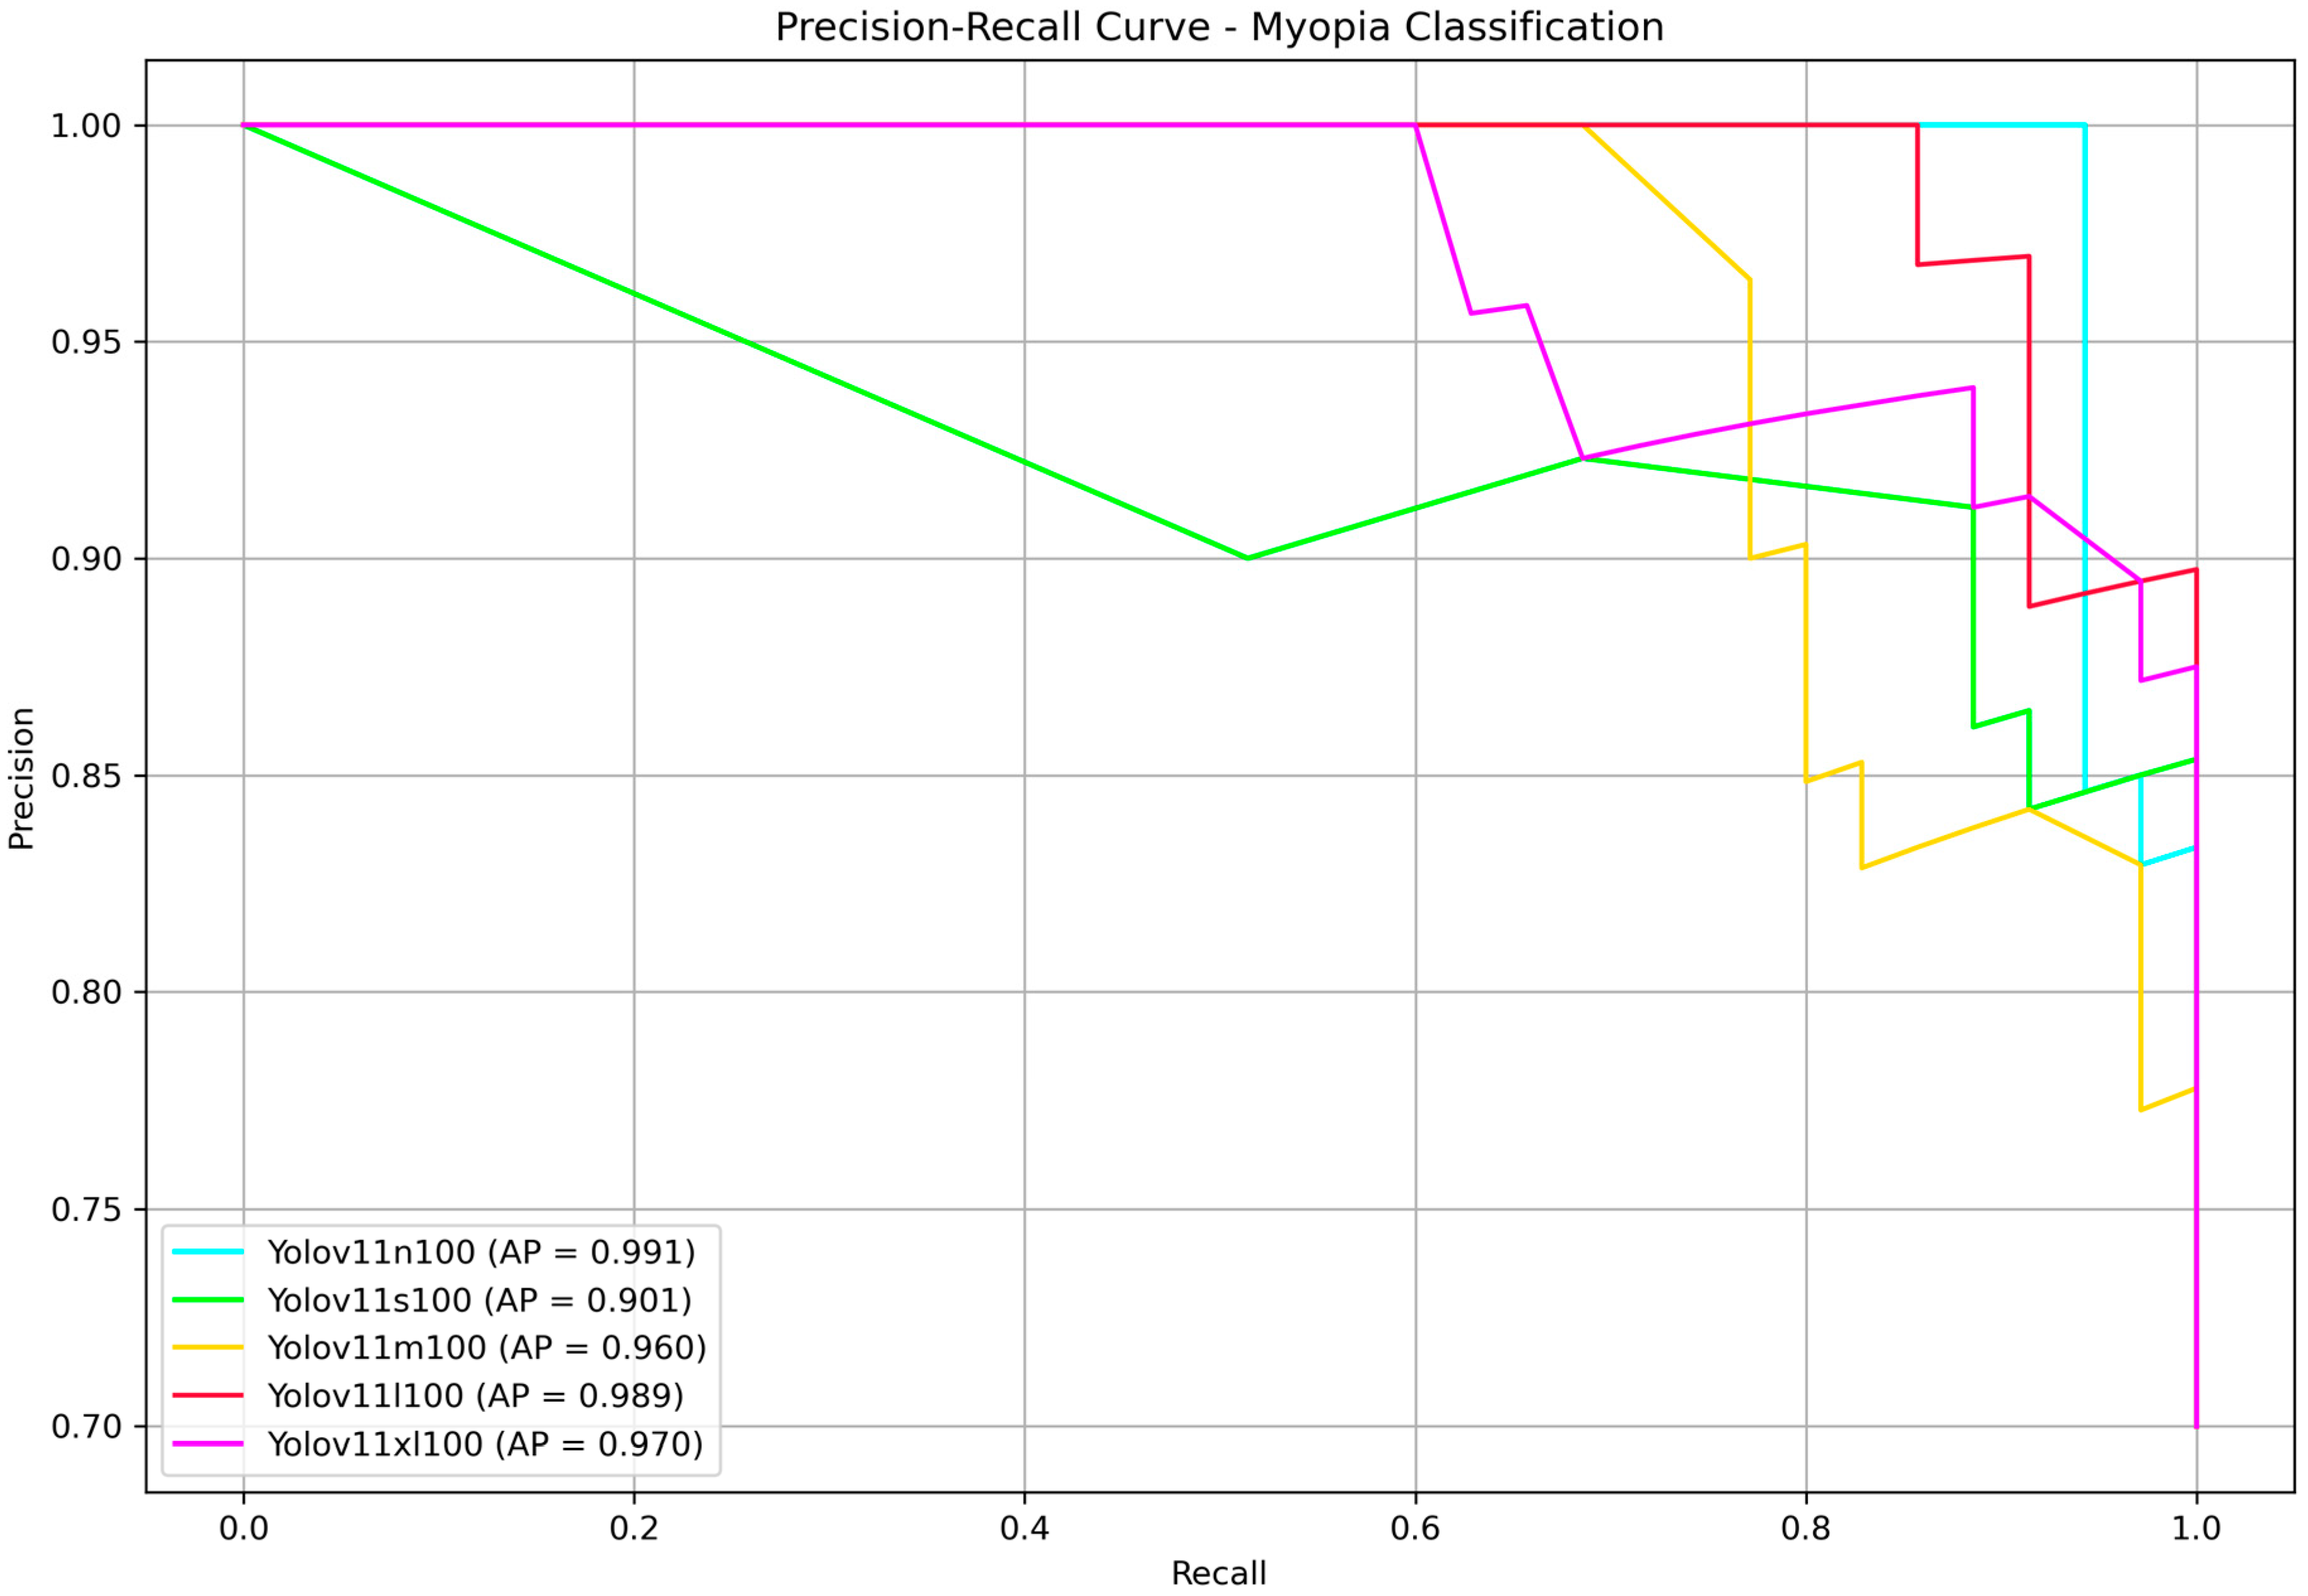
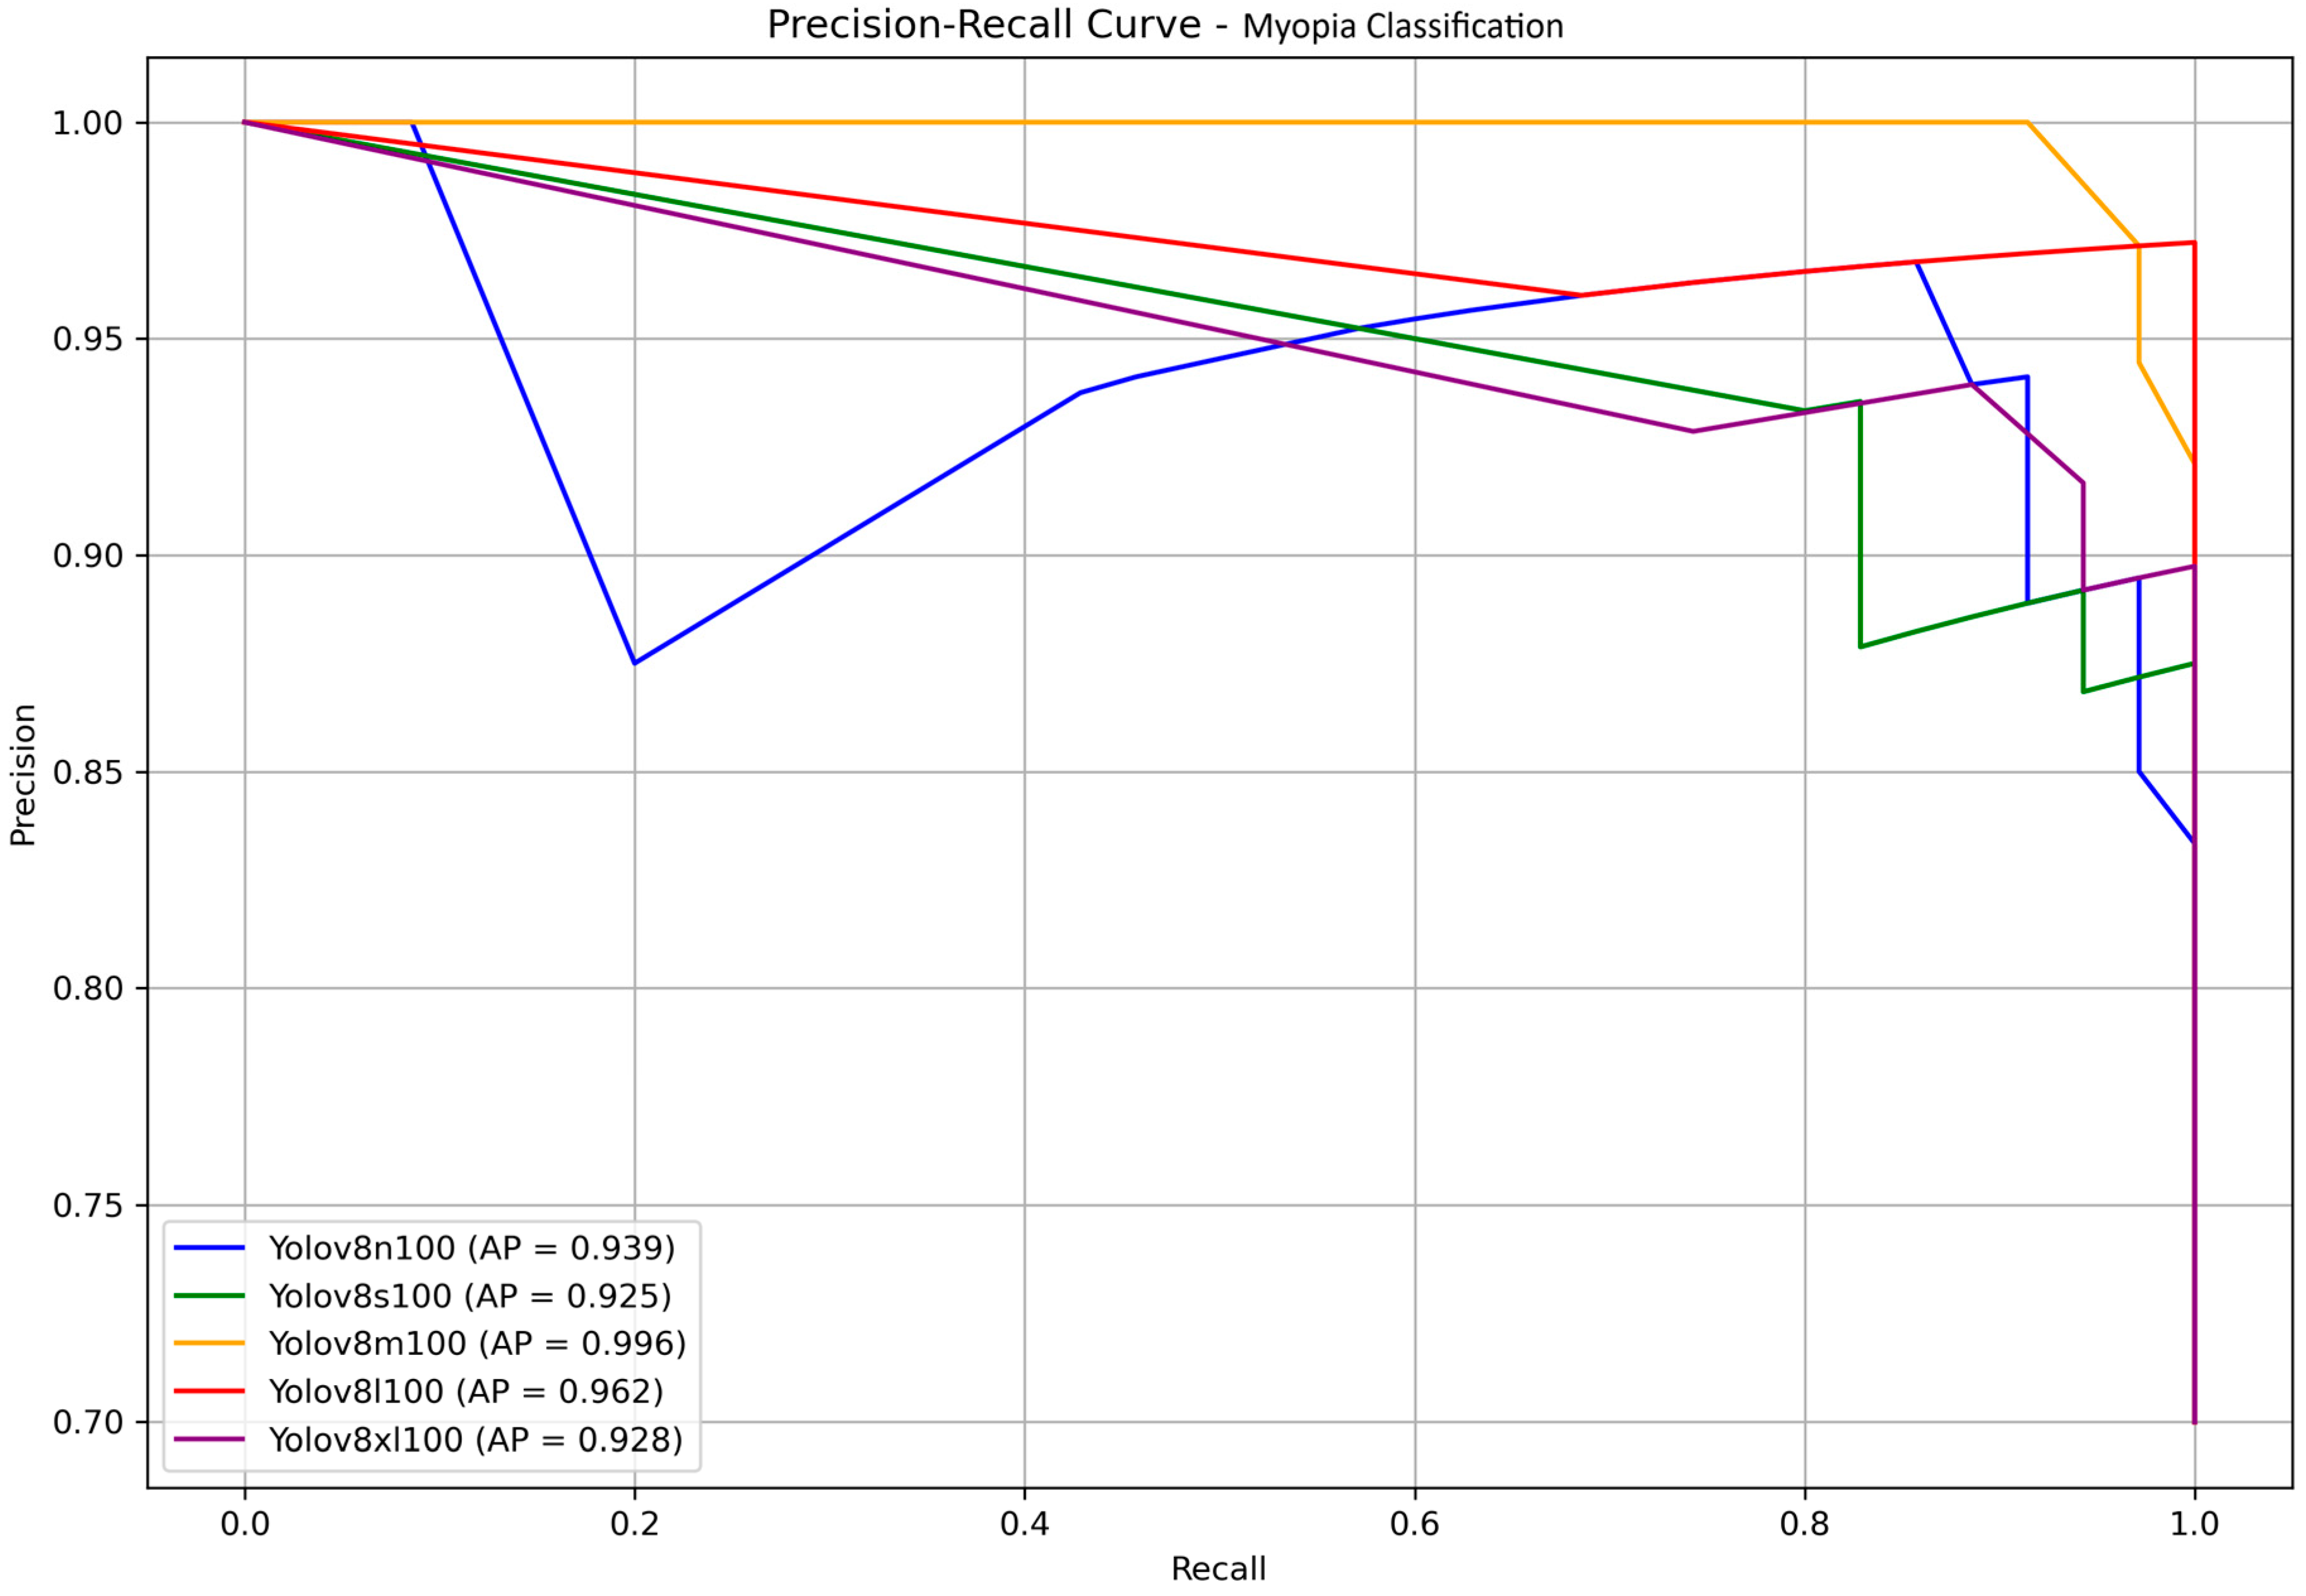
Finally, to present our results in a format familiar to the YOLO community, we reported the precision–recall curves along with the corresponding average precision (AP) values in
Figure 6. AP, defined as the area under the precision–recall curve, is a widely used metric for evaluating classification performance, particularly in imbalanced datasets. In our binary classification task—discriminating between myopia and normal cases—AP effectively captures the model’s ability to rank predictions across all confidence thresholds. Since only a single positive class (myopia) is considered, AP serves as an appropriate and equivalent metric to the mean average precision (mAP), which is commonly used in multi-class or object detection contexts. No statistically significant differences were found, all the models achieved very high AP. The nano and large models provided once more the highest score, with AP of 99.1% and 98.9%, respectively. Since YOLOv11 is faster than its predecessors, this time we decided to choose the large model as the best performing model at the end of the testing phase.
The YOLOv8-l model achieved the highest overall accuracy (98.0%), precision (97%), recall (100%), specificity (93%), and F1 score (99%). The medium and extra-large variants showed comparable accuracy (92%) and perfect recall (100%), but their specificity was notably lower (73%). Smaller models, such as YOLOv8-n and YOLOv8-s, demonstrated lower accuracy and specificity, with the n model exhibiting particularly low specificity (33%) despite perfect recall. These findings suggest that increasing the model size generally improves diagnostic specificity and overall balanced performance, with YOLOv8-l offering the best trade-off among the tested variants.
Although the large model achieved superior metrics, the difference in performance compared to YOLOv8 medium was not statistically significant (p > 0.05). Therefore, at this stage, we selected the medium variant for its reduced computational time and its optimal balance between high accuracy, perfect recall, and solid F1 score, combined with greater efficiency.
Both YOLOv8-m and YOLOv8-l achieved a perfect NPV of 100%, indicating that no positive cases were misclassified as negative and confirming their strong reliability in safely excluding the pathological condition. However, when comparing the overall quality of predictions using the MCC, YOLOv8-l significantly outperformed YOLOv8-m (0.953 vs. 0.811). A bootstrap test confirmed that this difference was statistically significant (p = 0.0473), highlighting that the large variant offers a more robust and balanced classification performance across all elements of the confusion matrix.
In the medical context, sensitivity (recall) is critical to minimizing false negatives and avoiding misdiagnoses. Based on this, the YOLOv8-l variant is the best-performing model if longer inference times are acceptable. Alternatively, the medium variant provides faster classification with only a slight trade-off in performance while maintaining a high diagnostic ability.
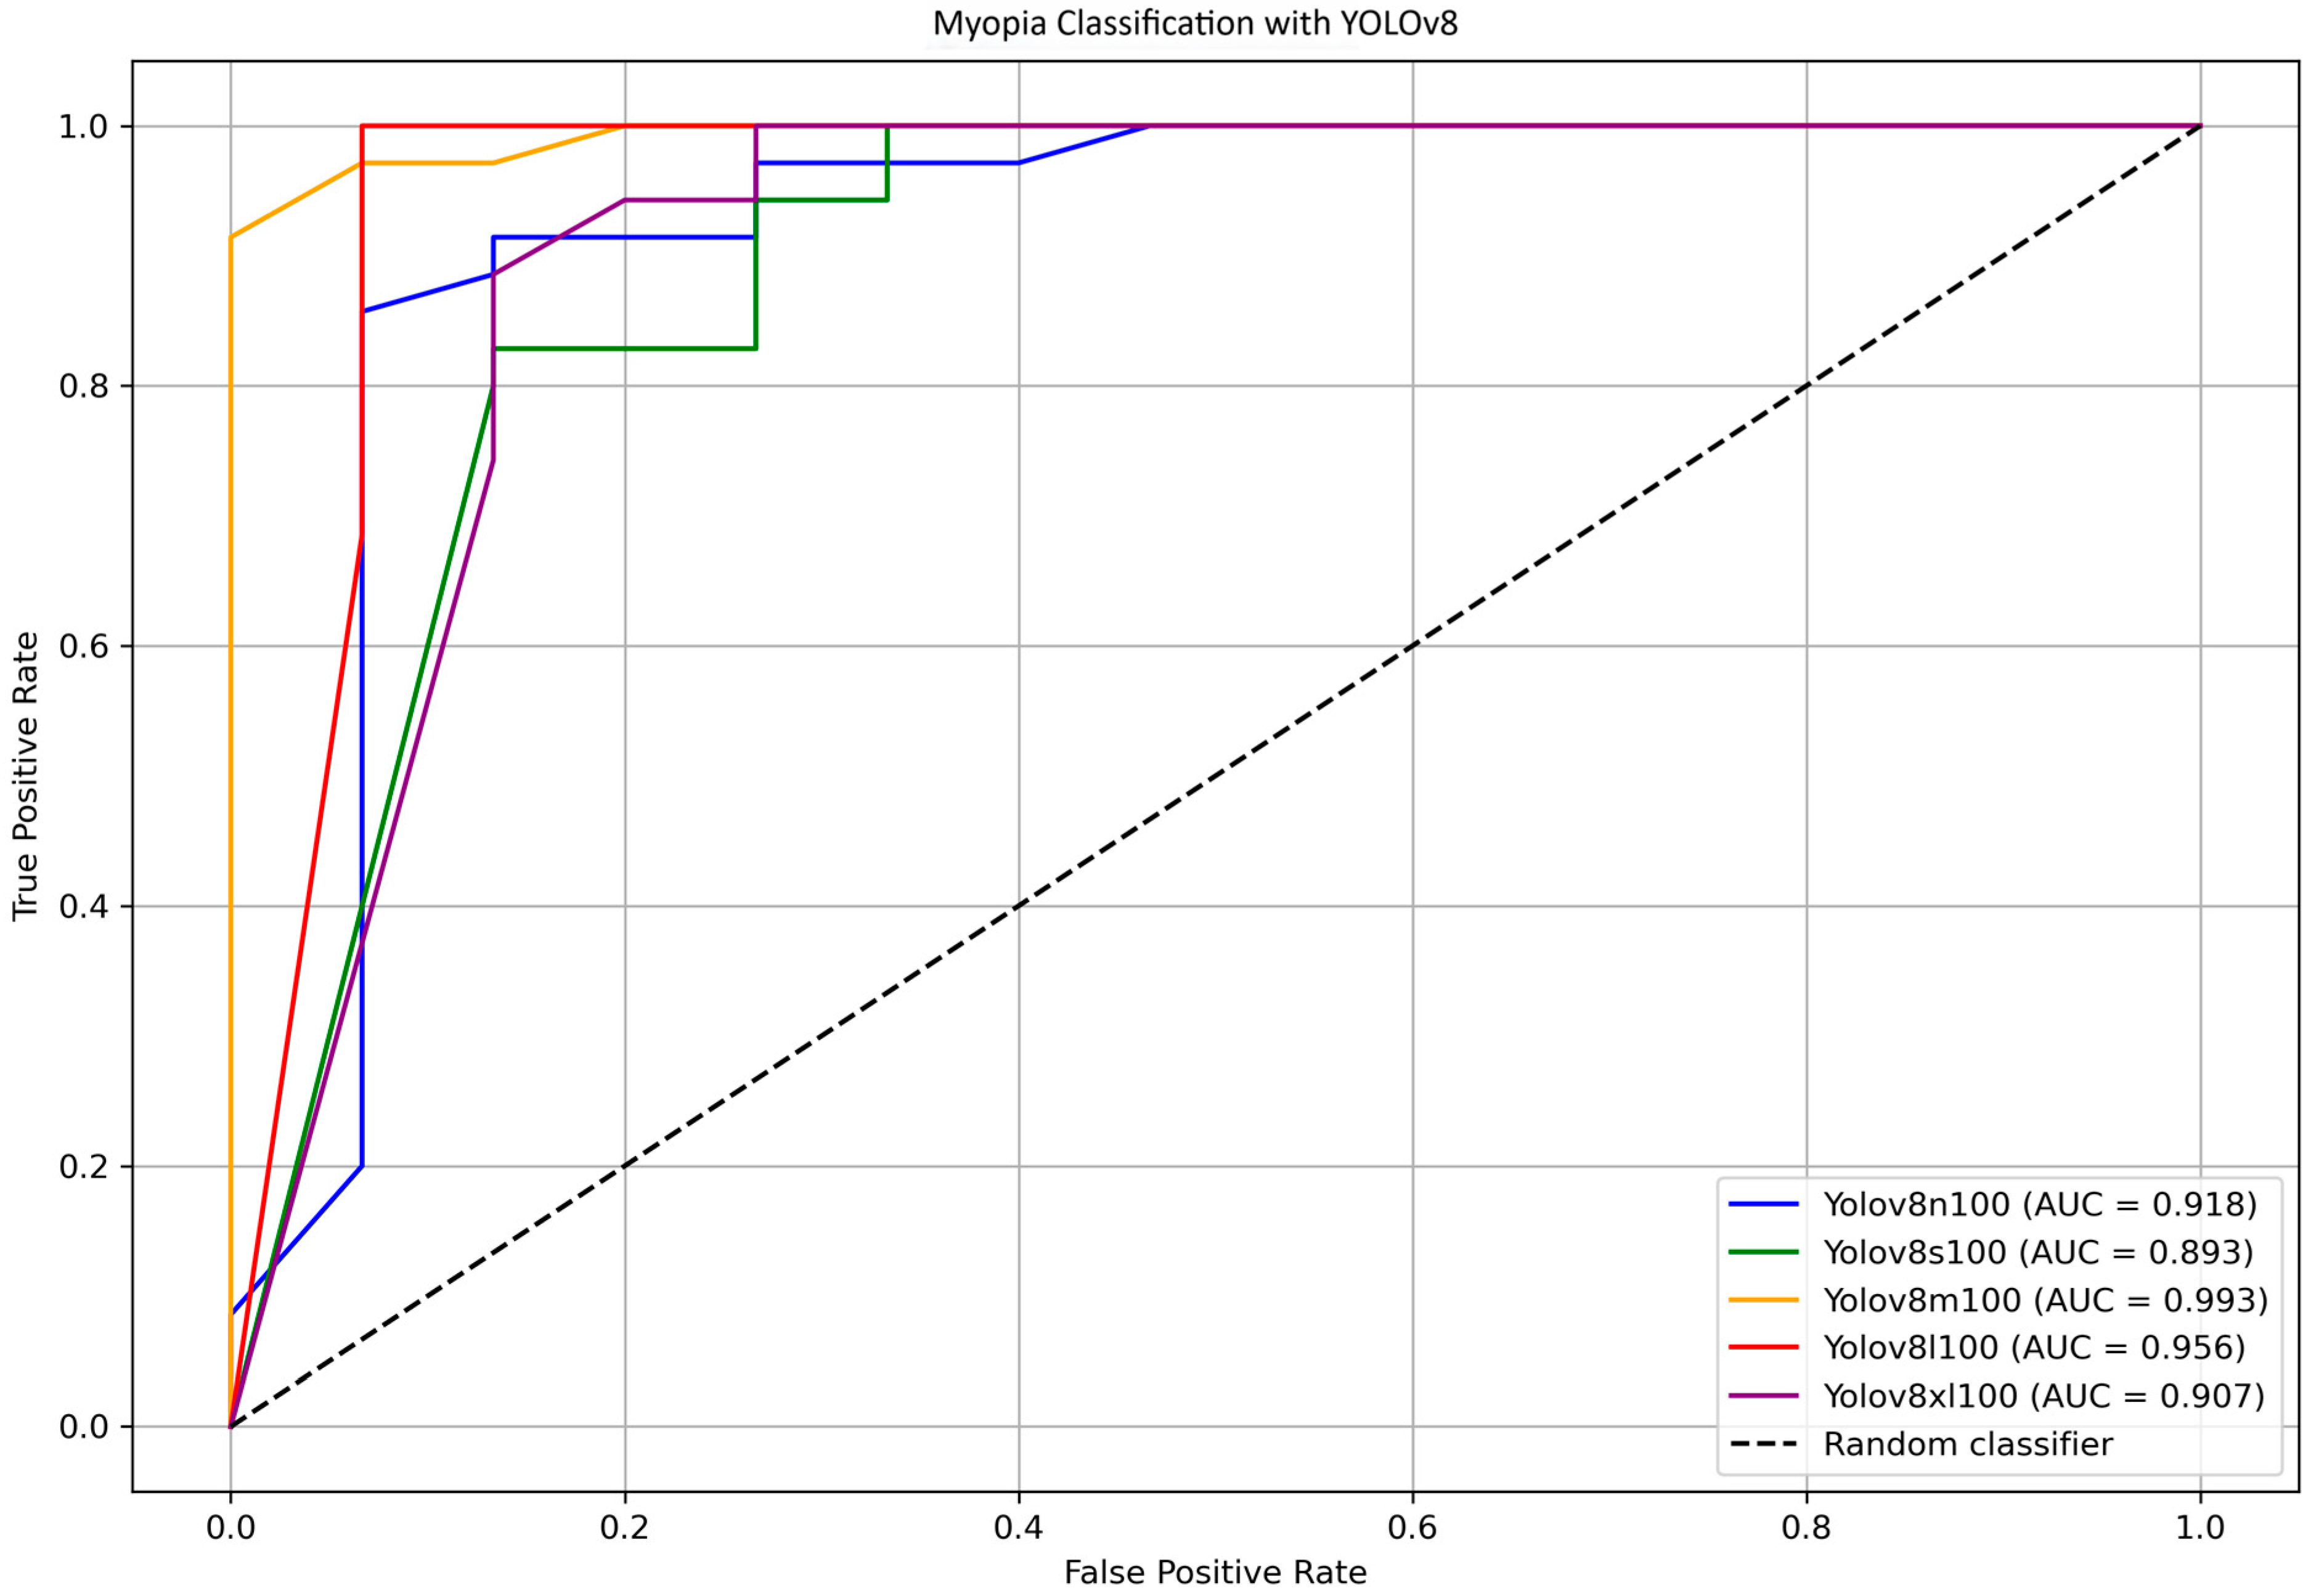
To further identify the most efficient model for distinguishing between myopia and non-myopia, ROC curves and corresponding AUC values were computed for all YOLOv8 variants.
Figure 7 shows the ROC curve comparison for YOLOv8 models n, s, m, l, and xl, highlighting the AUC values. Bootstrap analysis was employed to estimate confidence intervals for the AUCs and to assess the overall differences among the various models. The results indicate that the difference in the AUC between YOLOv8-s and YOLO8-m is statistically significant (
p = 0.018); differences between other pairs of models were not significant. The direct comparison between YOLOv8-m (AUC = 0.993) and YOLOv8-s (AUC = 0.893) was further investigated using the DeLong test, which found no statistically significant differences (
p = 0.398).
The medium variant achieved an AUC of 0.993, while the large variant showed a slightly lower AUC of 0.956. The DeLong test, which was used for comparing these two models, confirmed no statistically significant difference in the AUC (p = 0.762), supporting the notion that both models provide a similarly excellent discriminatory power between myopia and non-myopia.
Overall, these findings confirm that the YOLOv8 models, particularly the medium and large variants, deliver a high diagnostic accuracy with excellent sensitivity and specificity. The medium model offers a compelling balance of performance and computational efficiency, making it suitable for practical applications where inference time and computational power are a concern; on the other hand, the large model maximizes all the performances if longer processing time is acceptable.
The precision–recall curves of the YOLOv8 models, along with their corresponding AP values, are presented in
Figure 8 for a clear comparison. The medium and large models once again achieve the highest scores, with AP values of 0.996 and 0.962, respectively, showing no statistically significant differences. Considering all the above observations, and assuming a scenario without computer science expertise and with limited resources, the medium model emerges as the most suitable choice for the final testing stage.
4.3. Summary of the Results
Among the evaluated models, YOLOv11-l and YOLOv8-m emerged as the top performers on the test dataset. Both models achieved identical confusion matrices, with 35 TP, 11 TN, 4 FP, and 0 FN, resulting in perfect sensitivity (100%); high precision (90%), accuracy (92%), and specificity (73%); and a balanced F1 score of 95%. These metrics (as fully shown in
Table 6), suggest that the models have an excellent ability to detect myopia, which is particularly important in clinical settings. Despite the equivalence in basic classification performance, YOLOv8-m showed slightly higher values in terms of the area under the ROC curve (AUC = 99.3% vs. 97.3%—
p > 0.05) and average precision (AP = 99.6% vs. 98.9%—
p > 0.05), suggesting a marginally superior confidence calibration and ranking ability across thresholds. This indicates that, while both models are equally effective at binary classification, YOLOv8-m may offer improved robustness when confidence scores are critical, such as in decision support systems or threshold tuning scenarios. Both YOLOv11-l and YOLOv8-m models achieved an MCC of 81%, indicating a strong positive correlation between the predicted and actual class labels. This value reflects a robust global performance, as the MCC incorporates all elements of the confusion matrix (TP, TN, FP, FN) into a single metric. Unlike accuracy, which can be misleading in the presence of class imbalances, the MCC remains a reliable measure of overall predictive quality. An MCC above 0.80 is generally interpreted as an excellent result, demonstrating that the models are not only highly sensitive and precise but also balanced in their error distributions. This supports their suitability for diagnostic applications, where both correct identification and reliable exclusion of pathological cases are essential. Therefore, both models are well suited for deployment in diagnostic applications, with YOLOv8-m showing a slight edge in probabilistic output evaluations.
When including the second-best variants, YOLOv8-l notably achieved superior overall classification with an MCC of 95%, no false negatives, and a specificity of 93%, indicating high robustness in correctly identifying both positive and negative cases. In contrast, YOLOv11-n, while maintaining high recall (97%), was penalized by a higher number of false positives (FP = 6), resulting in a lower MCC (66%). These results highlight the importance of balancing sensitivity and specificity and emphasize the robustness of YOLOv8-l in diagnostic scenarios where overall predictive reliability is critical.
Both YOLOv8 and YOLOv11 architectures demonstrated high and clinically meaningful performance in the automated detection of myopia through optic disc photographs. The results suggest that these models are suitable for deployment in diagnostic pipelines aimed at supporting eye care practitioners, without coding expertise, in early screening and assessment tasks. Within the YOLOv11 family, the large variant emerged as the most appropriate choice, balancing high recall, precision, and robustness. For YOLOv8, both the medium and large variants showed excellent performance, with YOLOv8-l standing out as the most accurate and reliable model overall. These findings confirm that both model families are viable options for the AI-assisted diagnosis of myopia and underline the potential of lightweight object detection networks in medical imaging applications.
4.4. Activation Maps Visualization
Activation maps were generated and used to better understand how the models made their predictions. We used the Grad-CAM technique (Gradient-weighted Class Activation Mapping) [
36], which enables a visualization of the image regions that most strongly influence the model’s classification, and the Parula color map, allowing for a more precise and balanced visual representation of activation intensities. The Parula color map enhances the clinical interpretability of maps compared to traditional maps, such as Jet. This methodological combination provided a reliable visual assessment of the differences in attention patterns between the YOLOv8-m and YOLOv11-l models.
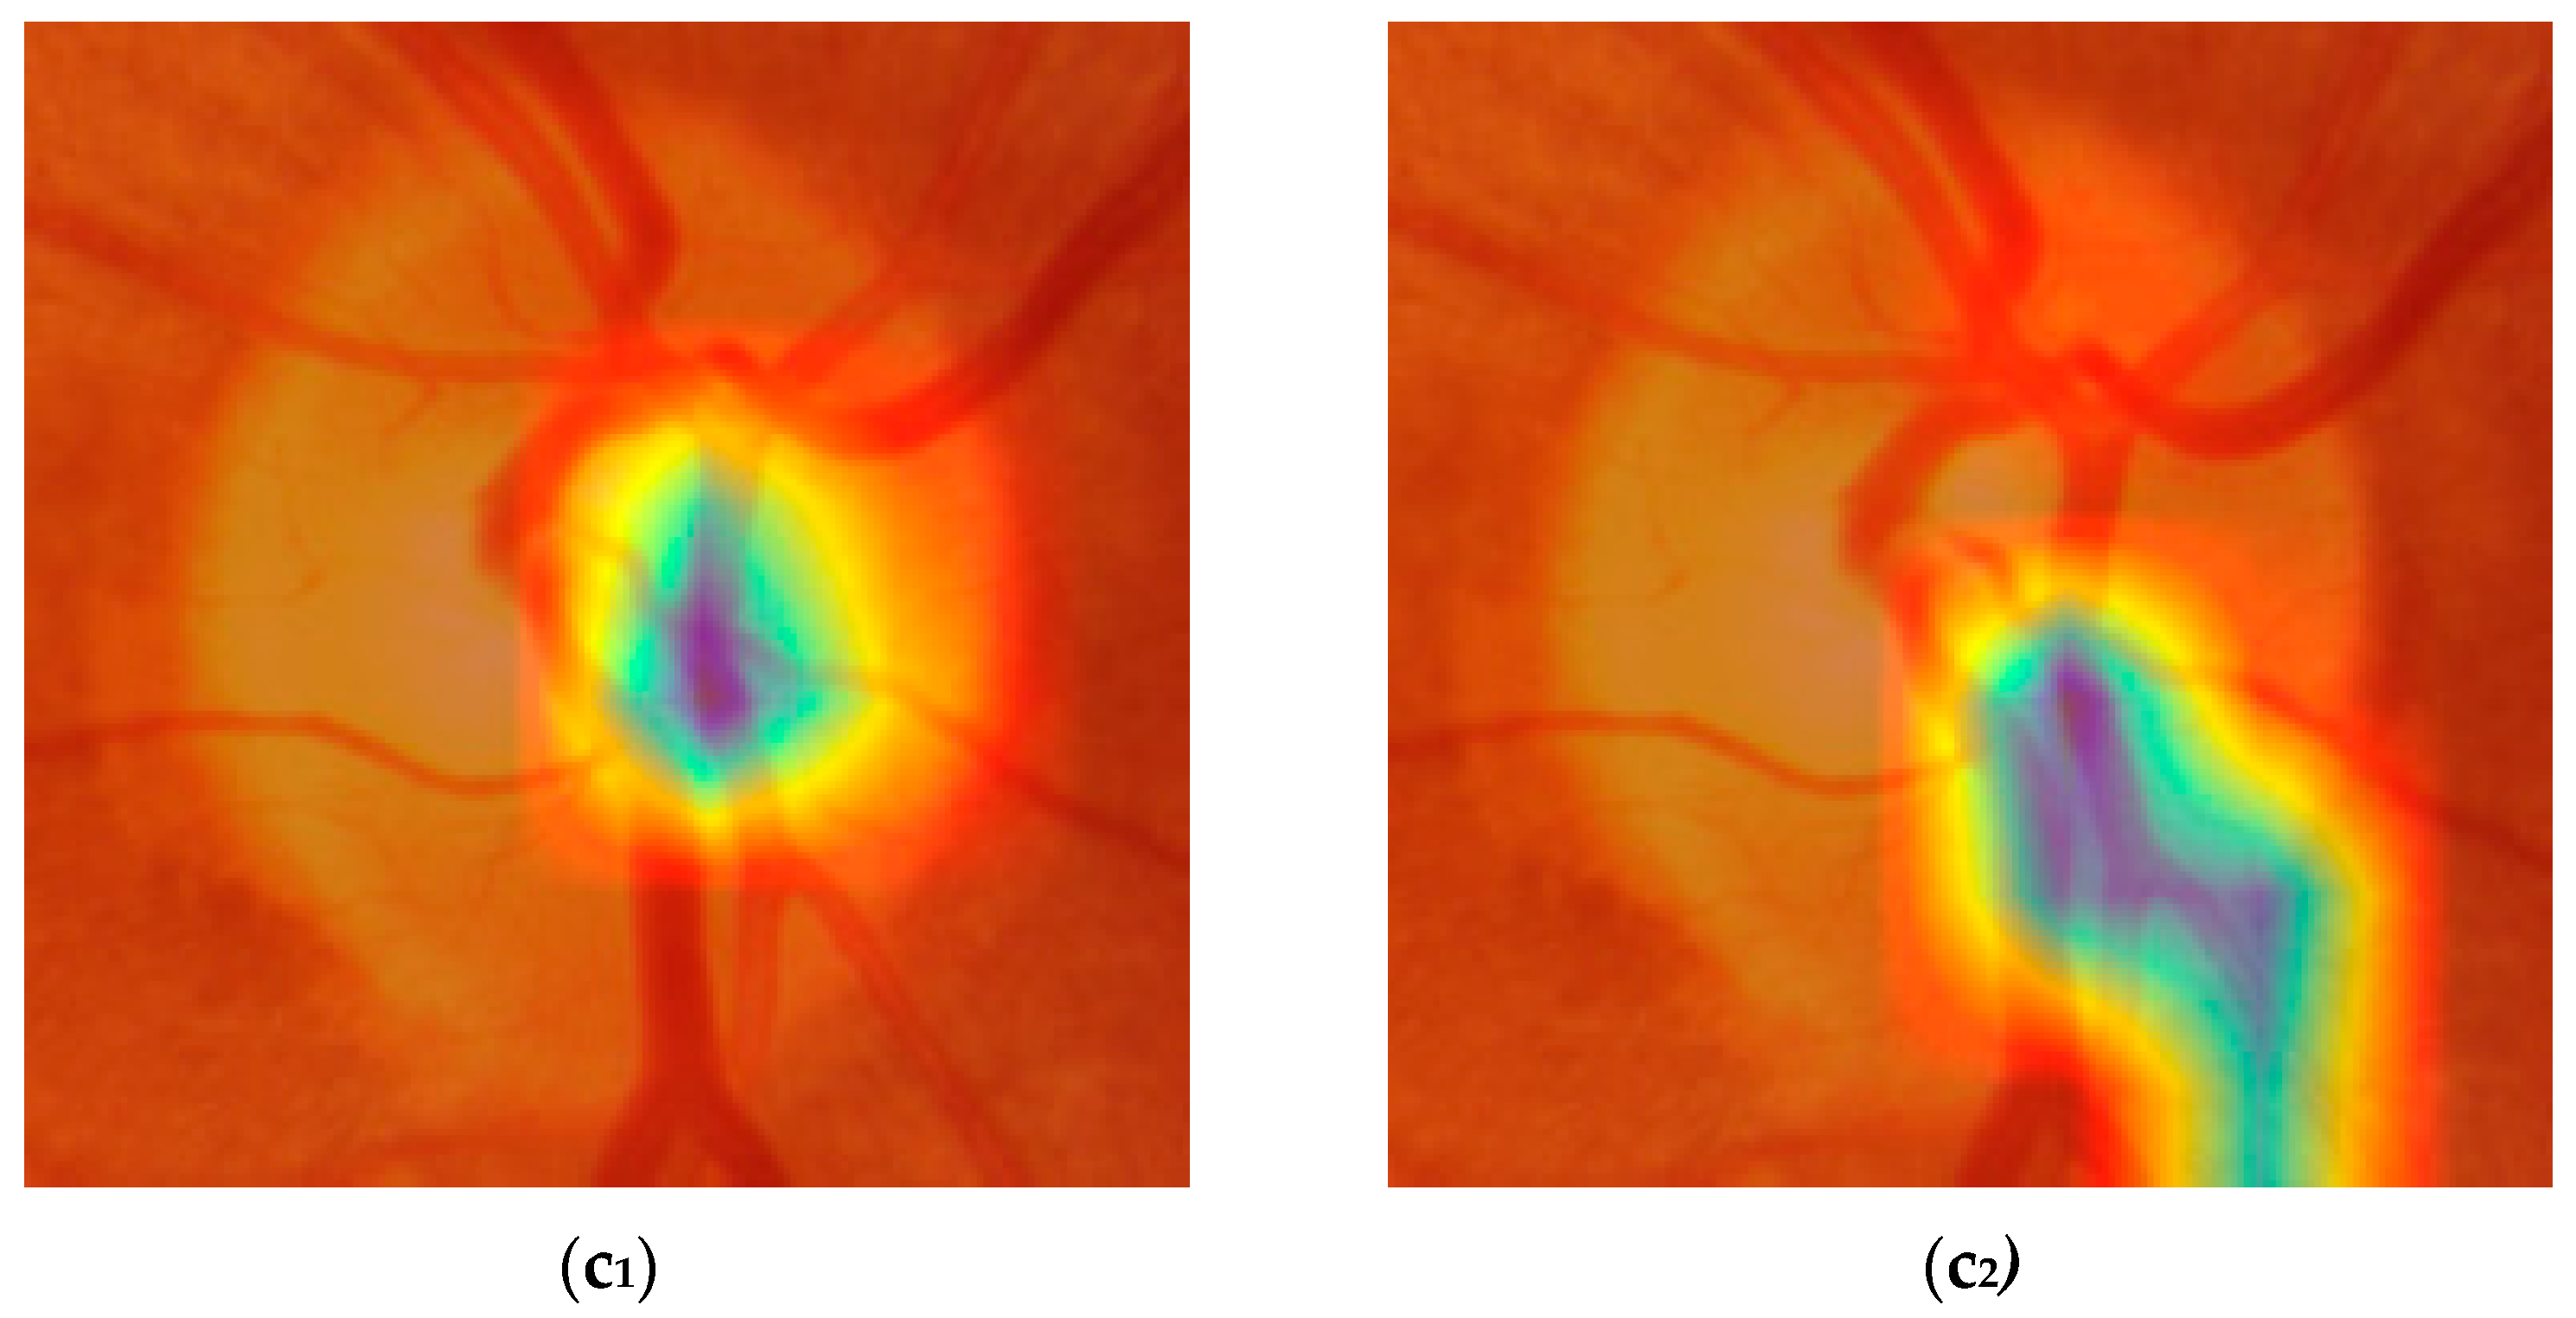
Figure 9 shows six examples of activation maps (three from YOLOv8-m and three from YOLOv11-l), based on the following: (a) both models correctly predicting the actual ground truth; (b) both models making a wrong prediction; and (c) one model predicting the outcome correctly and the other not.
Figure 9(a
1,a
2) show how the models correctly predict the absence of myopia. Although both models focused on the same portion of the optic disc, YOLOv8-m showed a more localized and distinct pattern, with activation confined to peripheral regions of the optic disc, leaving the central zone inactive. YOLOv11-l instead involved a larger portion of the same OD region, including the nasal side of the OD margin and part of the superior vascular segments. In both cases, the cup was poorly activated, which is consistent with the plausible absence of myopia.
In
Figure 9(b
1,b
2), the examined models incorrectly classified the picture as if it was from a myopic eye. The region of activation is focused on the paracentral portion of the OD, with the cup still inactive, with YOLOv8-m being larger and growing more horizontally compared to YOLOv11-l, which is more localized and downward. At this point, it is already difficult to understand what the differences are that let the models predict the ground truth correctly or not. That is because the activated regions represented in the maps are very similar and sometimes confounding. The same could be said for the last example case reported in
Figure 9(c
1,c
2), where YOLOv8-m correctly classifies a normal eye as a true negative, while YOLOv11-l identifies it as myopic (i.e., a false positive). In
Figure 9(c
1), the pattern is extremely similar to the one shown by (a
1) and (a
2), but it is also very hard to state whether it is different from (b
1) and (b
2). The activation gradient is well-defined and concentrated, suggesting that the model identifies a discriminating anatomical feature with high confidence; however, we cannot say with certainty whether it depends on the characteristics of the optic disc margin or on localized variations in color and texture. This also makes it difficult to interpret the pattern presented in
Figure 9(c
2) which, despite having a downward smear and a less regular appearance, does not show any obvious signs that distinguish it from the others. This problem makes it difficult to correctly interpret the activation maps both when the predictions are accurate and when they are not. Certainly, further investigation is needed to better understand which characteristics of the optic disc represent the true discriminant for effectively differentiating between myopia and non-myopia.
5. Discussion
We successfully created an image dataset consisting of optic disc-centered pictures from myopic and healthy eyes, categorized by eye SER, using our custom-built YOLOv8 segmentation algorithm [
14]. This dataset has a strong potential for developing AI-based methods for objective myopia screening based on objective measurable indicators.
Our results suggest that both YOLOv11 and YOLOv8 architectures can classify optic disc images for myopia diagnosis with encouraging performance across accuracy, recall, and F1 score, even in cases of low-to-moderate myopia with an average SER (SD) of −3.30 (3.15) diopters. Nonetheless, these findings should be interpreted cautiously. The differences observed among the model variants and between the two architectures, although present, were relatively small and may partly reflect the limited size and composition of the dataset rather than true performance disparities. Furthermore, given the single-centered and demographically homogeneous nature of the data, it remains uncertain whether these results would hold in broader, more diverse clinical settings.
In the internal validation set, YOLOv11-l offered the best trade-off between recall (93%), accuracy (82%), and F1 score (88%), while maintaining a low inference time and computational cost. In contrast, YOLOv11-m achieved a perfect sensitivity (100%) but very low specificity (23%) and a high number of false positives (FP = 20), making it unsuitable for screening purposes that require a balance between sensitivity and specificity. Within the YOLOv8 family, the nano variant performed well, balancing diagnostic metrics (ACC = 80%, R = 96%, F1 score = 87%) with the processing speed, though at the cost of lower specificity (Sp = 35%) and more false positives (FP = 17). A more balanced compromise was achieved by YOLOv8-m (ACC = 79%, R = 88%, F1 score = 86%, FP = 12), offering good performance with acceptable computational demands.
In the external independent test set, YOLOv11-l stood out with 100% sensitivity, 92% accuracy, an F1 score of 95%, and an MCC of 0.811. Compared to YOLOv11-nano, it had a statistically significant advantage (p < 0.05), confirming its robustness. Meanwhile, YOLOv8-l outperformed YOLOv8-m in specificity (93% vs. 73%), with a higher MCC (0.951) and a statistically significant difference (p = 0.0473) while a maintaining similar AUC and AP. These findings indicate that both model families are viable for clinical applications: YOLOv11-l is better suited for computationally constrained scenarios, while YOLOv8-l is better suited in scenarios where maximum diagnostic precision is required.
A direct comparison between YOLOv11-l and YOLOv8-m revealed a similar performance in accuracy (92%), precision (90%), recall (100%), specificity (73%), and F1 score (95%). However, YOLOv8-m showed a slight advantage in the AUC (0.993 vs. 0.973) and average precision (AP: 0.996 vs. 0.989), suggesting a better discriminative ability. Conversely, YOLOv11-l was more efficient, with fewer parameters (25.3 M vs. 46.0 M) and FLOPs (86.9 B vs. 220.5 B), making it more suitable for low-power hardware or in real-time applications. These results support the use of both architectures in automated myopia screening based on retinal fundus images, particularly when combined with optic disc localization. Statistical tests (bootstrap methods and DeLong’s test) confirmed that differences in the AUC between the top-performing models were not significant (p = 0.375), emphasizing that model choice should depend more on operational constraints—such as hardware availability or the need for real-time inference—than on marginal differences in classification metrics.
YOLOv11 integrates transformer-based components and optimized training strategies, which improve generalization, especially in challenging or imbalanced datasets. Nonetheless, it struggles with small, rotated, or low-resolution objects due to architectural limitations that reduce its representational capacity [
17]. Some overfitting was also observed with limited or homogeneous data, highlighting the need for stronger regularization techniques or more robust data augmentation strategies.
YOLOv8, although mature in real-time object detection, remains demanding in terms of computational resources, limiting its applicability on low-power devices or in resource-limited environments [
37]. Future work should aim at optimizing both architectures, incorporating context-aware training and adaptive methods to handle heterogeneous inputs and operational conditions.
Beyond model limitations, this study has methodological constraints. First, the external validation was conducted on a relatively small test set (50 images), which may not capture the full variability of real-world clinical practice and therefore limits this study’s generalizability. In addition, the dataset used for model development comprised only 338 retinal images collected from a single clinic, with patients belonging to a relatively homogeneous, non-ethnically diverse population. There was a marked difference in the age distribution between the myopic and non-myopic groups, which could have influenced classification performance. In addition, the study design did not allow for the evaluation of different degrees of myopia; instead, the analysis was restricted to a binary classification (myopia vs. non-myopia).
Together, these factors restrict the generalization of our findings. Larger, multi-center studies with more diverse populations are needed before these AI models can be considered for routine clinical use. Future research should also assess their usability by non-expert personnel and, most importantly, confirm their robustness through stronger external validation.
The analysis was performed on fixed-resolution images (640 × 640), without exploring the impact of different resolutions or image qualities. Additionally, although the confusion matrices were identical, the slight differences observed between YOLOv11-l and YOLOv8-l in the AUC and AP suggest latent differences in score calibration, warranting further investigation.
Furthermore, our analysis focused on standard classification metrics without addressing model interpretability, calibration curves, or decision threshold optimization—factors increasingly relevant in clinical decision support systems. Future research should include these aspects and evaluate performance on external, multi-center, and multi-ethnic datasets to assess generalizability across real-world contexts and diverse clinical settings. In terms of architectural improvements, an important next step would be to repeat the experiment and compare the results using more recent versions of the YOLO algorithm beyond YOLOv8 and YOLOv11. Updated versions, such as YOLOv12 or future iterations, promise improvements in accuracy, efficiency, and generalization ability. These newer models are designed to process images faster and with greater precision, potentially enhancing the detection of subtle features—an essential aspect in clinical diagnostics. Furthermore, they typically incorporate advances in network architectures, optimization strategies, and improved handling of small objects or imbalanced datasets, which could address some of the current limitations observed. As computer vision continues to evolve, staying aligned with the latest developments is crucial for maximizing model performance and ensuring clinical applicability.
Future improvements could also involve evaluating model performance across different age groups, as age-related variations in myopia may affect the classification accuracy. Refining SER thresholds—particularly by including more cases near the −0.50 D cutoff and higher hyperopic values—could help the model better distinguish low myopia from hyperopia. Leveraging transfer learning from larger, diverse datasets may also enhance generalization and improve accuracy across broader populations. Finally, the integration of multimodal data—such as OCT images, visual fields, and clinical parameters—could further improve model performance by capturing complementary diagnostic information.
Furthermore, expanding the model’s detection and classification capabilities to include other fundus-visible eye diseases, such as glaucoma [
38,
39], would enhance its clinical value and broaden its applicability in ophthalmology. Training the algorithm with optic disc images from glaucomatous and non-glaucomatous patients may offer a smart and cheaper screening method than conventional OCT analysis. The optic disc, being a key retinal landmark, is readily captured and stored in a digital format, and its analysis can be facilitated by portable fundus cameras or smartphone-based devices [
40,
41]. These tools could benefit from the proposed approach, supporting clinicians with AI-assisted screening and diagnostic capabilities even in resource-limited settings.
In summary, while YOLOv8-l showed the highest overall accuracy, YOLOv11-l was a strong alternative with superior efficiency. Final model selection should therefore be guided by application-specific requirements: YOLOv11-l is ideal where speed and low-resource deployment are critical, whereas YOLOv8-l is preferred when diagnostic precision is the top priority.
In conclusion, this study provides preliminary evidence that YOLOv8 and YOLOv11 models may be able to classify optic disc images for myopia diagnosis, showing a potentially favorable balance between accuracy and efficiency. While YOLOv8-l appeared to perform best overall, YOLOv11-l could represent a promising option in resource-limited settings. However, these observations are based on a relatively small, single-center dataset and should therefore be interpreted with caution. Further research involving larger, more diverse and well-balanced cohorts, as well as thorough evaluations of model calibration, interpretability, and adaptability to real-world clinical workflows, will be essential before considering any practical implementations.
