Abstract
As a critical core component in the STOVL aircrafts, the dynamic and thermal performance of the aviation dry clutch directly determines the reliability of power transmission and the precision control, especially in high relative speed engagement and high power density conditions. Accordingly, this study proposes a 4-DOF dynamic model considering the time-varying of friction coefficient and nonlinear load characteristics, integrated with a transient thermal model incorporating the time-varying thermal parameters. The effects of pressure loading strategies and rotation speed on the dynamic and transient thermal responses are systematically analyzed. Furthermore, a novel temperature uniformity coefficient is developed to characterize the temperature field distribution. The results indicate that the pressure loading strategy fundamentally dictates the trade-off between engagement smoothness and thermal performance. Specifically, compared with other loading strategies, the linear loading strategy yields the most uniform thermal field (, ) and the engagement smoothness () but increases sliding friction work (163.67 kJ). As rotation speed increases from 1500 r/min to 6000 r/min, the sliding friction work increases from 8.85 kJ to 163.67 kJ. Concurrently, the peak values of temperature, axial temperature gradient and axial temperature uniformity coefficient reach 116.557 °C, 80.622 °C and 0.4361, respectively. Consequently, an appropriate reduction in rotation speed combined with the adoption of linear loading strategy can not only facilitate the smoothness and friction loss reduction but also achieve a more uniform temperature distribution. These findings are not only essential for optimizing the thermal management and structural design of aviation dry clutches but also establish a quantitative basis for optimizing engagement strategies.
1. Introduction
Recently, short take-off and vertical landing (STOVL) aircrafts have garnered significant attention in the global aviation industry due to their dual technological advantages as both fixed-wing and rotary-wing aircraft, such as short take-off and landing distances, unique combat capabilities and tactical flexibility [1,2]. As provided in Figure 1, the STOVL propulsion system comprises a cruise engine, a lift fan, a roll nozzle system, a vector nozzle exhaust system and a clutch system [3]. As the core component within STOVL propulsion systems, the dry clutch system is located between the lift fan and the cruise engine. The dry clutch not only ensures stable power transmission but also serves as a critical component for achieving short take-off and vertical landing capabilities of STOVL aircrafts. However, the dry clutch operates in severe operating conditions characterized by high speed (surpassing 5000 r/min) and high power density (requiring approximately 50% of the lift force), which causes particularly pronounced friction heat accumulation [4]. The insufficient heat dissipation can easily cause thermal damage failure, jeopardizing flight safety [5]. Shortening engagement time can mitigate friction heat accumulation but induces torque shock, accelerating transmission system fatigue. These interrelated challenges constitute a critical barrier to achieving higher performance breakthroughs in transmission systems of STOVL aircrafts.
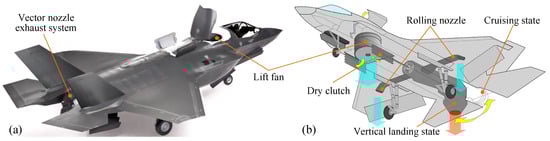
Figure 1.
(a) F-35B STOVL aircraft and (b) STOVL propulsion system [6].
In terms of dry clutch engagement characteristics, extensive theoretical and modeling efforts have been dedicated to performance optimization and dynamic behavior analysis. Liu et al. [7] established a dynamic model considering negative stiffness of the diaphragm spring to explore the torque-saving and power-saving performance. Lin et al. [8] provided a friction torque model for dry clutches, with its validity experimental. Yan et al. [9] formulated dynamic and force models for automotive dry clutches and investigated the dynamic characteristics of dry clutches, while Minas et al. [10] focused on the stability of vibrational behavior during dry clutch engagement. Yu et al. [11] developed a finite element model to analyze the effects of friction coefficient, clamping force and disc deformation on sliding noise. For aviation dry clutches, Zhu et al. [4] established integrated dynamic and thermal models, demonstrating that the variable slope engagement pressure can effectively reduce the engagement time, impact torque and temperature rise. Xiao et al. [12] explored the effects of engagement pressure on the friction work and jerk, and Zhang et al. [13] identified optimal design parameters by analyzing the impacts of engagement force, duration and friction coefficient on torque responses. Song et al. [14] further established a dynamic model for aviation dry clutches, with corresponding simulation torque results, showing a deviation within 10%.
Under adverse operating conditions, the substantial heat generated by frequent slippage in dry clutches can cause temperatures to exceed the 250∼300 °C threshold, which induces a sharp decline in friction coefficient and even catastrophic clutch failure [15,16]. Therefore, numerous scholars have conducted extensive research on the temperature fields of dry clutches using commercial finite element software (e.g., ANSYS 18.0). Abdullah et al. [17,18,19,20] established an axisymmetric finite element temperature model to explore thermo-mechanical coupling problems and study the temperature distribution in a multi-disc dry clutch, revealing that an increase in the sliding speed from 100 rad/s to 300 rad/s elevates the temperature by 17%. Gong et al. [21] explored the thermal bucking characteristics of the automotive dry clutch. The results reveal that the boundary conditions play a significant role in thermal buckling mode. Cakmak and Kilic [22] developed a novel approach to estimate the temperature on the friction surface of a dry clutch, confirming the design parameters exert a significant influence on temperature rise. Wu [23] established a temperature field model to clarify the influence of engagement force on the temperature distribution, while Ali and Asiri [24] established the ANSYS to explore the influence of functionally graded aluminum matrix composite on temperature characteristics of the dry clutches. Chen et al. [25] presented a novel thermal modeling approach combining CFD simulation and decoupling technology, with the corresponding experimental validation indicating a maximum temperature deviation of merely 4.99%.
Notable progress has also been achieved in numerical solution methods for transient temperature field models of dry clutches. Gkinis et al. [26] formulated an analytical thermal partitioning network model for automotive dry clutches to study the heat generation and transfer mechanisms. Majeed et al. [27] employed the finite element technique to study the effect of the sliding speed on the friction heat, capturing key parameters including the friction heat, surface temperature and contact pressure. Topczewska et al. [28] developed an analytical model to explore temperature and thermal stresses distributions of a single disc. Meng and Xi [29] developed a 2D transient thermal model for the friction disc to explore the effects of the different launching conditions on the temperature field and further developed a distributed fiber-optic temperature sensing technology for real-time clutch temperature monitoring. Sherzaa et al. [30] established a dedicated test bench to validate the axisymmetric thermal model and quantify the influence of parameters such as the sliding speed, slipping period and torque period on the clutch performance. Jin et al. [31] developed a 2D transient thermal model under non-uniform pressure conditions using FEM, which reduced the maximum temperature error by 34.03% compared to the uniform pressure model. Doos et al. [32] investigated the relationship between the frictional material and the temperature behaviors to optimize thermal performance of the dry clutch.
A survey of the published literature indicates that commercial software has been extensively employed to explore the dynamic and thermal characteristics of dry friction clutches in automobiles. However, most published literature overlooks the dynamic variations in parameters such as heat flux density, friction coefficient, heat transfer coefficient, nonlinear friction coefficient and load torque. Furthermore, the influence of torsional stiffness, damping and time-varying dynamic characteristics is not considered in the dynamic modeling, resulting in insufficient accuracy of simulation results. Against this backdrop, this work proposes a comprehensive thermal–dynamic model, integrating a dynamic model considering the time-varying characteristics of friction coefficient and lift fan load torque with a thermal model considering the time-varying thermal parameters. Additionally, the effects of pressure loading strategies and rotation speed on the dynamic and transient thermal behavior of dry clutch are explored. Section 2 details the development of the comprehensive thermal–dynamic model. Section 3 presents an analysis of the dynamic and thermal behaviors of friction discs. Section 4 discusses the effects of engagement pressure and rotation speed on the dynamic and transient thermal behaviors. Finally, Section 5 synthesizes the key findings and draws corresponding conclusions.
2. Dynamic and Thermal Models for Dry Friction Clutch
2.1. Principle of Propulsion System for STOVL Aircraft
As shown in the Figure 2, the transmission system of STOVL aircrafts is primarily composed of an engine, a vector nozzle exhaust system, roll nozzles, a dry clutch system and a lift fan. The dry clutch input is mechanically coupled to the low-pressure rotor shaft of the engine via a main drive shaft, while the clutch output drives the lift fan, forming the power transmission chain. This configuration allows for the selective power transmission or interruption between the lift fan and engine by controlling the engagement and disengagement of the clutch. The dry clutch remains disengaged to isolate the lift fan during conventional level flight. Upon vertical command activation, the hydraulically driven clutch actuator exerts axial force on the friction discs, generating the necessary torque to spin the lift fan. Simultaneously, the vector exhaust nozzle deflects downward, working in synergy with the lift fan to produce vertical thrust. Consequently, the operational stability and control precision of the STOVL aircraft during these critical phases rely heavily on the comprehensive performance of the dry friction clutch.
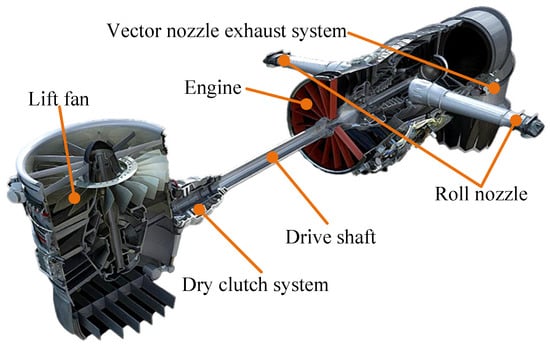
Figure 2.
Schematic diagram of propulsion system for STOVL aircraft.
2.2. Dynamic Model of Driveline with Dry Clutch
Figure 3 illustrates the simplified schematic where the propulsion system is bifurcated into driving and load ends relative to the clutch interface. The powertrain is reduced to a series of lumped inertia elements coupled via stiffness and damping coefficients [33]. Based on this simplification and lumped parameter approach, a 4-DOF mathematical model is formulated in this study to analyze the dynamic response and thermal characteristics during the clutch engagement phase.
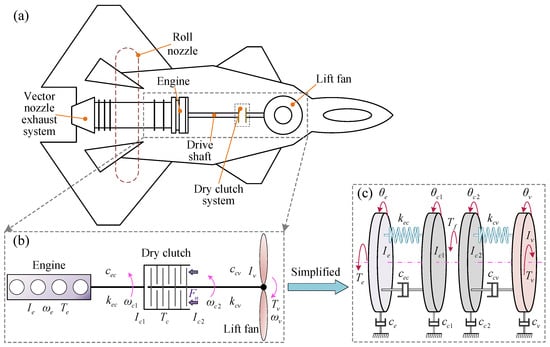
Figure 3.
(a) Overall configuration of STOVL aircraft. (b) Schematic diagram of transmission system with dry clutch. (c) 4-DOF dynamic model of dry clutch system.
The clutch operation cycle involves transitions between separated phase, sliding phase and engaged phase. During the sliding phase, the dynamic characteristics of the clutch are described by a 4-DOF dynamic model, while the engaged phase introduces a kinematic constraint that synchronizes the driving and driven shaft speeds, effectively reducing the system by one degree of freedom. Considering the torsional stiffness and damping of connecting shafts, the dynamic equations for the 4-DOF model are derived as follows:
where , , and represent the inertia of engine, the inertia of clutch driving discs, the inertia of clutch driven discs and the inertia of lift fan, respectively; and are the torsional stiffness of the driving shaft and the driven shaft, respectively; , , and are damping coefficients; and represent the equivalent damping of the driving shaft and the driven shaft, respectively; , and are the engine torque, the friction torque transmitted by the clutch and the load torque of lift fan, respectively.
In the engaged phase, the driving and the driven discs of clutch are locked together and begin rotating at the same speed. This dynamic constraint implies that . Therefore, the mathematical model for the clutch engaged state can be expressed by the following Equation (2).
where , .
When the clutch operates in a sliding state, a relative speed exists between the driving and driven discs. In this case, the friction torque generated by the clutch is the sliding friction torque. Following the principles of friction transmission, the expression of clutch friction torque is
where N and are the number of friction pairs and exerted pressure on the friction pair; and represent inner radius and outer radius; is the friction coefficient.
To accurately simulate the torque transmitted by clutches under the uniform pressure and uniform wear assumptions, it is essential to develop a comprehensive friction model, presented in Equation (4) [12].
where and are the Coulomb and static friction coefficient, respectively; is relative speed between driven and driving discs; and are constants of the Stribeck friction model.
The friction torque transmitted by the dry clutch can be expressed by
where is the clutch torque capacity and can be calculated by ; is engagement force; .
2.3. Dynamic Model of Lift Fan
In this study, the inertia of the lift fan rotor system is calibrated to 0.61 kg·m2. Through bench testing of the lift fan performance, load torque-speed characteristic data across a wide speed range are obtained. Interpolation fitting methods are employed to process the discrete test data, ultimately establishing a mathematical model between the load torque and the rotation speed of the lift fan, as shown in Equation (6).
2.4. Evaluation Index for Engagement Phase
In the clutch engagement phase, the transmission of power and torque from the input shaft to the output shaft is inherently unstable, frequently inducing speed oscillations and significant jerk. These transient disturbances not only compromise engagement smoothness but also shorten the service life of the clutch. Consequently, the rate of change in angle acceleration with respect to time can be physically defined as a key metric for evaluating the engagement smoothness of dry clutches, which can be expressed as follows:
The sliding friction work is regarded as a critical indicator for evaluating clutch temperature rise and wear severity. Generally, an increase in accumulated friction work during engagement directly correlates with intensified material degradation. The magnitude of friction work in a dry clutch is a function of friction torque, sliding duration and the relative speed between the driving discs and driven discs. The mathematical expression of the sliding friction work is provided in Equation (8).
where and represent initiation time and complete time in clutch engagement, respectively.
2.5. Thermal Model of Dry Friction Clutch and Solution Method
The combination of high relative speeds and engagement pressure during clutch operation produces sliding work that manifests as a severe temperature rise. This sliding work converts kinetic energy into thermal energy, which applies a heat flux density to the friction contact surfaces. The majority of thermal energy distributed across the friction disc surfaces is conducted into the internal components. A portion of the heat generated during sliding phase is dissipated by convection airflow, constituting a convective heat transfer process. A negligible fraction of thermal energy is transferred to surrounding components via thermal radiation, and this radiation process is neglected in the thermal model.
Assuming that the friction material parameters and thermal parameters remain constant regardless of temperature fluctuations, the transient thermal equation for aviation dry clutch is established and presented in Equation (9) [34].
where , and c represent the density, the thermal conductivity and the heat capacity, respectively; is the thickness of the friction disc.
Given that both the mechanical structure of dry clutches and the applied thermal boundary conditions are axisymmetric, a 2D transient thermal model for the friction disc is presented in Figure 4.
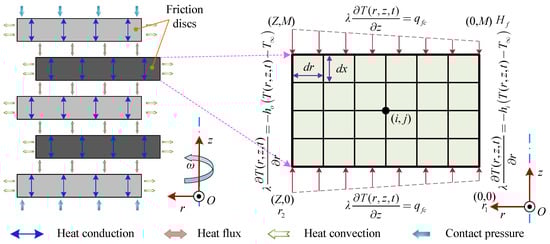
Figure 4.
2D transient thermal physical model for the friction disc in aviation dry clutch.
2.5.1. Heat Flux Density
In dry clutch engagement phase, the combination of the excessive relative speed and engagement pressure generates substantial sliding friction work. This mechanical energy is converted into thermal energy, which manifests as a heat flux density applied to the friction surfaces. Therefore, the sliding friction work is governed by both the relative speed and the exerted pressure. To accurately quantify this process, a differential element model of friction heat generation is developed in Figure 5.
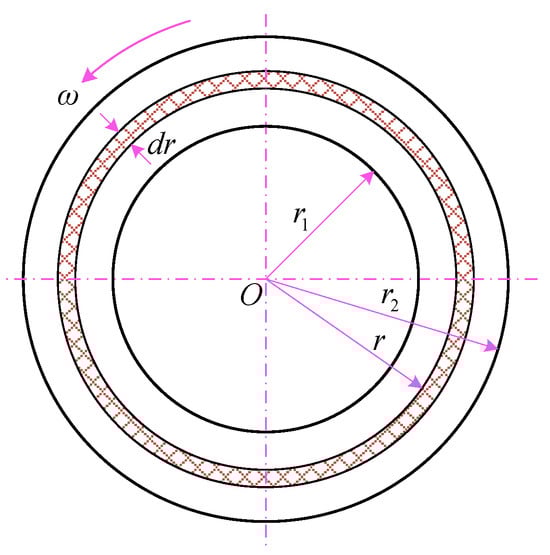
Figure 5.
Differential element model of friction heat generation in friction pair interface.
Under the assumption of uniform contact pressure, the sliding friction power varies as a function of the radius. As shown in Figure 5, the differential element of sliding friction power generated by the combined effects of relative speed and exerted pressure is expressed as
Assuming all sliding friction work is converted into heat flux density, the heat flux density of the differential element is mathematically described in Equation (11).
In the clutch engagement phase, the friction heat generated by a friction pair during engagement is expressed as
2.5.2. Convective Heat Transfer Coefficient
The heat dissipation occurs via convection between the rapidly rotating discs and the ambient air. The corresponding convective heat transfer coefficient between the rotating friction disc and the air is mathematically expressed as follows:
where is air thermal conductivity; r represents radius at heat exchange location; represents Reynolds number, which is a function of rotation speed of the friction disc. The mathematical expression is presented in Equation (14).
where and represent the rotation speed of the friction disc and air viscosity, respectively.
2.5.3. Initial and Boundary Conditions
The contribution of thermal radiation to the temperature field is considered insignificant. Consequently, the analysis focuses exclusively on heat conduction and convection within the friction discs. Furthermore, by exploiting the inherent symmetry in both the clutch geometry and boundary conditions, the simulation domain is reduced to half of the friction disc to optimize calculation efficiency. The environment and initial temperature is . Therefore, the proposed thermal model is subject to the following boundary and initial conditions.
2.5.4. Solution Method for Transient Thermal Model
Figure 4 illustrates the mesh generation applied to the solution zone () employing grid intervals of of , and . Based on this discretization scheme, the governing equation described in Equation (9) of the transient thermal model for friction discs is reformulated into the discrete equation provided in Equation (16) [35]:
Consequently, the explicit formulation of the transient heat transfer equation for aviation dry clutch is obtained as follows:
To ensure the convergence of the solution, the required stability condition is defined in Equation (18).
3. Simulation for Dynamic and Transient Thermal Models
3.1. Model Parameters and Solution Method
MATLAB 2022b is employed to calculate the 4-DOF dynamic model and the transient thermal model for aviation dry clutches. Firstly, the proposed dynamic model presented in Equation (1) is solved by initially employing the initial state or the results calculated from the prior time step to derive the rotation speed of the driving and driven discs. Secondly, the relative speed of the driving and driven discs is calculated to determine the dry clutch engagement status. Upon detection of synchronization, the clutch gravening equation switches from Equation (1) to Equation (2) for solution. Otherwise, Equation (1) remains active. To solve the transient thermal model, a grid independence study is first performed, confirming 61 and 401 nodes in the axial and radial directions of the friction disc, respectively. The solution procedure commenced with the establishment of the initial temperature field of the friction disc, followed by the derivation of heat flux density and convective heat transfer coefficients based on the kinetic simulation results. The boundary conditions and heat transfer equations are then employed to calculate the transient temperatures at the mesh nodes. Finally, the aforementioned simulation steps are cycled until the termination requirements are satisfied. The key simulation parameters are listed in Table 1.

Table 1.
Simulation Parameters for Aviation Clutch Engagement Dynamic and Thermal Analysis.
The spatial distribution of temperature significantly influences the operational reliability of the dry clutch system. To rigorously evaluate this characteristic, a uniformity coefficient of temperature distribution is developed in this study to assess the thermal distribution of the friction disc. Its mathematical definition is presented in Equation (19). The temperature distribution uniformity coefficient is positively correlated with the distribution characteristics of the temperature field.
3.2. Dynamic and Temperature Response
The dynamic response behaviors of the aviation dry clutch throughout a single engagement cycle are presented in Figure 6. For this simulation, the engine output is configured at 600 kW and 6000 r/min, while the engagement pressure follows a sigmoidal loading strategy described by MPa.
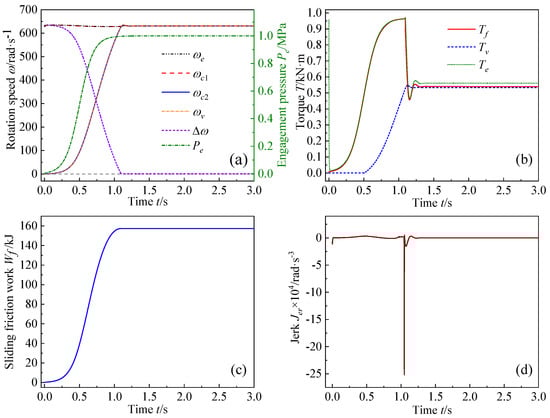
Figure 6.
The response curves of (a) Rotation speed and engagement pressure. (b) Torque. (c) Sliding friction work. (d) Jerk.
In Figure 6a, the engagement pressure increases from 0 to 1 MPa, driving the rotation speeds of the driven disc and lift fan to gradually accelerate toward the input rotation speed. The eventual convergence of relative speed to zero marks the completion of the clutch engagement process. Figure 6a,b present the core dynamic characteristics of the clutch engagement process: the response time to the clutch engagement control signal is measured as 0.314 s, the complete engagement time is 1.049 s, the initial starting torque of the clutch is 10.68 N·m, and the peak torque required to accelerate the lift fan is 939.99 N·m. Specifically, this peak torque consists of approximately 526.45 N·m, required to overcome the resistance torque of the lift fan, and approximately 413.54 N·m, required to accelerate the high-inertia rotor system. These substantial torque values highlight the significant starting overload condition inherent to high-speed engagement, necessitating a careful trade-off consideration regarding the engagement time (1.049 s) to balance the jerk and friction heat accumulation. In Figure 6b,c, as the clutch transitions from the sliding phase to the synchronized phase, the torque transmitted by the clutch initially increases gradually with the engagement pressure until synchronization, after which it stabilizes to match the load torque. Consequently, the cumulative sliding friction work reaches a plateau of 156.05 kJ. The absence of relative rotation speed prevents further sliding friction work generation. Additionally, Figure 6d identifies a maximum jerk of , occurring at 1.049 s.
Figure 7 depicts the spatiotemporal evolution of the temperature field of the friction disc across six time points during the dry clutch engagement. In the sliding phase (0∼1.094 s), the temperature rises rapidly, with the peak value increasing from approximately 30 °C at 0 to over 132.999 °C by 0.789 s. Notably, the high-temperature zones are localized near the outer radius (), a phenomenon driven by the elevated frictional heat generation associated with higher linear velocities at the periphery. Following the lock-up event (1.094 s∼3.0 s), the friction disc enters a dissipation phase. During this period, the peak temperature declines to 70 °C at 2 s and stabilizes near 60 °C at 3 s. The dissipation phase is characterized by the homogenization of radial and axial temperature gradients as heat conducts away from the friction interface.
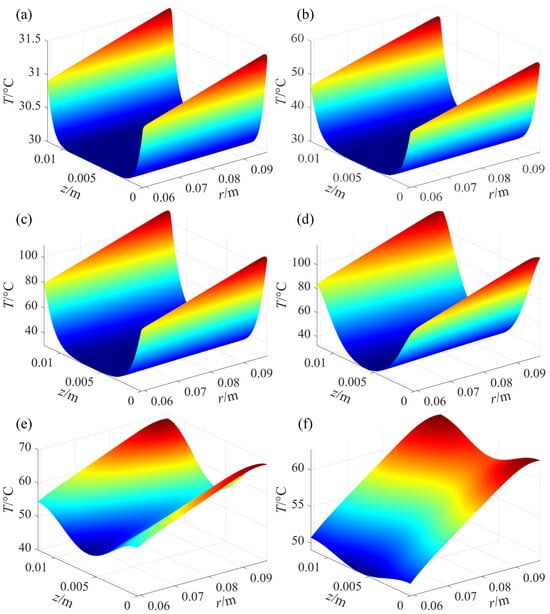
Figure 7.
The temperature field distribution for friction disc at (a) 0.1 s. (b) 0.4 s. (c) 0.6 s. (d) 1.0 s. (e) 2.0 s. (f) 3.0 s.
Figure 8 presents the spatiotemporal temperature response behaviors along both the axial and radial directions under high-speed engagement conditions. Initially, the temperature rises sharply during the sliding phase (0∼1.094 s), peaking at approximately 132.999 °C before gradually declining. The friction interface experiences higher temperatures compared to the internal material, with the axial distribution exhibiting symmetry around the midplane (). Radially, the thermal load is most intense at the outer edge, with a peak temperature reaching 132.999 °C, while the temperature at inner radius remains comparatively cooler. This radial temperature disparity is a direct consequence of higher linear velocities at larger radii, which induce greater friction heat generation. The temporal response demonstrates that the temperature rise occurs synchronously with the sliding engagement phase, while the subsequent cooling phase reflects the combined effects of heat conduction, convection and the cessation of friction heat input after lock-up.
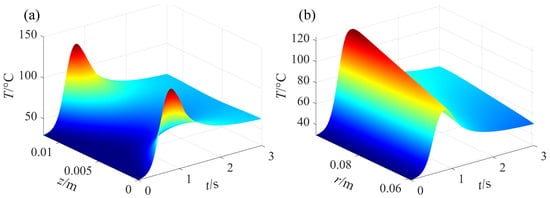
Figure 8.
The spatiotemporal temperature response characteristics for a single shifting operation of (a) node (398, :) and (b) node (:, 60) for a rotation speed of 6000 rpm.
Figure 9 quantifies the spatiotemporal evolution of thermal gradients and uniformity across the friction disc during a single clutch engagement event, offering critical insights into thermal balance and durability of the friction disc under high-speed operating conditions. The analysis reveals substantial thermal inhomogeneity. Specifically, the maximum axial temperature gradient reaches 99.787 °C at 0.779 s, which is significantly higher than the maximum radial temperature gradient of 35.879 °C occurring at 0.816 s. Regarding distribution metrics, the maximum radial uniformity coefficient peaks at 0.5351 (0.737 s), while the axial uniformity coefficient reaches a maximum of 0.4854 (0.753 s). The results reveal that axial thermal inhomogeneity is more pronounced, with both uniformity metrics evolving in correlation with the magnitude of the temperature gradients.
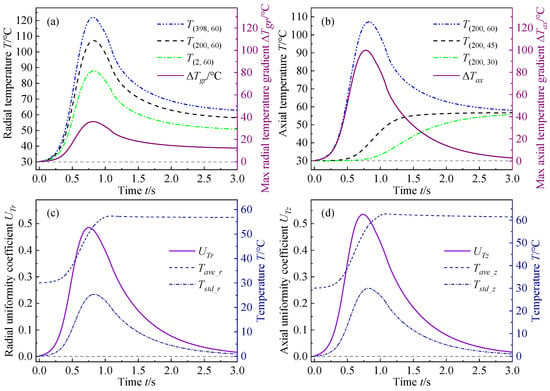
Figure 9.
The response curves of (a) Temperature and max temperature gradient along radial direction. (b) Temperature and max temperature gradient along axial direction. (c) Temperature uniformity coefficient along radial direction. (d) Temperature uniformity coefficient along axial direction.
4. Results Analysis
4.1. Effect of Pressure Loading Strategies
To investigate the influence of engagement pressure loading strategies on system dynamic response and thermal field evolution, four distinct pressure loading trajectories are formulated as time-dependent functions and defined as follows:
The response curves of engagement pressure, rotation speed, sliding friction work and jerk under different engagement pressure loading strategies are presented in Figure 10, and corresponding quantitative performance metrics are summarized in Table 2. The four pressure loading strategies demonstrate distinct loading rates, the exponential loading strategy () reaches full pressure most rapidly followed by the sigmoidal loading strategy (), the linear loading strategy () and the quartic loading strategy (). These loading strategy hierarchies significantly influence the dynamic response of the dry clutch system. Specifically, the rapid pressurization of exponential loading strategy () and sigmoidal loading strategy () enables the quickest acceleration to the target speed of 6000 rpm. Conversely, the quartic loading strategy () shows the most delayed response. In terms of friction work accumulation, the exponential loading strategy () minimizes sliding duration, thereby yielding the lowest total friction work (155.94 kJ). In contrast, the protracted loading of the linear loading strategy () results in the highest energy dissipation (163.67 kJ), while the sigmoidal loading strategy () and the quartic loading strategy () fall within an intermediate range (156 kJ). However, the jerk response further reveals a trade-off in mechanical smoothness. The quartic loading strategy () induces the most aggressive jerk (), whereas the linear loading strategy () delivers the smoothest engagement ().
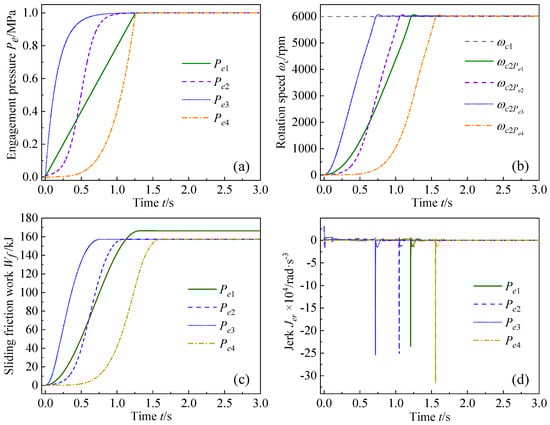
Figure 10.
The response curves of (a) Engagement pressure. (b) Rotation speed. (c) Sliding friction work. (d) Jerk under different engagement pressure loading strategies.
Table 2.
Temporal and magnitude comparisons of dynamic and thermal response metrics for various engagement pressure loading strategies.
Figure 11 and Table 2 collectively reveal that the pressure loading rate fundamentally dictates the thermal field evolution. The exponential loading strategy () generates the earliest highest and peak temperature (135.692 °C at 0.436 s). Furthermore, it exhibits the highest radial and axial uniformity coefficient (, ), indicative of severe thermal inhomogeneity caused by rapid, localized heat flux. In contrast, the linear loading strategy () yields the lowest peak temperature (116.557 °C) and the most uniform temperature distribution. This is attributed to the gradual pressure rise that allows time for heat redistribution, which facilitates effective heat conduction despite the higher total friction work (163.67 kJ). The sigmoidal loading strategy () and quartic loading strategy () demonstrate intermediate thermal performance. Specifically, the sigmoidal loading strategy () balances moderate thermal gradients with reduced jerk, while the quartic loading strategy () delays thermal peak occurrence (1.331 s) but induces the most aggressive jerk (). These results reveal a direct coupling between pressure loading rate and thermal field evolution, highlighting that rapid pressure rise minimizes friction work but exacerbates thermal inhomogeneity, whereas slower, linear loading reduces thermal imbalance at the cost of increased sliding friction work.
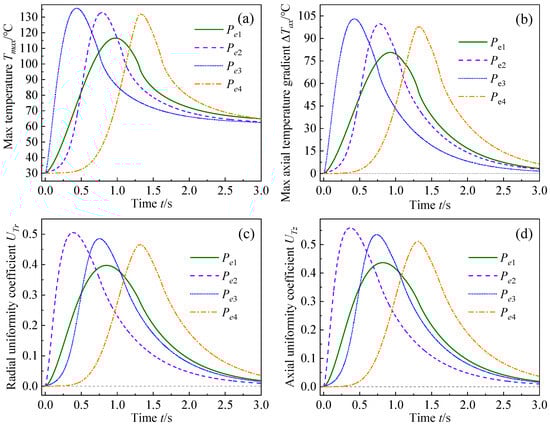
Figure 11.
Dynamic thermal response curves of (a) Maximum temperature. (b) Maximum axial temperature gradient. (c) Radial uniformity coefficient. (d) Axial uniformity coefficient under different engagement pressure loading strategies.
4.2. Effect of Rotation Speeds
To investigate the influence of rotation speed on the dynamic and transient thermal behaviors of the clutch during engagement, this section examines the response of sliding friction work and jerk under linear pressure loading across rotation speeds ranging from 1500 r/min to 6000 r/min. The corresponding results are presented in Figure 12 and Figure 13 and Table 3.
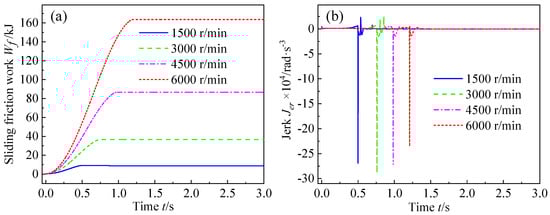
Figure 12.
The response curves of (a) Sliding friction work. (b) Jerk under linear loading strategy across different rotation speeds.
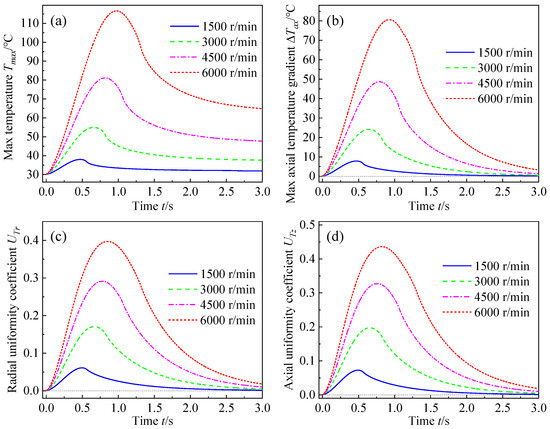
Figure 13.
Dynamic thermal response curves of (a) Maximum temperature. (b) Maximum axial temperature gradient. (c) Radial uniformity coefficient. (d) Axial uniformity coefficient under different rotation speeds.
Table 3.
Temporal and magnitude comparisons of dynamic and thermal response metrics at various rotation speeds.
Figure 12a reveals that increasing rotation speed significantly amplifies sliding friction work, the sliding friction work scales from 8.85 kJ at 1500 r/min to 163.67 kJ at 6000 r/min. This increase stems from the higher relative velocities at the interface, which extend the sliding duration required for synchronization. Figure 12b demonstrates that the peak jerk magnitude increases to () at 3000 r/min. Additionally, the timing of the jerk peak is delayed at higher speeds, occurring at 1.21 s for 6000 r/min versus 0.501 s for 1500 r/min. This delay reflects the longer time required to reach full engagement at higher rotational velocities, which, in turn, affects the rate of change in angular acceleration.
Figure 13 and Table 3 collectively demonstrate that rotation speed exerts a profound influence on both the dynamic and transient thermal behavior of the clutch during linear engagement. As rotation speed increases from 1500 r/min to 6000 r/min, the drastic rise in sliding friction work (up to 163.67 kJ) precipitates a major temperature excursion, quadrupling the peak temperature from 37.889 °C to 116.557 °C. The temperature peak is also shifted temporally (from 0.473 s to 0.977 s) due to the extended heat input duration. Concurrently, both the maximum axial temperature gradient and uniformity coefficients increase with rotation speed. Specifically, the axial uniformity coefficient peaks from 0.0722 to 0.4361, accompanied by an axial gradient from 80.622 °C. The results suggest that an increase in rotation speed increasingly pronounces thermal field non-uniformity, manifested as significant thermal imbalance resulting from rapid heat flux accumulation under high-speed operating conditions.
5. Conclusions
A 4-DOF dynamic model that integrates the time-varying characteristics of friction coefficient and lift fan load torque, alongside a transient thermal model considering the time-varying thermal parameters, is proposed in this study. The effects of engagement pressure curves and rotation speed on the dynamic and transient thermal responses are examined systematically. The corresponding core research findings are briefly summarized as follows:
- (1)
- The engagement pressure load strategies serve as a critical control variable balancing mechanical and thermal performance. The linear loading strategy () is identified as optimal for enhancing engagement smoothness and thermal uniformity, exhibiting the lowest peak jerk ( ) and superior uniform thermal field (). Conversely, the sigmoidal or exponential loading strategies (, ) effectively reduce sliding friction work (approximately 156 kJ) and shorten the engagement time but increase the cost of inducing significant thermal gradients and elevated jerk (). The quartic loading strategy () results in the most aggressive jerk response (), deeming it less suitable for applications requiring high precision control.
- (2)
- The rotation speed is found to have a non-linear and profound impact on thermal loads. An increase in rotation speed from 1500 r/min to 6000 r/min leads to a drastic escalation in sliding friction work from 8.85 kJ to 163.67 kJ. Concurrently, the maximum temperature surges from 37.9 °C to 116.6 °C, accompanied by a severe increase in the maximum axial temperature gradient to 80.6 °C. This thermal intensification at higher speeds also manifested in degraded thermal uniformity, highlighting the outer radius of the friction disc as a critical zone susceptible to thermal fatigue and wear.
- (3)
- The study effectively quantified the correlation between dynamic engagement parameters and spatiotemporal thermal distributions. The introduction of the temperature uniformity coefficient provided a novel metric for assessing thermal stress distribution, revealing that rapid engagement strategies tend to localize heat generation, thereby exacerbating thermal stress concentrations.
These findings are not only essential for optimizing the thermal management and structural design of dry clutches under high-performance operating conditions but also establish a quantitative basis for optimizing engagement strategies to balance conflicting performance objectives, from minimizing sliding friction work to mitigating jerk. The presented study aims to enhance transmission reliability and control precision during the STOVL aircraft operations.
Author Contributions
Conceptualization, X.L. and D.W.; methodology, C.Z.; software, X.L.; validation, C.Z., X.L., D.W. and M.P.; formal analysis, X.L.; investigation, X.L.; resources, H.Y. and Y.X.; data curation, M.P. and Y.X.; writing—original draft preparation, X.L.; writing—review and editing, X.L. and D.W.; visualization, M.P.; supervision, H.Y.; project administration, H.Y. and Y.X. Authors X.L. and C.Z. contributed equally to this work. All authors have read and agreed to the published version of the manuscript.
Funding
This research received no external funding.
Institutional Review Board Statement
Not applicable.
Informed Consent Statement
Not applicable.
Data Availability Statement
The raw data supporting the conclusions of this article will be made available by the authors on request.
Acknowledgments
The authors acknowledge facility resources and support provided by the State Key Laboratory of Precision Manufacturing for Extreme Service Performance, Central South University.
Conflicts of Interest
Author Yexin Xiao was employed by the company AECC Hunan Aviation Powerplant Research Institute. The remaining authors declare that the research was conducted in the absence of any commercial or financial relationships that could be construed as a potential conflict of interest.
References
- Zhou, Y.M.; Zhao, H.R.; Liu, Y.L. An evaluative review of the VTOL technologies for unmanned and manned aerial vehicles. Comput. Commun. 2020, 149, 356–369. [Google Scholar] [CrossRef]
- Qiu, Y.M.; Li, Y.; Lang, J.X.; Wang, Z. Dynamics analysis and control of coaxial high-speed helicopter in transition flight. Aerosp. Sci. Technol. 2023, 137, 108278. [Google Scholar] [CrossRef]
- Xu, S.G.; Li, M.Y.; Wang, X.C.; Song, Y.T.; Tang, B.B.; Zhang, L.H.; Yin, S.; Tan, J.F. Numerical Validation of a Multi-Dimensional Similarity Law for Scaled STOVL Aircraft Models. Aerospace 2025, 12, 908. [Google Scholar] [CrossRef]
- Zhu, C.; Chen, Z.; Shi, Z.C.; Zhang, Y.D. Study on the Engagement Characteristics and Control Strategy of High Speed Difference Dry Friction Clutch. Machines 2023, 11, 407. [Google Scholar] [CrossRef]
- Della Gatta, A.; Iannelli, L.; Pisaturo, M.; Senatore, A.; Vasca, F. A survey on modeling and engagement control for automotive dry clutch. Mechatronics 2018, 55, 63–75. [Google Scholar] [CrossRef]
- Bevilaqua, P.M. Joint Strike Fighter Dual-Cycle Propulsion System. J. Propuls. Power 2005, 21, 778–783. [Google Scholar] [CrossRef]
- Liu, F.Y.; Chen, L.; Fang, C.L.; Yin, C.L.; Zhang, X. Modeling and experimental validation of lever-based electromechanical actuator for dry clutches. Adv. Mech. Eng. 2017, 9, 1687814017715196. [Google Scholar] [CrossRef]
- Lin, X.H.; Xi, J.Q.; Hao, S.Q. The calculation model of the friction torque on a dry clutch. Proc. Inst. Mech. Eng. Part D-J. Automob. Eng. 2017, 231, 1796–1805. [Google Scholar] [CrossRef]
- Yan, Z.F.; Yan, F.W.; Liang, J.J.; Duan, Y.L. Detailed Modeling and Experimental Assessments of Automotive Dry Clutch Engagement. IEEE Access 2019, 7, 59100–59113. [Google Scholar] [CrossRef]
- Minas, I.; Morris, N.; Theodossiades, S.; O’Mahony, M.; Voveris, A. Automotive dry clutch fully coupled transient tribodynamics. Nonlinear Dyn. 2021, 105, 1213–1235. [Google Scholar] [CrossRef]
- Yu, J.L.; Xiang, Z.L.; Zhang, D.F.; Gong, Y.B. Modeling and Experimental Study for Automotive Dry Clutch Sliding Noise. CMES-Comput. Model. Eng. Sci. 2022, 131, 1653–1667. [Google Scholar] [CrossRef]
- Xiao, Y.Y.; Li, Q.M.; Liu, H.S. The Optimization and Control of the Engagement Pressure for a Helicopter Dry Clutch. Machines 2024, 12, 533. [Google Scholar] [CrossRef]
- Zhang, X.; Fan, X.L.; Du, T.C.; Yuan, S.H. Multi-objective optimization of aviation dry friction clutch based on neural network and genetic algorithm. Forsch. Im Ingenieurwesen-Eng. Res. 2025, 89, 66. [Google Scholar] [CrossRef]
- Song, Z.H.; Chen, Y.D.; Chen, Z.; Yang, X.Y.; Jiang, Z.Y.; Zhou, Y.F.; Zhang, G.J. Study on the dynamic and thermal field characteristics of the engagement process of high-power density and high speed difference dry friction clutch. Appl. Therm. Eng. 2026, 288, 129547. [Google Scholar] [CrossRef]
- Al-Zubaidi, S.; Senatore, A.; Abdullah, O.I.; Scuotto, N. Effect of Sliding Speed on the Thermal Fields and Frictional Behaviours of Asbestos-free Frictional Materials Used for Dry Clutch System. IOP Conf. Ser. Mater. Sci. Eng. 2020, 881, 012086. [Google Scholar] [CrossRef]
- Wang, H.L.; Wang, B.J.; Pi, D.W.; Wang, E.L.; Wang, X. Two-Layer Structure Control of an Automatic Mechanical Transmission Clutch During Hill Start for Heavy-Duty Vehicles. IEEE Access 2020, 8, 49617–49628. [Google Scholar] [CrossRef]
- Abdullah, O.I.; Schlattmann, J.; Senatore, A.; Al-Shabibi, A.M. Investigation of thermoelastic problem of multiple-disc friction clutches applying different thermal loads. Heat Mass Transf. 2018, 54, 3461–3471. [Google Scholar] [CrossRef]
- Sherza Janan, S.; Hussain, I.Y.; Abdullah, O.I. Finite Element Simulation of Thermal Behavior of Dry Friction Clutch System during the Slipping Period. J. Mech. Contin. Math. Sci. 2019, 14, 41–58. [Google Scholar] [CrossRef]
- Jabbar, N.A.; Hussain, I.Y.; Abdullah, O.I.; Mohammed, M.N. Finite element analysis of the thermal and thermo-mechanical coupling problems in the dry friction clutches using functionally graded material. Curved Layer. Struct. 2024, 11, 20240001. [Google Scholar] [CrossRef]
- Sabri, L.A.; Topczewska, K.; Jweeg, M.J.; Abdullah, O.I.; Abed Azher, M. Analytical and Numerical Solutions for the Thermal Problem in a Friction Clutch System. Computation 2021, 9, 122. [Google Scholar] [CrossRef]
- Gong, Y.B.; Ge, W.C.; Yi, Y.B. Finite element analysis of thermal buckling characteristics of automotive 430 dry clutch pressure plate. Int. J. Veh. Des. 2018, 78, 108–130. [Google Scholar] [CrossRef]
- Cakmak, T.; Kilic, M. Estimation of friction surface temperature of a dry clutch. Int. J. Heavy Veh. Syst. 2020, 27, 683–702. [Google Scholar] [CrossRef]
- Wu, B. Numerical Investigation of the Transient Temperature Field of a dry Clutch Based on Starting Conditions. J. Appl. Mech. Tech. Phys. 2021, 62, 283–291. [Google Scholar] [CrossRef]
- Ali, I.A.; Asiri, S. Thermal and mechanical analyses of dry clutch disk made of functionally graded aluminum matrix composite. Mater. Res. Express 2022, 9, 046507. [Google Scholar] [CrossRef]
- Chen, J.; Yu, J.L.; Gong, Y.B. A New Multi-Physics Coupled Method for the Temperature Field of Dry Clutch Assembly. Appl. Sci. 2023, 13, 11165. [Google Scholar] [CrossRef]
- Gkinis, T.; Rahmani, R.; Rahnejat, H.; O’Mahony, M. Heat generation and transfer in automotive dry clutch engagement. J. Zhejiang Univ.-Sci. A 2018, 19, 175–188. [Google Scholar] [CrossRef]
- Majeed, M.H.; Kadhim, D.E.; Abdullah, O.I.; Schlattmann, J. Numerical analysis of thermal problem in dry friction clutches based on the interactive design approach. Int. J. Interact. Des. Manuf. 2020, 14, 1091–1101. [Google Scholar] [CrossRef]
- Topczewska, K.; Schlattmann, J.; Abdullah, O.I. Temperature and Thermal Stresses Distributions in a Dry Friction Clutch. J. Theor. Appl. Mech. 2020, 58, 351–360. [Google Scholar] [CrossRef]
- Meng, F.; Xi, J.Q. Numerical and Experimental Investigation of Temperature Distribution for Dry Clutches. Machines 2021, 9, 185. [Google Scholar] [CrossRef]
- Sherza Janan, S.; Hussain, I.Y.; Abdullah, O.I. Experimental investigation of transient thermal characteristics of a dry friction clutch using alternative friction materials under different operating conditions. Heat Transf. 2022, 51, 3920–3950. [Google Scholar] [CrossRef]
- Jin, Y.C.; Chen, L.; Cheng, C. Thermal behavior of friction discs in dry clutches based on a non-uniform pressure model. Case Stud. Therm. Eng. 2022, 32, 101895. [Google Scholar] [CrossRef]
- Doos, Q.M.; Hussain, I.Y.; Al-Sahb, W.A.; Abdullah, O.I.; Al-Tamimi, A.N.J. Frictional material selection of dry clutch disc based on the weighted factor and finite element methods. Heat Transf. 2023, 52, 2838–2858. [Google Scholar] [CrossRef]
- Wang, D.Y.; Hu, M.H.; Li, B.G.; Qin, D.T.; Sun, D.Y. Study on the Influence Factors Upon the Propensity to Stick-Slip Phenomenon During Vehicle Start-Up Process. IEEE Access 2020, 8, 12343–12353. [Google Scholar] [CrossRef]
- Li, X.K.; Wei, D.H.; Wang, H.; Yan, Y.X.; Yan, H.Z.; Yin, M.; Xiao, Y.X. Investigation on the Effects of Operating Parameters on the Transient Thermal Behavior of the Wet Clutch in Helicopters. Appl. Sci. 2025, 15, 10412. [Google Scholar] [CrossRef]
- Li, X.K.; Wei, D.H.; Yan, Y.X.; Yan, H.Z.; Yin, M.; Xiao, Y.X. Study on Transient Thermal Characteristics of Aviation Wet Clutches with Conical Separate Discs for Helicopters in Successive Shifting. Lubricants 2026, 14, 10. [Google Scholar] [CrossRef]


Disclaimer/Publisher’s Note: The statements, opinions and data contained in all publications are solely those of the individual author(s) and contributor(s) and not of MDPI and/or the editor(s). MDPI and/or the editor(s) disclaim responsibility for any injury to people or property resulting from any ideas, methods, instructions or products referred to in the content. |
© 2026 by the authors. Licensee MDPI, Basel, Switzerland. This article is an open access article distributed under the terms and conditions of the Creative Commons Attribution (CC BY) license.