Abstract
This paper investigates an algorithmic redesign tailored to cost minimization with degradation awareness EV charging under an uncertainty framework for coordinated grid-to-vehicle (G2V) and vehicle-to-grid (V2G) scheduling. An improved variant of the Polar Lights Optimizer (IPLO) is developed through the integration of Random Walk Exploitation (RWE) to enhance local refinement and Periodic Random Parameter Tuning (PRPT) to improve adaptability under uncertainty. In addition, an adaptive control mechanism is incorporated to adjust charging and discharging actions based on battery capacity degradation and dynamic electricity price signals. The presented framework is evaluated through simulation-based case studies and compared with several recent metaheuristic algorithms. The results demonstrate cost reductions of up to 25.42% over the original PLO and 80.78% relative to a non-optimized baseline, faster convergence, and improved robustness to price uncertainty, while mitigating adverse battery degradation effects. A statistical analysis over multiple independent runs confirms the reliability and consistency of the presented approach, highlighting its suitability for smart EV charging optimization in dynamic operating environments.
1. Introduction
1.1. Literature Review
The rapid adoption of electric vehicles (EVs) has transformed the transportation sector and significantly increased the complexity of charging operations, creating an urgent need for efficient and cost-effective charging strategies capable of handling fluctuating electricity prices and battery degradation. Smart charging strategies that incorporate battery degradation and uncertainty in demand and electricity prices can significantly reduce both expected energy costs and degradation compared to uncontrolled charging frameworks [1]. The integration of V2G technology, which enables EVs to discharge stored energy back to the grid, introduces new opportunities to reduce operational costs, enhance energy efficiency, and support grid flexibility. Realizing these benefits requires a smart and coordinated scheduling strategy between G2V and V2G operations.
However, achieving effective coordination remains challenging due to the nonlinear, multimodal, and high-dimensional nature of EV charging optimization, particularly under uncertainty. Traditional optimization techniques have been applied to this problem but often suffer from limited scalability and premature convergence. Metaheuristic algorithms offer greater flexibility and search capability; nevertheless, many existing approaches lack sufficient robustness and adaptability when exposed to dynamic electricity prices and evolving battery conditions. To address these challenges, this study investigates an IPLO which integrates RWE and PRPT to enhance convergence behavior, adaptability, and robustness. The presented approach aims to reduce charging costs while preserving battery health under dynamic operating conditions.
1.2. Related Work
The rapid growth of EVs has introduced new operational challenges, most notably increased charging costs driven by grid congestion and peak demand [2]. To mitigate these issues, several strategies have been presented. Off-peak charging shifts demand to low-price periods [3], V2G systems enable EVs to discharge energy back to the grid during peak hours [4] and coordinated G2V/V2G scheduling aims to jointly maximize economic benefits and minimize charging costs [5].
However, many of these approaches overlook two critical aspects. First, frequent charging and discharging accelerate battery degradation, reducing service life and long-term economic value [6]. Second, electricity price volatility introduces significant uncertainty into operational decisions [7]. Effective EV charging scheduling must therefore balance short-term economic gains with battery longevity under dynamic conditions.
Traditional optimization techniques, including stochastic dynamic programming [8], robust stochastic programming, chance-constrained programming, and fuzzy programming [9], have been widely applied to address uncertainty and degradation. Nevertheless, these methods are highly sensitive to problem structure and often scale poorly when dealing with nonlinear, high-dimensional, and multi-modal problems. Metaheuristic algorithms—such as the improved Marine Predator Algorithm [10], Competitive Swarm Optimizer, Bat Algorithm, and Genetic Algorithm [5] offer greater flexibility but often rely on fixed algorithmic structures, limiting robustness and solution quality in dynamic environments.
Recent studies have shown that hybridization, adaptive mechanisms, and mathematical enhancement models can substantially improve metaheuristic performance by aligning algorithm behavior more closely with problem characteristics. EV charging optimization is inherently nonlinear, constrained, high-dimensional, and driven by uncertainty. Addressing such complexity requires an optimizer that combines strong exploration, effective exploitation, adaptability, and robustness.
Motivated by these requirements, this study builds upon the PLO. Inspired by the stochastic yet guided dynamics of polar lights, PLO employs random perturbations and directional movements to explore the global search space and reduce the risk of premature convergence, making it initially suitable for EV charging optimization. While recent work has begun applying recent metaheuristics to EV charging, such as the War Strategy Optimization (WSO) algorithm introduced in 2024 to minimize charging costs and queue times under realistic constraints, the application of PLO to EV charging optimization remains unexplored.
The suitability of PLO for EV charging optimization stems from the structural compatibility between its native search mechanisms and the characteristics of the problem. The aurora-inspired oval walk produces guided yet stochastic trajectories that reflect the non-stationary and time-varying nature of electricity prices in real-time charging environments. Likewise, the gyratory motion mechanism aligns well with the multi-modal structure of the EV charging cost landscape, which arises from interacting constraints such as state-of-charge limits, battery degradation effects, and bidirectional G2V/V2G decisions. These mechanisms enable PLO to navigate complex cost surfaces effectively while maintaining population diversity.
Despite these advantages, the original PLO exhibits an imbalanced exploration–exploitation trade-off that limits convergence speed and solution precision. Although gyratory motion is designed to enhance exploitation, in practice it mainly guides population movement toward promising regions rather than performing intensive local refinement. As a result, exploitation remains coarse and strongly dependent on fixed control parameters [11,12]. These limitations become more pronounced in dynamic optimization problems, where objective landscapes evolve over time due to electricity price volatility and system uncertainty.
To address these shortcomings, this study introduces IPLO through two complementary mechanisms. First, a Gaussian Random Walk-based Exploitation (RWE) strategy is incorporated to strengthen local search. By applying small, normally distributed perturbations around promising solutions, RWE enables fine-grained local refinement, accelerates convergence, and enhances solution precision while complementing PLO’s global exploration capability [13,14]. Unlike external local search hybrids, RWE is embedded within PLO’s native stochastic motion, preserving algorithmic coherence.
Second, the perturbation-based PRPT mechanism is adopted to introduce self-adaptation into PLO. Metaheuristic performance is strongly influenced by control parameters, and fixed parameter settings often result in inconsistent behavior in complex, real-world applications. Adaptive parameter control strategies dynamically adjust parameters during the search based on performance feedback, significantly improving robustness and efficiency [15,16]. In PRPT, key PLO parameters, specifically the gyratory weights and damping factor, are periodically perturbed within adaptive ranges. This approach directly addresses the fixed-parameter imbalance of the original PLO and is consistent with adaptive tuning frameworks validated in prior studies, such as Chemical Reaction Optimization, where perturbation-based adaptive control achieved statistically significant performance gains without requiring pilot tuning [17].
Importantly, the IPLO differs from existing hybrid or adaptive metaheuristics in how enhancement is realized. Rather than introducing additional operators or new hyper parameters, both RWE and PRPT operate on PLO’s intrinsic mechanisms, enabling problem-driven, online adaptation. This design is explicitly motivated by the non-stationary nature of EV charging optimization, where electricity prices and battery health evolve continuously over time.
In the context of EV charging cost optimization, the integration of RWE and PRPT enables continuous adjustments of the exploration–exploitation balance in response to changing system conditions. As a result, IPLO achieves faster convergence, improved solution quality, and greater adaptability under uncertainty. Collectively, these enhancements mitigate the structural limitations of the original PLO and establish IPLO as an effective and well-suited optimizer for uncertainty-driven EV charging optimization.
To handle electricity price volatility and battery degradation uncertainty without resorting to detailed electrochemical aging models, this study adopts a price-responsive adjustment and degradation-aware control mechanism. Real-time pricing signals are widely used in EV charging optimization to influence charging and discharging decisions, encouraging charging during low-price periods and discharging during high-price periods [18]. Smooth and bounded price–response mappings are employed to avoid discontinuous control actions and ensure operational stability in practical energy management systems [19]. Field trials in the ERCOT region have demonstrated that such dynamic pricing strategies can improve grid performance and reduce EV charging costs by approximately 8% compared to static tariffs [20].
Accordingly, this work employs bounded exponential mappings that scale charging and discharging increments based on dynamic electricity price levels, electricity price uncertainty is modeled using a deterministic scenario-based disturbance approach rather than a probabilistic forecast error model. Such scenario-based representations have been widely used in EV charging and scheduling literature to model external uncertainties without requiring full distributional forecasts or stochastic process assumptions. Specifically, a baseline electricity price trajectory is defined, and controlled price variations are introduced at selected time intervals to simulate unexpected price changes. These scenarios represent deviations that may arise from forecast updates, market volatility, or real-time pricing adjustments. The objective is not to estimate expected costs under a price distribution, but to evaluate the algorithm’s adaptive and robust response to sudden price variations, aligning with the control-oriented nature of online EV charging scheduling serving as a surrogate control law that ensures stable and realistic operational behavior [20]. While effective, this price-responsive adjustment may concentrate demand during low-price periods, assumes a relatively high user elasticity, depends on price forecast accuracy, and does not explicitly model local grid congestion.
For battery health, the presented framework adopts a two-level degradation-aware strategy. First, a lightweight degradation indicator tracks capacity evolution based on SOC variations, inspired by throughput-based aging models widely used in scheduling studies [21]. Second, and more importantly, this information is exploited by an adaptive operational mechanism that dynamically adjusts charging and discharging rates in response to observed capacity loss. This control-oriented formulation enables a proactive mitigation of degradation effects rather than merely penalizing them, making it particularly suitable for online EV charging scheduling under uncertainty.
This approach aligns with recent studies that integrate battery health indicators, such as the state of health (SOH), directly into decision-making and optimization processes [22,23]. Health-aware adaptive scheduling frameworks have been shown to improve lifetime performance and reduce battery stress compared to cost-only strategies, particularly under V2G operation and uncertainty [24].
Despite its advantages, the presented degradation-aware adjustment mechanism has limitations. Specifically, the objective is health-aware operational adaptation rather than explicit lifetime degradation modeling. While this enables computationally efficient and responsive real-time control, it does not aim to predict long-term aging trajectories or remaining useful life. Additionally, the simplified heuristic nature of the adaptive adjustment rules, though well suited for online scheduling, may not guarantee optimality under extreme operating conditions such as highly irregular driving patterns or dominant fast-charging behavior.
1.3. Contribution
This study responds to the need for robust and effective optimization tools to address the substantial and operational challenges, including high charging costs, battery degradation, and grid stress under dynamic electricity prices, as the widespread deployment of electric vehicles EVs is reshaping both transportation and power systems by proposing an IPLO that integrates a balanced exploration–exploitation and more adaptability for better handling of the challenge. The main contributions of the study are:
- A problem-driven enhancement of the PLO for EV charging cost optimization under battery degradation and price fluctuation, due to its unique physics-inspired dual-motion strategy gyration and aurora oval walks, combined with particle collision for escaping local optima, making it suitable for nonlinear, multi-modal, and high-dimensional continuous optimization problems.
- Performance analysis reveals that the original PLO provides coarse local exploitation, limiting the convergence precision in dynamic EV charging optimization. The RWE mechanism enhances localized search accuracy and accelerates convergence, leading to improved cost minimization. Meanwhile, PRPT improves robustness and prevents premature convergence. These enhancements collectively increase the compatibility of PLO with uncertainty-driven EV charging scheduling.
- A simplified control-oriented, price–degradation-aware mechanism that adaptively scales EV charging and discharging actions based on a deterministic scenario-based electricity price disturbance approach and a capacity-based battery degradation indicator, enabling cost reduction while mitigating degradation under uncertainty.
- The IPLO demonstrates improved performance and robustness under electricity price uncertainty, achieving consistently lower charging costs, faster and smoother convergence, and reduced sensitivity to price variations compared to the original PLO and several recent metaheuristic algorithms. Extensive comparative experiments and statistical analyses confirm the improved solution stability across multiple runs, while the adaptive mechanisms enable the algorithm to maintain a reliable performance as price signals and operating conditions vary.
2. Materials and Methods
2.1. Problem Formulation
Modern electric vehicles operate in two modes, G2V and V2G, enabling flexible energy use and cost reduction. This study presents an optimization framework using the PLO, improved RWE and PRPT to manage EV charging and discharging efficiently while considering battery health and electricity price fluctuations.
As illustrated in Figure 1, the system begins with a battery voltage of 384 V and a capacity of 60 Ah, ensuring smooth performance and extended range. With a 90% charging efficiency and 100% discharging efficiency, the battery supports optimal energy utilization [10].
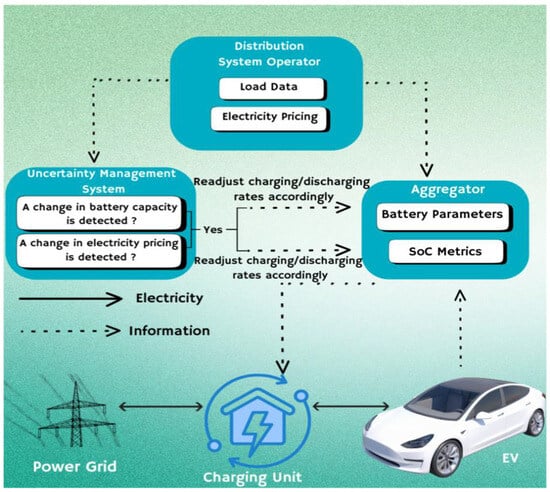
Figure 1.
Illustration of the electric vehicle charging and discharging infrastructure.
Starting at a 30% state of charge (SOC), the battery is charged in nine intervals with varying electricity prices. The goal is to reach an 80% SOC while minimizing charging and discharging costs [10]. The PLO-based framework, supported by RWE and PRPT, ensures cost-effective and adaptable optimization. By incorporating electricity price variability and battery degradation into the cost function, the model produces robust solutions that reduce costs and support long-term battery sustainability under dynamic conditions.
In equations [10], V represents the voltage of the battery, indicating the electrical potential difference between its terminals. The symbol Q denotes the battery’s capacity, measured in Ampere-Hours (Ah), representing ȵ, the maximum charge the battery can store. The charging efficiency is symbolized by reflecting how effectively electrical energy from the power source is converted into stored energy within the battery. The SOC for the interval is denoted by , indicating the battery’s current charge level during that specific time interval. The variable n represents the total number of time intervals, with k referring to a particular interval within that time frame. The cost of charging at the interval is represented by , while indicates the cost of discharging for the same interval. The total cost for the interval is denoted by , which is the sum of both charging and discharging costs. The selection variable for each interval, , is used to determine whether charging or discharging occurs during the interval. A value of 1 corresponds to charging, G2V, while a value of −1 signifies discharging, V2G.
The proposed formulation adopts a control-oriented, degradation-aware operational model for EV charging scheduling. The objective is not to predict battery lifetime but to mitigate degradation in real time by adapting charging and discharging behavior based on observed battery health evolution. This choice is motivated by the requirements of online EV charging optimization under uncertainty, where computational efficiency, adaptability, and responsiveness are essential. Battery degradation is therefore represented using a lightweight capacity-based indicator, which enables health-aware decision making without relying on detailed electrochemical aging models that rely on Arrhenius kinetics and SOC-dependent acceleration to accurately quantify calendar and cycle aging under controlled conditions [24], as they require more chemistry-specific parameters that are beyond the scope of real-time EV charging optimization and are therefore not adopted in this study. A comparison between the degradation-aware cost formulation and classical battery degradation models is presented in Table 1. Battery health degradation is represented using a capacity-based degradation indicator, defined as:
where is a degradation sensitivity coefficient and and denote the charging and discharging SOC variations, respectively. The coefficient is selected to reproduce the order of magnitude of the capacity fade observed in real EV batteries, which typically lose approximately 1.8–2.3% of capacity per year under normal usage. This corresponds to a capacity loss on the order of per SOC cycle, making an effective degradation proxy suitable for scheduling-level optimization rather than an exact electrochemical aging parameter. Battery health is further quantified through a normalized degradation indicator:
representing the relative state of health (SOH) loss and providing a continuous and interpretable measure of degradation severity. Rather than penalizing degradation directly in the objective function, the proposed approach introduces an adaptive operational response that reshapes SOC trajectories when degradation is detected. The charging and discharging increments are adjusted as follows:
with SOH-aware SOC regulation factors defined by:
where > enforces a stronger attenuation on discharging actions. This asymmetry reflects the higher degradation impact of discharging, particularly under V2G operation, which increases lithium plating risk, internal resistance growth, and depth-of-discharge stress, thereby altering the battery aging pattern and increasing the contribution of cyclic aging to total capacity loss [25]. Through this mechanism, the optimizer proactively limits aggressive SOC transitions as battery health deteriorates, achieving degradation mitigation while preserving responsiveness to electricity price signals.

Table 1.
Comparison between the presented degradation-aware cost formulation and classical battery degradation models.
To keep up with price fluctuations, an adaptive model is incorporated with an exponential term that supports charging during low-price periods and discharging during high-price periods, improving economic efficiency; normalizes current price within the dynamic range of [0, 1] to control the intensity of adjustment, Rk is the electricity price at the current interval, Rmin and Rmax are the minimum and maximum observed prices, and ϕk is the price scaling factor that adjusts the decision based on whether the interval corresponds to charging or discharging. To preserve battery health and extend its lifespan, several constraints must be considered during the optimization process. The following constraints ensure that the battery operates within safe and efficient parameters, balancing energy costs and battery longevity [10]:
Constraint 1: (Limit values for the SOC): The SOC of the battery should be kept within certain limits to avoid overcharging or deep discharging, which can shorten the life of the battery. In this case, the minimum SOC value should not fall below a certain threshold (30%), while the maximum SOC value should not exceed a predefined value (80%).
SOCmin ≤ Sk ≤ SOCmax
Constraint 2 states that the SOC must be sufficient to cover the energy requirements of the next journey and avoid the restriction that the state of charge is above the minimum SOC value.
Constraint 3: The charging decisions can be adjusted so that the SOC during each interval does not exceed the maximum chargeable SOC (40%).
|Sk − Sk−1| ≤ ∆SOCcharge (charging)
Constraint 4: The discharge decisions can be controlled to prevent the SOC of the battery from reaching the maximum dischargeable value (40%) and to avoid over-discharge.
|Sk − Sk−1| ≤ ∆SOCdischarge (discharging)
Constraint 5 states that there should be a minimum limit for the deviation of the SOC from one interval to the next, which is referred to as ∆SOCmin. This means that the SOC should not change by less than the value of ∆SOCmin (20%,10%) between successive intervals.
|Sk − Sk−1| ≥ ∆SOCmin
2.2. Algorithm
2.2.1. Natural Phenomenon Behind Polar Lights
The polar lights (Auroras) are caused by the interaction of charged solar wind particles (mainly electrons and protons) with the Earth’s magnetosphere [26]. These particles are directed toward the polar regions by the magnetic field lines, following a spiraling path; the phenomenon is illustrated in Figure 2.
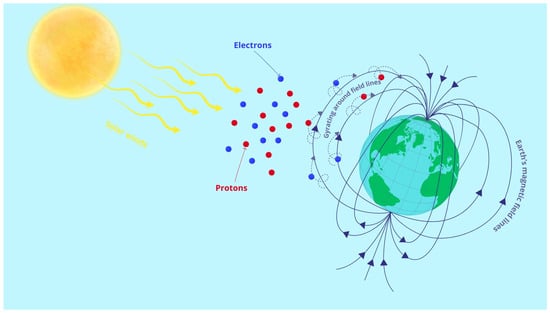
Figure 2.
Solar wind particles interacting with Earth’s magnetic field.
- Solar Wind Interaction: As solar particles travel from the Sun toward Earth, they encounter the Earth’s magnetic field, which traps and channels them along magnetic lines toward the poles. This motion is governed by the Lorentz force and is represented as a gyratory or spiral trajectory.
- Energy Transfer and Collisions: Upon entering the atmosphere, the particles collide with oxygen and nitrogen atoms, transferring energy and exciting the atoms to higher energy states.
- Emission of Light: When these atoms return to their normal states, they release photons. The types of gas and altitude determine the emitted light’s color (e.g., oxygen emits green or red, while nitrogen emits blue or purple). This stage is probabilistic, as collision frequency and energy levels vary.
- Spatial Distribution: Auroras typically appear in arcs or spirals due to magnetic field dynamics and particle movements. This is influenced by magnetic re-connection and plasma behavior, creating complex, variable patterns across the sky.
These phenomena showcase a combination of deterministic behavior (particles guided by magnetic lines) and randomness (energy exchange and photon emission).
2.2.2. Polar Lights Optimization Algorithm
Inspired by this phenomenon, the PLO [26], represents search agents as high-energy particles (solar wind) moving through the magnetic field (solution space) toward the poles, creating brilliant, dynamic patterns.
Gyration motion models local exploitation through the spiral motion of particles as they align with magnetic field lines.
Auroral Oval Walk: This is a global exploration technique based on the elliptical paths of auroras, factoring in velocity, energy, and atmospheric conditions to model movement across the solution space [26].
A Particle Collision Strategy captures the continuous collisions between charged particles to enhance escaping local optima, reflecting real-world energy exchange and aurora formation dynamics.
2.2.3. Mathematical Model
- Initialization: PLO starts by initializing a population of candidate solutions (particles) in a matrix with defined rows and columns. These candidates are randomly distributed to simulate the randomness of solar wind directions [25].
- 2.
- Gyration Motion
The spiraling trajectory of charged particles is modeled using the Lorentz force. As particles approach Earth, the magnetic field causes them to spiral. This force is described by a differential equation [26]:
To reflect atmospheric resistance, a damping factor (α) is introduced, modifying the motion to simulate kinetic energy loss as particles slowdown in denser atmospheric layers:
Solving this gives a velocity function with decaying energy behavior:
The charge q, magnetic field strength B, and constant C are simplified to a value of 1, while the mass m is set to 100. The damping factor alpha is randomly chosen within the range [1, 1.5]. Time t is simulated per iteration. This strategy enhances local search, allowing for a precise exploitation of regions while preserving exploration capabilities.
- 3.
- Auroral Oval Walk
Mimicking the dynamic elliptical band of auroras, this phase enables global exploration. The changing shape of the auroral oval due to geomagnetic activity mirrors the unpredictable nature of wide search areas [26].
To model this behavior, Levy flight (LF) is integrated. LF is a random walk with step sizes following a Levy distribution, enabling particles to explore far-reaching zones in the search space effectively.
Levy(d)~|d|−1−β, 0 < β ≤ 2
Here, controls the stability of the step size d. The movement of particles in PLO is influenced by geomagnetic activity simulating the contraction and expansion of the auroral oval. The change in particle position Ao is expressed as
where is the average position of all particles, is the current position, and is a random factor. PLO combines two search patterns: the gyration motion and the aurora oval walk. The gyration motion simulates particles spiraling along the Earth’s magnetic field, focusing on local search and fine adjustments to improve solution quality. The auroral oval walk, in contrast, emphasizes global exploration, allowing particles to make larger moves and explore broader regions of the solution space.
Ao = Levy(d) × (Xavg(j) − X(i, j)) + LB + r1 × (UB − LB)/2
The combined motion is represented by
where is a random interference factor, and W1 and W2 are adaptive weights controlling the balance between local and global search. These weights evolve with each iteration:
Xnew(i, j) = X(i, j) + r2 × (W1 × v(t) + W2 × Ao)
As iterations progress, increases, giving more weight to local search, while decreases, reducing the influence of global exploration. This dynamic adjustment helps balance both search phases, enabling PLO to efficiently navigate the solution space and locate optimal solutions.
- 4.
- Collision and Energy Exchange
Auroras result from high-energy particle collisions that alter speed and direction, causing energy transfer, excitation, and ionization processes that amplify auroral brightness and complexity. Inspired by this, PLO introduces a Particle Collision Strategy to simulate these chaotic interactions; Figure 3 illustrates the collision.
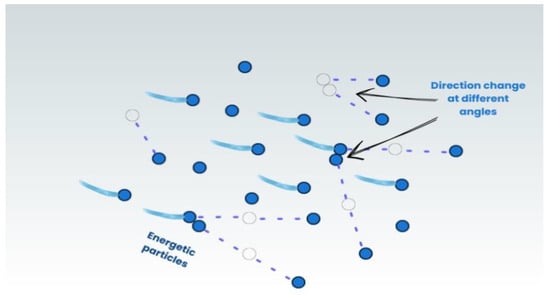
Figure 3.
Particles collision.
In this strategy, particles randomly collide like in a billiard game, generating new positions and enhancing the optimizer’s ability to escape local optima. As in nature, collision frequency increases over time, especially within the auroral oval, allowing for a broader solution space exploration. Mathematically, the local search term is calculated using
Xnew(i, j) = X(i, j) + sin(r3 × π) × (X(i, j) − X(a, j)),
r4 < K and r5 < 0.05
r4 < K and r5 < 0.05
K = √(t/T)
X(a, j) represents any particle in the particle cluster. Collisions between particles become more frequent as the algorithm proceeds and are therefore controlled by the collision probability K, calculated using Equation (20). r3 and r4 are random values, taking values in [0, 1].
PLO replicates the natural phenomena of polar lights through stages of initialization (solar wind interaction), local refinement (gyratory motion and particle collisions), global exploration (Levy flight and oval walk guidance), and convergence (aurora formation), all orchestrated by equations that mirror the balance between exploration and exploitation found in nature.
2.2.4. IPLO
This paper introduces the PLO, inspired by the physical dynamics of auroras [26]. In this model, search agents represent high-energy solar particles guided by Earth’s magnetic fields and atmospheric interactions as they spiral unpredictably toward the poles. Initially influenced by geomagnetic forces, these particles slow down due to atmospheric collisions, forming the auroral oval, an elliptical region that fluctuates with magnetic activity. A modified velocity equation, derived from the Lorentz force and Newton’s second law, incorporates a damping factor to simulate this behavior. To balance global and local search, PLO integrates gyration motion for local exploitation and the auroral oval walk for global exploration. A Particle Collision Strategy further enhances the optimizer’s ability to escape local optima through dynamic interactions. The algorithm’s workflow is detailed in Algorithm 1 and visualized in Figure 4.
| Algorithm 1. Pseudo Code for IPLO |
| Parameters initializing: ,, Initialize high-energy particle cluster . Calculate the fitness value . Sort according to . Update the current optimal solution . While Calculate the velocity for each particle, according to Equation (17). Calculate aurora oval walk for each particle, according to Equation (19). Calculate weights and according to Equations (22) and (23). For each energetic particle do Updating particles using Equation (21). If and Particle collision strategy: update particle using Equation (24). End If Calculate the fitness . |
| . |
| End For If Iterating over using the greedy selection mechanism. End If Parameter Refinement and Tuning (PRPT) Every k = 10 iteration Update parameters , , and using adaptive tuning based on current fitness values using Equations (28)–(30) Random Walk Exploitation (RWE) For each energetic particle do With a probability p (e.g., 0.2), perform a random walk to generate a new candidate position using Equation (27). Evaluate the fitness and update particle if the new candidate is better. End For Sort according to . Update the optimal solution . |
| End While Return the . |
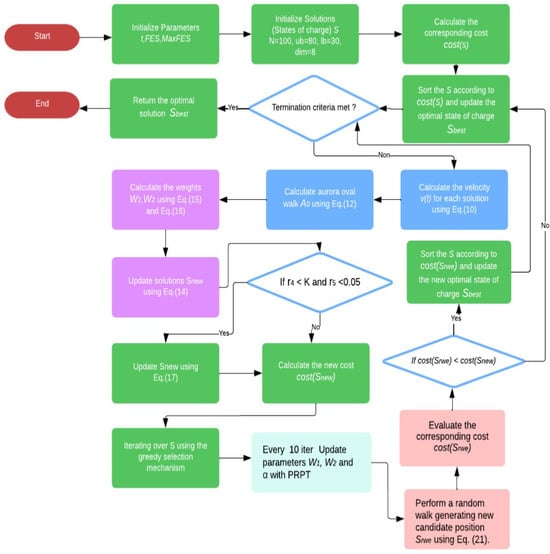
Figure 4.
Flowchart of EV charging optimization using the Improved Polar Lights Optimizer.
2.2.5. Improvement
In the IPLO, two key improvements have been integrated: a random walk strategy, which has proven its effectiveness in many scenarios such as Random walk exploration for swarm mapping [27], Gaussian random walk salp swarm algorithm [13] and Random walk grey wolf optimizer [28], side by side with Parameter Tuning, which is employed to improve algorithm performance significantly.
- Random Walk Exploitation
The RWE model is an improvement technique designed to improve the algorithm’s convergence and exploitation ability. It introduces a targeted, controlled random walk phase into the optimization process, allowing the particles or agents to perform fine-grained exploitation around promising regions identified by the algorithm. The concept of a random walk as a search mechanism goes back to early metaheuristic and optimization theory. A random walk changes a solution by adding a small random step [18]. This allows particles to exploit promising areas more effectively, thereby refining the search within high-potential regions and improving convergence toward optimal solutions. Key components and equations of RWE are the following:
- (1)
- Random step size generation
ΔX = α. (ub − lb). η
Here, α is a scaling factor that equals 0.05, controlling the step size. This value ensures localized exploration rather than global disruption, enabling fine-grained adjustments of charging schedules. From a physical perspective, this corresponds to minor operational variations in EV charging and discharging rates that are feasible within practical energy management systems. From an economic standpoint, it prevents abrupt schedule changes that could negate cost benefits or violate operational constraints. The variable η is a random variable drawn from a standard normal distribution, η∼N(0, 1), with zero mean and unit variance. This term introduces unbiased stochastic perturbations that enhance local exploitation while preserving numerical stability.
- (2)
- Position Update with RWE
Each particle’s position is updated by adding the random walk step to the current position. The equation for the position update is defined as:
This update mechanism implements a Gaussian local search, which is widely used in metaheuristic optimization to intensify exploitation near high-quality solutions. The use of a zero-mean normal distribution biases the search toward local neighborhoods, improving solution precision and convergence speed without introducing directional bias.
XRWE = Xi + ΔX
- (3)
- Evaluation and Acceptance of New Positions
The updated position is then evaluated. If the evaluation of the function with provides a lesser cost than with, then = and f ( = f (; otherwise, the particle retains its previous position.
- b.
- Periodic Random Parameter Tuning Method
- PRPT: This method introduces lightweight and periodic adjustments to the key parameters of the IPLO, helping to maintain a balance between exploration and exploitation throughout iterations. PRPT accomplishes this by slightly perturbing parameters within controlled ranges to ensure flexibility and adaptability without substantial computational overhead.
The selected parameters include the following:
- ▪
- Intensity Weights (, ) manage exploration and exploitation trade-offs, adapting over iterations.
- ▪
- The damping factor () adjusts the movement magnitude of candidate solutions, encouraging exploration in early phases and fine-tuning later.
- 2.
- Perturbation Equations
Each parameter is periodically updated based on simple perturbations as follows:
- (1)
- Intensity Weights Update ( and )
w1new = w1 + δw1
w2new = w2 + δw2
- (2)
- Damping Factor Update
αnew = α × (1 + δα)
The damping factor regulates the persistence and magnitude of particle motion, effectively controlling the aggressiveness of the search process. In the context of EV charging optimization, overly aggressive motion corresponds to abrupt and unrealistic SOC changes that may increase battery stress and lead to unstable charging schedules. Therefore, the damping factor is maintained within a narrow perturbation range, , scaled between [−0.1, 0.1] to ensure smooth and physically feasible solution trajectories. Furthermore, linking damping adaptation to battery degradation enables a gradual search momentum as health deteriorates, promoting conservative refinement near optimal schedules and preserving economically smooth charging behavior under uncertainty.
3. Results
This section of the paper discusses the results of the study. The main points addressed are the following:
- Analysis of the test case: the test case includes the evaluation of two values, namely 20% and 10%. This analysis helps to investigate the impact of different limiting cycle levels on the optimization process [10].
- Dealing with uncertainty: The paper addresses how the presented approach deals with uncertainties related to battery performance degradation and changes in electricity prices. This aspect highlights the algorithm’s ability to adapt and optimize under uncertain conditions [10].
- Comparison with state-of-the-art algorithms: The performance of the IPLO is compared with other metaheuristic algorithms [29], including the PLO [26], Dung Beetle Optimizer (DBO) [30], Moth Flame Optimizer (MFO) [31], Hippopotamus Optimizer (HO) [32], Sea Horse (SH) [33], Whale optimization algorithm (WOA) [34], and Coati optimization algorithm (COA) [35]; in addition, a non-optimized approach is included as part of the comparison process where a customer performs the charging/discharging operations based on their own choice to highlight the pivotal role of optimization in the process. Several trial runs are performed with a population size P of 100 and iteration number T of 3000 for each algorithm to ensure a fair comparison within certain parameter values.
- Control parameters and robustness: Table 2 shows the additional control parameters of the selected algorithms. To ensure reliability and robustness, each algorithm is subjected to 20 test runs so that its performance can be comprehensively evaluated. Overall, this section provides a thorough analysis of the test case, a comparison with other algorithms, and an evaluation of the IPLO algorithm’s performance in managing uncertainties and optimizing battery usage in response to changing conditions.
Table 2. Control parameters of all algorithms.
The analysis includes three targeted test case studies, each addressing distinct aspects of the optimization problem:
- Test Case 1: This case evaluates the optimized scheduling results produced by various algorithms. The objective is to identify the most effective algorithm for the problem, focusing on battery lifespan preservation by implementing two limiting cycle values.
- Test Case 2: This study examines battery performance degradation factors, such as frequent cycles of charging and discharging and extreme battery levels (either fully charged or discharged). It analyzes the impact of these factors on the cost function, with the necessity of compensation strategies to maintain profit goals during battery degradation conditions.
- Test Case 3: This study assesses the influence of fluctuating electricity prices during operation, incorporating real-time pricing to minimize costs and strengthen the model’s robustness.
Together, these test cases target key cost function factors to optimize EV charging schedules by maximizing profit while considering battery health and dynamic pricing. Comparative analysis with existing algorithms highlights the effectiveness of the presented approach and offers valuable insights to guide future research in EV charging optimization.
3.1. Test Case Study 1
This paper introduces a scheduling operation for a 23 kWh, 384 V, and 60 Ah battery [10] over a nine-period time frame to ensure more robust results with the minimum V2G and G2V cycles. The main objective is to minimize the total charging cost of electric vehicles, EVs, by optimizing a cost function with five constraints. The initial SOC of the battery is 30%, and the target is to reach 80% SOC; the maximum chargeable and dischargeable energy amount is set to 40% during any interval. The battery has a charging C-rating of 0.9 C and a discharging C-rating of 1 C. The price of electricity is = {7, 12, 8, 11, 9, 13, 7, 12, 10}; it varies over the nine intervals, and the customer receives benefits for supplying energy back to the grid and paying for charging their EV battery [10].
The performance and efficiency of the IPLO were evaluated against various metaheuristic algorithms and a non-optimized version, focusing on cost and efficiency. As shown in Table 3, IPLO achieved the lowest cost at Rs 1050.23, significantly outperforming the other methods. DBO and PLO followed, with Rs 2816 and Rs 2817.94, while MFO and SH resulted in costs of Rs 5120 and Rs 5361, respectively. The WOA followed, with Rs 5418, and the HO exhibited relatively higher costs. Meanwhile, both the COA and the non-optimized version recorded the highest costs in this category. These results underscore IPLO’s ability to efficiently schedule charging and discharging operations under normal, unrestricted conditions. In Table 4, under limited cycle (l.c.) conditions of 20% and 10%, IPLO maintained its top performance, with a consistent cost of Rs 1050.23. DBO and PLO also performed reliably, achieving in sequence Rs 2816 and Rs 2819.9 for both limited cycles. MFO followed, with Rs 3534.54 under 20% l.c. and Rs 5120 without limitation. WOA ranked next, with Rs 4174.12 under 10% l.c., while HO recorded Rs 6154.5 (20% l.c.) and Rs 6145.45 (10% l.c.). SH produced costs of Rs 5538 and Rs 5554 for 20% and 10% l.c., respectively. COA showed high costs of Rs 24,113.35 (20% l.c.) and Rs 20,772.99 (10% l.c.), while the non-optimized version was the least efficient, with Rs 38,912 (20% l.c.) and Rs 43,520 (10% l.c.). Figure 5 illustrates these variations across discharge and charge cycles with and without limitations. Overall, in this initial case study, IPLO demonstrated an outstanding cost-effectiveness and adaptability across all conditions, setting a new benchmark with Rs 1050.23, remarkably exceeding the PLO performances, while DBO also proved to be highly effective. MFO and WOA followed as reliable alternatives under limited-cycle scenarios.
Table 3.
Scheduling without limiting cycles for nine intervals.
Table 4.
Scheduling with limiting cycles for nine intervals.
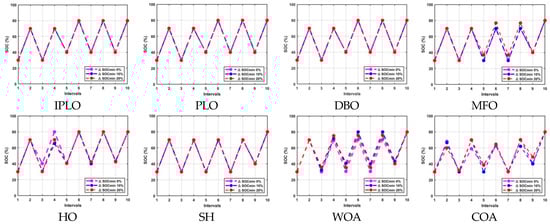
Figure 5.
Discharging and charging operations with 0% 10% and 20% limiting cycles for nine intervals.
3.2. Test Case Study 2
Battery Degradation Uncertainty
Battery performance degradation refers to the gradual decline in capacity over time, primarily influenced by factors such as frequent charging, a deep low state of charge, full- capacity charging, and excessive fast charging [36]. These factors introduce uncertainties in maintaining the desired SOC and ensuring cost stability. This study assesses the IPLO algorithm’s ability to manage such uncertainties by adapting its optimization strategy based on the real-time detection of battery performance changes. Degradation detection operates at two levels. At the charging infrastructure level, advanced battery health monitoring techniques such as impedance spectroscopy [37], incremental capacitance analysis [38], and the sensor-based tracking of temperature and voltage enable the prediction and detection of degradation by comparing collected data (e.g., cycles, temperature, voltage) against healthy benchmarks. Techniques like Coulomb counting [39], voltage-based SOC estimation, and Incremental Capacity Analysis (ICA) further contribute precise insights by tracking capacity changes and analyzing voltage capacity derivatives. Recent advances in battery health modeling demonstrate that battery aging is a complex, data-dependent phenomenon influenced by operating conditions, cycling behavior, and cell-to-cell variability. Deep learning frameworks such as BatLiNet enable an accurate lifetime prediction across diverse aging regimes [40], while platforms like BatteryML highlight the growing need for unified data-driven degradation modeling [41]. While such approaches are highly effective for lifetime prediction and offline analysis, they rely on large datasets and chemistry-specific parameters that limit their suitability for real-time EV charging optimization. In contrast, this work adopts a control-oriented degradation-aware formulation that leverages lightweight health indicators to enable adaptive charging decisions under uncertainty, prioritizing responsiveness and computational efficiency. At the experimental level, the presented degradation-aware cost formulation introduces a capacity-based health indicator and an adaptive operational mechanism that dynamically adjusts charging and discharging actions in response to observed battery degradation. By dampening SOC transitions proportionally to health loss, the approach reduces deep cycling and high-stress operating conditions while preserving economic responsiveness. This control-oriented formulation is computationally efficient, physically consistent, and well suited for real-time EV charging optimization under uncertainty.
To evaluate this, the algorithm was tested over three key intervals (k = 1, 4, and 7) and under two degradation constraints: 20% and 10% cycle limitations. Table 5, Table 6 and Table 7 show the scheduling results of this case study. In the first interval (k = 1), IPLO achieved a highly favorable outcome of Rs −1107.59 for both cycle limits, entering profitability; on the other hand, PLO achieved Rs 668.7 for both cycle limits. This result illustrates IPLO’s strength in early-stage degradation management, applying compensatory adjustments to minimize costs while maintaining system stability. Comparatively, DBO recorded Rs 665.6 and Rs 780.09, while MFO achieved Rs 669.23 and Rs 665.6 for the 20% and 10% limits, respectively. WOA followed with a higher Rs 1954.45 under 10% l.c., while HO and SH ranged from Rs 3200 to Rs 4200, proving less reliable in this phase. COA and the non-optimized version resulted in significantly higher costs, reinforcing their inefficiency. In the fourth interval (k = 4), IPLO maintained its effectiveness, with a cost of Rs 3329.54 under both cycle limitations, while the PLO jumped to Rs 5106.32 and 5101.32 for 20% and 10%, respectively, showing a remarkable difference. This mid-stage result outperformed DBO, which scored Rs 5495.21 (20%) and Rs 5899.06 (10%), while MFO followed closely with slightly higher costs. HO produced Rs 7528 (20%) and Rs 6477 (10%), and SH and WOA ranged from Rs 8200 to Rs 9200, confirming their comparatively weaker performance. Again, COA and the non-optimized version generated the highest costs. This stage posed greater uncertainties due to mid-cycle degradation, which IPLO successfully mitigated by recalibrating its schedule through its compensatory mechanism. In the seventh interval (k = 7), IPLO again demonstrated profitability, with Rs −1118.2419 under both limitations, showing a strong adaptability to late-stage degradation, again outperforming the PLO, which achieved Rs 669.13 and Rs 668.9 for 20% and 10%, respectively. DBO ranked second, with Rs 818.1 for 20% l.c., followed by MFO, with Rs 856.91 and Rs 985.65 for 20% and 10%, respectively. In contrast, HO, SH, and WOA incurred higher operational expenses between Rs 3000 and 7000. COA yielded a cost of Rs 88,142.05 for 20%, and the non-optimized version reached Rs 30,156.8 for 10%, demonstrating their significant inefficiency. These findings confirm the IPLO algorithm’s robustness and flexibility in managing degradation while ensuring profitability and system resilience. By detecting and improving performance drops and applying a compensation factor, IPLO dynamically adapts its schedule, outperforming PLO and other contemporary algorithms across multiple intervals and degradation conditions. Figure 6, Figure 7 and Figure 8 illustrates the resulting charge/discharge operations for this case study.
Table 5.
Scheduling with limiting cycles for nine intervals with battery degradation uncertainty at k = 1.
Table 6.
Scheduling with limiting cycles for nine intervals with battery degradation uncertainty at k = 4.
Table 7.
Scheduling with limiting cycles for nine intervals under battery degradation uncertainty at k = 7.
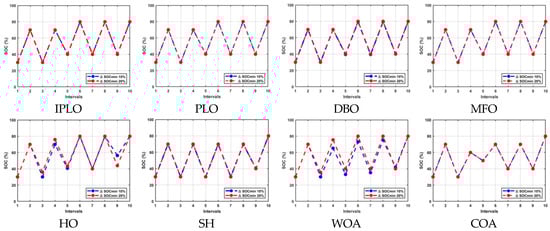
Figure 6.
Discharging and charging operations with 10% and 20% limiting cycles for nine intervals with uncertainty at k = 1.
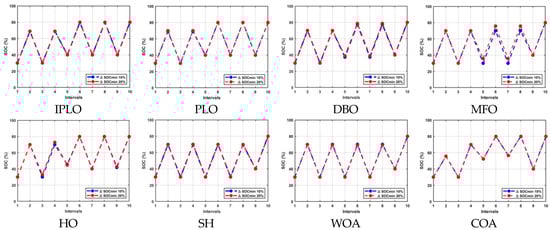
Figure 7.
Discharging and charging operations with 10% and 20% limiting cycles for nine intervals with uncertainty at k = 4.
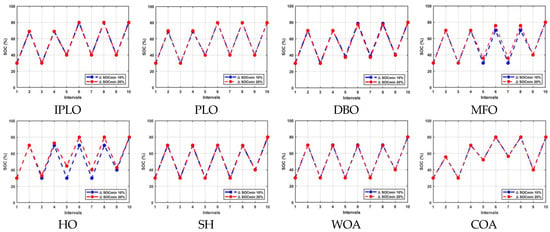
Figure 8.
Discharging and charging operations with 10% and 20% limiting cycles for nine intervals with uncertainty at k = 7.
3.3. Test Case Study 3
Electricity Price Fluctuation Uncertainty
This case study explores the adaptability and robustness of the IPLO in handling uncertainties in electricity pricing, a major factor in minimizing EV charging costs. At the infrastructure level, real-time monitoring and smart grid communication enable charging systems to adjust schedules dynamically based on live electricity rate updates [42]. Simultaneously, at the experimental level, a metaheuristic algorithm plays a pivotal role [43], IPLO receives predefined pricing arrays and continuously compares them with real-time data as a scenario-based uncertainty modeling approach. When fluctuations are detected, it recalibrates the charging and discharging strategy using a correction factor linked to the updated prices, which also influences its exploration and exploitation dynamics. This adaptive mechanism allows IPLO to remain cost-efficient and responsive, with decisions executed directly through EV infrastructure controls. The approach not only reduces costs but also supports grid stability and sustainability. Table 8, Table 9 and Table 10 show the scheduling results with electricity pricing uncertainty at k = 2, k = 3 and k = 5, and k = 6, respectively.
Table 8.
Scheduling with limiting cycles for 10 time intervals with electricity pricing uncertainty at k = 2.
Table 9.
Scheduling with limiting cycles under electricity price uncertainty at k = 3 and k = 5.
Table 10.
Scheduling with limiting cycles for 10 time intervals with electricity pricing uncertainty at k = 6.
IPLO’s performance was evaluated across different uncertain intervals (k = 2, 3 and 5, 6) and consistently demonstrated the lowest operational costs compared to other algorithms. In the interval k = 2, IPLO achieved Rs 10,268.68 for both 10% and 20% limiting cycles, outperforming all competitors. PLO followed, with Rs 12,034.27 and Rs 12,034.8 for 20% and 10% limiting cycles, respectively. DBO and MFO followed, but with noticeably higher costs, especially for the 20% limiting cycle, while COA showed instability under stricter conditions. WOA showed a moderate adaptability, whereas HO, SH, and the non-optimized approach registered the highest costs. In intervals k = 3 and k = 5, with uncertainty present in two-time intervals, IPLO again led, with Rs 19,748.52 for both limiting cycles, showing a significant difference from the original PLO, which followed with Rs 23,049.62 and Rs 22,788.01 for the 20% and 10% limiting cycles. DBO and MFO were the next best performers but still trailed IPLO. COA and SH showed a reduced reliability, and the non-optimized version had the poorest results. These outcomes confirm IPLO’s superiority in managing dynamic electricity pricing scenarios, offering an improved cost-effectiveness and reliability over other contemporary optimization methods; Figure 9, Figure 10 and Figure 11 show the results of charging and discharging operations for this case study.
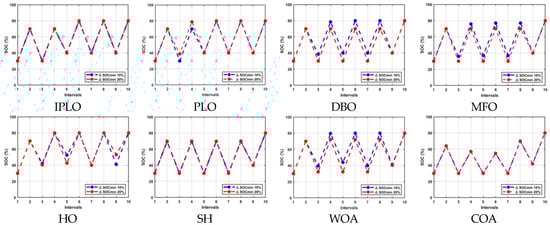
Figure 9.
Charging and discharging cycles with 10% and 20% cycle limits over nine intervals under k = 2 uncertainty.
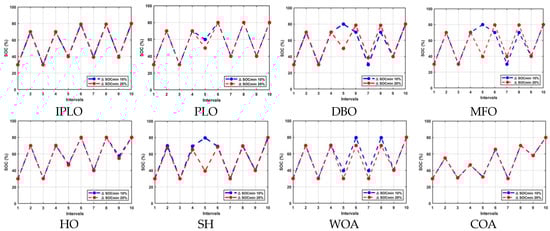
Figure 10.
Discharging and charging cycles with 10% and 20% limiting cycles at k = 3 and k = 5 uncertainty.
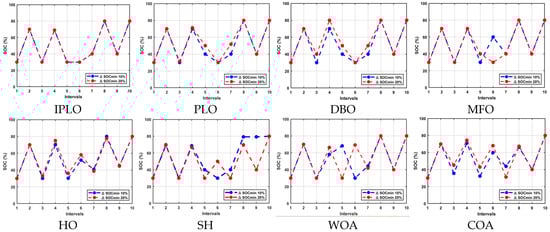
Figure 11.
Discharging and charging operations with 10% and 20% limiting cycles for nine intervals at k = 6 uncertainty.
Table 10 shows the scheduling results under extended uncertainty at the interval k = 6. The IPLO maintained a superior cost efficiency, achieving Rs 21,779.59 for both 10% and 20% limiting cycles (l.c.), demonstrating a high adaptability and consistent performance even at late-stage price fluctuations. PLO followed, with Rs 29,056.53 and Rs 25,857.8 for 20% and 10%, respectively. SH ranked third under the 10% l.c., with Rs 27,940.29, but its cost rose sharply to Rs 43,790 under the 20% l.c., reflecting a limited robustness. DBO followed, with Rs 28,160 (10%) and Rs 30,976 (20%), while MFO matched DBO at Rs 28,160 (10%) but increased to Rs 37,376 (20%), indicating a sensitivity to higher uncertainty. HO, WOA, and COA recorded significantly higher costs, suggesting a weaker performance in uncertain conditions. The non-optimized case scored the highest cost (Rs 80,640 at 10% l.c.), highlighting the necessity of optimization for stable, cost-effective operation. This case highlights IPLO’s ability to adapt to price changes and maintain performance over different stages. Notably, IPLO kept a minimal gap between the two l.c. values, offering flexibility and ensuring battery safety. Despite the extended uncertainty, IPLO consistently outperformed others, confirming its robustness and reliability in dynamic environments.
3.4. Comparative Study
3.4.1. Performance, Robustness, and Stability
A comprehensive comparative evaluation was conducted to assess the performance, robustness, and stability of the IPLO against a diverse set of state-of-the-art algorithms across multiple operating scenarios. The analysis integrates descriptive statistics, Friedman ranking (as shown in Table 11), and pairwise Wilcoxon rank-sum tests (illustrated in Table 12) to ensure statistically reliable conclusions. The Friedman test revealed statistically significant performance differences among the competing algorithms (p < 0.05). Across all benchmark cases, IPLO consistently achieved the lowest average rank (1.00), confirming its superior overall performance. PLO and MFO formed the second performance tier, while DBO followed closely. In contrast, HO, SH, WOA, and COA consistently occupied lower ranks, reflecting a weaker solution quality and reduced robustness across varying scenarios. Pairwise Wilcoxon rank-sum tests further validated these findings. IPLO achieved statistically significant wins against nearly all competing algorithms in every scenario, indicating a reliable performance under varied conditions.
Table 11.
Friedman test ranking results.
Table 12.
Wilcoxon test results.
The descriptive statistical analysis shown in Table 13 reinforces these conclusions. IPLO exhibited the smallest ranges and lowest standard deviations in nearly all cases, indicating a highly stable and repeatable performance. While PLO showed zero variance due to its deterministic nature, it consistently delivered an inferior solution quality compared to IPLO. Algorithms such as WOA, COA, and HO displayed large ranges and standard deviations, reflecting unstable search behavior and susceptibility to premature convergence or erratic exploration. In contrast, IPLO effectively balanced exploration and exploitation, achieving a low variability while maintaining a superior cost performance. To assess robustness under uncertainty, the coefficient of variation (CV) was used as a robust metric, defined as the ratio of the standard deviation to the mean objective value across 20 runs. The original PLO achieved the lowest average CV, reflecting a high stability but limited adaptability due to fixed parameters. The IPLO attained the second-lowest average CV (0.0046), demonstrating an excellent robustness while preserving adaptive search capability. Compared with competing metaheuristics (DBO, MFO, HO, SH, WOA, and COA), IPLO exhibits a substantially lower variability across all scenarios, confirming that the integration of Random Walk Exploitation and Periodic Random Parameter Tuning improves stability without compromising adaptability. These findings complement the Friedman and Wilcoxon tests, indicating that IPLO delivers not only a superior cost performance but also consistent and reliable behavior under diverse operating conditions, which is essential for practical EV charging optimization.
Table 13.
Statistical results.
3.4.2. Execution Time
Runtime Analysis
In terms of execution time, DBO, MFO, and COA ranged between 3 and 7 s, SH and WOA took between 5 and 6 s, and both IPLO and the original PLO completed their runs within 12 to 13 s; HO was the slowest, requiring 59 to 66 s. Despite IPLO’s slightly longer runtime, its efficiency and consistent performance justify the trade-off. The average runtime and its standard deviation in Table 14 were computed across all tested cases under identical experimental settings (same population size, function evaluations, and hardware). The standard deviation reflects the stability of the runtime and sensitivity to problem variations.
Table 14.
Statistical analysis.
IPLO exhibits a runtime comparable to the original PLO, confirming that RWE and PRPT introduce no significant computational overhead. The low standard deviation for IPLO indicates a stable execution time across different uncertainty scenarios. HO shows the highest runtime and variability, reflecting its heavier internal operators. Lightweight algorithms (DBO, COA) are faster but, as shown previously, provide inferior robustness and solution quality. IPLO achieves a balanced trade-off between accuracy, robustness, and efficiency, which is critical for online EV charging scheduling.
Runtime Complexity
The computational complexity of the original PLO per iteration is
where P is the population size, D is the problem dimension, and denotes the cost of evaluating the objective function. Over T iterations, the total complexity is
The IPLO preserves the same asymptotic complexity. RWE introduces a linear local perturbation step D) applied with fixed probability, while the PRPT incurs negligible overhead due to infrequent scalar updates. The price–degradation-aware operational mechanism is embedded within the objective function and adds only linear operations with respect to D, thereby increasing the constant factor of without altering its order. Consequently, IPLO achieves an improved convergence accuracy, robustness, and adaptability without increasing the asymptotic computational complexity compared to the original PLO.
3.4.3. Convergence
Figure 12, Figure 13 and Figure 14 illustrate the convergence behavior of all algorithms under different cases and uncertainty levels. In all scenarios, IPLO demonstrates a fast and smooth convergence and achieves lower final fitness values compared to PLO and all other competing algorithms across all scenarios. The enhanced IPLO exhibits a steeper descent in the early iterations and a stable convergence pattern in the later stages, with almost no clear oscillations. While PLO shows oscillations especially during the early stage, IPLO continues refining the solution and consistently reaches better optima. Other algorithms such as SH and HO displayed a delayed convergence with harsh oscillations and aggressive descents, or stagnation at higher fitness levels, such as with COA. DBO, MFO and WOA display more smoothness with the least oscillations and stabilize to a solution around the 1000th iteration, which is a sign of local optimality, while IPLO continues its smooth descents to the optimal solution, highlighting the effectiveness of the presented mechanism improvement. Overall, the convergence curves clearly confirm the high performances of IPLO in terms of convergence speed, stability, and solution quality.
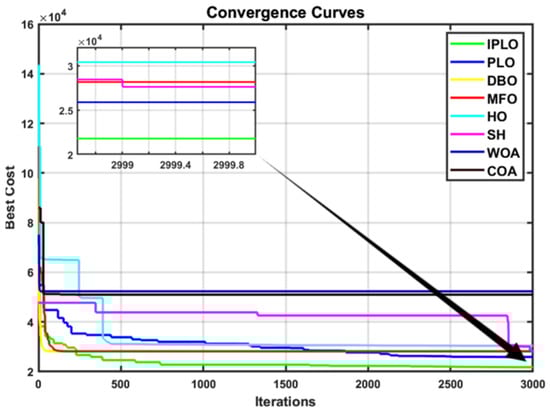
Figure 12.
Case I convergence curves.
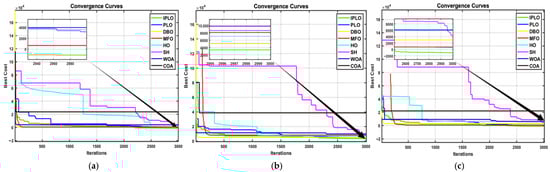
Figure 13.
(a) Case II, uncertainty at K1. (b) Case II, uncertainty at K4. (c) Case II, uncertainty at K7.
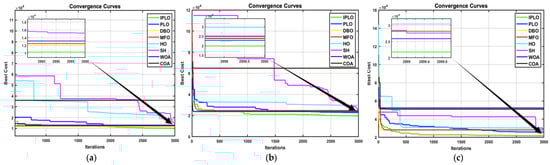
Figure 14.
(a) Case III, uncertainty at K2. (b) Case III, uncertainty at K3 and K5. (c) Case III, uncertainty at K6.
3.4.4. Box Plot Analysis
Figure 15 presents the Boxplot comparison of the best fitness values obtained by different optimization algorithms across seven test cases: (a)–(g). In each boxplot, the blue box represents the interquartile range (IQR), the red horizontal line indicates the median fitness value, and whiskers denote the minimum and maximum values across independent runs. Across all box plot scenarios, the IPLO algorithm consistently presents the lowest median fitness values and the most compact box distributions, indicating a superior solution quality and high robustness. The narrow interquartile ranges and short whiskers confirm that IPLO exhibits a low variability and strong stability over repeated runs. In contrast, competing algorithms, particularly COA and WOA, show wider and higher-positioned boxes, reflecting an increased dispersion and inferior performance. Although some methods such as GWO and MVO demonstrate reasonable stability, their median values remain consistently above those of IPLO, indicating a convergence toward sub-optimal solutions. Overall, the boxplot analysis clearly demonstrates that IPLO achieves the most accurate and consistent optimization performance among all compared algorithms. The stability and narrow variability of IPLO’s performance further support the conclusion that the presented algorithm offers a superior efficiency and robustness in EV charging cost optimization. These results confirm that IPLO significantly outperforms all other tested algorithms.
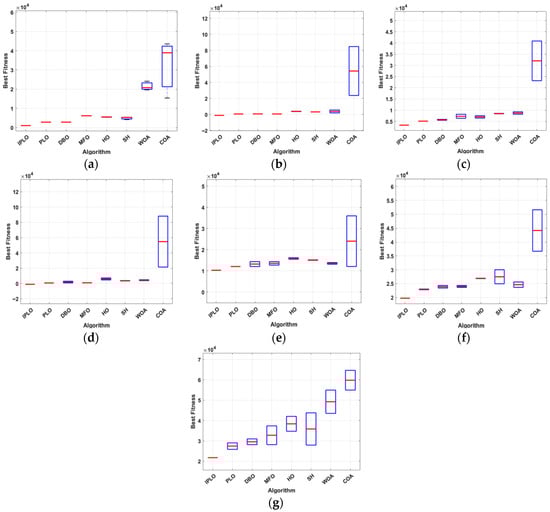
Figure 15.
Boxplots: (a) Case I. (b) Case II, uncertainty K1. (c) Case II, uncertainty K4. (d) Case II, uncertainty K7. (e) Case III, uncertainty K2. (f) Case III, uncertainty K3 and K5. (g) Case III, uncertainty K6.
4. Discussion
The main objective of this research is to minimize EV charging and discharging costs under various constraints and uncertainties using the IPLO algorithm. In the first case study, IPLO is tested under two scenarios: without a limit on charging/discharging cycles and with a limit on it. As shown in Table 2, IPLO consistently achieves the lowest costs in both scenarios, maintaining its performance regardless of the cycle limit, with the same number of search agents and iterations, and outperforming the original PLO, highlighting its robustness and the efficacy of the improvement model implemented. A constraint “Constraint-V” is introduced (Table 3), which limits frequent mode switching based on SOC, using thresholds of 20% and 10%. Since cost outcomes remain constant across both limits, the tighter 10% is recommended for an improved battery longevity.
The second case study explores IPLO’s resilience under battery condition uncertainties. As shown in Table 4, Table 5 and Table 6, IPLO maintains profitability even during critical intervals with unpredictable power levels, demonstrating an adaptability and robust performance in real-world fluctuating environments. The third case study examines the impact of electricity price fluctuations on scheduling. During V2G operations, rising prices increase user profits, while, during G2V, falling prices reduce costs. These fluctuations positively influence total cost, emphasizing the need for dynamic scheduling. IPLO successfully adapts to such variations, optimizing cost savings by adjusting operations through price-responsive adjustments in real time. Through the analysis of SOC profiles, although the SOC curves of IPLO and the original PLO appear almost identical, particularly in the first and second study cases, this does not imply a similar performance. Even minor variations in SOC lead to substantial improvements in total cost; this behavior occurs because the RWE mechanism contributes to this behavior by introducing small, adaptive steps around promising regions of the search space, refining scheduling decisions without significantly changing the SOC profile, demonstrating that the enhancements improve economic efficiency while preserving stable battery operation. Additionally, SOC values are highly bounded by operational and health constraints; large deviations would neither be expected nor beneficial, and IPLO achieves better results by fine-tuning the timing and magnitude of charge and discharge events within these limits.
The statistical results clearly demonstrate the superiority and robustness of the IPLO. The Friedman test reveals significant performance differences among all algorithms (p ≪ 0.05), with IPLO achieving the best overall average rank (1.00), indicating a consistent top performance across all scenarios. Wilcoxon rank-sum tests further confirm this dominance, as IPLO records statistically significant wins against nearly all competitors in every case.
Descriptive statistics reinforce these findings by highlighting IPLO’s exceptional stability. Across all cases, IPLO exhibits the 2nd smallest ranges and standard deviations, confirming a reliable convergence and minimal sensitivity to scenario variations. While PLO shows zero variance due to its deterministic nature, it consistently yields higher costs, demonstrating that stability alone is insufficient without solution quality. In contrast, algorithms such as HO, WOA, and COA display large variability and wide performance ranges, reflecting unstable search behavior.
Overall, IPLO effectively balances exploration and exploitation, achieving a superior solution quality without sacrificing robustness. This combination of statistical superiority, consistency, and adaptability confirms its suitability for complex, real-world optimization problems where dependable performance across diverse operating conditions is essential.
5. Conclusions
This study has presented IPLO as an optimization framework for EV charging cost minimization under diverse operating conditions. Comprehensive statistical analyses, including Friedman rankings, Wilcoxon rank-sum tests, and descriptive metrics, consistently demonstrated that IPLO achieves a superior solution quality, stability, and robustness compared to state-of-the-art optimizers. The integration of random walks and adaptive Parameter Tuning significantly enhanced the exploration–exploitation balance, yielding substantial cost improvements and a smoother convergence behavior. Moreover, the cost–battery adaptive model strengthened decision-making by incorporating battery health and price dynamics, resulting in practical, stable, and durable scheduling outcomes. Despite the slight increase in variability compared to the original method, IPLO’s reliable convergence, balanced search mechanism, and consistently superior performance justify this trade-off. Overall, IPLO emerges as a competitive and well-balanced optimizer, particularly suited for complex, dynamic EV energy management problems where accuracy, adaptability, and robustness are critical.
Author Contributions
Conceptualization, A.B. and F.J.; methodology, A.B. and F.J.; software, A.B. and S.K.; validation, A.B. and S.K.; formal analysis, S.K.; investigation, A.B. and S.K.; resources, A.B., S.K. and F.J.; data curation, A.B., S.K. and F.J.; writing—original draft, F.J.; writing—review and editing, S.K. and F.J.; visualization, A.B. and S.K.; supervision, S.K.; project administration, F.J.; funding acquisition, F.J. All authors have read and agreed to the published version of the manuscript.
Funding
This research received no external funding.
Data Availability Statement
The original contributions presented in this study are included in the article. Further inquiries can be directed to the corresponding author.
Acknowledgments
The authors acknowledge the use of graphic elements from Canva’s library. During the preparation of this manuscript, the authors used ChatGPT(GPT-4/GPT-4.1 model). OpenAI, San Francisco, CA, USA. Available online: https://chat.openai.com (accessed on 15 September 2025). Gemini (Google, Gemini 1.5 model), Available online: https://gemini.google.com (accessed on 19 November 2025) to improve language quality and readability. The authors reviewed and edited all generated content and take full responsibility for the final content of this publication.
Conflicts of Interest
The authors declare no conflicts of interest. The foundations had no role in the design of the study, the collection, analysis, or interpretation of data, the writing of the manuscript, or the decision to publish the results.
Abbreviations
The following abbreviations are used in this manuscript:
| Symbol | Description | Unit |
| i | Index of search agent/solution | – |
| k | Interval index | – |
| P | Population size | – |
| D | Problem dimension | – |
| MaxFEs | Maximum number of function evaluations | – |
| T | Total number of iterations | – |
| Final cost function | Rs | |
| Charging cost component | Rs | |
| Discharging revenue/cost component | Rs | |
| Total charging cost objective | Rs | |
| SOC at interval k | – | |
| Charging/discharging state indicator (G2V/V2G) | – | |
| Available battery capacity at interval k | Ah | |
| Battery capacity reference | Ah | |
| Electricity price | Rs | |
| Battery nominal voltage | Volt | |
| Battery degradation Responsive Operational Scaling Factor | – | |
| Price Responsive Operational Scaling Factor | – | |
| , | SOH-Aware SOC Regulation Factors | – |
| Charging/discharging damping constants | – | |
| Degradation sensitivity coefficient | – | |
| Random number uniformly distributed in ([0, 1]) | – | |
| Random number uniformly distributed in ([0, 1]) | – | |
| ȵ | Charging efficiency | – |
| SOC | State of charge | – |
| ∆SOCcharge | Maximum chargeable SOC | – |
| ∆SOCdischarge | Maximum dischargeable SOC | – |
| ∆SOCmin | Minimum limit for SOC deviation | – |
| , | Charging and discharging SOC variations | |
| Particle of population N and dimension D position | – | |
| Lower bound | – | |
| Upper bound | – | |
| Updated aurora oval weight after PRPT | – | |
| Mass | – | |
| Particle charge | – | |
| Velocity | – | |
| Magnetic field strength | – | |
| Perturbation applied to damping factor | – | |
| Constant | – | |
| Levy flight stability control | – | |
| d | Levy flight step size | – |
| Ao | Change in particle position expression | – |
| Xavg | Average position of all particles | – |
| , r2, r3, r4, r5 | Random factor | – |
| W1 | Local search intensity weight | – |
| W2 | Global search intensity weight | – |
| K | Collision probability factor | – |
| α | Step controlling factor | – |
| n | Random value from normal distribution | – |
| Xi | Particle i position | – |
| ΔX | Random step size | – |
| RWE particle updated position | – | |
| w1new | Updated local search weight | – |
| w2new | Updated global search weight | – |
| αnew | Updated damping factor | – |
| δα | Random damping factor perturbation | – |
| δw1 | Local search weight perturbation step | – |
| δw2 | Global search weight perturbation step | – |
| δα | Damping factor perturbation | – |
References
- Schade, C.; Aliasghari, P.; Egging-Bratseth, R.; Pfister, C. Least cost vehicle charging in a smart neighborhood considering uncertainty and battery degradation. Batteries 2025, 11, 104. [Google Scholar] [CrossRef]
- Yadav, J.; Shukla, D.; Karvir, P. Electrical vehicle past, present and future—A review. In Proceedings of the AIP Conference Proceedings; AIP Publishing: Melville, NY, USA, 2024; Volume 3178, p. 070010. [Google Scholar]
- Singh, S.; Vaidya, B.; Mouftah, H.T. Smart EV charging strategies based on charging behavior. Front. Energy Res. 2022, 10, 773440. [Google Scholar] [CrossRef]
- Eltohamy, M.S.; Saber, A.; Tawfiq, M.H.; Ahmed, M.M.R.; Alaas, Z.; Mohammed, B.; Ahmed, I.; Youssef, H.; Raouf, A. A comprehensive review of vehicle-to-grid (V2G) technology: Technical, economic, regulatory, and social perspectives. Energy Convers. Manag. X 2025, 15, 101138. [Google Scholar] [CrossRef]
- Yadav, N.K.; Das, S. Optimal V2G and G2V scheduling for cost-effective power management in distribution systems. In Proceedings of the IEEE 4th International Conference on Sustainable Energy and Future Electric Transportation (SEFET); IEEE: New Delhi, India, 2024. [Google Scholar]
- Ahwiadi, M.; Wang, W. Battery health monitoring and remaining useful life prediction techniques: A review. Batteries 2025, 11, 31. [Google Scholar] [CrossRef]
- Alaee, P.; Bems, J.; Anvari-Moghaddam, A. A review of the latest trends in technical and economic aspects of EV charging management. Energies 2023, 16, 3669. [Google Scholar] [CrossRef]
- Iversen, E.B.; Morales, J.M.; Madsen, H. Optimal charging of an electric vehicle using a Markov decision process. Appl. Energy 2014, 123, 1–12. [Google Scholar] [CrossRef]
- Sahinidis, N.V. Optimization under uncertainty: State-of-the-art and opportunities. Comput. Chem. Eng. 2004, 28, 971–983. [Google Scholar] [CrossRef]
- Sowmya, R.; Sankaranarayanan, V. Optimal vehicle-to-grid and grid-to-vehicle scheduling strategy with uncertainty management using improved marine predator algorithm. Comput. Electr. Eng. 2022, 100, 107949. [Google Scholar]
- Huang, T.; Huang, F.; Qin, Z.; Pan, J. An improved polar lights optimization algorithm for global optimization and engineering applications. Sci. Rep. 2025, 15, 11581. [Google Scholar] [CrossRef]
- Chen, X.; Yang, S.; Wang, T.; Chye, E.U.; Voronin, V.; Qin, H. Research on improved polar lights optimization algorithm. Vestn. Pac. State Univ. 2024, 4, 59–66. [Google Scholar]
- Ahmed, M.; Kamel, S.H.; Abbasy, N.H.; Abouelseoud, Y. A Gaussian random walk salp swarm algorithm for optimal dynamic charging of electric vehicles. Appl. Soft Comput. 2023, 147, 110838. [Google Scholar] [CrossRef]
- Nassef, A.M.; Abdelkareem, M.A.; Maghrabie, H.M.; Baroutaji, A. The role of random walk-based techniques in enhancing metaheuristic optimization algorithms—A systematic review. IEEE Access 2024, 12, 139573–139608. [Google Scholar] [CrossRef]
- Kazikova, A.; Pluhacek, M.; Senkerik, R. Why tuning the control parameters of metaheuristic algorithms is so important for fair comparison? Mendel 2020, 26, 9–16. [Google Scholar] [CrossRef]
- Tatsis, V.A.; Ioannidis, D. Online cluster-based parameter control for metaheuristics. arXiv 2025, arXiv:2504.05144. [Google Scholar] [CrossRef]
- Wei, K. Dynamic Parameter Tuning Method with Presets for Metaheuristics. Master’s Thesis, University of Twente, Enschede, The Netherlands, 2022. [Google Scholar]
- Nagalla, S. Dynamic pricing for electric vehicle charging: A real-time optimization framework for grid stability and economic efficiency. Eur. J. Comput. Sci. Inf. Technol. 2025, 13, 42–53. [Google Scholar] [CrossRef]
- Chen, L.; He, L.; Zhou, Y. An exponential cone programming approach for managing electric vehicle charging. Oper. Res. 2024, 72, 2215–2240. [Google Scholar] [CrossRef]
- Wang, Z.; Jochem, P.; Fichtner, W. A scenario-based stochastic optimization model for charging scheduling of electric vehicles under uncertainties. J. Clean. Prod. 2020, 246, 119886. [Google Scholar] [CrossRef]
- Bakar, M.H.A.; Rasid, M.M.; Nasir, S.; Hussin, S.M.; Sapari, N.; Ramli, A. Modeling of battery degradation for energy scheduling of a grid-connected DC microgrid. In Proceedings of the IEEE 5th International Conference on Power Engineering Applications (ICPEA); IEEE: Shah Alam, Malaysia, 2025. [Google Scholar]
- Le, C.N.; Vinayagam, A.; Tran, P.T.; Stojcevski, S.; Dinh, T.N.; Stojcevski, A.; Chandran, J. State of health aware adaptive scheduling of battery energy storage system charging and discharging in rural microgrids using long short-term memory and convolutional neural networks. Energies 2025, 18, 5641. [Google Scholar] [CrossRef]
- Gu, S.; Qian, K.; Yang, Y. Optimization of electric vehicle charging and discharging strategies considering battery health state: A safe reinforcement learning approach. World Electr. Veh. J. 2025, 16, 286. [Google Scholar] [CrossRef]
- Sayed, K.; Aref, M.; Almalki, M.M.; Mossa, M.A. Optimizing fast charging protocols for lithium-ion batteries using reinforcement learning. Results Eng. 2025, 25, 104302. [Google Scholar] [CrossRef]
- Zhao, Z.; Kong, S.; Bo, B.; Li, X.; Hao, L.; Xu, F.; Chen, L. Research on battery aging and user revenue of electric vehicles in V2G scenarios. Electronics 2025, 14, 4567. [Google Scholar] [CrossRef]
- Yuan, C.; Zhao, D.; Heidari, A.A.; Liu, L.; Chen, Y.; Chen, H. Polar lights optimizer: Algorithm and applications in image segmentation and feature selection. Neurocomputing 2024, 607, 128427. [Google Scholar] [CrossRef]
- Kegeleirs, M.; Ramos, D.G.; Birattari, M. Random walk exploration for swarm mapping. In Towards Autonomous Robotic Systems; Springer: Cham, Switzerland, 2019; pp. 235–246. [Google Scholar]
- Gupta, S.; Deep, K. Random walk grey wolf optimizer for constrained engineering optimization problems. Comput. Intell. 2018, 34, 1025–1045. [Google Scholar] [CrossRef]
- Yaqoob, A.; Verma, N.K.; Aziz, R.M. Metaheuristic algorithms and their applications: A comprehensive review. In Metaheuristics for Machine Learning; Elsevier: Amsterdam, The Netherlands, 2024; pp. 1–35. [Google Scholar]
- Xue, J.; Shen, B. Dung beetle optimizer: A new meta-heuristic algorithm for global optimization. J. Supercomput. 2023, 79, 7305–7336. [Google Scholar] [CrossRef]
- Sahoo, S.K.; Saha, A.K.; Ezugwu, A.E.; Agushaka, J.O.; Abuhaija, B.; Alsoud, A.R.; Abualigah, L. Moth flame optimization: Theory, modifications, hybridizations and applications. Arch. Comput. Methods Eng. 2022, 30, 391–426. [Google Scholar] [CrossRef]
- Amiri, M.H.; Hashjin, N.M.; Montazeri, M.; Mirjalili, S.; Khodadadi, N. Hippopotamus optimization algorithm: A novel nature-inspired optimization algorithm. Sci. Rep. 2024, 14, 5032. [Google Scholar] [CrossRef] [PubMed]
- Zhao, S.; Zhang, T.; Ma, S.; Wang, M. Sea-horse optimizer. Appl. Intell. 2023, 53, 11833–11860. [Google Scholar] [CrossRef]
- Abualigah, L.; Abualigah, R.; Ikotun, A.M.; Zitar, R.A.; Alsoud, A.R.; Khodadadi, N.; Ezugwu, A.E.; Hanandeh, E.S.; Jia, H. Whale optimization algorithm: Analysis and survey. In Metaheuristic Optimization Algorithms; Morgan Kaufmann: Burlington, MA, USA, 2024; pp. 105–115. [Google Scholar]
- Dehghani, M.; Montazeri, Z.; Trojovská, E.; Trojovský, P. Coati optimization algorithm: A new bio-inspired metaheuristic algorithm for solving optimization problems. Knowl.-Based Syst. 2023, 259, 110011. [Google Scholar] [CrossRef]
- Rahman, T.; Alharbi, T. Exploring lithium-ion battery degradation. Batteries 2024, 10, 220. [Google Scholar] [CrossRef]
- Zhang, J.; Wang, S.; Ono, K. Electrochemical impedance spectroscopy. In Microscopy and Microanalysis for Lithium-Ion Batteries; CRC Press: Boca Raton, FL, USA, 2023; pp. 301–350. [Google Scholar]
- Gismero, A.; Nørregaard, K.; Johnsen, B.; Stenhøj, L.; Stroe, D.-I.; Schaltz, E. EV battery state-of-health estimation using incremental capacity analysis. J. Energy Storage 2023, 64, 107110. [Google Scholar] [CrossRef]
- Lee, J.; Won, J. Enhanced coulomb counting for SoC and SoH estimation. IEEE Access 2023, 11, 15449–15459. [Google Scholar] [CrossRef]
- Zhang, H.; Li, Y.; Zheng, S.; Lu, Z.; Gui, X.; Xu, W.; Bian, J. Battery lifetime prediction across diverse ageing conditions with inter-cell deep learning. Nat. Mach. Intell. 2025, 7, 270–277. [Google Scholar] [CrossRef]
- Zhang, H.; Gui, X.; Zheng, S.; Lu, Z.; Li, Y.; Bian, J. BatteryML: An open-source platform for machine learning on battery degradation. In Proceedings of the International Conference on Learning Representations (ICLR), Vienna, Austria, 7–11 May 2024. [Google Scholar]
- Anthony Jnr, B.; Petersen, S.A.; Ahlers, D.; Krogstie, J. API deployment for big data management towards sustainable energy prosumption in smart cities—A layered architecture perspective. Int. J. Sustain. Energy 2020, 39, 263–289. [Google Scholar] [CrossRef]
- Shirley, J.A.J.; Pooja, R.P.; Reddy, M.J.B. Metaheuristic algorithm-based energy management system for EV charging stations. IEEE Access 2024, 12, 116354–116367. [Google Scholar] [CrossRef]


Disclaimer/Publisher’s Note: The statements, opinions and data contained in all publications are solely those of the individual author(s) and contributor(s) and not of MDPI and/or the editor(s). MDPI and/or the editor(s) disclaim responsibility for any injury to people or property resulting from any ideas, methods, instructions or products referred to in the content. |
© 2026 by the authors. Licensee MDPI, Basel, Switzerland. This article is an open access article distributed under the terms and conditions of the Creative Commons Attribution (CC BY) license.