Abstract
The mechanical properties of metals produced by Wire Arc Additive Manufacturing (WAAM) differ significantly from those of rolled sheets due to their cast-like structure and repeated thermal cycling. This study aims to develop a predictive model capable of accurately estimating the stress–strain behavior of deposited metal based on process parameters. To achieve this, a series of experiments were conducted, and test specimens were produced. Arc current and deposition rate were selected as factors in a quasi-D-optimal experimental design. Tensile test data were analyzed using the least squares method, resulting in the derivation of regression equations that relate the stress–strain characteristics to the deposition parameters. To verify that the location of specimen extraction does not influence the test results, both thermal modeling and metallographic analysis were employed. Three key findings were established: (1) Thermal simulations and metallographic observations indicate that after the deposition of the first 5–6 layers, the microstructure becomes relatively similar; (2) significant microstructural variation occurs only in the final layer; and (3) six new regression equations were developed to predict the mechanical properties of the deposited metal based on WAAM process parameters.
1. Introduction
Wire and Arc Additive Manufacturing (WAAM) is among the most promising directions in advanced manufacturing technologies. While WAAM has been successfully applied to produce cost-effective parts made of polymer materials (mainly thermoplastics), the production of metallic components with mechanical properties comparable to those obtained via conventional manufacturing remains a challenge. Therefore, studying the mechanical properties of metals and alloys fabricated using WAAM is of particular relevance. To date, research in this field has primarily focused on aluminum alloys [1,2,3,4,5,6,7] and titanium alloys [5,6,7,8,9], due to their widespread application in aerospace and space technologies and their favorable compatibility with WAAM. However, an increasing number of studies have also explored the application of WAAM to low-carbon steels, low-alloy steels, and other steel types [10,11,12,13,14,15,16,17,18,19,20,21,22,23,24,25]. Extensive research has examined the microstructure [5,16,22], hardness [17,22,24], residual stresses [7,11,22], fatigue behavior [10,17,18,19,20,23], and strength characteristics [15,16,18] of WAAM-fabricated components, as well as methods to enhance their structural performance [7,8,9,17]. The geometry of the deposited layers and its mathematical representation have also been studied, with parabolic and elliptical models being the most commonly used [7,26,27,28,29,30,31,32]. Numerical simulations using software such as SIMULIA Abaqus Standard 2019, have enabled the development of thermo-mechanical models for layer-by-layer deposition [11,12,19,21]. Additionally, analytical models based on thermo-capillary theory [13], neural network-based models for predicting single bead geometry [7], fatigue life prediction models (e.g., Basquin-Coffin-Manson, Smith-Watson-Topper, and total strain energy density models) [20], and micro-mechanical models such as the elasto-viscoplastic FFT-based (EVPFFT) model [25] have also been proposed. Thermal modeling remains a central focus of simulation efforts [7,33,34,35,36,37,38,39,40], often using the Goldak double-ellipsoid heat source model [7,34,36,38]. Despite the substantial progress made in geometric and thermal modeling, only limited data are available regarding the accurate prediction of mechanical properties. Notable exceptions include hardening models such as four-linear or bilinear-plus-nonlinear approaches and two-stage Ramberg–Osgood models for regular and high-strength steels in additive manufacturing, which have shown good agreement with experimental stress–strain curves [14]. Several studies have explored the influence of parameters such as heat input, wire feed rate, and travel speed on bead geometry and resulting mechanical properties [41,42,43,44,45,46,47]. However, no comprehensive models currently exist to directly relate WAAM process parameters—specifically, arc current and deposition rate—to the resulting stress–strain behavior of the material. Expanding the industrial applicability of WAAM demands the ability to predict the mechanical properties of widely available materials based on process settings. Thus, the objective of this study is to develop a model that enables sufficiently accurate prediction of the stress–strain characteristics of WAAM-fabricated metals as a function of key process parameters.
To evaluate the proposed model, a well-known material was selected. The methodological approach consists of four main stages:
- Design of experiments;
- Execution of the experimental campaign;
- Verification through thermal field simulation and microstructural analysis;
- Correlation of process parameters with mechanical properties.
To validate the reliability of the results, a combined analysis of thermal cycles and metallographic observations is performed.
2. Materials and Methods
2.1. Materials
In this study, the additive material used was a welding wire with designation EN ISO 14341-A: G 38 3CM 3Si1 [48], having a diameter of 1.0 mm. The substrate material was S355JR structural steel, in accordance with EN ISO 10025 [49], with dimensions of 6 × 120 × 300 mm. The chemical compositions of both the welding wire (as specified in the material certificate) and the substrate (as defined by the standard) are presented in Table 1.

Table 1.
Chemical composition of the used materials in wt % (Fe ball.).
2.2. Experimental Samples and Examination Methods
The test specimens were fabricated using a reciprocating motion of the electric arc relative to the workpiece during GMAW-based WAAM (Figure 1a). The arc current ranged from 70 to 170 A, while the travel speed varied between 12 and 30 cm/min. After detaching the substrate, samples intended for metallographic analysis (Figure 1b) were extracted. The deposited metal was then mechanically processed to remove lateral surface irregularities. Flat tensile specimens, prepared in accordance with EN ISO 6892 [50], were produced via laser cutting. Tensile testing was performed using an HA-250 servo-hydraulic testing machine (Zwick/Roell, Ulm, Germany) (Figure 2).
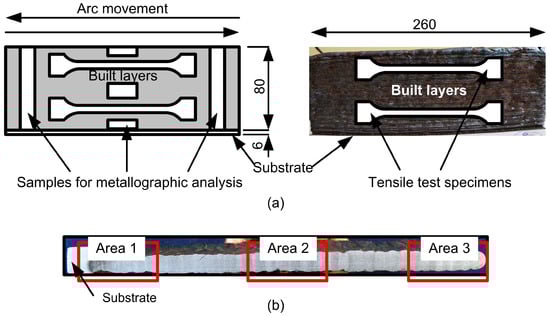
Figure 1.
Diagram of torch movement when building and test specimens produced by WAAM (a) and areas from which the samples for metallographic analysis were cut out (b).
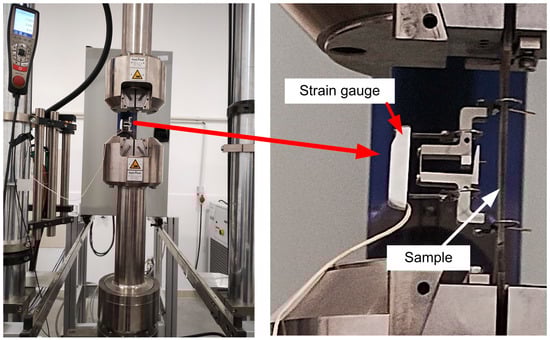
Figure 2.
One-dimensional tensile testing machine with strain gauge installed.
The methods used to analyze the obtained experimental results can be summarized as follows:
- To perform a qualitative regression analysis of the results, a quasi-D-optimal design of experiments was applied for two factors (X1 and X2), along with a second-degree full polynomial regression model (Table 2) [51]. The arc current (X1) and the travel speed (X2) were used as the independent variables. The experiments were conducted using a Parweld XTM 211 D1 power source (Bewdley, England) and a modified Wanhao D12/500 3D printer (China), adapted for metal additive manufacturing.
Table 2. The design of experiment in relative coordinates of the factors.
- Changes in the microstructure of the printed metal during multilayer deposition were examined on metallographic cross-sections taken from the lower (area 1), middle (area 2), and upper (area 3) regions of the test samples (Figure 1b). The samples were prepared according to standard procedures, including grinding, polishing, and etching with a 5% HNO3 solution in C2H5OH. The analysis was conducted using a JENAVERT optical microscope (ZEISS, Oberkochen, Germany) equipped with a TOUCH VIEW digital camera.
- The influence of the deposition process on the microstructure at the sample cut locations was evaluated using a simulation model that solved the thermal problem for the deposited specimen.
- Tensile tests were conducted on the cut samples, and regression equations were derived based on the results obtained.
The first six experiments in the design of experiments (Table 2) constitute a discrete saturated D-optimal plan for a second-degree polynomial model. The subsequent experiments were added to progressively improve the prediction accuracy across the orthogonal factor space [51]. To verify the adequacy of the model according to Fisher’s criterion, six additional experiments were conducted at the center of the design (i.e., with zero-level values of the factors). The data from these central point experiments were not used in the calculation of the regression coefficients. The statistical significance of the obtained coefficients was assessed using Student’s t-test. The resulting regression equations are of the following form:
Here, represents the vector of the regression coefficients, is the vector of factors, and is the predicted value of the corresponding response variable. The functions are the products of the factor variables associated with each coefficient. When applied to the j-th experiment, Equation (1) takes the following form:
The vector of the regression coefficients is calculated as follows:
Here, denotes the extended design matrix, , while represents the vector of measured values of the analyzed variable. Fisher’s exact test was applied to assess the adequacy of the regression model. The statistical significance of the calculated coefficients was evaluated using Student’s t-test.
The simulation model was developed following the methodology described in a previous study [39]. It incorporates several features specific to the WAAM process: The heat source is distributed within the deposited layer; the cross-sectional shape of the deposited bead is modeled as a segment of an ellipse; and the progressive filling of the domain with metal is accounted for, with the material properties transitioning from those of air to those of the deposited metal during the build-up process. Accordingly, the power density of the heat source is defined as (W/m3). Here, is the effective thermal power of the arc, defined as (W) where is the thermal efficiency, (A) is the arc current, and (V) is the arc voltage. The heat source is defined in a moving coordinate system attached to the electric arc. When the heat source moves along a linear trajectory and each layer is completed with a single pass (as in the present case), the problem can be reduced to a two-dimensional formulation. In the version applied here, the asymmetry of thermal power distribution along the -axis (in front of and behind the arc) is retained. However, the thermal power transferred from the arc to the deposited bead over the spatial interval from to is assumed to be uniformly distributed within a volume , where is the cross-sectional area of the deposited bead under consideration. Function (4) describes the distribution of thermal power along the -axis. It must satisfy a normalization condition such that the total integrated power equals the effective power of the arc (), and it must be continuous, which requires that the function and its first derivative are continuous across the transition point, which means the following condition must be satisfied—.
Here, and are the coefficients describing the power distribution between the front and rear parts of the heat source, respectively; and are the variances of the normal distribution for the front and rear portions of the heat source. The final form of the equation describing the heat source is as follows:
Here, and represent the geometric dimensions of the heat source in front of and behind the arc, respectively; denotes the cross-sectional area of the deposited bead; and and are the height and width of the bead, respectively.
3. Results and Discussion
3.1. Analysis of Thermal Processes and Microstructure
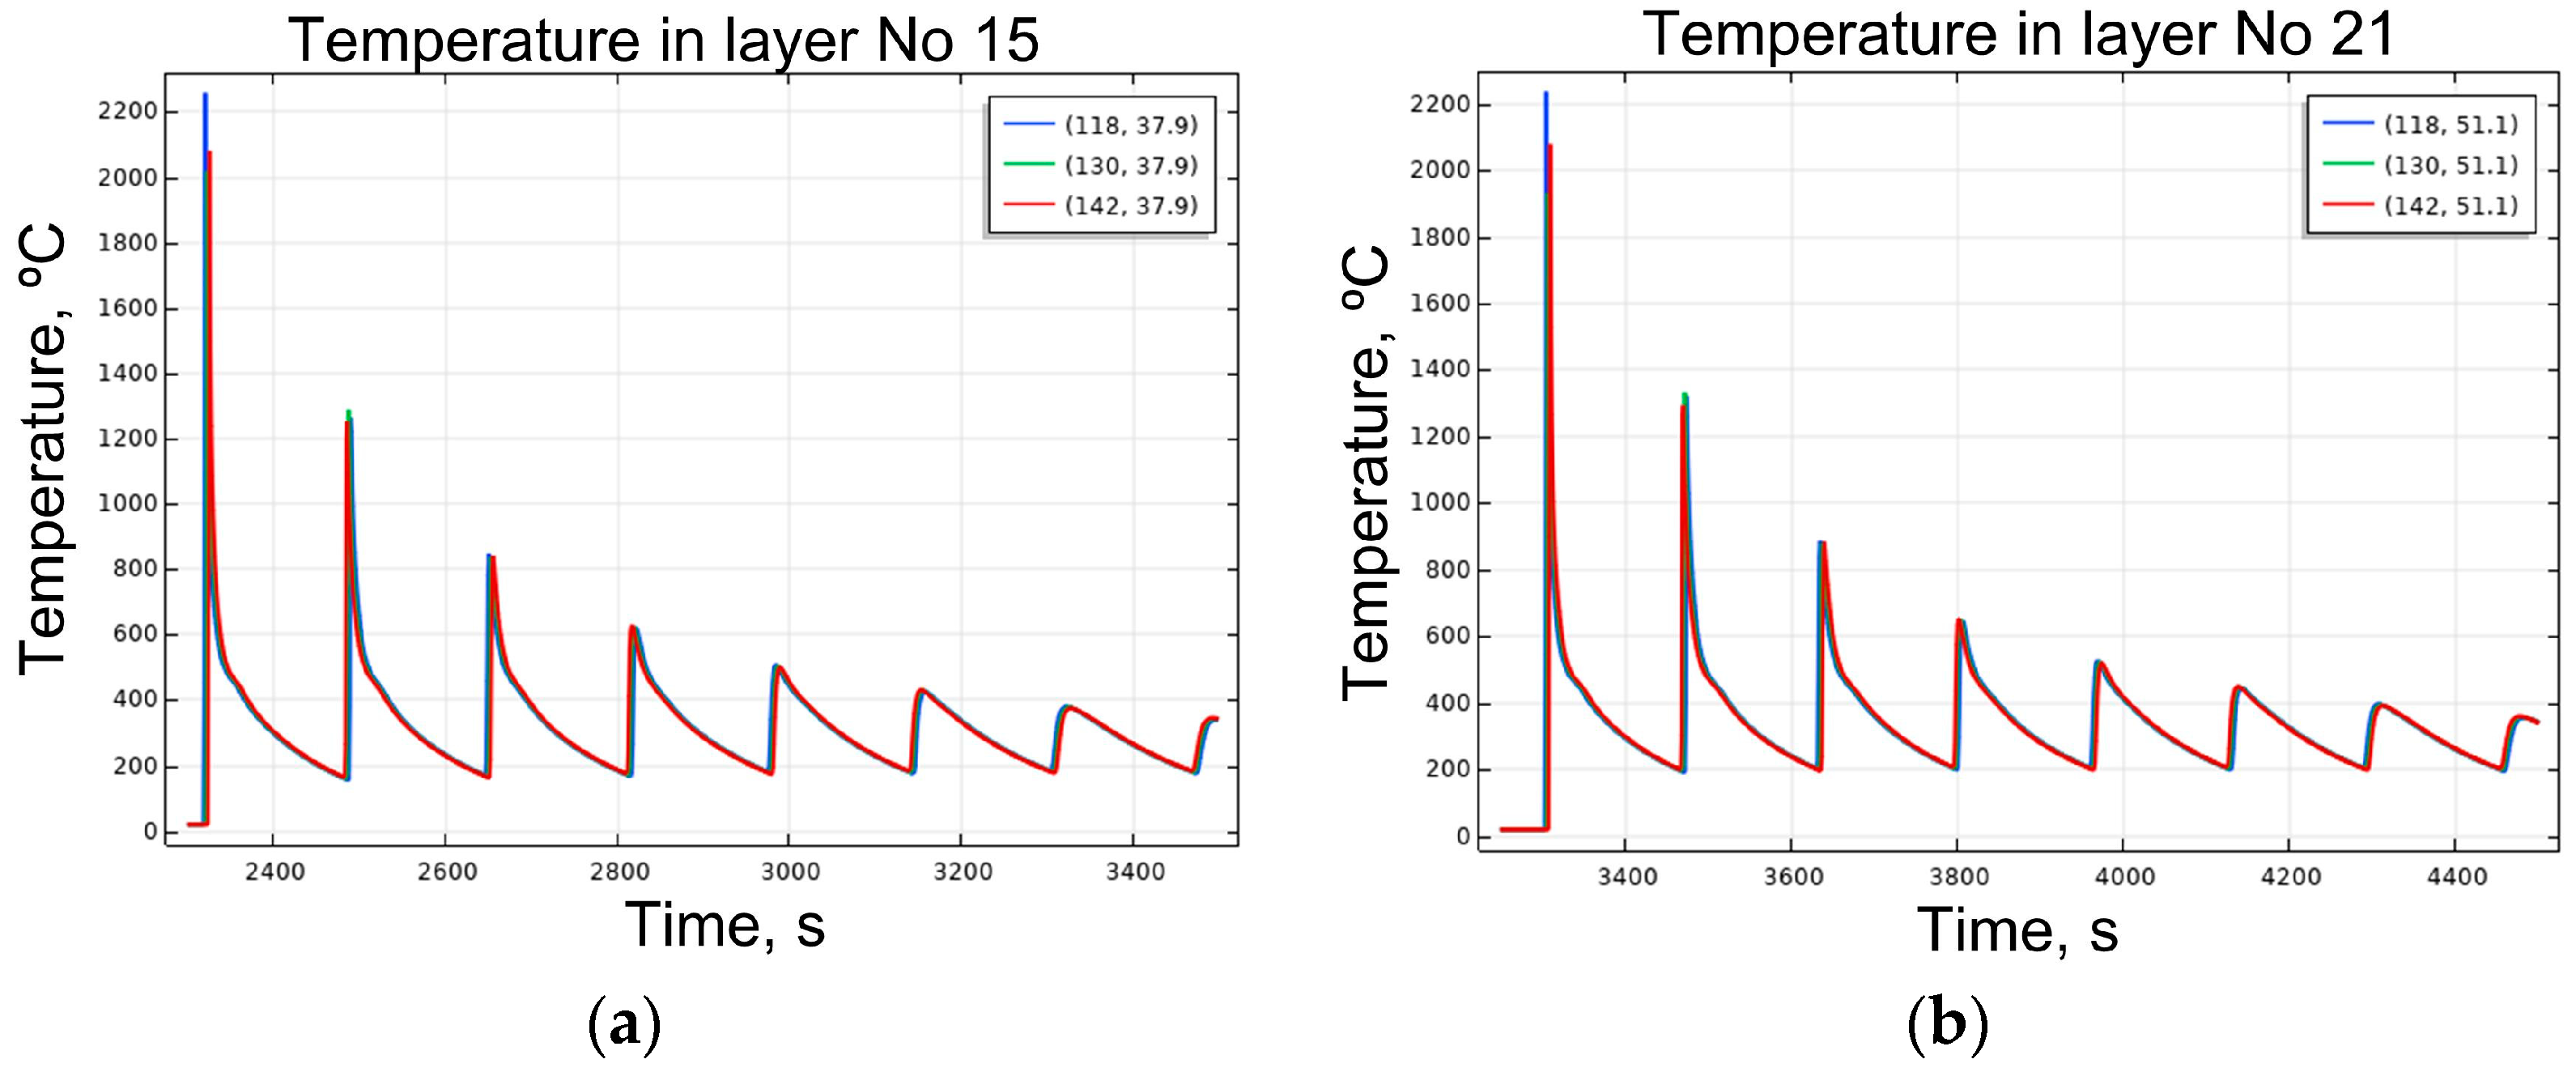
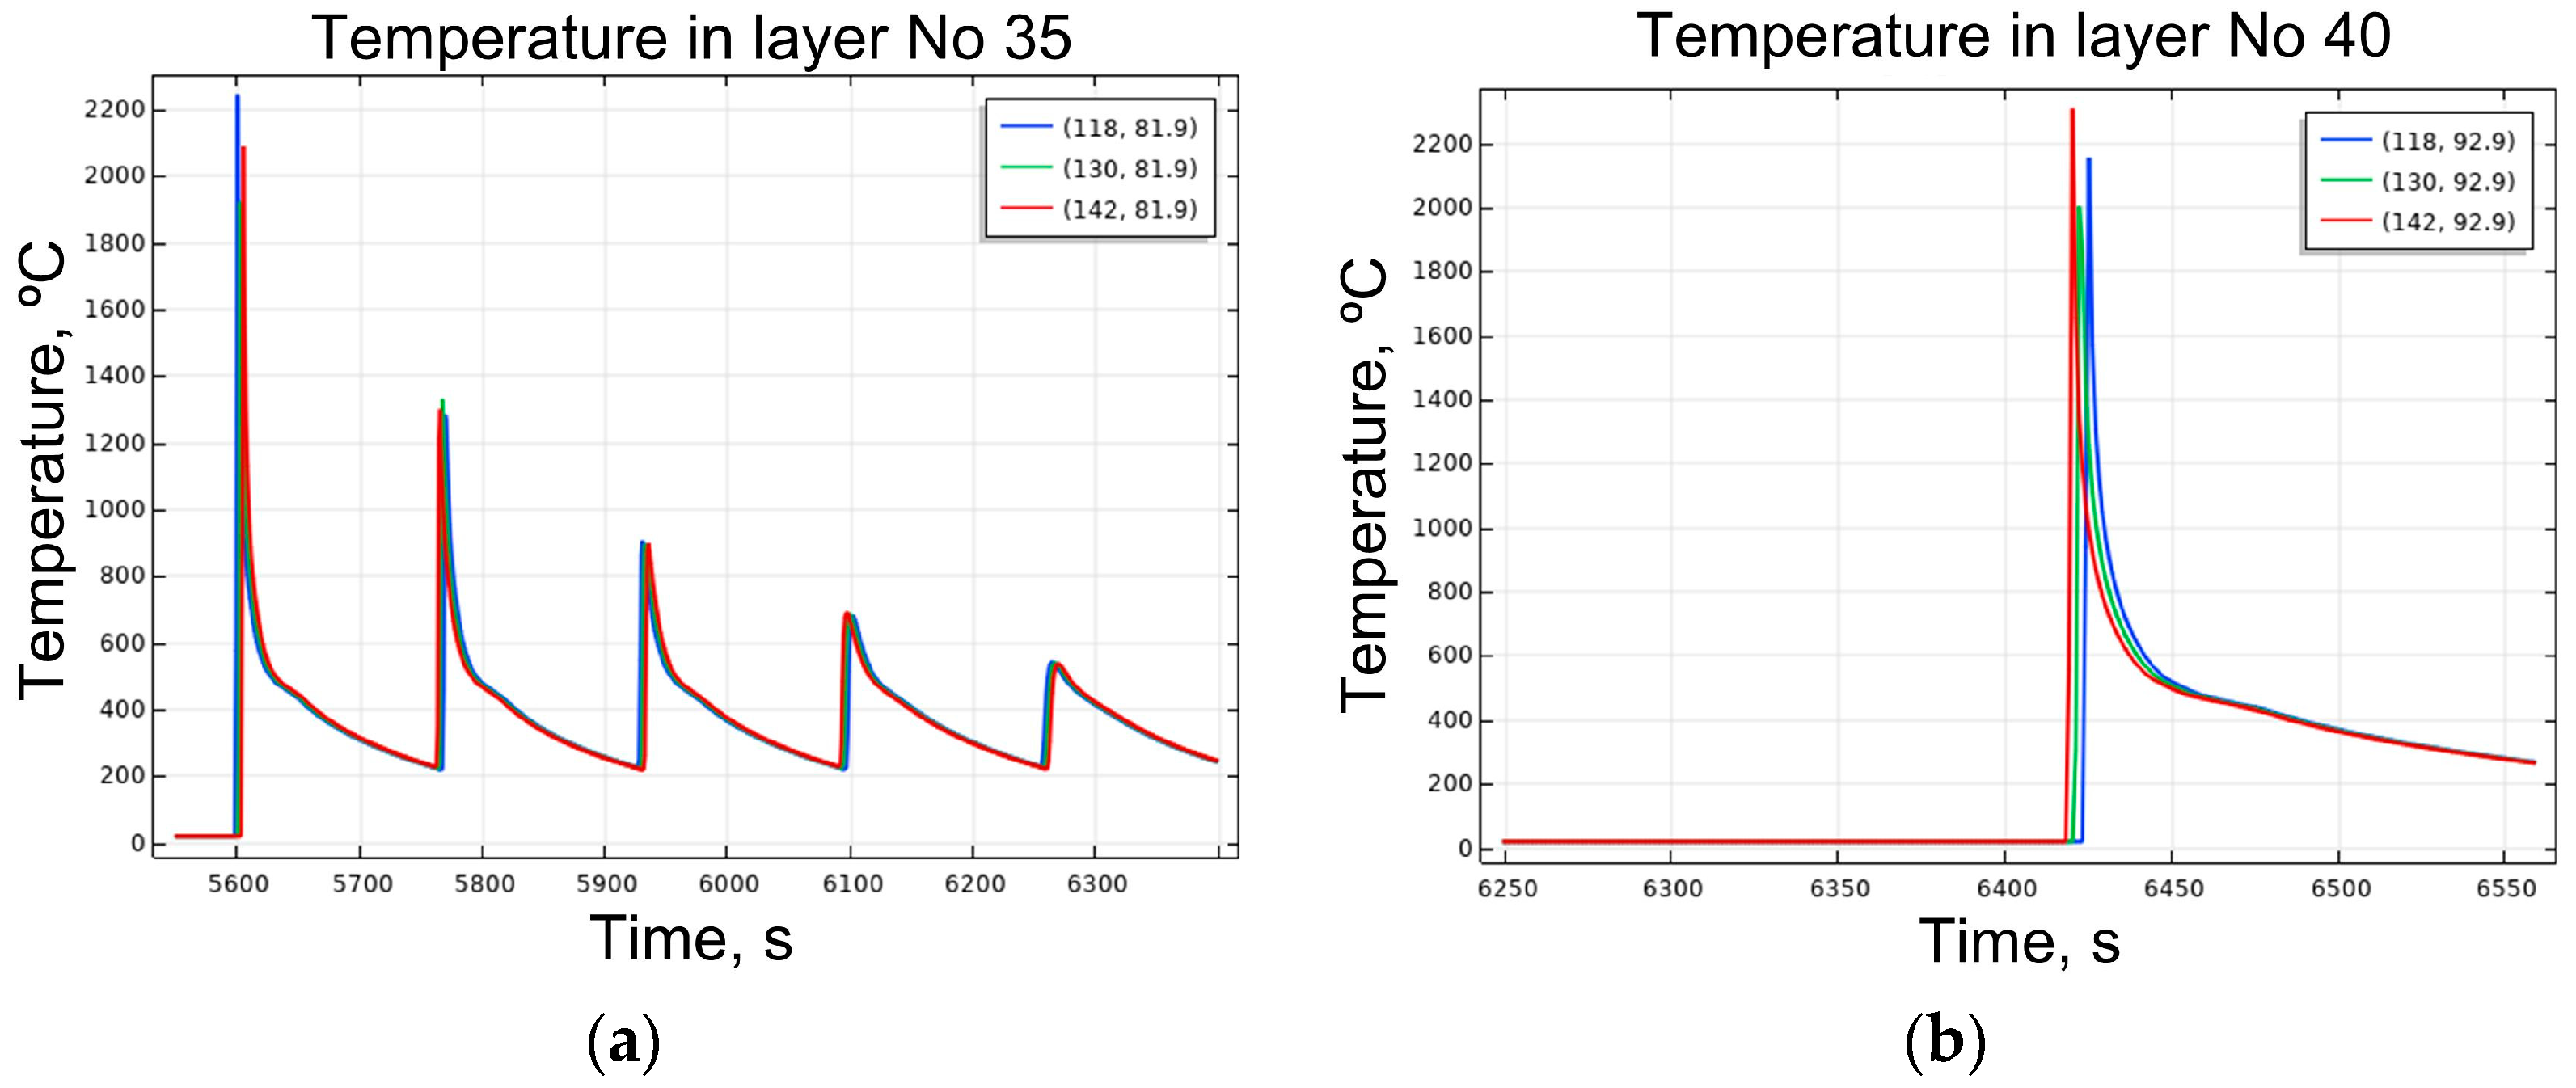
Using the heat transfer model, temperature profiles were traced at control points located 118, 130, and 142 mm from the left edge of the test specimen. These coordinates correspond to the region where the strain gauge was positioned during the tensile tests. To assess potential changes in the metal microstructure due to repeated heating and cooling cycles, only the initial portions of the temperature curves were analyzed. Figure 3 presents temperature curves for layers 15 and 21. The data indicate that, starting from layer 15, the thermal cycles become quite similar. Since each test specimen consists of 40 layers, layer 21 lies approximately at mid-height. The height of a single layer is approximately 2.2 mm. These results suggest that if the specimen is cut at least 30 mm above the bottom edge, the microstructure—and, thus, the material properties—will be consistent across the section. Up to layer 35, the temperature curves remain quite similar (Figure 4a). A noticeable qualitative difference is observed in the final layer (Figure 4b), where no post-deposition heat treatment occurs. These findings confirm that the tested portions of the specimens fall within zones of uniform thermal history.
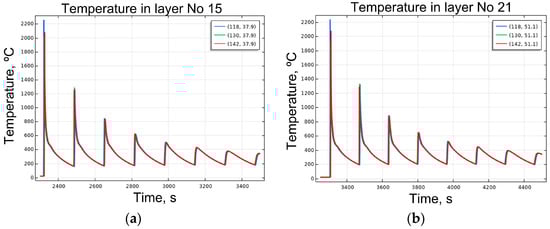
Figure 3.
Temperature change at the control points of layer 15 (a) and layer 21 (b).
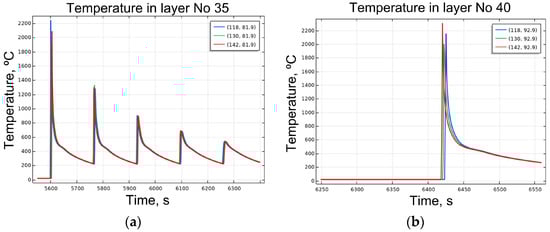
Figure 4.
Temperature change at the control points of layer 35 (a) and layer 40 (b).
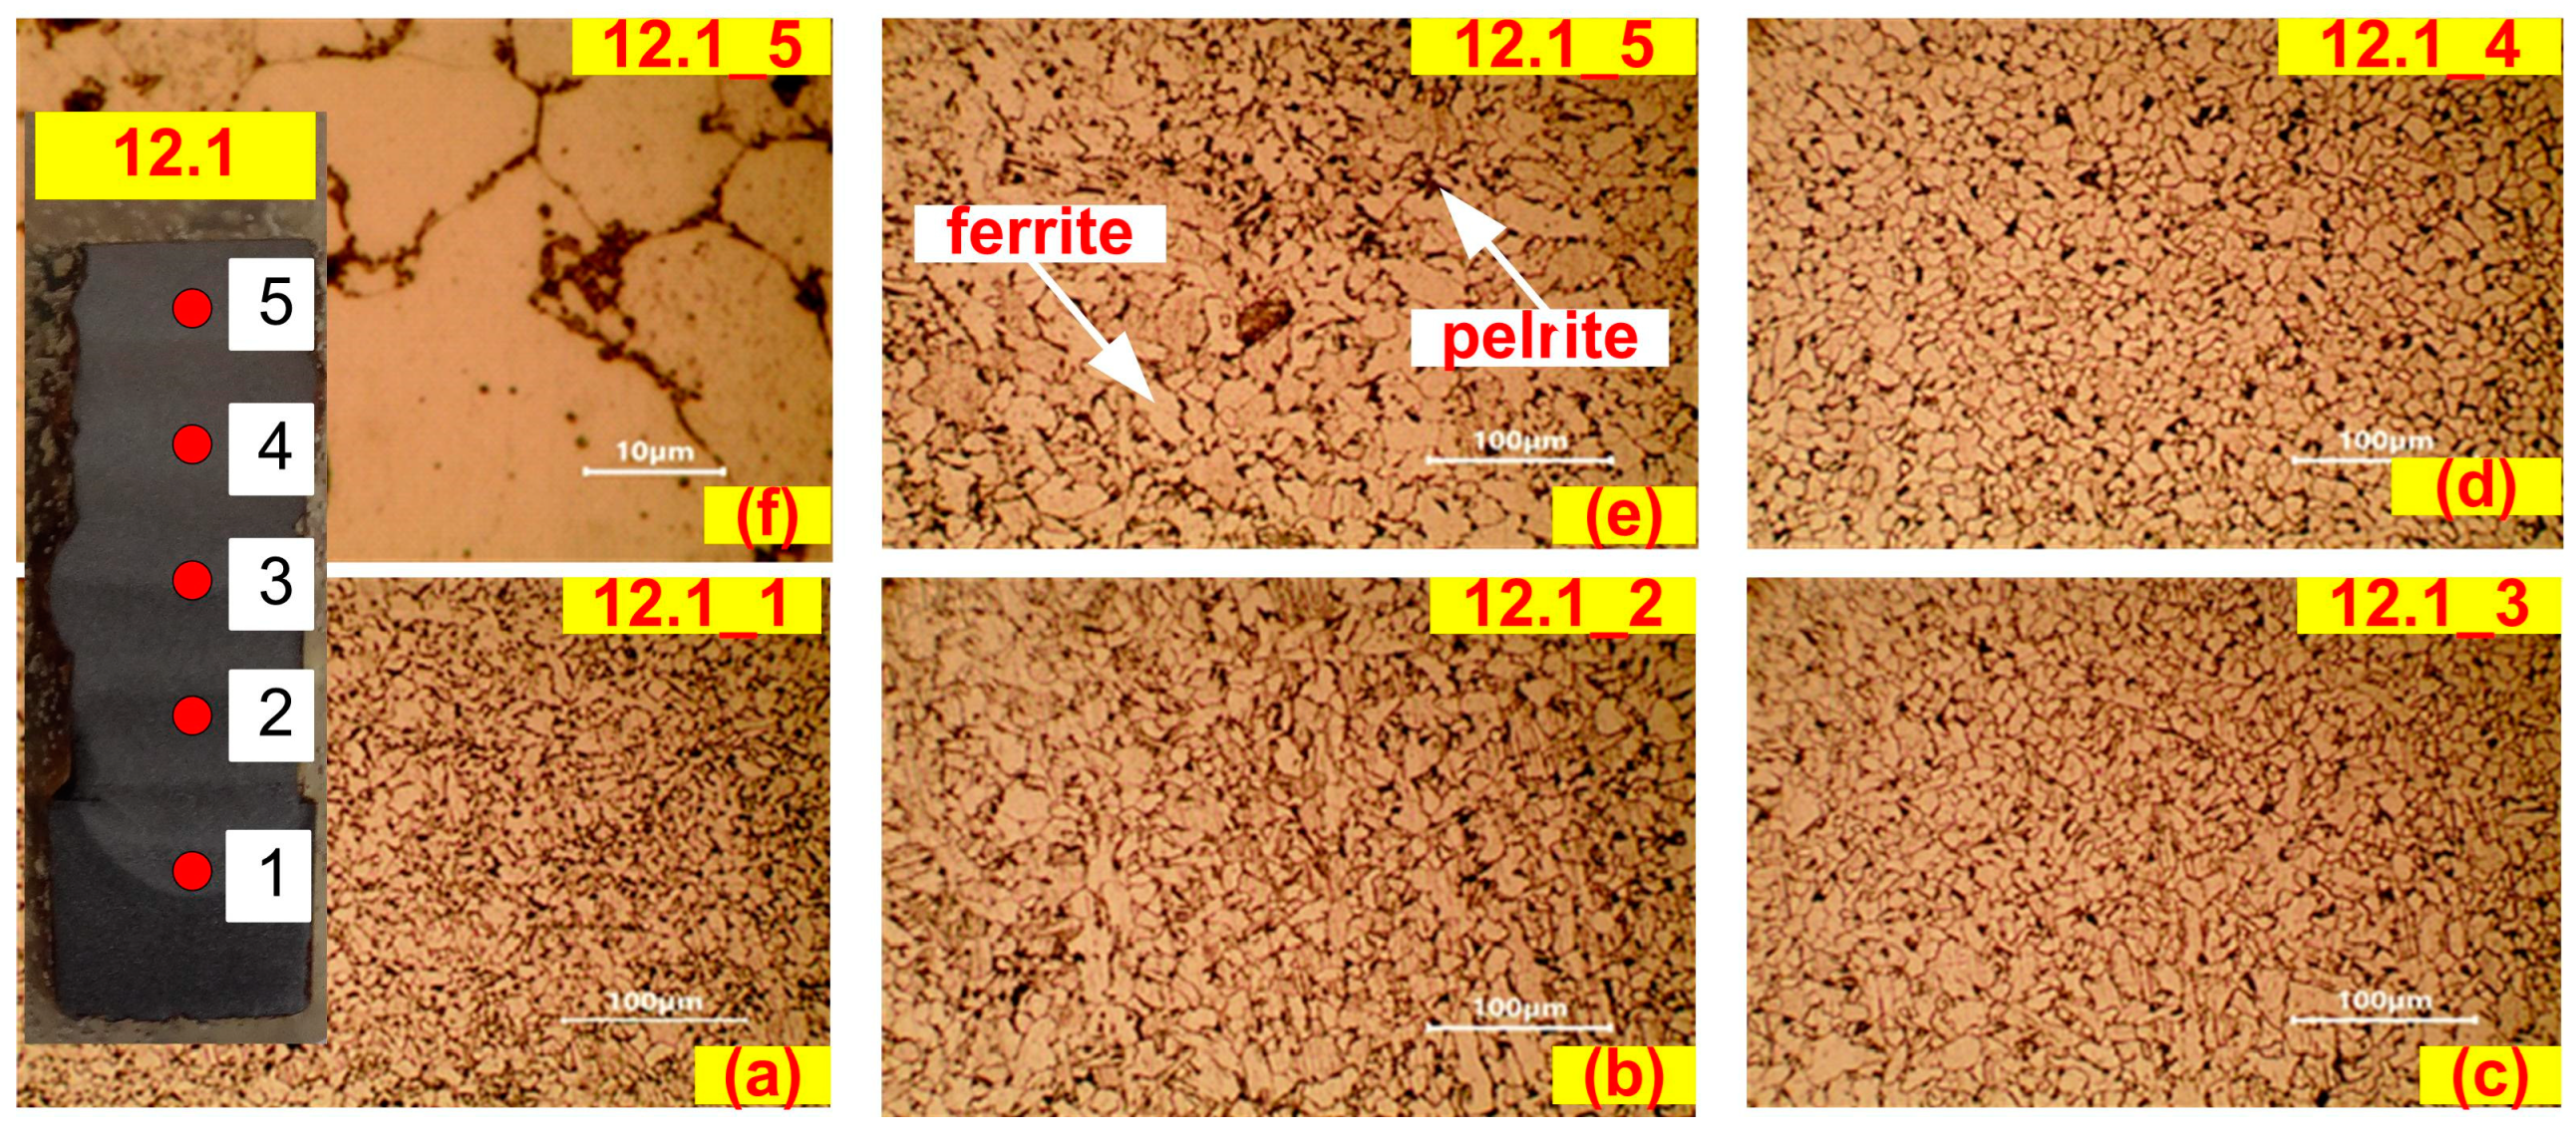
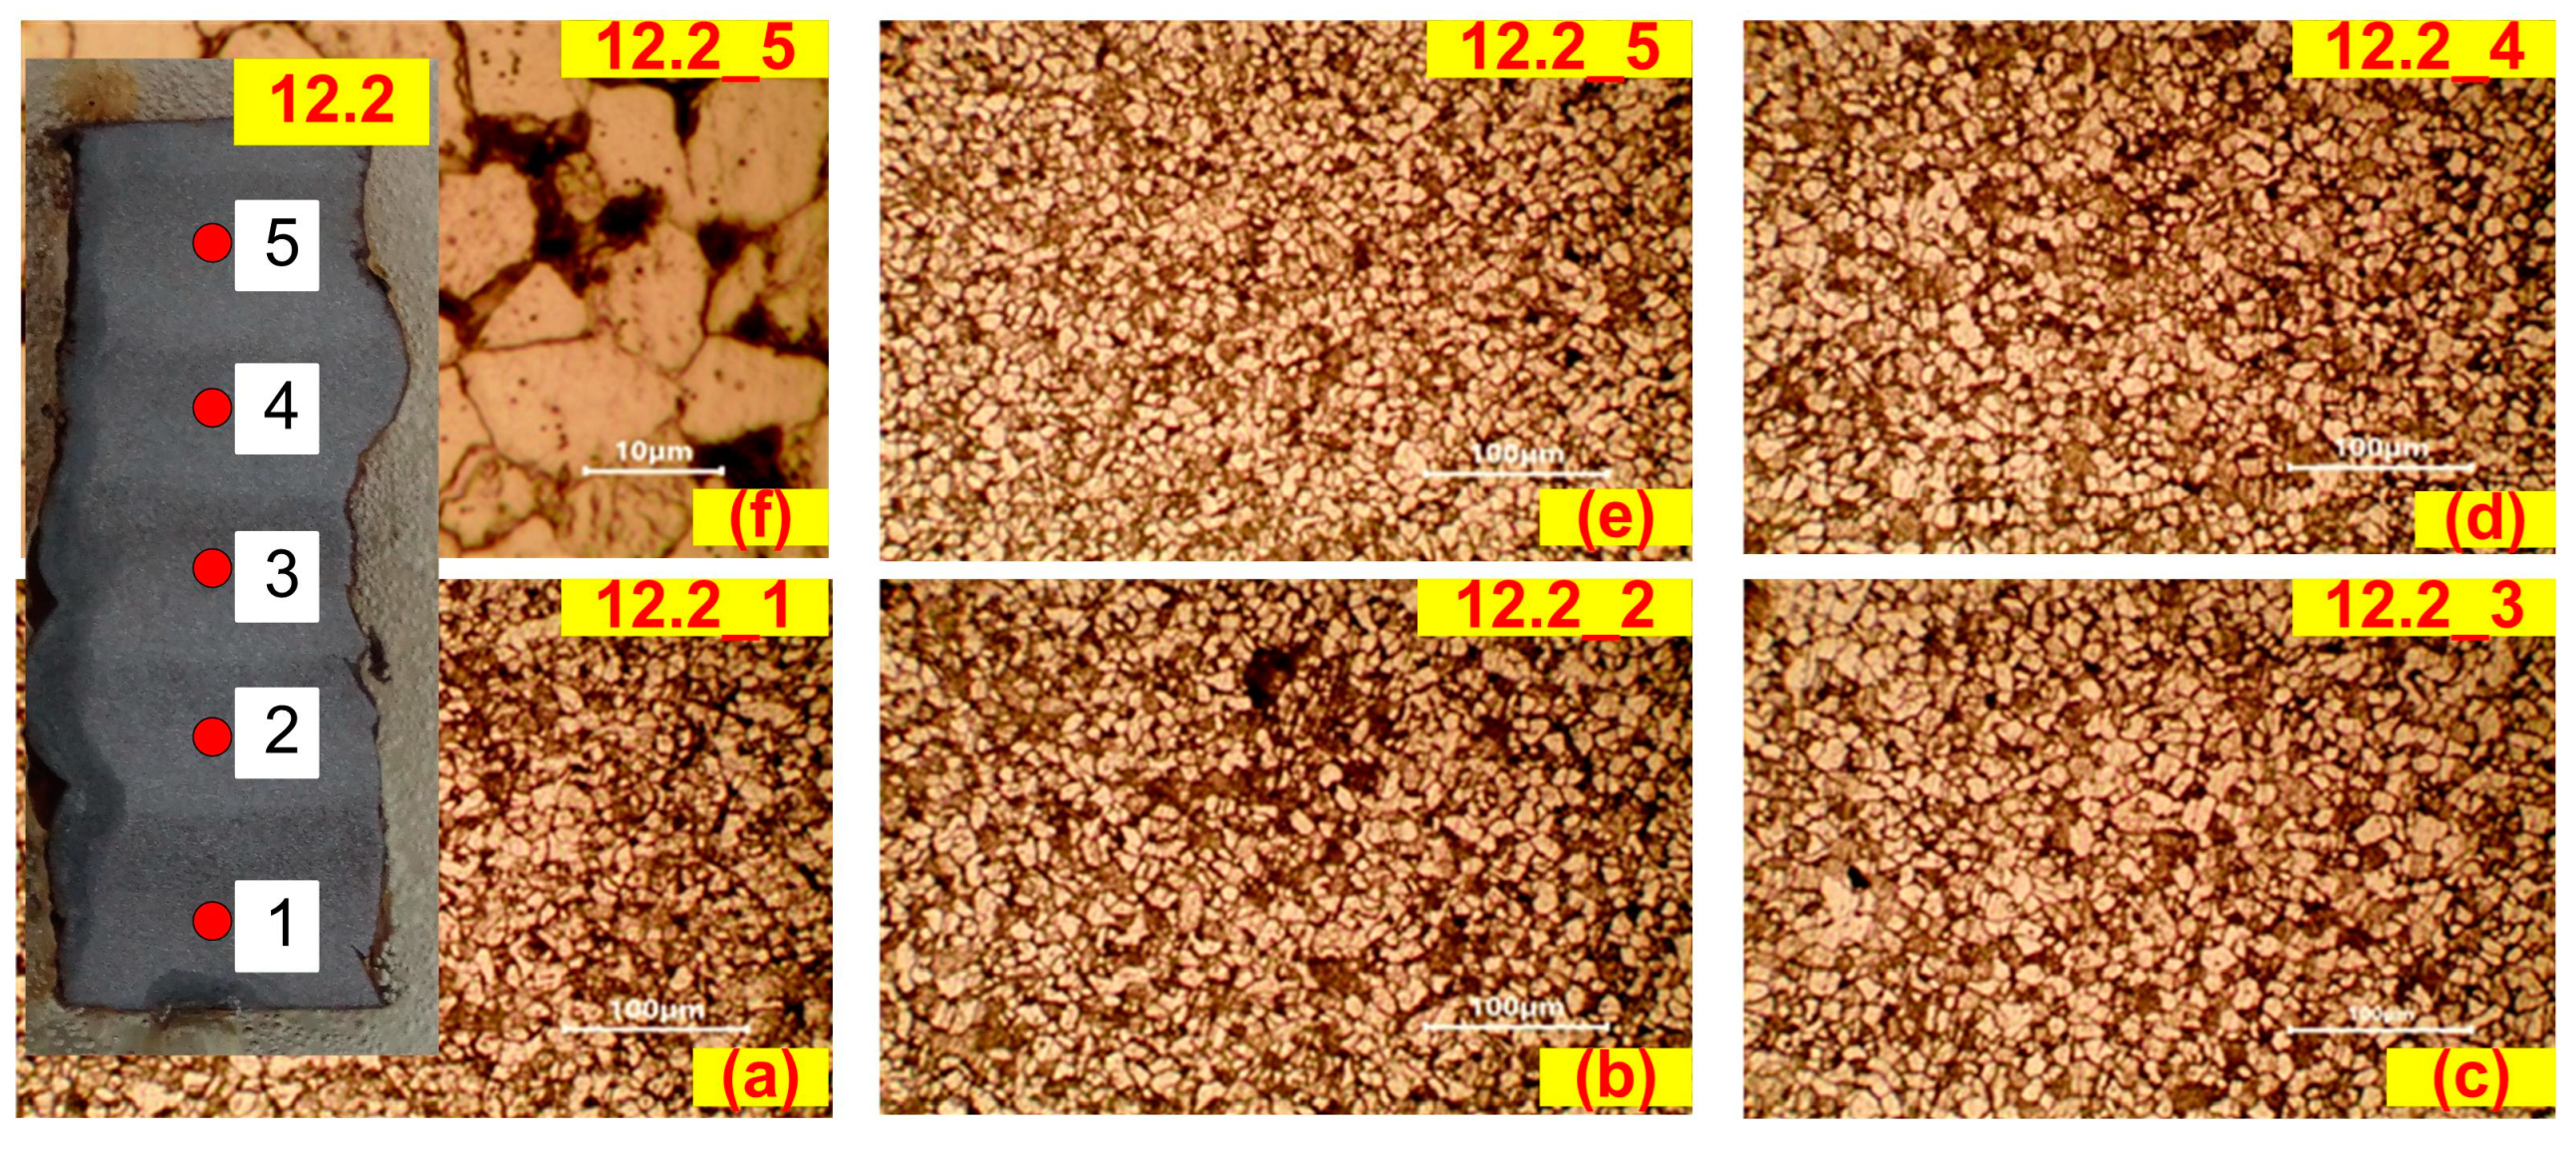
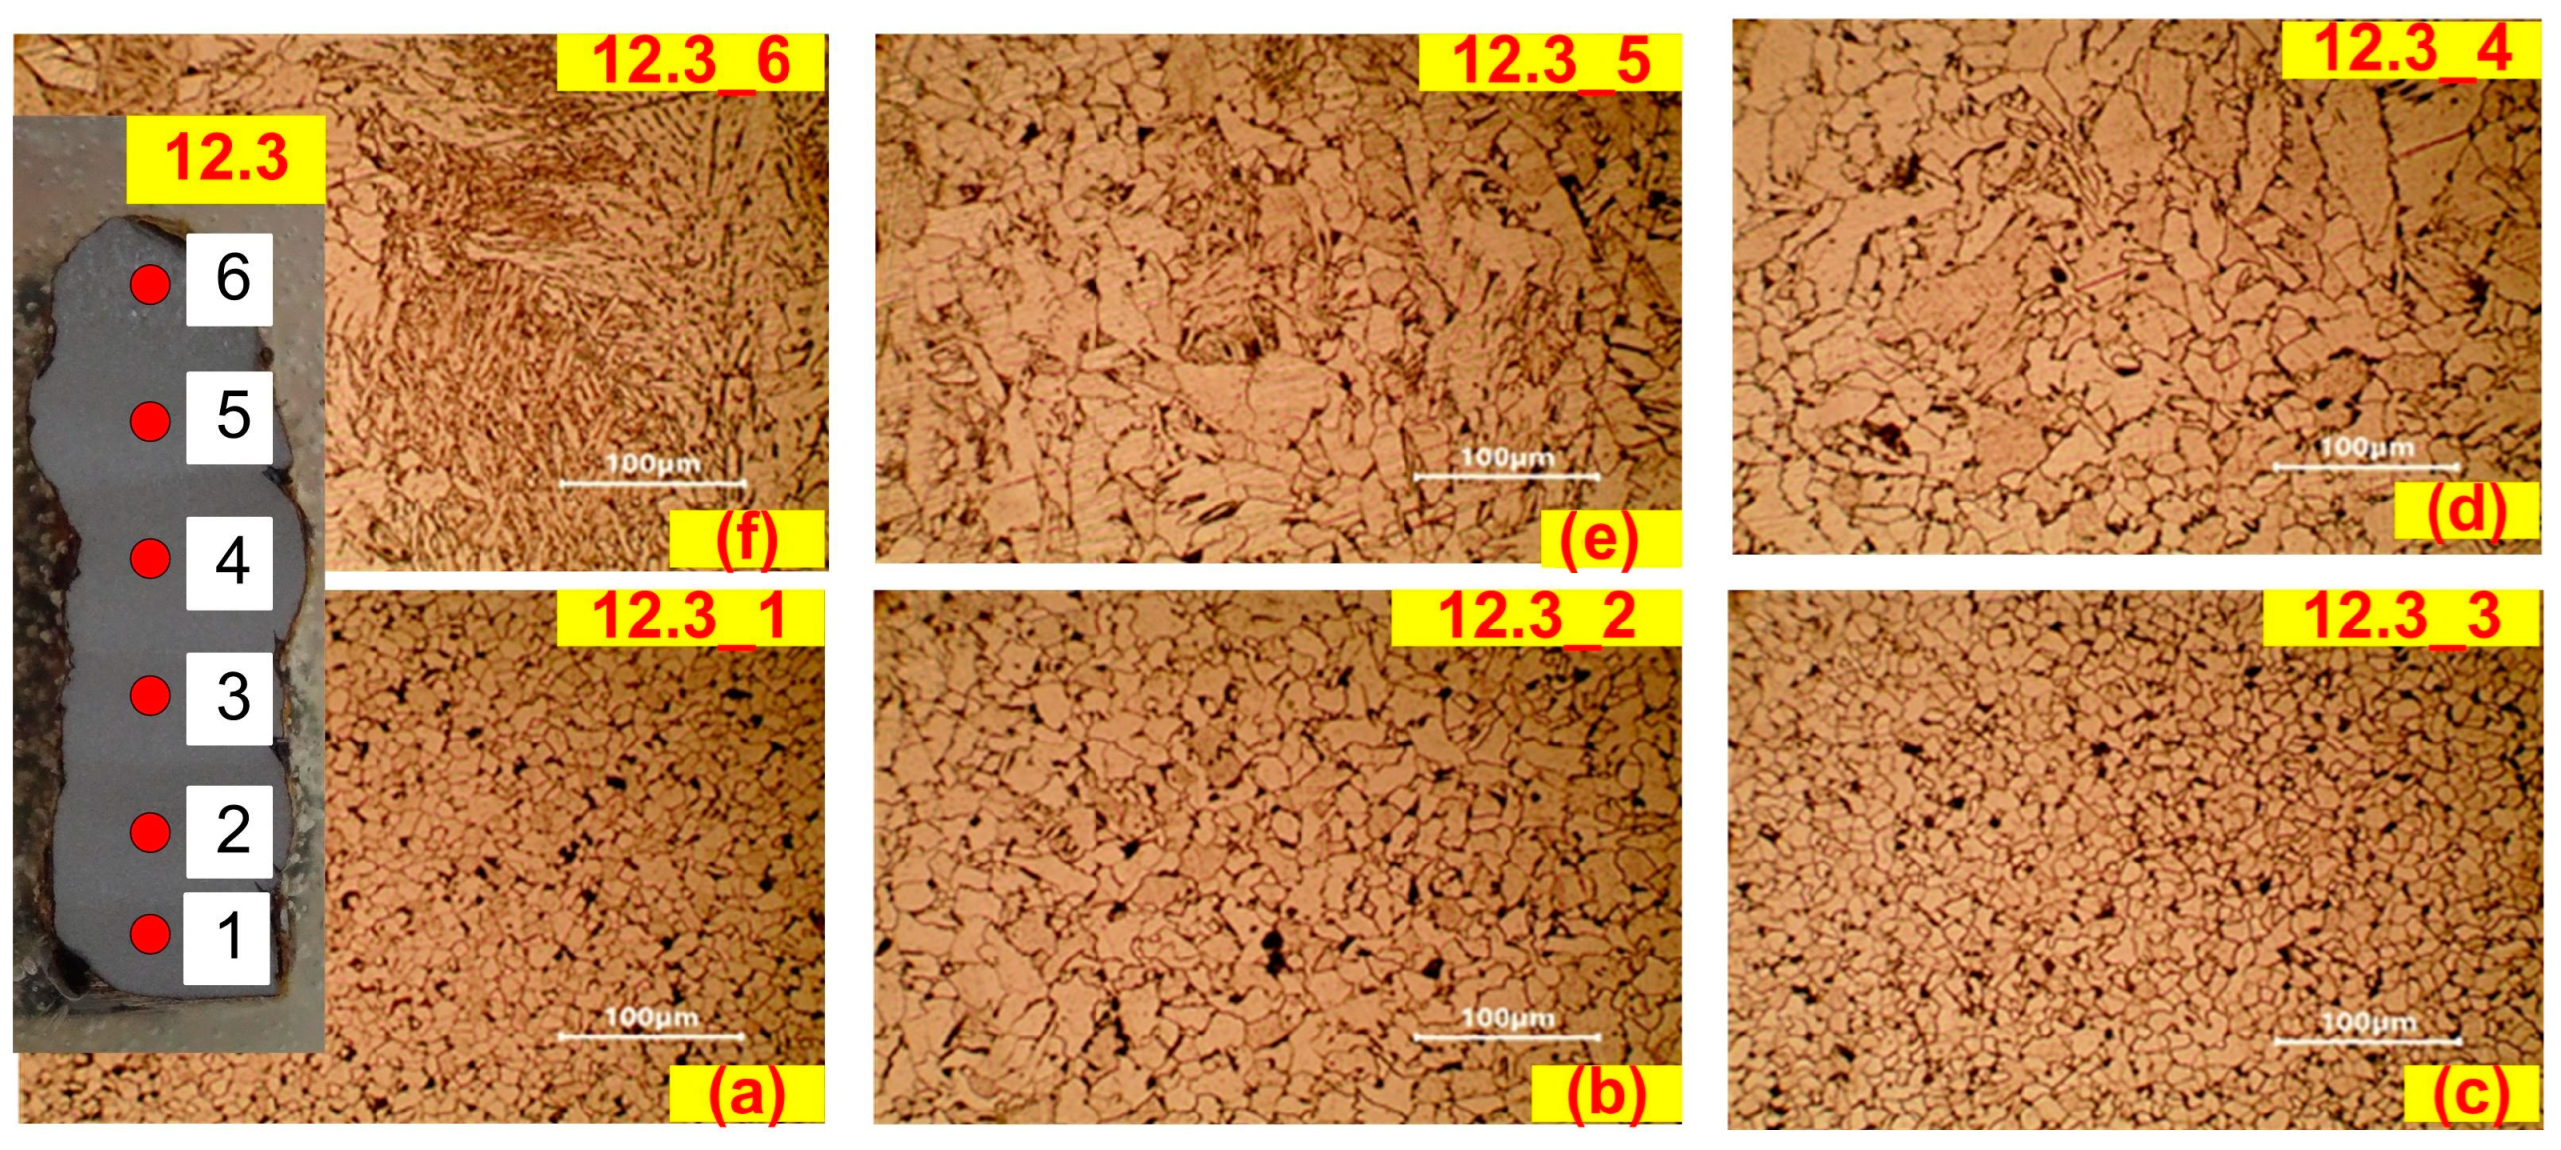
To validate the predictions of the thermal model, metallographic analysis was performed on samples extracted from three different zones of the WAAM-fabricated test specimens: sample 12.1 (area 1), sample 12.2 (area 2), and sample 12.3 (area 3). Figure 5, Figure 6 and Figure 7 present representative micrographs obtained from these analyses. In all three samples, 12.1, 12.2, and 12.3, point 1 is always closest to the substrate. Figure 5a–f illustrates the microstructure at points 1 to 5 along the vertical axis of sample 12.1. In all examined locations, a ferrite–pearlite microstructure was observed. The ferrite grain size in this region does not exceed 30–40 µm, and the pearlite content is low. Figure 6a–f shows the microstructure of sample 12.2, located around layer 21, the mid-height of the specimen. As predicted by the thermal model, a ferrite–pearlite structure is again observed. However, the ferrite grains here are noticeably smaller compared to those in sample 12.1, with an average size rarely exceeding 25 µm [52]. Numerous ferrite grains exhibit twinning, and the pearlite—mainly in lamellar form—is located along ferrite grain boundaries. The microstructure of the uppermost layers of sample 12.3 is presented in Figure 7a–f. At points 1, 2, and 3, which have undergone at least three cycles of reheating and cooling, the structure remains ferrite–pearlite but features alternating regions of finer and coarser ferrite grains. This grain size variation is attributed to differences in cooling rates and the repeated thermal cycling above the recrystallization temperature and even beyond the AC3 transformation point. From point 4 upward, individual grains of Widmanstätten ferrite begin to appear (Figure 7d), becoming dominant by point 6, where a pronounced Widmanstätten structure is observed (Figure 7f). The presence of such a structure is indicative of overheating during the WAAM process and confirms the localized thermal accumulation in the uppermost layers.

Figure 5.
Microstructure of the printed metal in area 1 of the test sample. The microstructure at point 1 (a), point 2 (b), point 3 (c), point 4 (d) recorded at magnifications 200×. The microstructure at point 5 was recorded at two magnifications: 200× (e) and 1000× (f).
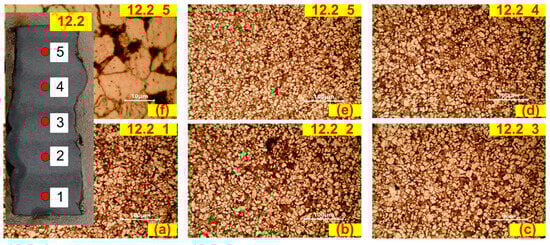
Figure 6.
Microstructure of the printed metal in area 2 of the test sample. The microstructure at point 1 (a), point 2 (b), point 3 (c), point 4 (d) recorded at magnifications 200×. The microstructure at point 5 was recorded at two magnifications: 200× (e) and 1000× (f). Point 1 is closest to the substrate side.
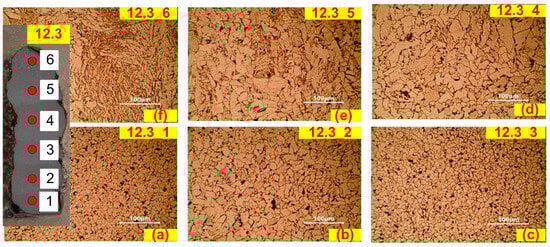
Figure 7.
Microstructure of the printed metal in area 3 of the test sample. The microstructure at point 1 (a), point 2 (b), point 3 (c), point 4 (d), point 5 (e) and point 6 (f) recorded at magnifications 200×.
The minimal differences in the microstructures of the deposited metal across the bottom, middle, and top regions of the test samples indicate that the test specimens are structurally homogeneous. Consequently, any variations in their mechanical properties are likely attributed to changes in the deposition parameters rather than to the specific location from which the specimens were cut. The simulation model demonstrated that, excluding the initial and final few layers, the thermal processes during WAAM are characterized by repeated thermal cycles. Under a given set of operating parameters, these cycles exhibit consistent features, such as minimum and maximum temperatures, heating rates, and cooling rates. These thermal characteristics directly influence the resulting microstructure of the printed metal.
3.2. Experimental Results of the Tensile Testing
The WAAM experiments were conducted using arc currents ranging from 70 A to 170 A and travel speeds between 12 cm/min and 30 cm/min, in accordance with the design of experiments. The obtained results for the key strength and deformation characteristics of the WAAM-fabricated test samples are summarized in Table 3. The data presented in Table 3 are averaged from several tested samples, which vary from two to three depending on the area of printed material. The experimental results corresponding to the center points of the design are presented separately in Table 4.
Table 3.
Experimental results.
Table 4.
Results from experiment in the center of the design: Ia = 120 A, Ua = 17.1 V, and VS = 21 cm/min.
3.3. Determining the Coefficients in Regression Equations
For each of the measured quantities—modulus of elasticity (E), lower yield strength (ReL), upper yield strength (ReH), ultimate tensile strength (Rm), uniform elongation (Ag), and total elongation (At)—a regression equation of type (1) is derived. To this end, based on the design matrix (Table 2) and the corresponding functions in Equation (1), an extended design matrix is constructed, as shown in Table 5. This extended matrix includes components calculated according to the following expression:
Table 5.
Extended matrix of the plan of experiment (Fisher’s matrix).
To solve Equation (3) and determine the unknown regression coefficients, the transposed matrix is first constructed. The matrix is then computed as the product of and . Next, the inverse is calculated. By multiplying this matrix by the transposed design matrix and the vector of measured results , the regression coefficients are obtained. The final values of the coefficients for each measured quantity are presented in Table 6.
Table 6.
Coefficients of Equation (1) for determining the stress–strain characteristics depending on the current and the deposition rate.
The adequacy of the regression model is assessed using Fisher’s criterion. For this purpose, the residual (offset) variance estimate and the experimental variance are calculated. These values are then used to compute the Fisher’s F-statistic, which is compared against the critical value for a given confidence level to evaluate the model’s adequacy.
Here, is the total number of experiments, is the number of coefficients in the regression Equation (1), is the number of experiments performed at the center of the design, and and are the individual results and the mean value from the center point experiments, respectively. The ratio used to verify the adequacy of the model according to Fisher’s criterion is calculated as follows:
When the calculated ratio is less than the critical value of Fisher’s criterion , the regression model is considered adequate. The results of these calculations are presented in Table 7. The critical value corresponds to a significance level of 0.05, with 12 degrees of freedom (i.e., the number of experiments minus the number of regression coefficients), and six repetitions at the center point of the design. These results confirm that all derived regression equations are statistically adequate and can be reliably used to predict the expected mechanical characteristics.
Table 7.
Verification of adequacy of the derived equations.
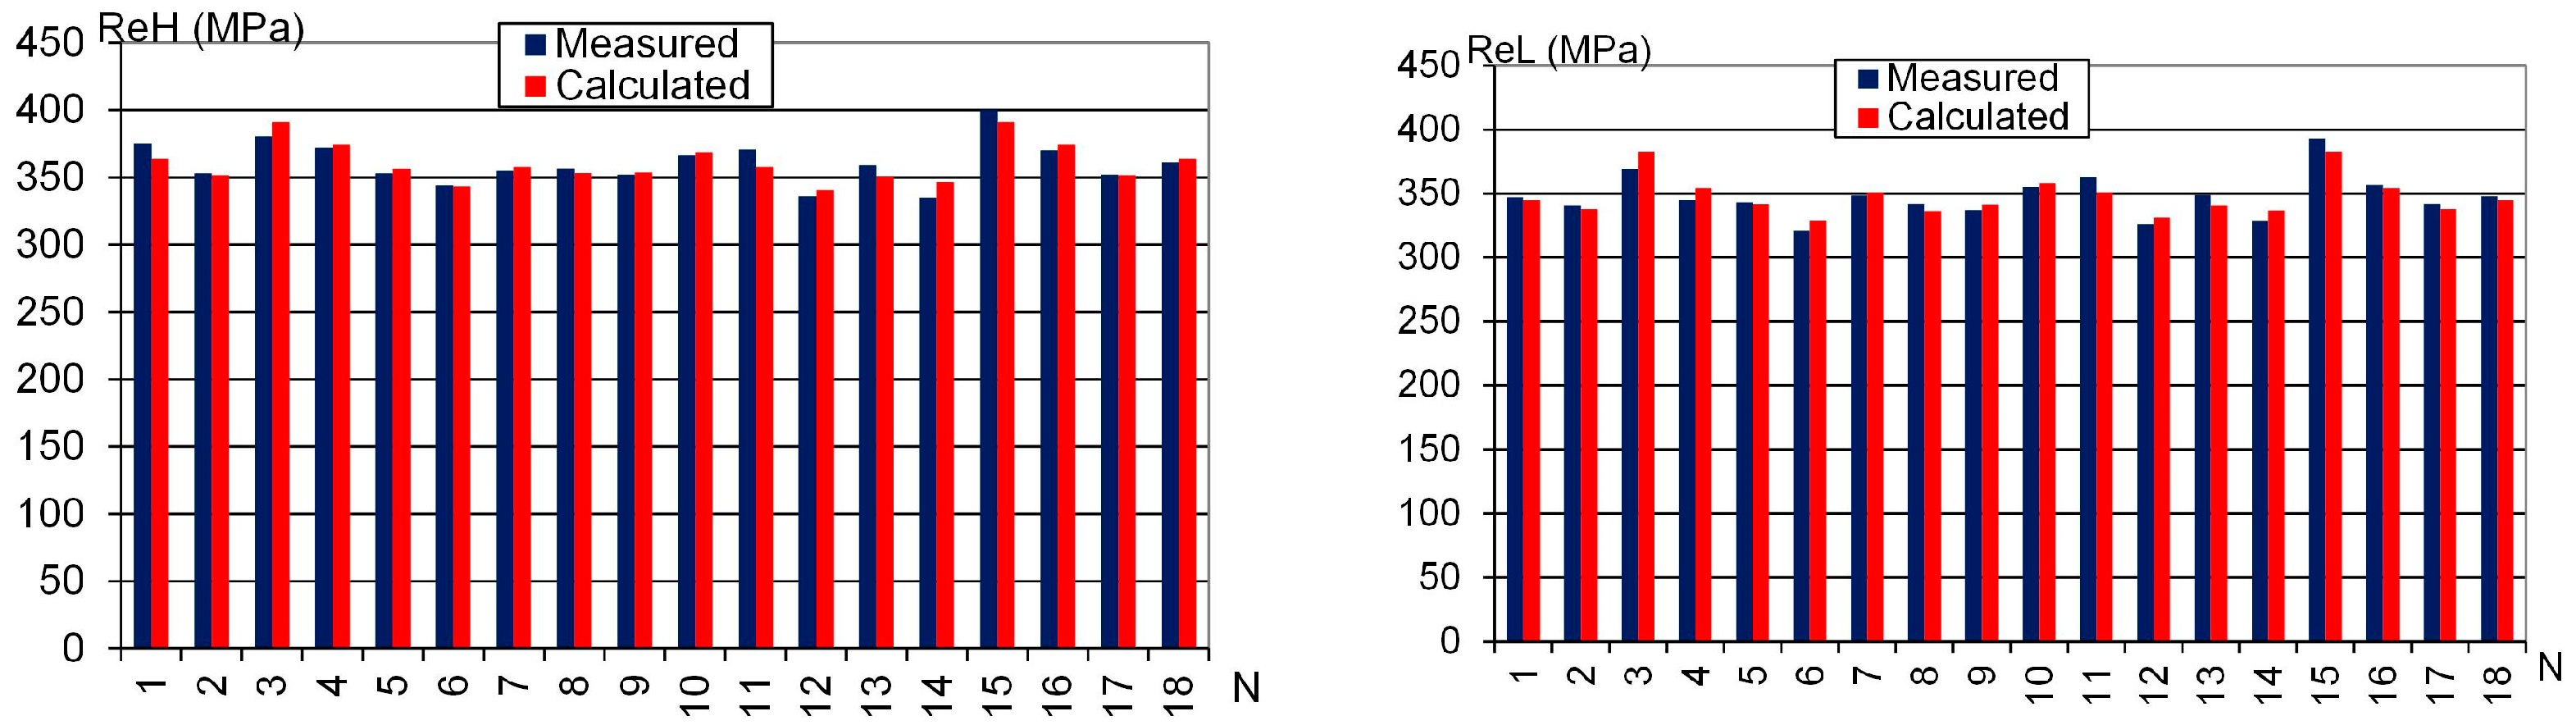
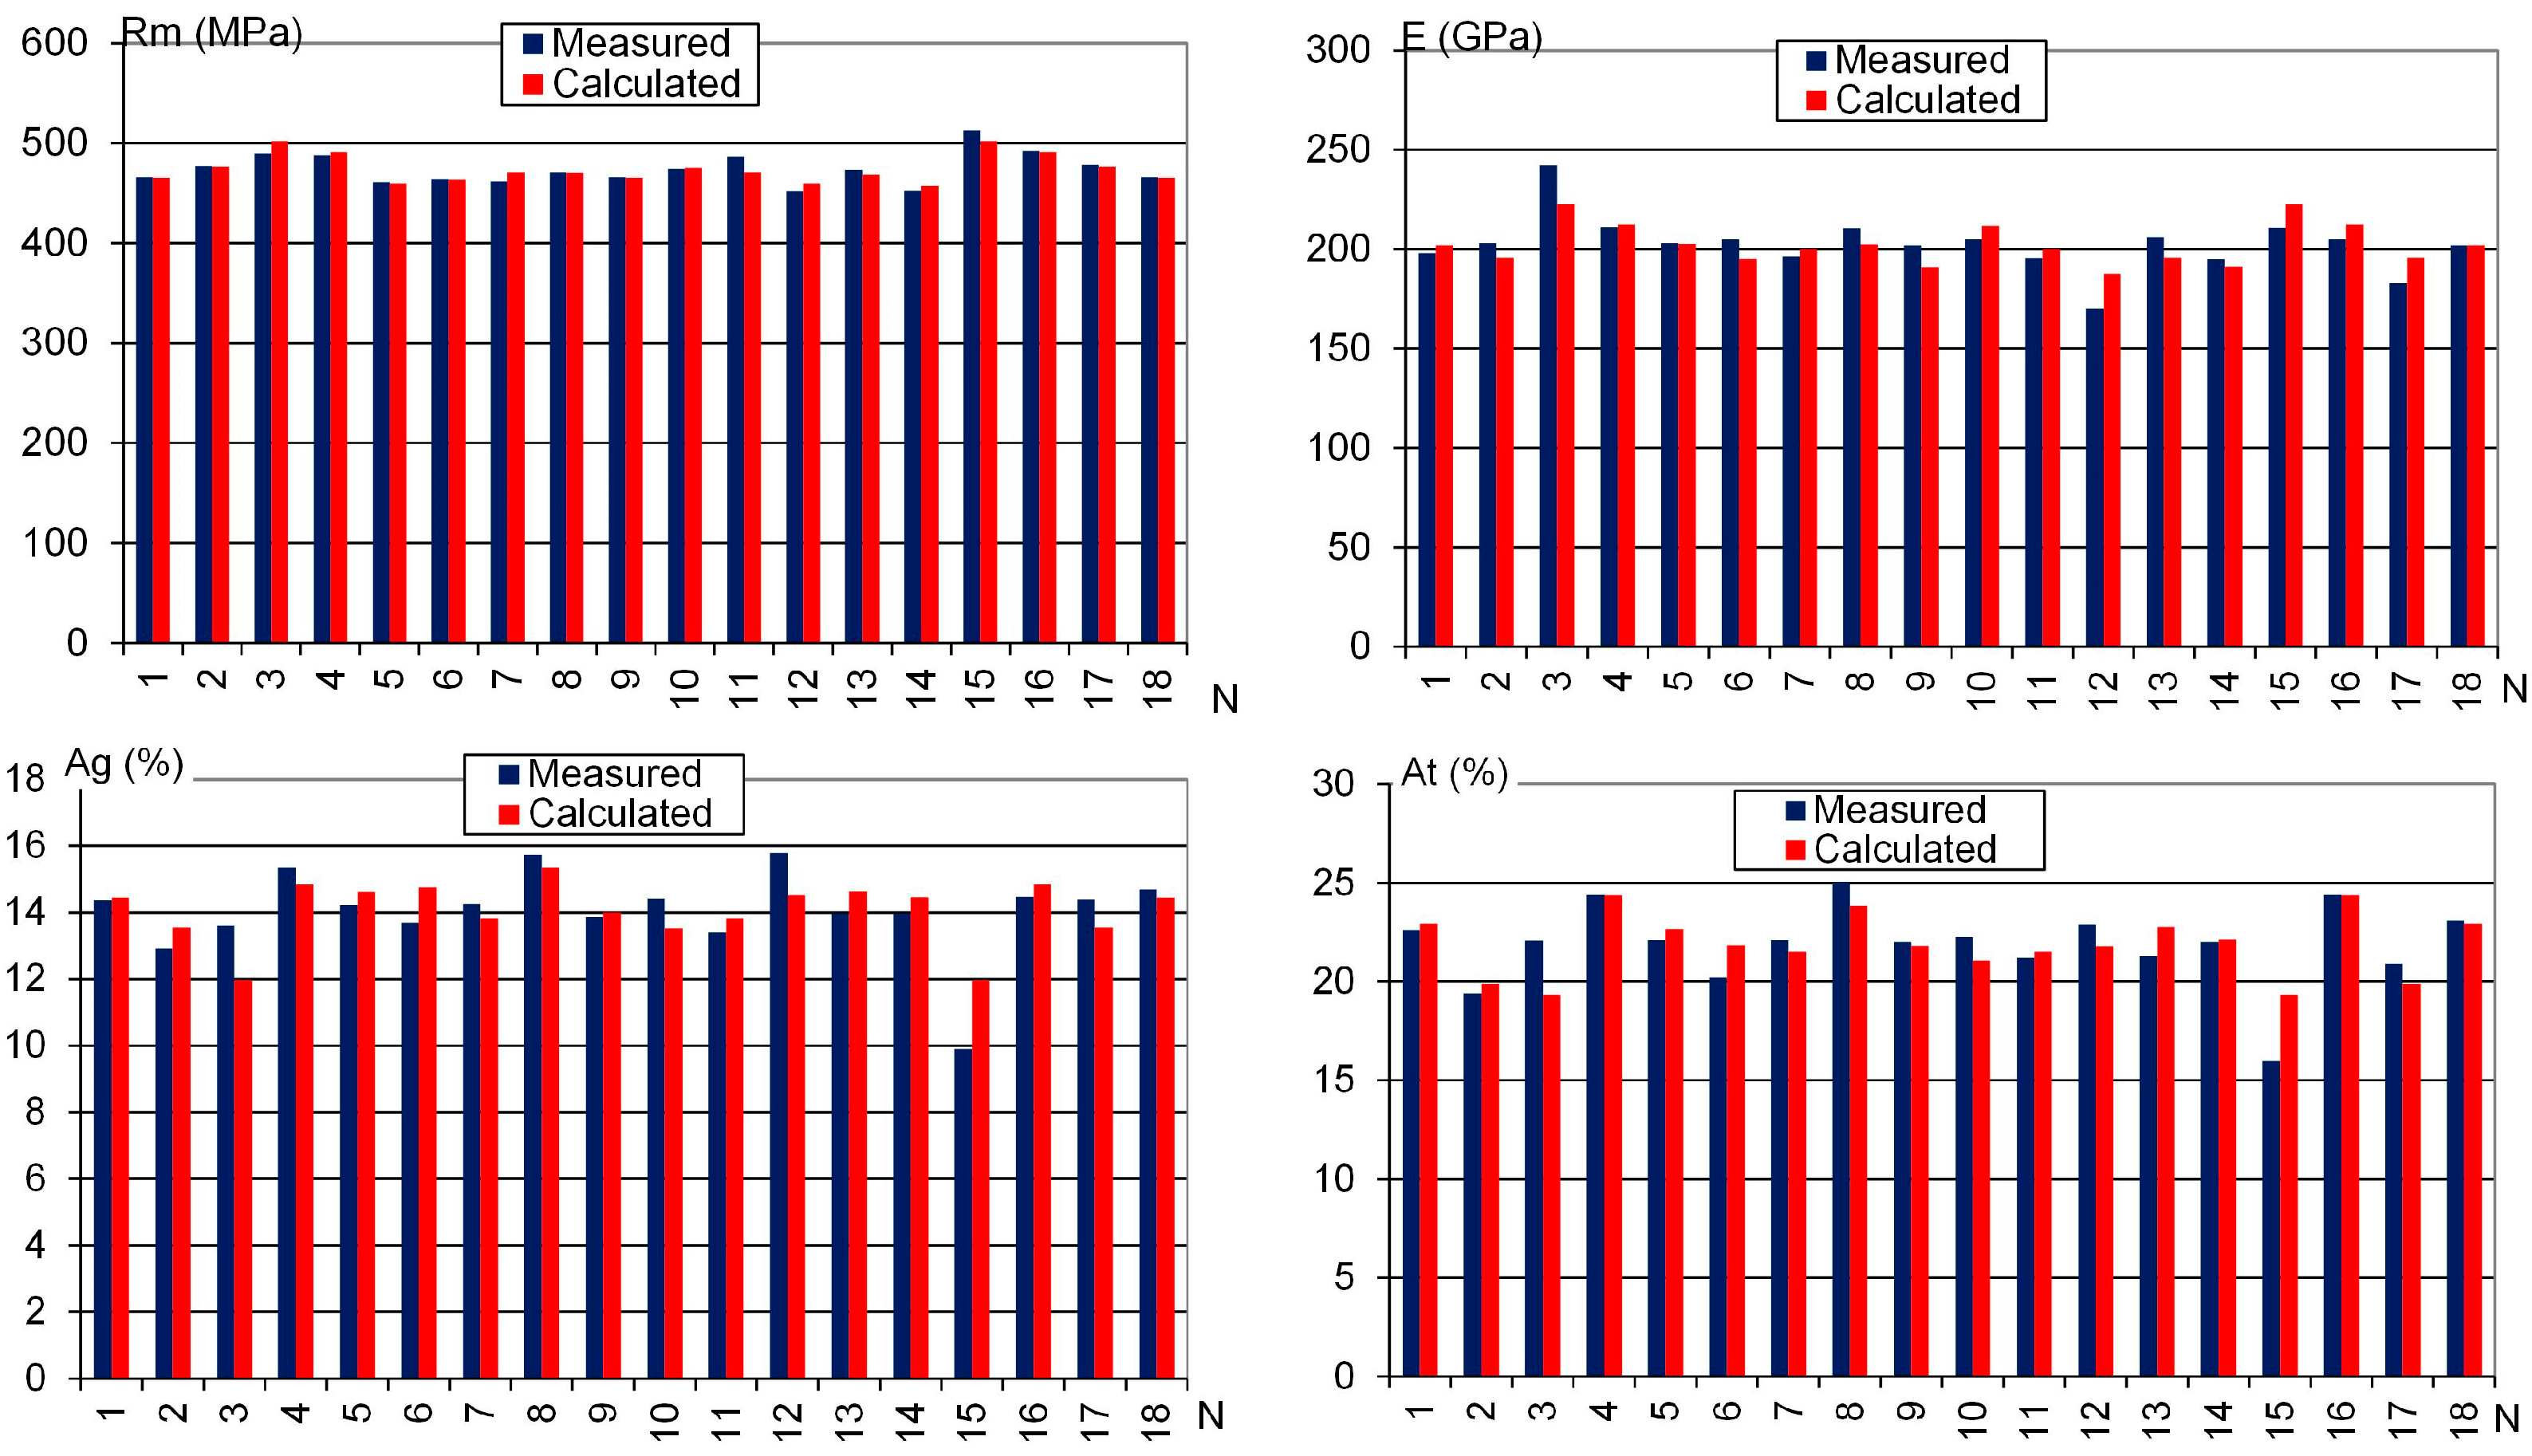
The statistical significance of the regression coefficients was evaluated using Student’s t-test. The critical t-value for 12 degrees of freedom and a significance level of 0.05 is . The resulting regression equations are visualized in Figure 8. The graphs demonstrate a strong correlation between the experimentally measured values and those predicted by the models, confirming the validity and predictive capability of the regression equations.
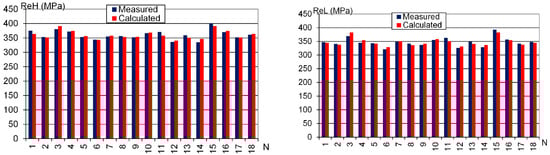
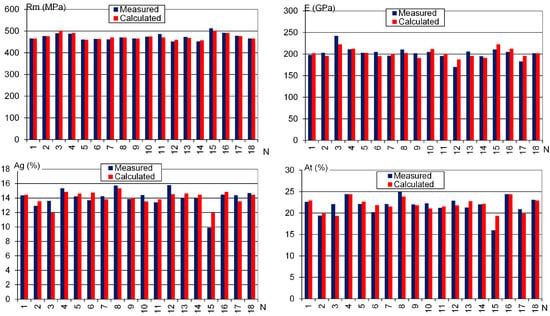
Figure 8.
Comparison of the measured and calculated values for the upper yield strength ReH, lower yield strength ReL, tensile strength Rm, Young’s modulus E, uniform elongation Ag, and elongation at fracture At.
4. Conclusions
The conclusions drawn from this study are based on experimental data and are, therefore, valid under the specific conditions and materials used. The key findings are as follows:
- New experimental data were obtained regarding the mechanical properties of metal produced by the WAAM process.
- Simulation modeling and metallographic analysis demonstrated that, after the deposition of the initial 5–6 layers, the process results in a nearly similar microstructure throughout the height of the specimen.
- Significant microstructural changes were observed only in the final (topmost) layer.
- Six new regression equations were derived, allowing the prediction of the mechanical properties of the deposited metal based on the parameters of the WAAM process.
- Thermal simulation modeling confirmed that the heat treatment resulting from the deposition of subsequent layers plays a crucial role in the formation and refinement of the microstructure.
- The resulting microstructure of the deposited layers is predominantly ferrite–pearlite.
Author Contributions
Conceptualization, E.T.; Methodology, M.T.; Investigation, E.T., V.P., V.D., T.S. and M.T.; Writing—original draft, T.S. and M.T.; Writing—review & editing, V.P. and V.D.; Supervision, V.P.; Project administration, V.P. All authors have read and agreed to the published version of the manuscript.
Funding
This research received no external funding.
Data Availability Statement
The original contributions presented in this study are included in the article. Further inquiries can be directed to the corresponding author.
Acknowledgments
The authors are grateful to the financial support of the Bulgarian National Science Fund, Contract No KP-06-H57/10, for carrying out the necessary research. This research was supported by the European Regional Development Fund within the OP Science and Education for Smart Growth 2014–2020, Project CoE “National Center of Mechatronics and Clean Technologies”, BG05M2OP001-1.001-0008.
Conflicts of Interest
The authors declare no conflict of interest.
References
- Doumenc, G.; Couturier, L.; Courant, B.; Paillard, P.; Benoit, A.; Gautron, E.; Girault, B.; Pirling, T.; Cabeza, S.; Gloaguen, D. Investigation of microstructure, hardness and residual stresses of wire and arc additive manufactured 6061 aluminium alloy. Materialia 2022, 25, 101520. [Google Scholar] [CrossRef]
- Zhang, S.; Gong, M.; Zeng, X.; Gao, M. Residual stress and tensile anisotropy of hybrid wire arc additive-milling subtractive manufacturing. J. Mater. Process. Technol. 2021, 293, 117077. [Google Scholar] [CrossRef]
- Di, Y.; Zheng, Z.; Pang, S.; Li, J.; Zhong, Y. Dimension Prediction and Microstructure Study of Wire Arc Additive Manufactured 316L Stainless Steel Based on Artificial Neural Network and Finite Element Simulation. Micromachines 2024, 15, 615. [Google Scholar] [CrossRef]
- Denkena, B.; Wichmann, M.; Böß, V.; Malek, T. Technological simulation of the resulting bead geometry in the WAAM process using a machine learning model. Procedia CIRP 2024, 126, 627–632. [Google Scholar] [CrossRef]
- Shakil, S.; Smith, N.; Yoder, S.; Ross, B.; Alvarado, S.; Hadadzadeh, A.; Haghshenas, M. Post fabrication thermomechanical processing of additive manufactured metals: A review. J. Manuf. Proc. 2022, 73, 757–790. [Google Scholar] [CrossRef]
- Savyasachi, N.; Richard, S.; James, J.; Thomas, D.; Ashok, A. A Review on Wire and Arc Additive Manufacturing (WAAM). Int. Res. J. Eng. Technol. 2020, 7, 4985. [Google Scholar]
- Rodrigues, T.A.; Duarte, V.; Miranda, R.M.; Santos, T.G.; Oliveira, J.P. Current Status and Perspectives on Wire and Arc Additive Manufacturing (WAAM). Materials 2019, 12, 1121. [Google Scholar] [CrossRef] [PubMed]
- Sahu, V.K.; Biswal, R.; Davis, A.E.; Chen, X.; Williams, S.W.; Prangnell, P.B. β-Grain refinement in WAAM Ti-6Al-4 V processed with inter-pass ultrasonic impact peening. Materialia 2024, 38, 102236. [Google Scholar] [CrossRef]
- Davis, A.E.; Caballero, A.; Prangnell, P.B. Confirmation of rapid-heating β recrystallization in wire-arc additively manufactured Ti-6Al-4V. Materialia 2020, 13, 100857. [Google Scholar] [CrossRef]
- Ermakova, A.; Razavi, N.; Berto, F.; Mehmanparast, A. Uniaxial and multiaxial fatigue behavior of wire arc additively manufactured ER70S-6 low carbon steel components. Int. J. Fatigue 2023, 166, 107283. [Google Scholar] [CrossRef]
- Gornyakov, V.; Ding, J.; Sun, Y.; Williams, S. Understanding and designing post-build rolling for mitigation of residual stress and distortion in wire arc additively manufactured components. Mater. Des. 2022, 213, 110335. [Google Scholar] [CrossRef]
- Kovšca, D.; Starman, B.; Klobčar, D.; Halilovič, M.; Mole, N. Towards an automated framework for the finite element computational modelling of directed energy deposition. Finite Elem. Anal. Des. 2023, 221, 103949. [Google Scholar] [CrossRef]
- Haghighi, A.M.; Ding, J.; Sun, Y.; Wang, C.; Williams, S. Thermo-capillary-gravity bidirectional modelling for evaluation and design of wire-based directed energy deposition additive manufacturing. J. Manuf. Process. 2023, 107, 320–332. [Google Scholar] [CrossRef]
- Huang, C.; Kyvelou, P.; Gardner, L. Stress-strain curves for wire arc additively manufactured steels. Eng. Struct. 2023, 279, 115628. [Google Scholar] [CrossRef]
- Gardner, L. Metal additive manufacturing in structural engineering—Review, advances, opportunities and outlook. Structures 2023, 47, 2178–2193. [Google Scholar] [CrossRef]
- Chen, W.; Wang, Z.; Xuan, Y.; Guo, X.; Zhou, Q.; Peng, Y.; Wang, K. Investigation on deformation behavior of high strength laminated heterostructured materials of ER120S-G high strength steel and 316L stainless steel fabricated by Wire-arc DED. Mater. Sci. Eng. A 2025, 923, 147750. [Google Scholar] [CrossRef]
- Smismans, T.; Chernovol, N.; Lauwers, B.; Rymenant, P.V.; Talemi, R. Influence of post-heat treatments on fatigue response of low-alloyed carbon-manganese steel material manufactured by Direct Energy Deposition-Arc technique. Mater. Lett. 2021, 302, 130465. [Google Scholar] [CrossRef]
- Voelkel, J.; Kühne, R.; Bartsch, H.; Feldmann, M.; Oster, L.; Sharma, R.; Reisgen, U.; Pinger, T. Fatigue strength of hot-dip galvanized additively manufactured steel. Structures 2023, 58, 105364. [Google Scholar] [CrossRef]
- Bartsch, H.; Kühne, R.; Citarelli, S.; Schaffrath, S.; Feldmann, M. Fatigue analysis of wire arc additive manufactured (3D printed) components with unmilled surface. Structures 2021, 31, 576–589. [Google Scholar] [CrossRef]
- Morales, M.M.; Branco, R.; Tankova, T.; Rebelo, C. Assessment of cyclic deformation behaviour of wire arc additively manufactured carbon steel. Int. J. Fatigue 2024, 184, 108307. [Google Scholar] [CrossRef]
- Kovšca, D.; Starman, B.; Ščetinec, A.; Klobčar, D.; Mole, N. Advanced computational modelling of metallic wire-arc additive manufacturing. In Proceedings of the ESAFORM 2021 24th International Conference on Material Forming, Liege, Belgium, 14–16 April 2021. [Google Scholar] [CrossRef]
- Rani, K.U.; Kumar, R.; Mahapatra, M.M.; Mulik, R.S.; Świerczyńska, A.; Fydrych, D.; Pandey, C. Wire Arc Additive Manufactured Mild Steel and Austenitic Stainless Steel Components: Microstructure, Mechanical Properties and Residual Stresses. Materials 2022, 15, 7094. [Google Scholar] [CrossRef] [PubMed]
- Ermakova, A.; Razavi, N.; Crescenzo, R.; Berto, F.; Mehmanparast, A. Fatigue life assessment of wire arc additively manufactured ER100S-1 steel parts. Prog. Addit. Manuf. 2023, 8, 1329–1340. [Google Scholar] [CrossRef]
- Müller, J.; Hensel, J.; Dilger, K. Mechanical properties of wire and arc additively manufactured high-strength steel structures. Weld. World 2022, 66, 395–407. [Google Scholar] [CrossRef]
- Gordon, J.V.; Vinci, R.P.; Hochhalter, J.D.; Rollett, A.D.; Harlow, D.G. Quantification of location-dependence in a large-scale additively manufactured build through experiments and micromechanical modeling. Materialia 2019, 7, 100397. [Google Scholar] [CrossRef]
- Cunningham, C.R.; Flynn, J.M.; Shokrani, A.; Dhokia, V.; Newman, S.T. Invited review article: Strategies and processes for high quality wire arc additive manufacturing. Addit. Manuf. 2018, 22, 672–686. [Google Scholar] [CrossRef]
- Peleshenko, S.; Korzhyk, V.; Voitenko, O.; Khaskin, V.; Tkachuk, V. Analysis of the current state of additive welding technologies for manufacturing volume metallic products (review). East.-Eur. J. Enterp. Technol. 2017, 3, 42–52. [Google Scholar] [CrossRef]
- Suryakumar, S.; Karunakaran, K.P.; Bernard, A.; Chandrasekhar, U.; Raghavender, N.; Sharma, D. Weld bead modeling and process optimization in Hybrid Layered Manufacturing. Comput.-Aided Des. 2011, 43, 331–344. [Google Scholar] [CrossRef]
- Nguyen, L.; Buhl, J.; Bambach, M. Multi-bead overlapping models for tool path generation in wire-arc additive manufacturing processes. Procedia Manuf. 2020, 47, 1123–1128. [Google Scholar] [CrossRef]
- Xiong, J.; Zhang, G.; Gao, H.; Wu, L. Modeling of bead section profile and overlapping beads with experimental validation for robotic GMAW-based rapid manufacturing. Robot. Comput.-Integr. Manuf. 2013, 29, 417–423. [Google Scholar] [CrossRef]
- Ding, D.; Pan, Z.; Cuiuri, D.; Li, H. A multi-bead overlapping model for robotic wire and arc additive manufacturing (WAAM). Robot. Comput.-Integr. Manuf. 2015, 31, 101–110. [Google Scholar] [CrossRef]
- Tongov, M.; Manilova, M.; Zaekova, R.; Georgiev, G. Bead formation during wire and arc additive manufacturing. In Proceedings of the XXI International Congress “Machines. Technologies. Materials”, Borovets, Bulgaria, 6–9 March 2024; Volume I; pp. 37–41, ISSN 2535-0021. [Google Scholar]
- Arora, H.; Singh, R.; Brar, G.S. Thermal and structural modelling of arc welding processes: A literature review. Meas. Control 2019, 52, 955–969. [Google Scholar] [CrossRef]
- Barath Kumar, M.D.; Manikandan, M. Assessment of process, parameters, residual stress mitigation, post treatments and finite element analysis simulations of wire arc additive manufacturing technique. Met. Mater. Int. 2022, 28, 54–111. [Google Scholar] [CrossRef]
- Mukherjee, T.; Zhang, W.; DebRoy, T. An improved prediction of residual stresses and distortion in additive manufacturing. Comput. Mater. Sci. 2017, 126, 360–372. [Google Scholar] [CrossRef]
- Jia, X.; Xua, J.; Liua, Z.; Huanga, S.; Fana, Y.; Sun, Z. A new method to estimate heat source parameters in gas metal arc welding simulation process. Fusion Eng. Des. 2014, 89, 40–48. [Google Scholar] [CrossRef]
- Chen, X.; Shang, X.; Zhou, Z.; Chen, S.G. A Review of the Development Status of Wire Arc Additive Manufacturing Technology. Adv. Mater. Sci. Eng. 2022, 5757484. [Google Scholar] [CrossRef]
- Zhang, T.; Li, H.; Gong, H.; Wu, Y.; Chen, X.; Zhang, X. Study on location-related thermal cycles and microstructure variation of additively manufactured inconel 718. J. Mater. Res. Technol. 2022, 18, 3056–3072. [Google Scholar] [CrossRef]
- Tongov, M.; Petkov, V. A Thermal model for wire arc additive manufacturing. Environ. Technol. Resour. 2023, 3, 262–270. [Google Scholar] [CrossRef]
- Tongov, M.; Anguelov, V. Practice oriented heat source model calibration. Environ. Technol. Resour. 2023, 3, 257–261. [Google Scholar] [CrossRef]
- Tongov, M.; Petkov, V.; Tashev, P. Influence of Heat Input on Formation of Layers in WAAM. C. R. Acad. Bulg. Sci. 2024, 77, 1639–1645. [Google Scholar] [CrossRef]
- Oliveira, J.P.; Santos, T.G.; Miranda, R.M. Revisiting fundamental welding concepts to improve additive manufacturing: From theory to practice. Prog. Mater. Sci. 2020, 107, 100590. [Google Scholar] [CrossRef]
- Yildiz, A.S.; Davut, K.; Koc, B.; Yilmaz, O. Wire Arc Additive Manufacturing of High-Strength Low Alloy Steels: Study of Process Parameters and Their Influence on the Bead Geometry and Mechanical Characteristics. Int. J. Adv. Manuf. Technol. 2020, 108, 3391–3404. [Google Scholar] [CrossRef]
- Dinovitzer, M.; Chen, X.; Laliberte, J.; Huang, X.; Frei, H. Effect of Wire and Arc Additive Manufacturing (WAAM) Process Parameters on Bead Geometry and Microstructure. Addit. Manuf. 2019, 26, 138–146. [Google Scholar] [CrossRef]
- Suryakumar, S.; Karunakaran, U.P.; Chandrasekhar, U.; Somashekara, M.A. A Study of the Mechanical Properties of Objects Built through Weld-Deposition. Proc. Inst. Mech. Eng. Part B J. Eng. Manuf. 2013, 227, 1138–1147. [Google Scholar] [CrossRef]
- Hackenhaar, W.; Mazzaferro, J.A.E.; Mazzaferro, C.C.P.; Grossi, N.; Campatelli, G. Effects of different WAAM current deposition modes on the mechanical properties of AISI H13 tool steel. Weld. World 2022, 66, 2259–2269. [Google Scholar] [CrossRef]
- Wu, B.; Pan, Z.; Ding, D.; Cuiuri, D.; Li, H. Effects of Heat Accumulation on Microstructure and Mechanical Properties of Ti6Al4V Alloy Deposited by Wire Arc Additive Manufacturing. Addit. Manuf. 2018, 23, 151–160. [Google Scholar] [CrossRef]
- ISO 14341:2010; Welding Consumables—Wire Electrodes and Weld Deposits for Gas Shielded Metal Arc Welding of Non Alloy and Fine Grain Steels—Classification. ISO: Geneva, Switzerland, 2010.
- BS EN 10025-1:2004; Hot Rolled Products of Structural Steels. BSI: London, UK, 2004.
- EN ISO 6892-1:2019; Metallic Materials—Tensile Testing. ISO: Geneva, Switzerland, 2019.
- Vuchkov, I. Optimal Planning of Experimental Research; Tekhnika: Sofia, Bulgaria, 1978; 232p. (In Bulgarian) [Google Scholar]
- Yi, H.; Wang, Q.; Zhang, W.; Cao, H. Wire-arc directed energy deposited Mg-Al alloy assisted by ultrasonic vibration: Improving properties via controlling grain structures. J. Mater. Process. Technol. 2023, 321, 118134. [Google Scholar] [CrossRef]


Disclaimer/Publisher’s Note: The statements, opinions and data contained in all publications are solely those of the individual author(s) and contributor(s) and not of MDPI and/or the editor(s). MDPI and/or the editor(s) disclaim responsibility for any injury to people or property resulting from any ideas, methods, instructions or products referred to in the content. |
© 2025 by the authors. Licensee MDPI, Basel, Switzerland. This article is an open access article distributed under the terms and conditions of the Creative Commons Attribution (CC BY) license (https://creativecommons.org/licenses/by/4.0/).