Abstract
This paper introduces a novel diagnostic approach called partial-discharge-activated impulse frequency response analysis (PD-IFRA), developed to overcome the limitations of conventional frequency response analysis (FRA) in detecting partial discharges (PDs) in power transformers. While traditional FRA with low-impulse-voltage excitation (LIVE) effectively identifies mechanical deformations, inter-turn shorts, and insulation faults, it fails to detect incipient PD activity since PD phenomena require excitation beyond the PD inception voltage (PDIV) to initiate. This study proposes, for the first time, the extension of IFRA to moderate impulse voltage levels—without exceeding insulation limits—enabling the early and non-destructive detection of PDs. Experimental validation on a 315 kVA, 11 kV/420 V Dyn11 transformer shows that PD-IFRA effectively identifies PD-related impedance deviations within the 10 kHz–2 MHz frequency range, especially for PD sources associated with floating metal parts. Furthermore, the comparative analysis between normal, short-circuited, and PD-induced conditions demonstrates that PD-IFRA significantly enhances the precursory diagnosis of PDs where conventional FRA fails. This contribution advances transformer condition assessment by integrating PD sensitivity into FRA-based methods without compromising equipment safety.
1. Introduction
1.1. Background
Transformer health-related monitoring can be carried out using numerous electrical fault diagnostic testing approaches [1,2,3,4]. The frequency response analysis (FRA) diagnostic technique is classified among such approaches that are instrumental in identifying winding deformation, core displacement, inter-turn shorts, faulty grounding connections, and insulation deterioration [5]. FRA adopts either sinusoidal sweeps (SFRA), impulse signals (IFRA), white noise, step voltages, or chirp signals as the test input signals [6]. SFRA employs a typically 2–10 V peak-to-peak sinusoidal excitation signal of constant amplitude which systematically sweeps across a frequency range of approximately 20 Hz up to 20 MHz to holistically represent the transformer impedance [7,8]. Researchers commonly choose specific frequency ranges predicated on the diagnostic sensitivity aimed for and measurement ambitions. IFRA employs an impulse voltage excitation signal with multiple frequency components which are revealed through fast Fourier transform (FFT) analysis [9]. Similarly to SFRA, the transformer’s response is characterized by its frequency-dependent transfer function (TF) reflecting mechanical and electrical integrity.
1.2. Related Work
The signature responses may be appraised in various forms across the frequency domain, for instance, (1) self-admittance of the winding which is the current per unit applied voltage, indicating how readily current flows in winding insulation and reflecting insulation integrity and capacitive characteristics, (2) self-impedance of the winding which is the voltage per unit applied current reflecting winding inductance, resistance, and overall structural condition and indicating deformation, shorted turns, and mechanical issues, (3) voltage transfer of the winding which is measurement of the voltage induced or transferred from the winding under test, i.e., primary winding, or the adjacent winding terminals, i.e., secondary winding during the FRA test, and (4) the voltage transferred to the non-tested windings which indicate the voltage induced in other windings (not directly excited) and reflect changes in magnetic/capacitive coupling, diagnosing issues like core displacement, winding deformation, and inter-winding insulation problems.
Correspondingly, the transfer functions attained through these methods are recognized as the (1) self-impedance transfer function (SITF) which measures the voltage response across a winding when injecting a known current directly into that same winding, (2) self-admittance transfer function (SATF) which measures the current flowing into a winding when applying a known voltage directly to that same winding, i.e., it is the inverse of the SITF, (3) end-to-end voltage transfer function (EEVTF) which measures the voltage transferred from one end (terminal) of the tested winding to the other end of the same winding and transfer voltage transfer function (TVTF) which measures the voltage transferred from the excited winding to another winding that is not directly tested (non-tested winding). In practice, the transformer winding terminals can also be kept open-circuited, short-circuited, or grounded and, therefore, can bring about different test circuitries [8]. Table 1 tabulates the different FRA types based on their signal type, amplitude, and typical frequency range [9].

Table 1.
FRA techniques, signal types, typical signal characteristics, and their frequency range used in transformer diagnostics.
1.2.1. Studies on Mechanical Fault Diagnosis Using FRA
The practicality of FRA and low-impulse-voltage excitation (LIVE) FRA in identifying transformer windings deformities by various transfer function methods has been successfully illustrated by researchers [10,11,12,13]. Standards [14,15] and working group [16] recommendations for conducting FRA-based fault diagnosis are currently available. The identification of winding short circuits or turn-to-turn faults with the IFRA has also been effectively illustrated by some studies [17,18]. Recent advancements in both experiments and modeling of transformer windings have been published in the literature [19,20,21].
1.2.2. Impulse-Based and Lightning Impulse (LI) Techniques for FRA Enhancement
In [22], the authors explore the impulse-voltage-based frequency response analysis (IFRA) for diagnosing inter-turn short circuits in transformers under varying load conditions. Experiments on 5 kVA and 315 kVA transformers revealed that both the load current and power factor significantly impact the frequency response. It was found that FRA signatures in one load condition cannot be directly used for other load conditions, requiring careful interpretation. The research highlights the need for load-adaptive FRA to improve the accuracy of detecting inter-turn shorts in transformers.
Building on this, ref. [23] investigates an alternative approach to extract a transformer’s frequency response (FR) from lightning impulse (LI) test results, eliminating the need for additional testing. The extracted FR is validated by comparing it with conventionally measured FRs and is applied in LI test circuit simulations and transient recovery voltage (TRV) calculations for transformer-limited faults (TLFs). Experimental results on a large power transformer confirm the method’s accuracy. This study highlights a cost-effective approach for transformer diagnostics and circuit breaker rating selection using readily available LI test data.
Expanding on the optimization of LI testing, ref. [24] presents an automated approach for configuring Marx impulse generators, enhancing efficiency and accuracy in LI testing of transformers. A genetic algorithm (GA)-based method is integrated with electromagnetic transient simulations to determine optimal resistor values, minimizing reliance on traditional trial-and-error methods. The approach is validated using FRA data from two transformer types, demonstrating improved precision in impulse waveform generation. This methodology enhances transformer testing procedures, ensuring better insulation assessment while reducing testing time and transformer damage risks.
Further refining LI waveform characteristics, ref. [25] explores methods to improve waveform shape in LI testing of distribution transformers, focusing on mitigating high-frequency resonances and excessive overshoot. FRA is utilized to derive the transformer’s black-box model, which enables simulations for optimizing series and parallel compensators. The research finds that parallel capacitors help dampen oscillations while adjusting impulse generator (IG) parameters is necessary for achieving standardized LI waveforms. These findings contribute to enhancing LI test accuracy and protecting transformer insulation from excessive stress, further complementing the advancements in LI testing methodologies presented in [24].
1.2.3. Efforts Towards PD Detection Using IFRA and OLI
IFRA and oscillating lightning impulse (OLI) testing are advancing transformer diagnostics, particularly in detecting PDs and insulation defects. Study [26] extends IFRA to moderately high voltages, demonstrating its ability to non-destructively detect PD sources across transformer insulation. Experimental results on a 315 kVA transformer confirm that IFRA can complement conventional PD tests, providing early warning of insulation deterioration.
However, the study [27] highlights that IFRA accuracy is sensitive to pulse width, repetition frequency, and injection moment. Improper parameter selection introduces false resonance points, affecting diagnostics. Simulation and experimental results confirm that optimizing these parameters improves real-time IFRA reliability for detecting winding faults.
To enhance predictive maintenance, the study [28] employs 3D finite element modeling (FEM) and simulates PD by injecting pulse signals between winding sections. Using impedance analysis and S-transform signal processing, the study distinguishes PD signatures from mechanical deformations, reinforcing IFRA’s potential for real-time diagnostics.
Meanwhile, a study [29] proposes a new OLI test for on-site transformer insulation assessment. Combining partial discharge detection and transfer function analysis, the OLI test successfully identifies insulation defects at high voltages on a 35 kV transformer, demonstrating its suitability for field testing of large power transformers.
Together, these studies emphasize the importance of IFRA and OLI testing in transformer diagnostics, showing how high-voltage IFRA enhances PD detection, parameter optimization improves accuracy, FEM modeling refines signal interpretation, and OLI testing ensures reliable field diagnostics.
In these studies, the pulse injection from a low-voltage pulse generator (LVPG) or PD calibrator was injected at some designated locations in the un-tanked transformer windings, i.e., winding taps, inter-turn insulation points, phase-to-phase insulation points, or HV/LV terminals where PD activity is likely to originate, and their responses at the two terminals of the winding, typically the HV and LV terminals, were used in identifying the type and location of PD by evaluating signal distortions, time delays, and frequency-domain characteristics [30,31,32].
Although these studies contribute significantly to transformer diagnostics, most of them focused on mechanical fault identification or utilized external PD calibration and injection methods. None systematically explored the capability of FRA to detect PD by directly activating PD through impulse voltages exceeding the PD inception voltage (PDIV). This research addresses this critical gap by introducing a partial-discharge-activated impulse frequency response analysis (PD-IFRA) approach that integrates PD activation and FRA diagnosis under controlled moderately high-voltage conditions.
1.3. Research Gap
During the actual operation of the transformer under normal or test conditions, PDs are generally voltage-dependent, i.e., they only occur when the applied voltage exceeds the PDIV, making their detection through non-conventional approaches such as low-voltage tests or indirect methods complicated as it may not always be active or detectable at lower voltage levels. Even though traditional FRA and IFRA methods are effective in diagnosing turn-to-turn faults, they have proved to be ineffective in diagnosing any possible sources of PD within a transformer. Assuming that FRA tests are augmented with voltages high enough to effectuate a PD, in this instance, they are likely to be employed preventatively for the initial examination of any presumed PD sources.
The practicality of this augmented application in the IFRA has not been wholly examined to date on fully assembled and operational transformers with all essential components including the core, windings, insulation, tank, bushings, and cooling systems. A study tackling this research deficiency and attempting to introduce an understanding of the preliminary assessment of PDs using the FRA method consequently becomes noteworthy.
Despite the effectiveness of conventional FRA and IFRA methods in diagnosing winding deformation and inter-turn faults, their capability to detect PD activity remains largely unexplored. Given that PD phenomena are voltage-dependent and may not be detectable at lower voltage levels, this study investigates the feasibility of extending FRA-based methods to higher voltages for early PD detection. By introducing a partial-discharge-activated impulse frequency response analysis (PD-IFRA) method, this study aims to provide a novel diagnostic approach that enhances transformer condition monitoring.
1.4. Research Objectives and Contributions
The main contributions of this study are as follows:
- Proposes a novel PD-IFRA technique, which systematically activates PD phenomena by exceeding the PD inception voltage (PDIV) using moderate impulse voltages without damaging transformer insulation.
- Demonstrates, for the first time, the feasibility of capturing PD-induced frequency response deviations directly through FRA transfer functions, validated through experiments on a fully assembled 315 kVA, 11 kV/420 V, Dyn11 power transformer.
- Establishes that PD phenomena produce distinctive frequency-domain signatures predominantly in the 10 kHz to 2 MHz range, providing clear guidance on frequency bands most sensitive to PD activity for diagnostic applications.
- Develops a statistical interpretation framework by combining CSD, MM, and DABS metrics to quantify deviations caused by short-circuit (SC) and PD faults in FRA signatures, improving diagnostic objectivity.
- Introduces a voltage-dependent FRA methodology that enables early-stage PD detection while preserving the capability for conventional mechanical fault diagnosis, contributing to more robust transformer condition monitoring and predictive maintenance strategies.
The main objectives of this study are as follows:
- To develop and demonstrate a PD-IFRA technique for early detection of PD in transformers.
- To experimentally investigate the effectiveness of PD-IFRA under different voltage levels on a full-sized 315 kVA, 11 kV/420 V Dyn11 transformer.
- To compare PD-IFRA results under normal, short-circuit, and PD conditions to quantify its sensitivity.
- To integrate and evaluate statistical parameters (CSD, MM, DABS) for enhancing PD diagnosis accuracy.
- To establish the voltage-dependent and frequency-dependent characteristics of PD activity detectable through FRA signatures.
The remainder of this paper is structured as follows: Section 2 describes the materials and methods used in the experimental study, including the test setup and measurement approach. Section 3 presents the results and discussion, highlighting the observed FRA response variations and statistical analysis. Section 4 provides conclusions and future research directions.
2. Materials and Methods
In this section, firstly, the description of the test object and the electrical connections for fabricating studied fault conditions are presented. The experimental setup procedure including details about the test circuit and PD fabrication methods is also presented. Additionally, the testing procedure details of the IFRA procedure at different voltage levels are presented. Analysis of the results is performed using three distinct statistical parameters. An illustration of how the investigations were carried out is illustrated in Figure 1.
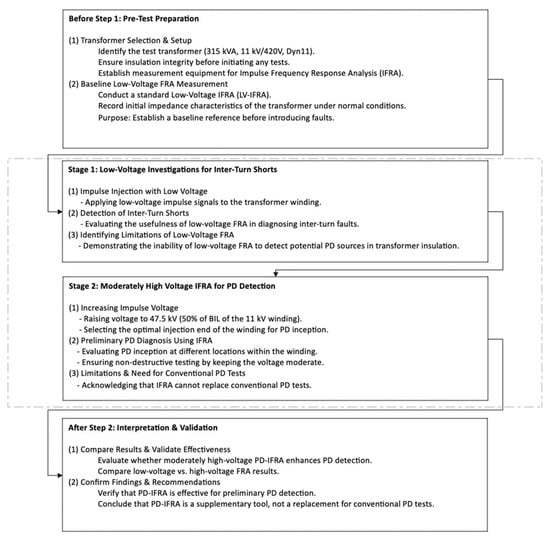
Figure 1.
Steps employed to fabricate fault conditions.
In the course of the experiment, the unit electrical connections and the practices recommended in FRA standards [14,15] and other written works were selected for the acquisition of the response signatures [17,18,19,20,21]. The experimental findings of the proposed IFRA were appraised with the assistance of the response signature plots and response signatures statistical features.
2.1. Test Object Description
The experiments were conducted on a 315 kVA, 11 kV/420 V, Dyn11 transformer. This unit has tap positions, i.e., electrical connection points along the winding that allow for voltage adjustment of the nominal voltage of the system () and secondary voltage regulation (off-load) within the given range (±5% in 2.5% steps). The windings are reachable through the bushings provided via the medium-voltage (MV) compartment. The turn-to-turn fault and the PDs were theoretically fabricated by gaining entry to the windings through the tapping provisions. Figure 2 illustrates the electrical connection of the unit with tappings.
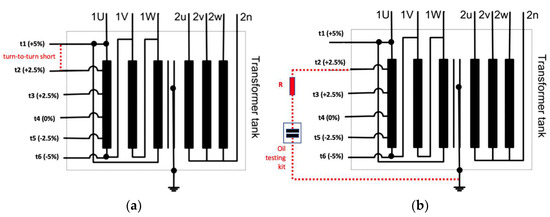
Figure 2.
Unit electrical connections are employed to fabricate fault conditions. (a) Turn-to-turn short. (b) PD.
The turn-to-turn shorts were replicated by coupling a 2400 Ω resistor part-way at the turn ratio selection points ( and ) in order to create a low-resistance path for current flow. When a voltage is applied, a high circulating current which distorts the magnetic flux in the affected winding section is generated. This can lead to localized heating, increased losses, and changes in frequency response, mimicking real-world transformer faults.
For replicating a prospective PD source across the primary insulation system which separates high-voltage (HV) windings from the steel core, steel tank, and other windings, ensuring electrical isolation and withstanding system operating and impulse voltages were coupled using the designated insulated entry points on the transformer for safely routing electrical conductors through the steel tank. The transparent oil testing kit with oil surrounding a 1 mm hemispherical electrode gap was used to assess the dielectric strength of transformer oil by applying an HV across the gap and observing breakdown behavior, contamination, and insulation performance, consequently serving as substantiating evidence for a PD phenomenon. To avert any irreversible damage to the unit on account of the replicated PD during the experiment, a suitable 43 kΩ, 50 kV-rated, 100 W, non-inductive wire-wound resistor was used for PD current limiting in series with the transformer oil testing kit.
The focus for the proposed study was primarily on the PD identification potential of comparatively high-magnitude impulse voltages. Consequently, only the findings incidental to the precursory diagnosis of PD sources are detailed in this section. The low-magnitude impulse-voltage-based experiment was carried out purely to illustrate the practicality in the turn-to-turn shorts diagnosis and corresponding drawbacks in identifying the occupancy of any prospective PD sources at these voltages.
A similar procedure was adhered to for the FRA test and measurements in both the turn-to-turn shorts and PD diagnosis.
2.2. Experimental Setup
Figure 3 illustrates the schematic diagram of the experimental setup. As a case in point, the PD source is demonstrated between the tapping position and the grounded steel tank. A lightning impulse voltage generator with a standard 1.2 μs ± 30% front time/50 μs ± 20% tail time waveform was used to apply a high-voltage impulse to terminal of the delta-connected winding. This follows IEC 60060-1 and IEEE Std 4 for lightning impulse testing [33,34]. The non-impulsed ends ( and ) of the delta winding which serve as floating or grounded terminals during the impulse test, influencing the voltage distribution, stress levels, and propagation of the impulse waveform within the winding, were shorted and grounded via a resistive voltage divider of 400 Ω. This ensures a controlled voltage distribution, damping oscillations, and preventing excessive transient overvoltages during impulse testing. As shown in Figure 3, the resistive voltage divider was designed to scale down the voltage at the non-impulsed end (1 V) of the winding, allowing for accurate measurement and analysis using a digital storage oscilloscope (DSO) without exceeding its input limits. All the terminals of the star-connection winding and the steel tank were shorted and grounded.
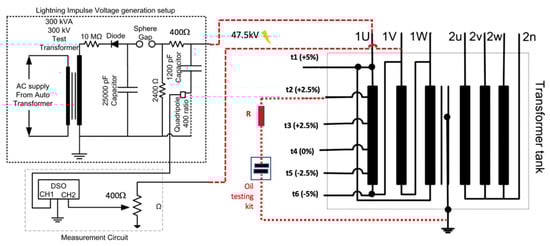
Figure 3.
Experimental setup.
The impulse voltage generator delivered high-voltage pulses with low energy capacity to reduce the risk of excessive stress or damage to the transformer insulation during testing. As a result, loading effects were observed leading to distortions and alterations in the impulse voltage waveform, affecting its shape and consistency during testing. The shape of the impulse voltage waveform was permissible, as it still fulfilled the FRA conditions comprising sufficient high-frequency components.
Various studies selected distinct measuring frequency spectrums for their FRA test and mainly zeroed in on the frequency spectrum ranging from 20 Hz to 12 MHz [35,36]. As the researchers carried out trials on the prolonged practicality of IFRA and were enthusiastic about the probe into the traditional FRA measuring frequency range, a range of 100 Hz to 20 MHz was more desirable. With the help of a local transformer manufacturer, the experiments were conducted in an HV lab with a Faraday cage to minimize noise and errors, using coaxial cables for test voltage application, signal measurement, and data acquisition, along with an independent earthing arrangement for the test bay.
2.3. Testing Procedure
The BIL of the 11 kV winding for impulse voltage testing is 95 kV (peak). To minimize the risk of damage to the transformer, preliminary PD diagnosis was conducted at 50% of BIL (47.5 kV peak). This ensures that the test remains non-destructive while allowing PD inception to be observed.
As shown in Figure 2a, the tapping is at the low position, is at the middle position, and is at the high position along the winding. These positions were chosen for testing inter-turn short circuits and PD detection to align with the test plan described in Table 2.
Table 2.
Tests for the diagnosis of turn-to-turn shorts and PDs.
For inter-turn short circuit detection, impulse injection was carried out at with a test voltage of 5 kV:
- SC1: Inter-turn short at (low tap).
- SC2: Inter-turn short at (middle tap).
- SC3: Inter-turn short at (high tap).
For PD detection, impulse injection was carried out at 1 U and 1 V with a test voltage of 47.5 kV (50% BIL):
- PD @ t2: Detected at (low tap) with injection at 1 U.
- PD @ t4: Detected at (middle tap) with injection at 1 U.
- PD @ t4: Detected at (middle tap) with injection at 1 V.
- PD @ t5: Detected at (high tap) with injection at 1 V.
To overcome voltage limitations at distant taps, the impulse injection terminal was switched from to for detecting PD at taps and , ensuring sufficient voltage reached these locations for reliable PD inception. Additionally, a 43 kΩ, 50 kV-rated resistor was placed in series with the oil testing kit to limit current and prevent excessive PD-induced stress on the transformer insulation. This ensured that PD conditions were emulated without permanent transformer damage. To enhance the reliability of PD detection, impulse injection and measurement locations were interchanged during testing:
- Impulse injection at → Detects PD near and .
- Impulse injection at → Detects PD near and .
This approach ensures a systematic investigation of IFRA’s applicability without compromising transformer safety while providing insights into inter-turn short circuits and PD behavior, which details the discharge-free (DF-1 and DF-2) and PD-detected cases. Test summary:
- Inter-turn short circuit detection was effective at all voltage levels; hence, the test voltage for short-circuit diagnosis was fixed at 5 kV (peak).
- PD sources remained undetectable below 10 kV, meaning FRA data at these levels can be used for establishing a “discharge-free” reference signature.
- PD inception voltage varied across tap positions (, , ), with all cases showing PD activity above 30 kV. PD pulses increased in magnitude and frequency as voltage exceeded their respective inception thresholds.
- To ensure consistency across all tests, a standardized impulse test voltage of 47.5 kV was selected to confirm PD activity at different locations.
This proposed approach ensures a systematic investigation of IFRA’s applicability without compromising transformer safety while providing insights into inter-turn short circuits and PD behavior.
2.4. Statistical Analysis Approach
Table 3 shows the statistical parameters that are adopted to interpret the response signature against the fingerprint. The formula for evaluating typical values with fingerprint and measurements, ensuring similarity, is assessed through statistical parameters. The comparative statistical parameters employed are standard deviation (CSD), minimum–maximum ratio (MM absolute), and absolute average difference (DABS) [37,38].
Table 3.
Statistical methods and their typical values for FRA interpretation.
Considerable variations of these statistical parameter values from the “typical value” were used to identify the fault. In the next section, the results of the proposed study will be presented.
3. Results
The results were appraised by making two comparisons. Firstly, a comparative analysis was made between baseline, i.e., fingerprint and response signature for various cases to observe any apparent variances in the waveforms for PD diagnosis. Secondly, a statistical analysis has been conducted using statistical parameters like CSD, MM, and DABS ratio to interpret and make conclusions about the studied cases. The fingerprint of the 315 kVA, 11 kV/420 V, Dyn11 transformer prior to replicating the studied fault conditions is shown in Figure 4.
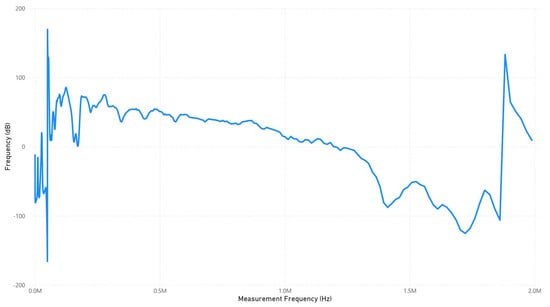
Figure 4.
Baseline of a 315 KVA 11 kV, 420 V unit.
Since this unit is in normal condition, the sharp spike near 2 MHz in the FRA plot could be due to poor electrical connections, loose tap changer contacts, or grounding issues. Improperly tightened bushing connections or high-contact resistance at terminals can introduce sudden impedance mismatches, causing resonance effects at high frequencies.
3.1. Relatively Low-Magnitude Impulse Voltages Experiment
Experimental works were carried out first at a low-impulse voltage magnitude of 5 kV to diagnose the replicated turn-to-turn winding shorts.
Figure 5 shows that the FRA response at SC’s highest tap (+5%) closely follows the baseline but shows deviations, particularly in the mid- to high-frequency range, suggesting localized impedance changes due to turn-to-turn winding shorts. The spike near 2 MHz indicates a resonance shift, possibly linked to altered inductive or capacitive coupling from the shorted turns under the 5 kV low-impulse-voltage test.
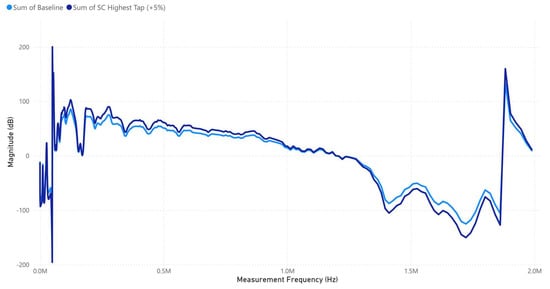
Figure 5.
SC Highest Tap (+5%) signature response.
Figure 6 shows that the SC mid-tap (±2.5%) response closely follows the baseline but exhibits moderate deviations, particularly in the mid- to high-frequency range, indicating localized impedance variations. The resonance spike near 2 MHz remains prominent, suggesting persistent capacitive effects, likely influenced by turn-to-turn faults or slight variations in the tap winding configuration under the 5 kV low-impulse-voltage test.
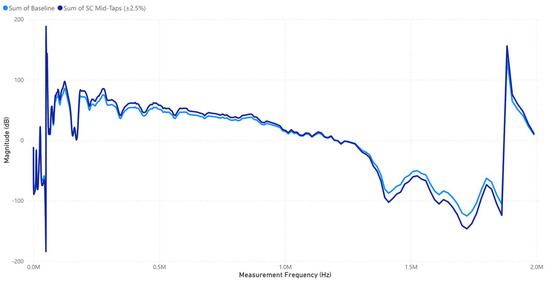
Figure 6.
SC Mid-Taps (±2.5%) signature response.
In Figure 7, the SC’s lowest tap (−5%) response follows the baseline but shows increased deviations, particularly in the mid- to high-frequency range, suggesting greater impedance variations. The resonance spike near 2 MHz remains prominent, indicating persistent capacitive coupling effects, likely exacerbated by turn-to-turn faults or changes in leakage reactance under the 5 kV low-impulse-voltage test.
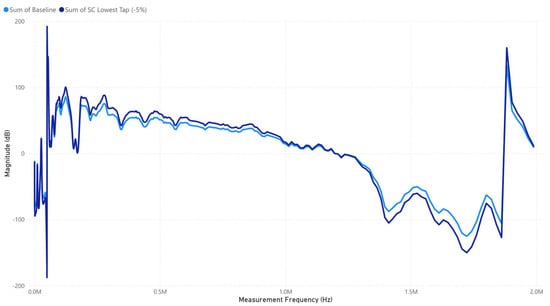
Figure 7.
SC Lowest Tap (−5%) signature response.
After discerning the importance of LIVE in diagnosing the PD phenomena, additional examinations were carried out by leaning towards a comparatively high impulse voltage as presented in the next subsection.
3.2. Comparatively High-Magnitude Impulse Voltages
The PD phenomena were found only when the comparatively high-magnitude impulse voltages were elevated over the PDIV. Additionally, the inception of discharge was discovered to transpire directly near 40 kV. Figure 8 shows the PD’s highest tap (+5%) response shows noticeable deviations from the baseline, particularly in the mid- to high-frequency range, indicating PD-induced impedance variations. The persistent resonance spike near 2 MHz suggests capacitive effects linked to discharge activity, consistent with PD inception occurring above 40 kV, confirming voltage-dependent PD behavior under the 47.5 kV impulse test.
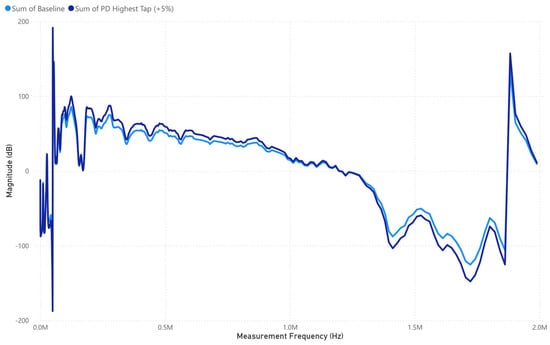
Figure 8.
PD Highest Tap (+5%) signature response.
Figure 9 shows that the PD mid-tap (±2.5%) response closely follows the baseline but shows deviations in the mid- to high-frequency range, indicating PD-induced impedance variations. The resonance spike near 2 MHz remains prominent, reinforcing the influence of partial discharges, which were observed only when the impulse voltage exceeded 40 kV, confirming the voltage-dependent nature of PD activity under the 47.5 kV test conditions.
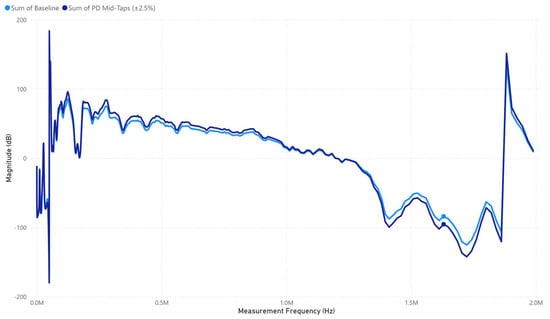
Figure 9.
PD Mid-Tap (±2.5%) signature response.
Figure 10 shows that the PD lowest tap (−5%) response shows significant deviation from the baseline, particularly in the low- to mid-frequency range, suggesting strong PD-induced impedance alterations. The attenuation in this range indicates severe energy dissipation, likely due to increased dielectric stress, reinforcing the observation that PD inception occurred only above 40 kV, with intensified effects under the 47.5 kV impulse voltage test.
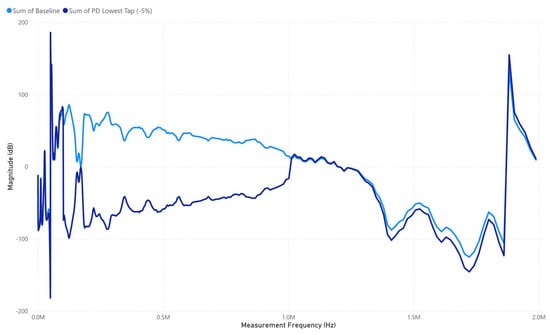
Figure 10.
PD Lowest Tap (−5%) signature response.
In the subsequent subsection, a statistical analysis will be conducted to interpret and make conclusions about the fabricated fault conditions.
3.3. Statistical Analysis
This subsection presents a comparison carried out between the IFRA results of different SC and PD conditions on a statistical index basis. The absolute value of CSD, MM, and DABS ratios were applied for formulating the comparison. The presented parameters were used to provide distinct responsiveness in probing the variations between the compared cases. For this reason, it is advisable to employ multiple statistical parameters to reach a conclusion on the condition of the transformer. The measurement frequency of the test was categorized into five frequency bands to narrow fault conditions associated with each band to ensure maximum sensitivity. This method minimized the interpretation challenges.
In Table 4, the statistical CSD method is used to analyze deviations in transformer response under different tap positions. In this case, deviations are observed across different frequency bands, with certain subbands showing significantly higher values. At 10–1000 Hz, the highest deviation is found in the lowest tap (−5%) at 10.38, followed by the highest tap (+5%) at 10.09. The mid-taps (±2.5%) recorded the lowest deviation at 7.06. This suggests that, at lower frequencies, tap position changes have a noticeable but relatively moderate impact. In the 1000–10,000 Hz band, the deviations decrease significantly. The highest tap (+5%) has a value of 3.81, while the lowest tap (−5%) recorded 4.05. Mid-taps remain at 3.14, showing that, within this range, there is greater uniformity in response across tap positions.
Table 4.
SC Analysis in FRA Testing using “CSD” Statistical method.
A major shift occurs in the 10,000–100,000 Hz range, where the highest tap (+5%) reaches an extreme deviation of 35.10, significantly higher than any other frequency band. The lowest tap (−5%) also exhibits a large deviation at 29.72, while mid-taps remain high at 26.99. This indicates that mid-frequency responses experience substantial shifts under different tap settings, suggesting winding deformations or resonance effects.
In the 100,000–1,000,000 Hz range, the deviations reduce but remain noticeable. The highest tap (+5%) records 12.09, while the lowest tap (−5%) follows closely at 11.11. Mid-taps settle at 9.79, showing a decrease in variation but still indicating measurable impact in this range.
Finally, in the 1,000,000–2,000,000 Hz range, another sharp rise in deviation is observed. The highest tap (+5%) reaches 34.71, with the lowest tap (−5%) at 34.53 and the mid-taps at 31.79. These values highlight that very high-frequency response changes significantly with tap position, likely due to increased capacitive and inductive effects. The most critical deviations occur in the 10,000–100,000 Hz and 1,000,000–2,000,000 Hz ranges, where extreme CSD values suggest significant alterations in the transformer’s internal impedance. These values warrant further investigation into possible structural changes in the winding system.
In Table 5, the MM statistical method provides insight into how similar the frequency response remains across different tap settings. Unlike CSD, MM values are generally much smaller, indicating that, while variations exist, the magnitude response remains relatively stable. In the 10–1000 Hz band, the MM values are almost negligible, with the highest tap (+5%) at 0.14, mid-taps at 0.01, and the lowest tap at 0.01. These values suggest that the transformer’s response at low frequencies remains largely unchanged despite different tap settings. As frequency increases to the 1000–10,000 Hz range, a slightly larger deviation appears in the highest tap (+5%) at 0.43, while mid-taps and the lowest tap remain at 0.00. This suggests that some variations begin to emerge, but they are not substantial. In the 10,000–100,000 Hz and 100,000–1,000,000 Hz bands, the MM values stabilize at 0.01 for all tap settings. This indicates that, even in these frequency ranges, the overall magnitude response remains consistent.
Table 5.
SC Analysis in FRA Testing using “MM” Statistical method.
Finally, in the 1,000,000–2,000,000 Hz range, the MM ratio drops completely to 0.00 across all tap positions, showing no meaningful deviation. This confirms that the MM method is not sensitive to structural or electrical changes observed in CSD or DABS. Given these results, the MM method appears to be ineffective at detecting tap-dependent variations in SC analysis, reinforcing the importance of using multiple statistical methods to gain a complete understanding of transformer behavior.
In Table 6, the DABS method reveals absolute differences in frequency response, which can help identify variations caused by structural changes. Unlike MM, DABS tends to show more variation, especially in certain frequency bands. In the 10–1000 Hz band, the mid-taps (±2.5%) and lowest tap (−5%) show extremely high deviations at 61.78 and 65.19, respectively, while the highest tap (+5%) remains at 1.86. This is a significant finding, indicating that tap changes induce large variations in low-frequency response, possibly due to changes in leakage flux and winding movement. In the 1000–10,000 Hz band, deviations decrease but remain substantial. The highest tap (+5%) records 11.53, while the lowest tap (−5%) shows 12.91, suggesting that, while the impact is less severe than in the low-frequency band, tap changes still introduce variations. For the 10,000–100,000 Hz and 100,000–1,000,000 Hz bands, the deviations stabilize in the range of 6.43–11.62, indicating that variations persist but are not as extreme as in the lower frequency ranges. In the 1,000,000–2,000,000 Hz band, the deviations remain moderate, with values from 7.98–9.39. This suggests that, while high frequencies still experience variations, they are not as pronounced as at lower frequencies.
Table 6.
SC Analysis in FRA Testing using “DABS” Statistical method.
The most significant deviations appear in the 10–1000 Hz range, where mid-taps and the lowest taps show extreme variations. This highlights that low-frequency behavior is highly sensitive to mechanical changes in SC conditions.
In Table 7, the CSD method identifies deviations in frequency response, making it useful for detecting electrical faults such as PD. In the 10–1000 Hz range, the values remain relatively low, with the highest tap (+5%) at 5.74, mid-taps (±2.5%) at 3.62, and the lowest tap (−5%) at 5.94. These values suggest that PD effects are minimal in the low-frequency range, which aligns with the general expectation that PD-induced deviations are more pronounced at higher frequencies. In the 1000–10,000 Hz range, deviations slightly decrease, with values ranging from 2.46 to 3.06. This suggests that while PD activity is present, it does not induce significant changes in this band. A major shift occurs in the 10,000–100,000 Hz band, where mid-taps (±2.5%) exhibit the highest CSD value of 26.12, followed by the lowest tap (−5%) at 24.50 and the highest tap (+5%) at 19.04. This is a critical subband where PD effects become highly prominent, suggesting that PD modifies the impedance characteristics of the winding at these frequencies.
Table 7.
PD Analysis in IFRA Testing using “CSD” Statistical method.
In the 100,000–1,000,000 Hz range, the deviations drop again, but mid-taps still record a notable value of 7.85, which is higher than the neighboring frequency bands. This implies that, while PD effects are less significant at these frequencies, there is still some residual impact. The 1,000,000–2,000,000 Hz band shows another major increase in deviation, with mid-taps reaching 20.24, the second-highest deviation in the entire dataset. This suggests that high-frequency resonance effects due to PD are particularly dominant in the very high-frequency spectrum.
Key Findings from CSD Analysis
- The most significant deviations appear in the 10,000–100,000 Hz and 1,000,000–2,000,000 Hz ranges.
- Mid-taps (±2.5%) consistently show higher deviations than the other tap settings, indicating that this tap position is more sensitive to PD-related variations.
The increase in deviations at high frequencies suggests that PD alters the transformer’s high-frequency impedance response, possibly due to insulation degradation and increased dielectric losses.
In Table 8, the MM method is used to compare the similarity in magnitude response across different cases. Unlike CSD, MM values remain relatively low, indicating that, while PD causes some variation, it does not significantly change the overall response shape. In the 10–1000 Hz range, MM values remain low, with the highest tap (+5%) at 0.14 and lowest tap (−5%) at 0.14, showing little distinction across tap settings. The 1000–10,000 Hz band records slightly higher values, peaking at 0.46 for mid-taps (±2.5%), suggesting that some variations are introduced by PD. For the 10,000–100,000 Hz and 100,000–1,000,000 Hz bands, MM values stabilize at 0.01 across all tap positions, indicating that PD does not significantly alter the magnitude response in these regions. At 1,000,000–2,000,000 Hz, MM values drop to 0.00, showing that, in this very high-frequency range, PD does not influence the similarity of the magnitude response.
Table 8.
PD Analysis in IFRA Testing using “MM” Statistical Method.
Key Findings from MM Analysis
- MM values remain low throughout all frequency ranges, indicating that the magnitude response remains mostly unchanged despite PD presence.
- The highest MM deviation appears at 1000–10,000 Hz (0.46 at mid-taps), suggesting that minor PD-induced differences exist in this range.
The lack of significant MM deviations confirms that PD effects are better captured by CSD and DABS, rather than MM.
In Table 9, the DABS method quantifies the absolute deviation in FRA response, making it a valuable parameter for identifying changes caused by PD. This method is particularly useful in isolating extreme deviations. At 10–1000 Hz, DABS values remain low (≤0.66), confirming that PD does not strongly influence this region. A noticeable increase occurs in the 1000–10,000 Hz range, where the lowest tap (−5%) reaches 6.92, while the highest tap (+5%) follows closely at 6.15. This suggests that PD begins to introduce measurable deviations in this frequency band.
Table 9.
PD Analysis in IFRA Testing using “DABS” Statistical method.
In the 10,000–100,000 Hz band, the highest tap (+5%) reaches 7.60, showing that PD effects continue to grow in magnitude. A major anomaly is found in the 100,000–1,000,000 Hz range, where the lowest tap (−5%) records an extreme deviation of 107.04, which is drastically higher than any other recorded value. This suggests a significant PD-induced alteration in transformer response, likely due to dielectric breakdown or insulation aging. No other frequency band shows such a severe deviation. In the 1,000,000–2,000,000 Hz range, the DABS values return to moderate levels, with the highest tap (+5%) at 8.45 and lowest tap (−5%) at 7.61, indicating that the extreme PD-induced variation was concentrated in the previous frequency range.
Key Findings from DABS Analysis
- The most critical anomaly occurs at 100,000–1,000,000 Hz, where DABS reaches 107.04 at the lowest tap (−5%).
- High-frequency response is more affected by PD than low-frequency response, with increasing deviations from 1000–1,000,000 Hz.
- DABS is highly effective in capturing PD-induced changes, more so than MM.
The extreme deviation suggests potential insulation failure or a localized PD event causing major changes in winding response.
The statistical analysis confirms that CSD, MM, and DABS exhibit distinct sensitivities to transformer condition variations, reinforcing the necessity of a multi-parameter approach for accurate diagnostics. The most critical deviations were observed in the 10,000–100,000 Hz and 1,000,000–2,000,000 Hz ranges, where CSD and DABS revealed extreme shifts, particularly at mid-taps and the lowest tap (−5%), indicating severe impedance alterations linked to SC and PD phenomena.
4. Discussion
4.1. Results Discussion
The findings of this study reveal significant frequency-dependent variations in the transformer’s response under short-circuit (SC) and partial discharge (PD) conditions, highlighting the importance of voltage-dependent analysis in transformer diagnostics. While traditional low-impulse-voltage excitation (LIVE) testing was sufficient for detecting mechanical deformations, it failed to identify incipient PD activity, reaffirming the need to extend FRA-based methods to higher voltages. The introduction of partial-discharge-activated IFRA (PD-IFRA) provides an enhanced diagnostic approach, enabling early PD detection while maintaining the strengths of conventional FRA in structural fault identification.
A notable trend observed in Table 10 is that low-frequency response (10–1000 Hz) exhibited significant variations across different tap positions, particularly in the lowest tap (−5%) condition, where core effects became dominant. This deviation is attributed to changes in magnetic permeability and flux distribution, which alter the impedance characteristics at these frequencies. Mid-taps (±2.5%) showed moderate deviations, indicating that, while inter-turn faults may be present, they are less pronounced than in extreme tap positions.
Table 10.
SC Analysis in FRA Testing.
At mid-range frequencies (1000–10,000 Hz), resonance shifts were evident, particularly in the lowest tap (−5%) position, where major impedance fluctuations suggest winding deformation or localized inductance changes. The highest tap (+5%) also exhibited resonance shifts, albeit to a lesser extent, indicating that variations in tap position influence the effective inductance of the transformer windings. Mid-taps remained more stable, reinforcing their role as a transitional state between extreme tap variations. At higher frequencies (100,000–1,000,000 Hz), deviations became less pronounced unless severe winding deformation was present, as evidenced by the limited impact recorded in Table 10. The minor response variations in this range suggest that, while mechanical faults influence mid-frequency bands, high-frequency deviations are primarily indicative of insulation-related anomalies rather than structural distortions. This is a key distinction, as it underscores the importance of analyzing different frequency bands separately when diagnosing transformer health.
The PD analysis results presented in Table 11 indicate that low-frequency bands (10–1000 Hz) remained largely unaffected by PD activity across all tap settings, confirming that PD effects do not manifest significantly at low frequencies. This supports the widely accepted premise that PD detection requires higher test voltages and is most effective in mid- to high-frequency ranges. As impulse voltage increased beyond 1000–10,000 Hz, early-stage PD signals began to emerge, particularly in the mid-taps (±2.5%) condition, where minor insulation degradation was evident. The lowest tap (−5%) exhibited slight signs of insulation stress near the tap changer region, suggesting that mechanical and electrical stress at this point may contribute to early PD activity. However, the deviations remained small, reinforcing the idea that this frequency range serves as a transitional phase for PD development rather than a primary detection zone.
Table 11.
PD Analysis in FRA Testing.
A major shift occurred in the 10,000–100,000 Hz range, where PD signals became more apparent, particularly in the lowest tap (−5%), which exhibited a rise in PD noise. Mid-taps (±2.5%) also showed noticeable deviations, reflecting minor insulation issues. These results align with previous findings that indicate PD effects begin to significantly influence FRA response in mid- to high-frequency bands, making this range a key diagnostic zone for early PD identification.
At 100,000–1000,000 Hz, PD noise levels increased significantly, with Table 11 showing strong insulation degradation effects, particularly in the highest tap (+5%) and lowest tap (−5%) conditions. Mid-taps (±2.5%) experienced more apparent PD distortions, reinforcing the notion that this frequency range is critical for detecting PD-induced impedance variations. The increased high-frequency deviations suggest progressive insulation breakdown and the onset of more severe PD activity. The most significant PD effects were observed in the 1,000,000–2,000,000 Hz range, where Table 11 shows a strong PD presence in the lowest tap (−5%) condition, indicating extreme insulation degradation. This aligns with previous research indicating that high-frequency FRA deviations are the most reliable indicators of PD activity, as they reflect changes in dielectric properties, capacitance variations, and localized discharge effects. The highest tap (+5%) also showed considerable PD noise, confirming that PD-induced frequency distortions intensify as voltage stress increases.
The combined analysis of SC and PD conditions confirms that distinct frequency bands exhibit varying sensitivity to different fault mechanisms. SC-induced impedance variations predominantly affect low- and mid-frequency ranges, where winding deformation and resonance shifts alter inductance and flux characteristics. In contrast, PD-induced deviations are most pronounced in high-frequency ranges, where insulation stress and dielectric losses introduce significant frequency-dependent distortions. The findings emphasize the importance of extending FRA-based diagnostics to higher voltages, particularly for PD detection, which remains undetectable at low impulse voltage levels. The introduction of PD-IFRA as a novel diagnostic approach offers a valuable complement to conventional FRA testing, enabling early-stage PD detection while maintaining the effectiveness of structural fault analysis. Ultimately, this study underscores the necessity of employing multi-parameter statistical analysis to enhance diagnostic accuracy. CSD proved highly effective in detecting both SC- and PD-induced deviations, particularly in mid- to high-frequency ranges, while DABS effectively captured extreme PD-related anomalies. The MM method, by contrast, exhibited low sensitivity to both SC and PD variations, confirming that magnitude-based methods alone are insufficient for comprehensive transformer fault identification.
4.2. Comparative Discussion with Related Studies
The results of the proposed PD-IFRA technique confirm its effectiveness in detecting PD-induced deviations within the frequency range of 10 kHz–2 MHz, aligning with the observations made in [26,28] where PD effects were also found to predominantly influence mid- to high-frequency responses. However, unlike [26], where PD detection was conducted via impulse testing supplemented with conventional PD detectors, PD-IFRA eliminates the need for additional PD measuring equipment by allowing direct detection through FRA signatures. Compared to the work in [27], which highlighted IFRA’s sensitivity to pulse parameter variations, the present study mitigates this challenge by applying a carefully controlled moderate impulse voltage (up to 50% BIL), ensuring sufficient PD inception without damaging the insulation. Furthermore, the statistical analysis framework developed in this study extends beyond previous works [23,24,25] by not only characterizing mechanical faults but also quantitatively distinguishing PD effects using CSD, MM, and DABS metrics. This integrated approach provides a more reliable and objective interpretation compared to prior works that relied solely on visual or qualitative signature comparisons. Overall, the findings reinforce and extend existing knowledge, providing a systematic and safe methodology for PD detection using FRA.
4.3. Comparison of PD-IFRA with Conventional and IFRA-Based PD Detection Methods
To further highlight the distinction between PD-IFRA and existing PD detection techniques, Table 12 compares the proposed method with both conventional PD detection practices and recent IFRA/OLI-based methods.
Table 12.
Comparison of PD-IFRA with conventional and IFRA-based PD detection methods.
As shown in Table 12, PD-IFRA provides an integrated solution capable of activating and diagnosing PD phenomena within the FRA framework itself, without the need for external PD detectors. Unlike conventional methods that rely on time-domain pulse monitoring or external calibrators, PD-IFRA captures PD-induced deviations directly in the frequency domain, simplifying diagnostics while extending FRA’s applicability. This novel approach bridges the gap between mechanical and insulation fault diagnostics, offering a more comprehensive transformer health assessment tool.
4.4. Significance Levels and Practical Interpretation of Statistical Results
To further interpret the diagnostic value of the obtained statistical results, practical significance levels were established based on patterns consistently observed during the experimental analysis. For the CSD parameter, deviations were considered significant when CSD values exceeded 10 in any frequency band, as such values consistently appeared in both PD and short-circuit (SC) fault conditions, particularly within the 10 kHz–2 MHz range. Likewise, MM values dropping below 0.5 were found to indicate reduced signature similarity, typically aligning with the presence of mechanical faults or PD-induced deviations. For the DABS parameter, deviations greater than 5 in the lower frequency bands and exceeding 50 in the high-frequency band (100 kHz–1 MHz) were observed exclusively during confirmed PD activity, as reported in Table 9. These thresholds were determined empirically based on experimental trends, where the fault-free baseline measurements consistently exhibited lower values, while cases involving PD and SC faults led to pronounced parameter deviations. For example, in Table 9, the DABS value exceeded 100 for the PD lowest tap (−5%) case, signifying a substantial impedance alteration linked to insulation degradation and localized PD activity. Similarly, CSD values above 20 were prevalent in the mid- and high-frequency ranges during PD tests, reinforcing the sensitivity of this parameter to insulation defects. In practical transformer diagnostics, such deviations offer quantifiable fault indicators. Instead of relying solely on visual signature interpretation, which is subjective and experience-dependent, the combination of these statistical parameters provides a systematic and objective fault identification methodology. Maintenance practitioners and engineers can apply these significance thresholds as decision-support tools when interpreting FRA results, distinguishing between healthy, mechanically deformed, and PD-affected windings with improved confidence. While these thresholds were derived under controlled laboratory conditions, they serve as a promising foundation for developing standardized diagnostic criteria in future large-scale and field validation studies.
4.5. Practical Implications for Industrial Applications
The results obtained from this study have direct implications for the power industry, especially in the fields of transformer condition monitoring, predictive maintenance, and asset management. In typical industrial settings, PD detection and mechanical fault diagnosis are carried out separately—FRA is used to identify mechanical deformations, while dedicated PD detectors (IEC 60270, UHF, or acoustic methods) are employed to detect PD activity. This dual-process approach often increases testing time, equipment requirements, and operational complexity. The proposed PD-IFRA technique provides a streamlined solution by integrating PD detection into the existing FRA framework without the need for additional PD measurement instruments. From a practical perspective, this allows substation engineers and transformer maintenance teams to:
- Perform simultaneous mechanical and insulation condition assessments using a single setup.
- Detect PD inception during routine FRA testing when moderate impulse voltages are applied (up to 50% BIL).
- Identify early-stage PD sources that might otherwise remain undetected by traditional FRA or time-domain PD tests, especially in transformers with localized or weak PD activity.
- Minimize diagnostic uncertainty, as PD-IFRA correlates frequency-domain features directly to PD activity, reducing reliance on subjective visual interpretation of FRA signatures.
- Enhance predictive maintenance strategies by spotting insulation degradation before PD fully develops under service conditions, allowing for timely interventions.
In addition, PD-IFRA can be easily integrated into existing testing protocols for power utilities, transformer manufacturers, and third-party diagnostic service providers, especially where impulse voltage generators are already used for lightning impulse testing. Since the method does not require exceeding 50% of the BIL, it remains safe and non-destructive, preserving transformer insulation integrity during testing.
5. Conclusions
This study demonstrates that extending frequency response analysis (FRA) to moderate impulse voltages enhances its sensitivity to partial discharge (PD) detection, bridging the gap between conventional mechanical fault diagnostics and early-stage insulation assessment. While low-voltage FRA remains effective for detecting winding deformations, PD-activated IFRA (PD-IFRA) reveals voltage-dependent dielectric degradation effects, particularly in the 10 kHz–2 MHz range. Statistical analysis confirms that CSD and DABS effectively quantify PD-induced deviations, while MM exhibits low sensitivity to both SC and PD faults. The findings reinforce the necessity of frequency-segmented and voltage-dependent analysis in transformer diagnostics. PD-IFRA provides a non-invasive approach to early PD detection, complementing traditional PD measurement techniques.
Future research should focus on on-site validation under operational conditions, refinement of high-voltage FRA methodologies, and integration with real-time PD monitoring systems to improve transformer asset management and grid reliability.
Further, it will extend PD-IFRA testing to include varied operational conditions such as different transformer types, varying load levels, and environmental influences to further validate and generalize the technique for real-world power system applications.
Funding
This research received no external funding.
Data Availability Statement
The data is available from the author upon request.
Acknowledgments
The author would like to acknowledge all the technical support given by test engineers at JJ Industries involved in this work.
Conflicts of Interest
The author declares no conflict of interest.
Abbreviations
The following abbreviations are used in this manuscript:
| BIL | Basic Insulation Level |
| CSD | Comparative Standard Deviation |
| DABS | Absolute Average Difference |
| DF-1, DF-2 | Discharge-Free Cases 1 and 2 |
| DSO | Digital Storage Oscilloscope |
| EEVTF | End-to-End Voltage Transfer Function |
| FRA | Frequency Response Analysis |
| IFRA | Impulse Frequency Response Analysis |
| LI | Lightning Impulse |
| LIVE | Low Impulse Voltage Excitation |
| LV | Low Voltage |
| LVPG | Low-Voltage Pulse Generator |
| MM Ratio | Minimum–Maximum Ratio |
| MV | Medium Voltage |
| OLI | Oscillating Lightning Impulse |
| PD | Partial Discharge |
| PDIV | Partial Discharge Inception Voltage |
| PD-IFRA | Partial-Discharge-Activated Impulse Frequency Response Analysis |
| SATF | Self-Admittance Transfer Function |
| SC1, SC2, SC3 | Short-Circuit Cases 1, 2, and 3 |
| SFRA | Sweep Frequency Response Analysis |
| SITF | Self-Impedance Transfer Function |
| TVTF | Transfer Voltage Transfer Function |
| TRV | Transient Recovery Voltage |
| UCL | Upper Control Limit |
| LCL | Lower Control Limit |
| Mean Response Function |
References
- Rokani, V.; Kaminaris, S.D.; Karaisas, P.; Kaminaris, D. Power Transformer Fault Diagnosis Using Neural Network Optimization Techniques. Mathematics 2023, 11, 4693. [Google Scholar] [CrossRef]
- Baker, E.; Nese, S.V.; Dursun, E. Hybrid Condition Monitoring System for Power Transformer Fault Diagnosis. Energies 2023, 16, 1151. [Google Scholar] [CrossRef]
- Ivanov, G.; Spasova, A.; Mateev, V.; Marinova, I. Applied Complex Diagnostics and Monitoring of Special Power Transformers. Energies 2023, 16, 2142. [Google Scholar] [CrossRef]
- Kim, C.; Cho, K.; Joe, I. Artificial Intelligence-Based Fault Diagnosis for Steam Traps Using Statistical Time Series Features and a Transformer Encoder-Decoder Model. Electronics 2025, 14, 1010. [Google Scholar] [CrossRef]
- Beheshti Asl, M.; Fofana, I.; Meghnefi, F.; Brahami, Y.; Souza, J.P.D.C. A Comprehensive Review of Transformer Winding Diagnostics: Integrating Frequency Response Analysis with Machine Learning Approaches. Energies 2025, 18, 1209. [Google Scholar] [CrossRef]
- Zhao, Z.; Tang, C.; Yao, C.; Zhou, Q.; Xu, L.; Gui, Y.; Islam, S. Improved method to obtain the online impulse frequency response signature of a power transformer by multi scale complex CWT. IEEE Access 2018, 6, 48934–48945. [Google Scholar]
- Al-Ameri, S.M.; Kamarudin, M.S.; Yousof, M.F.; Salem, A.A.; Banakhr, F.A.; Mosaad, M.I.; Abu-Siada, A. Understanding the influence of power transformer faults on the frequency response signature using simulation analysis and statistical indicators. IEEE Access 2021, 9, 70935–70947. [Google Scholar] [CrossRef]
- Arumugam, S. Investigations on using white noise as a test signal for performing frequency response measurements on transformers. Electr. Power Syst. Res. 2022, 202, 107586. [Google Scholar] [CrossRef]
- Alsuhaibani, S.; Khan, Y.; Beroual, A.; Malik, N.H. A Review of Frequency Response Analysis Methods for Power Transformer Diagnostics. Energies 2016, 9, 879. [Google Scholar] [CrossRef]
- Jin, L.; Kim, D.; Abu-Siada, A.; Kumar, S. Oil-Immersed Power Transformer Condition Monitoring Methodologies: A Review. Energies 2022, 15, 3379. [Google Scholar] [CrossRef]
- Piotrowski, T.; Rozga, P.; Kozak, R. Comparative Analysis of the Results of Diagnostic Measurements with an Internal Inspection of Oil-Filled Power Transformers. Energies 2019, 12, 2155. [Google Scholar] [CrossRef]
- Nadolny, Z. Design and Optimization of Power Transformer Diagnostics. Energies 2023, 16, 6466. [Google Scholar] [CrossRef]
- Vita, V.; Fotis, G.; Chobanov, V.; Pavlatos, C.; Mladenov, V. Predictive Maintenance for Distribution System Operators in Increasing Transformers’ Reliability. Electronics 2023, 12, 1356. [Google Scholar] [CrossRef]
- IEEE PC57.149/D3.2; IEEE Approved Draft Guide for the Application and Interpretation of Frequency Response Analysis for Oil-Immersed Transformers. IEEE: New York, NY, USA, 2024; pp. 1–55. Available online: https://ieeexplore.ieee.org/document/10619002/ (accessed on 28 February 2025).
- IEEE Std C57.149-2024 (Revision of IEEE Std C57.149-2012); IEEE Guide for the Application and Interpretation of Frequency Response Analysis for Oil-Immersed Transformers. IEEE: New York, NY, USA, 2025; pp. 1–55. Available online: https://ieeexplore.ieee.org/document/10907879 (accessed on 28 February 2025).
- CIGRE. Mechanical-Condition Assessment of Transformer Windings Using Frequency Response Analysis (FRA). In Technical Brochure 342; CIGRE: Paris, France, 2008; pp. 1–67. Available online: https://www.e-cigre.org/publications/detail/342-mechanical-condition-assessment-of-transformer-windings-using-frequency-response-analysis-fra.html (accessed on 28 February 2025).
- Arunachalam, K.; Madanmohan, B.; Rajamani, R.; Prabaharan, N.; Haes Alhelou, H.; Siano, P. Extended Use for the Frequency Response Analysis: Switching Impulse Voltage Based Preliminary Diagnosis of Potential Sources of Partial Discharges in Transformer. Appl. Sci. 2020, 10, 8283. [Google Scholar] [CrossRef]
- Balakrishnan, G.K.; Yaw, C.T.; Koh, S.P.; Abedin, T.; Raj, A.A.; Tiong, S.K.; Chen, C.P. A Review of Infrared Thermography for Condition-Based Monitoring in Electrical Energy: Applications and Recommendations. Energies 2022, 15, 6000. [Google Scholar] [CrossRef]
- Banaszak, S.; Gawrylczyk, K.M.; Trela, K. Frequency Response Modelling of Transformer Windings Connected in Parallel. Energies 2020, 13, 1395. [Google Scholar] [CrossRef]
- Gawrylczyk, K.M.; Banaszak, S. Recent Developments in the Modelling of Transformer Windings. Energies 2021, 14, 2798. [Google Scholar] [CrossRef]
- Trela, K.; Gawrylczyk, K.M. FEM Modelling of the Influence of the Remaining Windings on the Frequency Response of the Power Transformer. Appl. Sci. 2020, 10, 7633. [Google Scholar] [CrossRef]
- Shanmugam, N.; Gopal, S.; Madanmohan, B.; Balaji, S.P.; Rajamani, R. Diagnosis of Inter-Turn Shorts of Loaded Transformer Under Various Load Currents and Power Factors; Impulse Voltage-Based Frequency Response Approach. IEEE Access 2021, 9, 40811–40822. [Google Scholar] [CrossRef]
- Mirzaei, H.R. Investigating the Practical Applications of the Frequency Response of the Transformers Extracted Using the Lightning Impulse Test Results. J. Oper. Autom. Power Eng. 2022, 10, 206–213. [Google Scholar]
- Silva, R.S.D.; Vinusan, U.; Aldeniya, S.K.; Samarasinghe, R.; Gunawardana, M. Optimizing Marx Impulse Generator Settings for Lightning Impulse Testing of Transformers: An Automated Approach for Enhanced Efficiency and Accuracy. In Proceedings of the 2023 Moratuwa Engineering Research Conference (MERCon), Moratuwa, Sri Lanka, 9–11 November 2023; pp. 189–194. [Google Scholar] [CrossRef]
- Ghorbal, M.B.; Mirzaei, H.R.; Rahimpour, E.; Rabih, S. Analyzing the Possibility of Improving Waveform Shape in Lightning Impulse Testing of Distribution Transformers. In Proceedings of the 2024 28th International Electrical Power Distribution Conference (EPDC), Zanjan, Iran, 23–25 April 2024; pp. 1–5. [Google Scholar] [CrossRef]
- Arunachalam, K.; Madanmohan, B.; Rajamani, R. Extended Application for the Impulse-Based Frequency Response Analysis: Preliminary Diagnosis of Partial Discharges in Transformer. IEEE Access 2020, 8, 226897–226906. [Google Scholar]
- Li, C.X.; Zhu, T.Y.; Xia, Q.; Yao, C.G.; Zhao, Z.Y. Study on Factors of Repetitive Impulse Influencing Online IFRA Test. IEEE Trans. Dielectr. Electr. Insul. 2017, 24, 2189–2195. [Google Scholar] [CrossRef]
- Mohseni, B.; Hashemnia, N.; Islam, S. “Online detection of partial discharge inside power transformer winding through IFRA”. In Proceedings of the 2017 IEEE Power & Energy Society General Meeting, Chicago, IL, USA, 16–20 July 2017; pp. 1–5. [Google Scholar] [CrossRef]
- Zhang, X.; Shi, M.; He, C.; Li, J. On Site Oscillating Lightning Impulse Test and Insulation Diagnose for Power Transformers. IEEE Trans. Power Deliv. 2020, 35, 2548–2550. [Google Scholar] [CrossRef]
- Moraditavasani, H. Automated Localization of Partial Discharge in Transformer Winding Using Noninvasive Capacitively-coupled Pulse Injection. Master’s Thesis, University of Manitoba, Winnipeg, MB, Canada, 2023. Available online: http://hdl.handle.net/1993/37930 (accessed on 28 February 2025).
- Tavasani, H.M.; Ziomek, W.; Kordi, B. Machine-learning supported localization of partial discharges in real-size transformer winding using noninvasive capacitively-coupled pulse injection. IEEE Trans. Dielectr. Electr. Insul. 2024, 31, 2984–2992. [Google Scholar] [CrossRef]
- Siegel, M.; Kattmann, C.; Beura, C.P.; Beltle, M.; Tenbohlen, S. Partial discharge monitoring of power transformers by calibrated UHF measurements. Energija 2023, 72, 19–27. [Google Scholar] [CrossRef]
- Trkulja, B.; Drandić, A.; Milardić, V.; Žiger, I. Evaluation of Methodology for Lightning Impulse Voltage Distribution over High-Voltage Windings of Inductive Voltage Transformers. Energies 2021, 14, 5144. [Google Scholar] [CrossRef]
- Abdul Hamid, M.H.; Ishak, M.T.; Suhaimi, N.S.; Adnan, J.; Makmor, N.F.; Katim, N.I.A.; Abd Rahman, R. Lightning Impulse Breakdown Voltage of Rice Bran Oil for Transformer Application. Energies 2021, 14, 5084. [Google Scholar] [CrossRef]
- Maseko, N.S.; Thango, B.A.; Mabunda, N. Fault Detection in Power Transformers Using Frequency Response Analysis and Machine Learning Models. Appl. Sci. 2025, 15, 2406. [Google Scholar] [CrossRef]
- Beheshti Asl, M.; Fofana, I.; Meghnefi, F. Review of Various Sensor Technologies in Monitoring the Condition of Power Transformers. Energies 2024, 17, 3533. [Google Scholar] [CrossRef]
- Das, B.; Dhayalan, S.; Reddy, E.V.; Thind, B.S.; Reddy, C.C. Analysis of frequency response of transformer with inter-turn short circuit fault due to transients. In Proceedings of the 2021 IEEE 5th International Conference on Condition Assessment Techniques in Electrical Systems (CATCON), Kozhikode, India, 23–24 December 2021; pp. 256–259. [Google Scholar] [CrossRef]
- Bigdeli, M.; Siano, P.; Alhelou, H.H. Intelligent classifiers in distinguishing transformer faults using frequency response analysis. IEEE Access 2021, 18, 13981–13991. [Google Scholar] [CrossRef]
- Karaman, I.; Ajder, A.; Nakir, I. Development of an Industrial Partial Discharge Calibrator and Its Performance Tests. IEEE Access 2024, 12, 42096–42104. [Google Scholar] [CrossRef]
- Rajakrom, A.; Cheechang, C.; Laochu, P.; Nimsanong, P.; Yutthagowiht, P. Partial Discharge Detection Beyond the Frequency Ranges of IEC 60270. In Proceedings of the 2024 IEEE 5th International Conference on Dielectrics (ICD), Toulouse, France, 30 June–4 July 2024; pp. 1–4. [Google Scholar]
- Wang, Q.; Feng, Y.; Li, M.; Long, Y.; An, C.; Zou, B.; Luo, X. Development and Experimental Verification of IFRA-Based Transformer Winding Deformation Diagnostic Device. In Proceedings of the 2024 11th International Forum on Electrical Engineering and Automation (IFEEA), Shenzhen, China, 22–24 November 2024; pp. 769–773. [Google Scholar]
- Zamani, M.; Haghjoo, F.; Haseli, M.R.; Cruz, S.M. IFRA Technique to Detect Stator Winding High Impedance Earth Faults During Startup in Salient-Pole Synchronous Generators. IEEE Trans. Ind. Electron. 2024; in press. Available online: https://ieeexplore.ieee.org/abstract/document/10817793/ (accessed on 28 February 2025).
Disclaimer/Publisher’s Note: The statements, opinions and data contained in all publications are solely those of the individual author(s) and contributor(s) and not of MDPI and/or the editor(s). MDPI and/or the editor(s) disclaim responsibility for any injury to people or property resulting from any ideas, methods, instructions or products referred to in the content. |
© 2025 by the author. Licensee MDPI, Basel, Switzerland. This article is an open access article distributed under the terms and conditions of the Creative Commons Attribution (CC BY) license (https://creativecommons.org/licenses/by/4.0/).