Abstract
The temperature of lubricating oil plays a pivotal role in determining the performance of engines and other machinery, underscoring the importance of studying its temperature distribution for optimizing engine efficiency. In this study, a custom experimental setup was developed to measure the transmittance of lubricating oil across a wavelength range of 380 nm to 1040 nm at various temperatures. A novel method was proposed to compute the temperature distribution along the light path using transmission spectra. By formulating a mathematical model that correlates the temperature distribution with light intensity, the optical characteristics of lubricating oil undergoing a phase change at a single interface in low-temperature environments were thoroughly investigated. A comparative analysis between the experimentally measured temperatures and those obtained from temperature sensors revealed that the temperature distribution trends predicted by the proposed method closely aligned with the experimental data, exhibiting an average deviation of only 2.87 °C. These results demonstrate the robustness and accuracy of the method, validating its potential for reliable temperature distribution estimation in lubricating oil.
1. Introduction
In modern mechanical systems, lubricating oil plays a pivotal role as a key material [1,2,3,4,5,6,7,8], directly influencing the operational efficiency, service life, and overall reliability of machinery. This is especially critical in high-performance systems such as engines, where the precise monitoring of the temperature distribution of lubricating oil is essential for optimizing the lubrication effectiveness and enhancing the energy utilization efficiency. The accurate regulation of the lubricating oil temperature is vital for the formation and optimal performance of the lubricating film within the oil [9]. However, conventional temperature sensors, including thermocouples and infrared thermometers, exhibit significant limitations. These include slow response times, inadequate spatial resolution, and the inability to function reliably under high-temperature and high-pressure conditions. Consequently, these sensors are incapable of providing the precise, real-time monitoring of the temperature distribution of lubricating oil in complex flow environments.
In recent years, transmission spectroscopy has emerged as a hot research topic as a non-contact monitoring method, capable of providing light intensity data without direct contact with the material. Transmission spectroscopy effectively reflects the characteristics of materials. For example, Asadova et al. [10] studied the changes in the transmission spectra of agarose solutions at different temperatures and concentrations. Through experiments under heating and cooling modes, it was found that the spectral characteristics of the solution exhibited significant thermal hysteresis effects. Their study indicated that the temperature range for gel network formation is much narrower than that for collapse. Ryzhov et al. [11] investigated the electronic absorption spectra of composite tungsten ions based on NaCl-KCl-CsCl eutectic mixtures. By introducing tungsten dioxide into the melt using the salt chlorination method, spectral analysis showed that after WO2 reacted with HCl, the main product was W (V) ions, providing new experimental data for tungsten compound studies. Matsumura et al. [12] used terahertz (THz) spectroscopy to observe the sublimation process of ice. This study showed that the sublimation phenomenon of ice was consistently visible within the temperature range of 210 K to 270 K, and the sublimation rate was directly proportional to temperature. This finding supports further research into the thermodynamic properties and phase behavior of ice. Cordeiro et al. [13] used Raman spectroscopy to study structural changes in l-phenylacetyl-l-alanine dehydration crystals under high-pressure conditions, revealing significant changes in the lattice and internal vibration modes. Hegde et al. [14] applied the melt quenching technique to perform a spectral analysis of Dy3+ ion-doped alkaline glasses, determining the refractive indices and densities of various glasses, and optimizing the influence of the Dy3+ ion concentration on the visible light emission performance through Judd–Ofelt analysis. Xu et al. [15] studied the major stages of crystallization and the melting of butterfat using an online Raman analyzer, providing structural information about butterfat under different heat treatment conditions. Meng et al. [16] investigated the spectral characteristics of industrial pure iron at 800 °C using spontaneous light emission spectra at specific heating rates and found no significant spontaneous light signal. Kosenkov et al. [17] used radiation methods to study the spectral emission characteristics of industrial nickel, palladium, and platinum in solid–liquid phases near their melting points, analyzing their radiation spectra dependencies over a wavelength range of 0.26–10.6 μm. Dan et al. [18] researched the visible and near-infrared light emission properties of Bin+-doped materials at different excitation wavelengths, providing data on the luminescent properties of these materials. Lenkennavar et al. [19] confirmed the amorphous nature of the prepared samples through powder X-ray diffraction analysis and recorded their light absorption and photoluminescence spectra at room temperature. Lin et al. [20] explored the thermal degradation kinetics of molten PLA under different temperatures and atmospheric conditions using a Raman spectroscopy system, providing a new experimental method for studying the thermal stability of polymer materials.
Although transmission spectroscopy has advanced significantly in analyzing the properties of fluids like gases and liquids, its application to lubricating oil—a complex, multiphase fluid with intricate optical properties—remains challenging. Current research mostly focuses on the spectral characteristics of lubricating oil, but effective methods for correlating these spectral characteristics with the temperature distribution of the oil have yet to be developed.
To address the challenges mentioned, this paper proposes a non-contact dynamic monitoring method based on transmission spectroscopy for the real-time measurement of temperature distribution within lubricating oil. By analyzing the transmission rate of lubricating oil across a wavelength range of 380 nm to 1040 nm, a mathematical model linking temperature distribution to light intensity was developed. An optical experimental setup was then created to implement this approach. This innovative method not only overcomes the limitations of traditional temperature measurement techniques, but also improves the ability to monitor the temperature field of lubricating oil under complex flow conditions. This method demonstrated high accuracy across a range of temperatures, providing superior spatial resolution and real-time responsiveness. As a result, it offers more precise data for optimizing lubricating oil, monitoring equipment conditions, and providing fault warnings.
2. Spectral Analysis of Lubricating Oil
In this paper, a certain type of heavy-duty power transmission general-purpose lubricant (hereinafter referred to as lubricant) as the object of study, and its basic physical and chemical properties are shown in Table 1.

Table 1.
Basic physical and chemical properties of a certain type of lubricant.
To study the optical properties of the lubricant at different temperatures, this paper uses a spectrometer to measure the visible light spectrum of the lubricant across various temperature ranges. Figure 1 shows a schematic of the optical property testing setup. The experiment utilizes a ML005 constant temperature chamber from Jianheng Instruments to regulate and maintain the lubricant’s temperature. To ensure accurate optical measurements, a cuvette is used to hold the lubricant. The temperature of the oil is monitored in real-time using a K-type temperature sensor and the EX4000 series multi-channel temperature acquisition system. An HDL halogen cold light source is employed, with light transmitted through optical fibers to the cuvette. A collimating lens then collects the transmitted light that passes through the oil. Finally, the transmitted light is directed through optical fibers to the Ocean Optics USB4000 spectrometer for analysis. The relevant instrument parameters are provided in Table 2. The testing stand, cuvette, temperature sensor, light source fiber box, and collimating lens are positioned inside the constant temperature chamber, while the temperature monitoring system, light source, and spectrometer are located outside the chamber.

Figure 1.
Schematic diagram of lubricant optical property test.
Table 2.
Indicators related to the use of instruments.
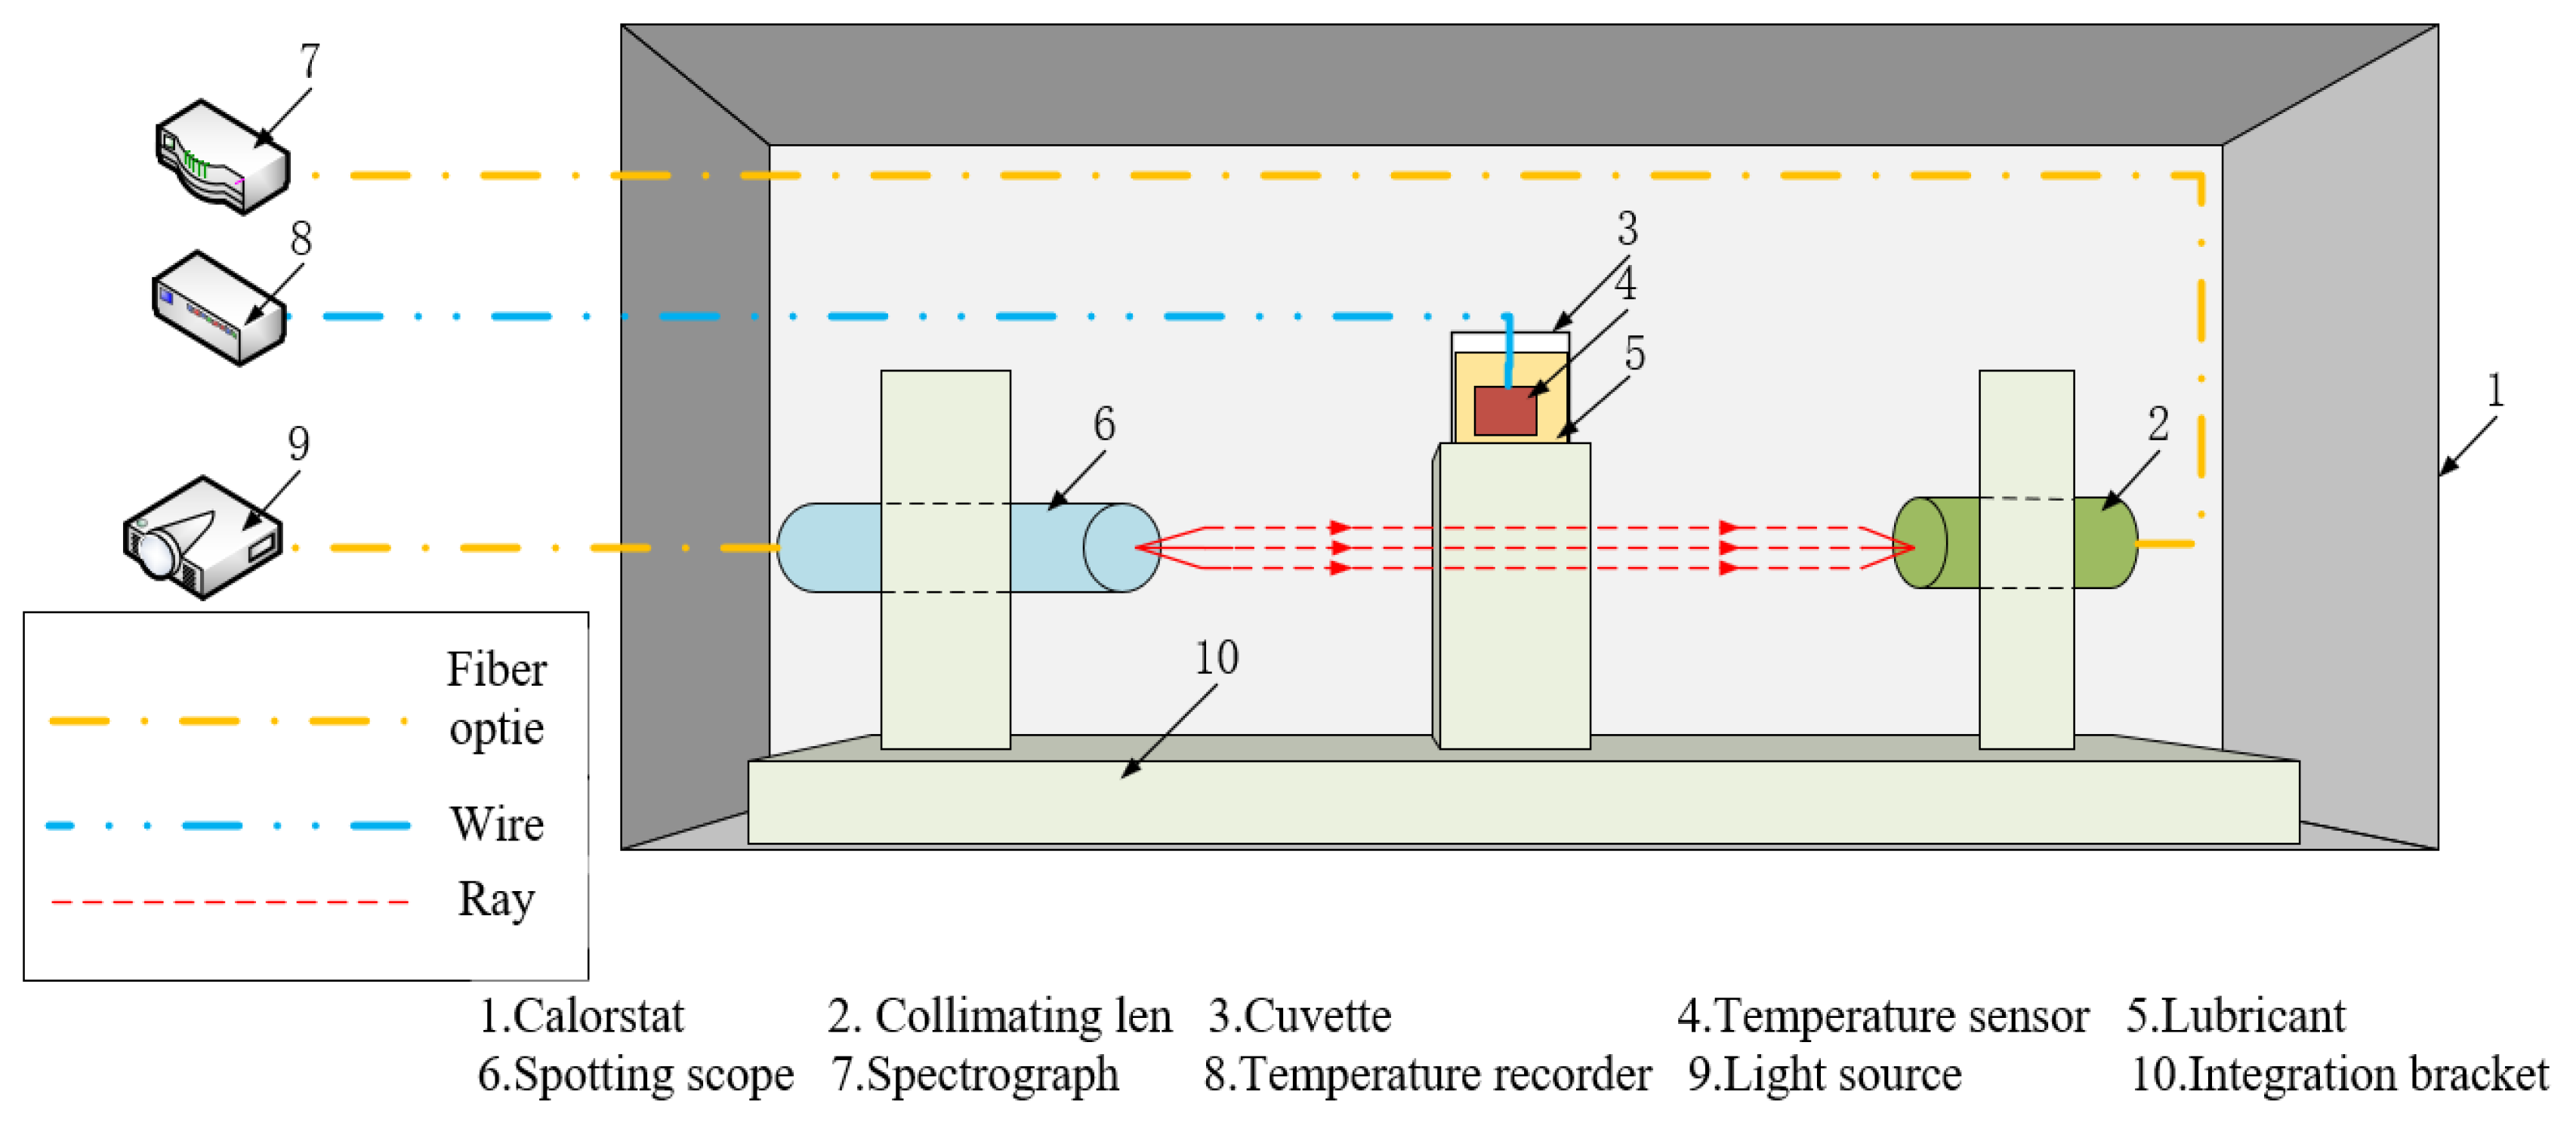
As shown in Figure 2, a lubricant container, temperature sensor, and fiber-optic integrated bracket were fabricated using a 3D printer according to the relevant structural dimensions.
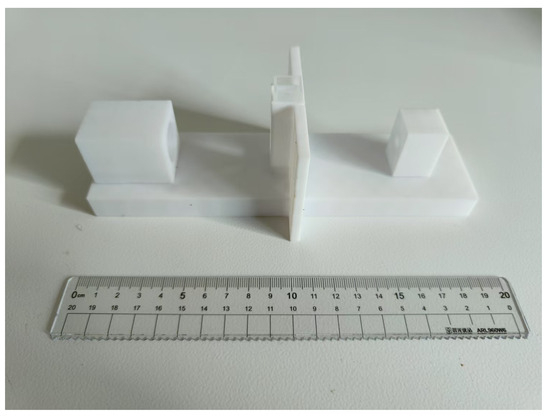
Figure 2.
Integration bracket.
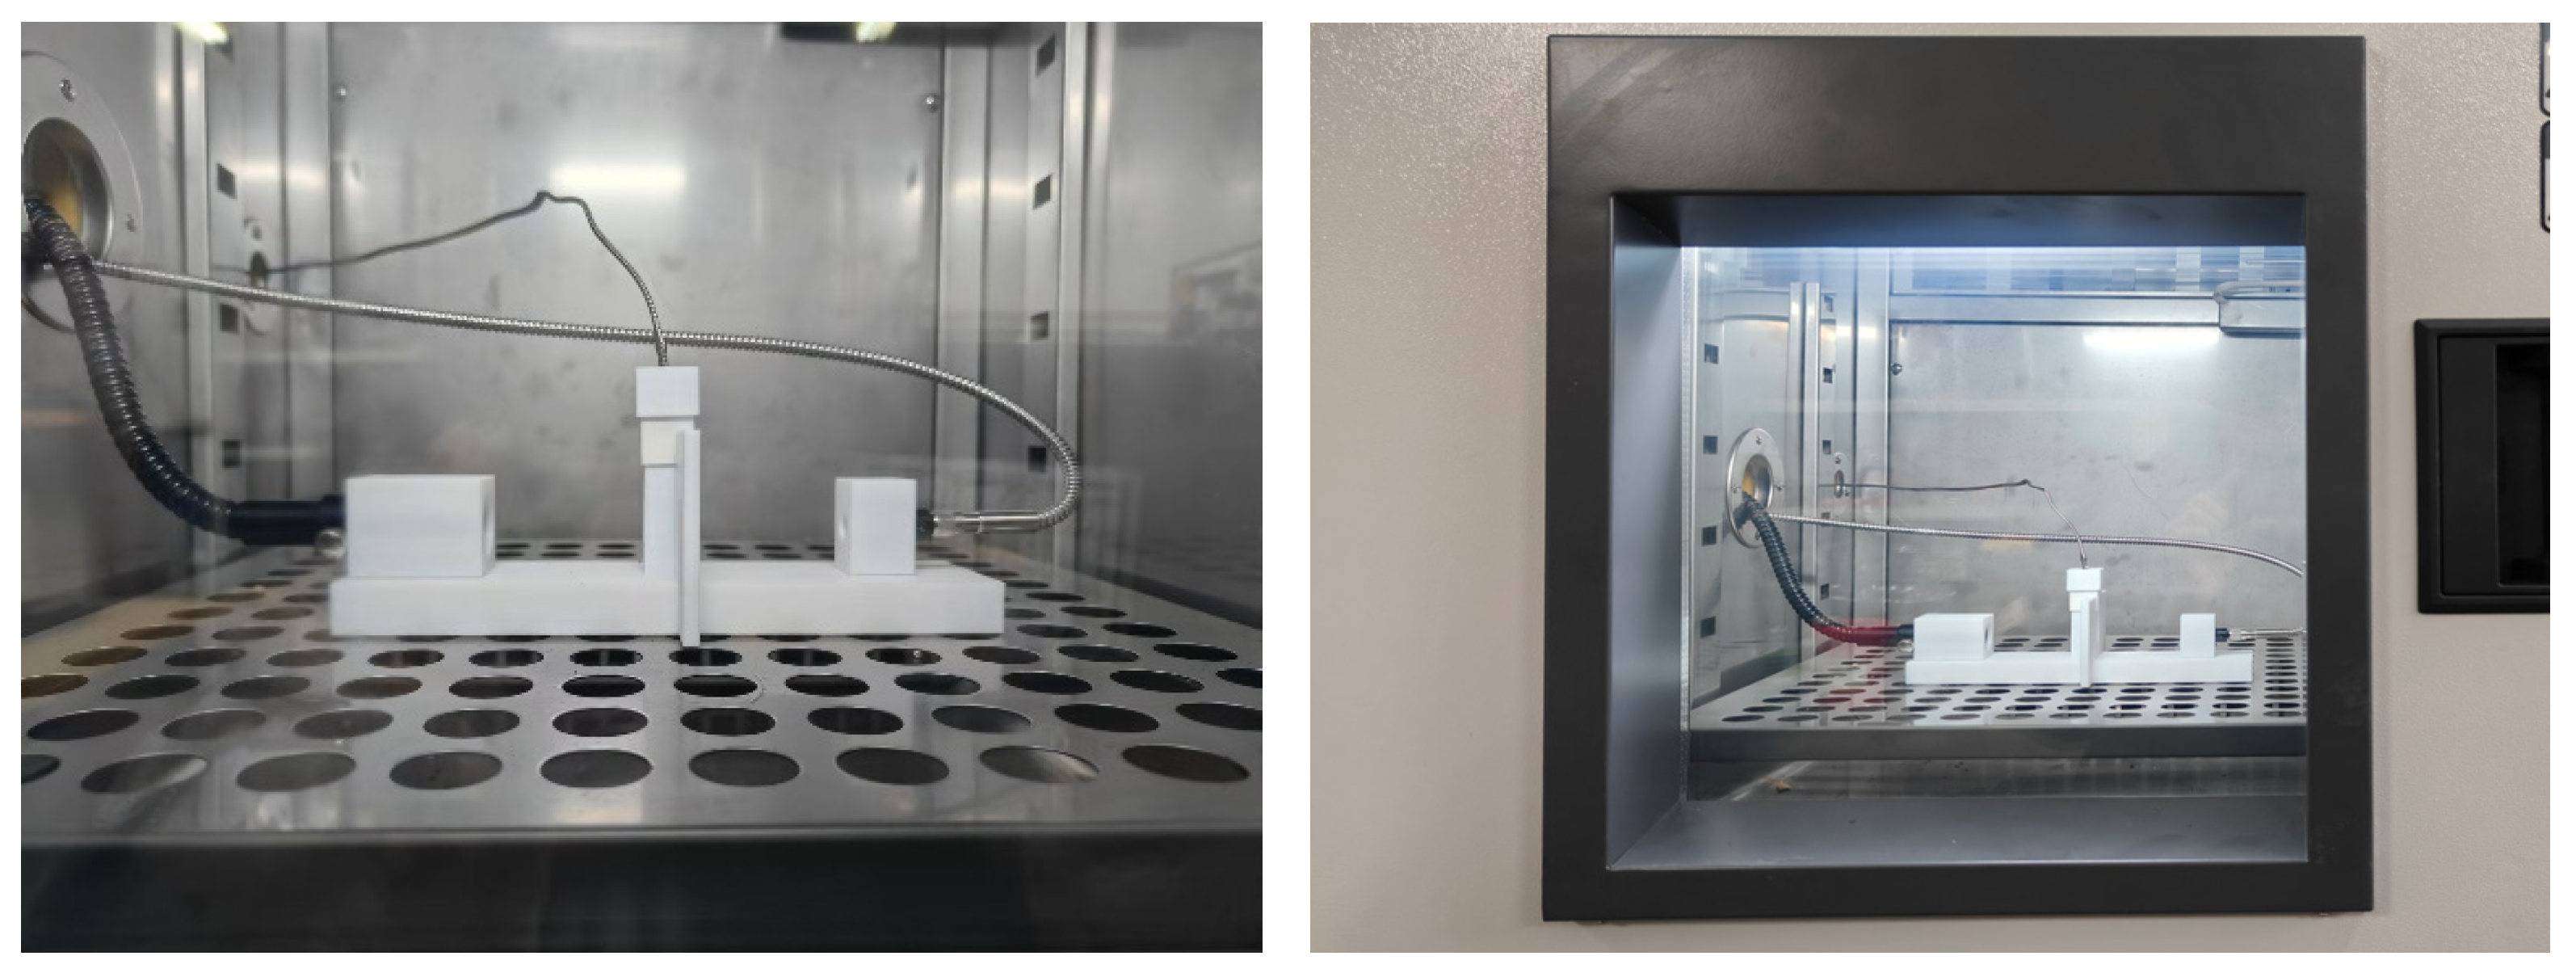
Based on the design of the boundary conditions, as well as the processing and assembly of the relevant components, an optical property testing platform for lubricating oil, as shown in Figure 3, was constructed.
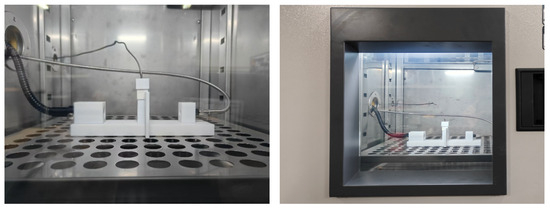
Figure 3.
Lubricant optical characterization test.
The experimental steps for testing the optical characteristics of the lubricant at different temperatures are shown in Table 3.
Table 3.
The experimental steps for testing the optical properties of the lubricant.
Following the steps outlined above, this study measured the transmission spectra of air and cuvette, as well as the transmission spectra of a specific heavy-duty power transmission lubricant, over a temperature range of −70 °C to 80 °C, with wavelengths spanning 380 nm to 1040 nm. The transmission spectra of the air and cuvette are shown in Figure 4, while the transmission spectra of the lubricant at various temperatures (80 °C, 60 °C, 40 °C, 20 °C, 0 °C, −20 °C, −40 °C, and −60 °C) are presented in Figure 5. From the figures, it is clear that as the temperature decreases, the relative light intensity in the transmission spectra generally decreases. However, between 80 °C and −20 °C, the relative light intensity across the 380 nm to 1040 nm wavelength range remains almost unchanged. When the temperature drops from −20 °C to −40 °C, the relative light intensity in this range decreases sharply, indicating that the transmissibility of the lubricant significantly reduces within this temperature range. From −40 °C to −60 °C, the decrease in the relative light intensity is less pronounced than from −20 °C to −40 °C, but the downward trend is still observable. Figure 5 also shows that the light source used in this study has peaks at wavelengths around 750 nm and 900 nm and a valley at around 830 nm. The transmission patterns at these wavelengths vary with the temperature. Above −20 °C, the transmission at 750 nm is the highest, but between −20 °C and −40 °C, it experiences the greatest decrease. In contrast, the transmission at 900 nm is the lowest above −20 °C, but despite a sharp drop in transmittance between −20 °C and −40 °C, it still maintains a relatively high light intensity.
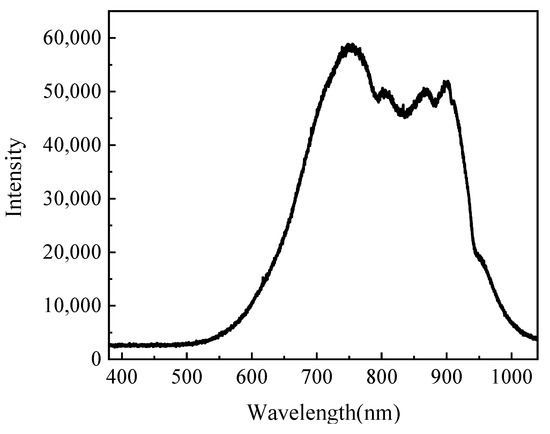
Figure 4.
Air and cuvette transmission spectra.
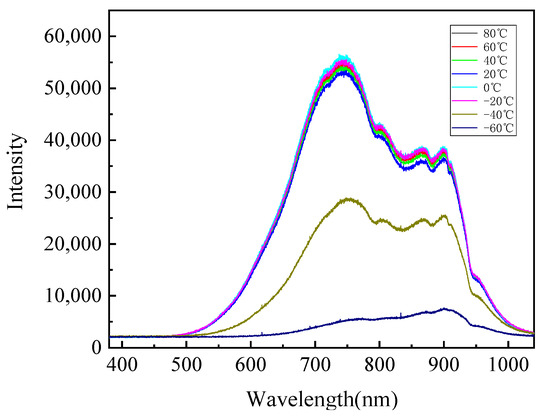
Figure 5.
Transmittance spectra of lubricant at different temperatures.
3. Observational Study of Unilateral Melting Processes
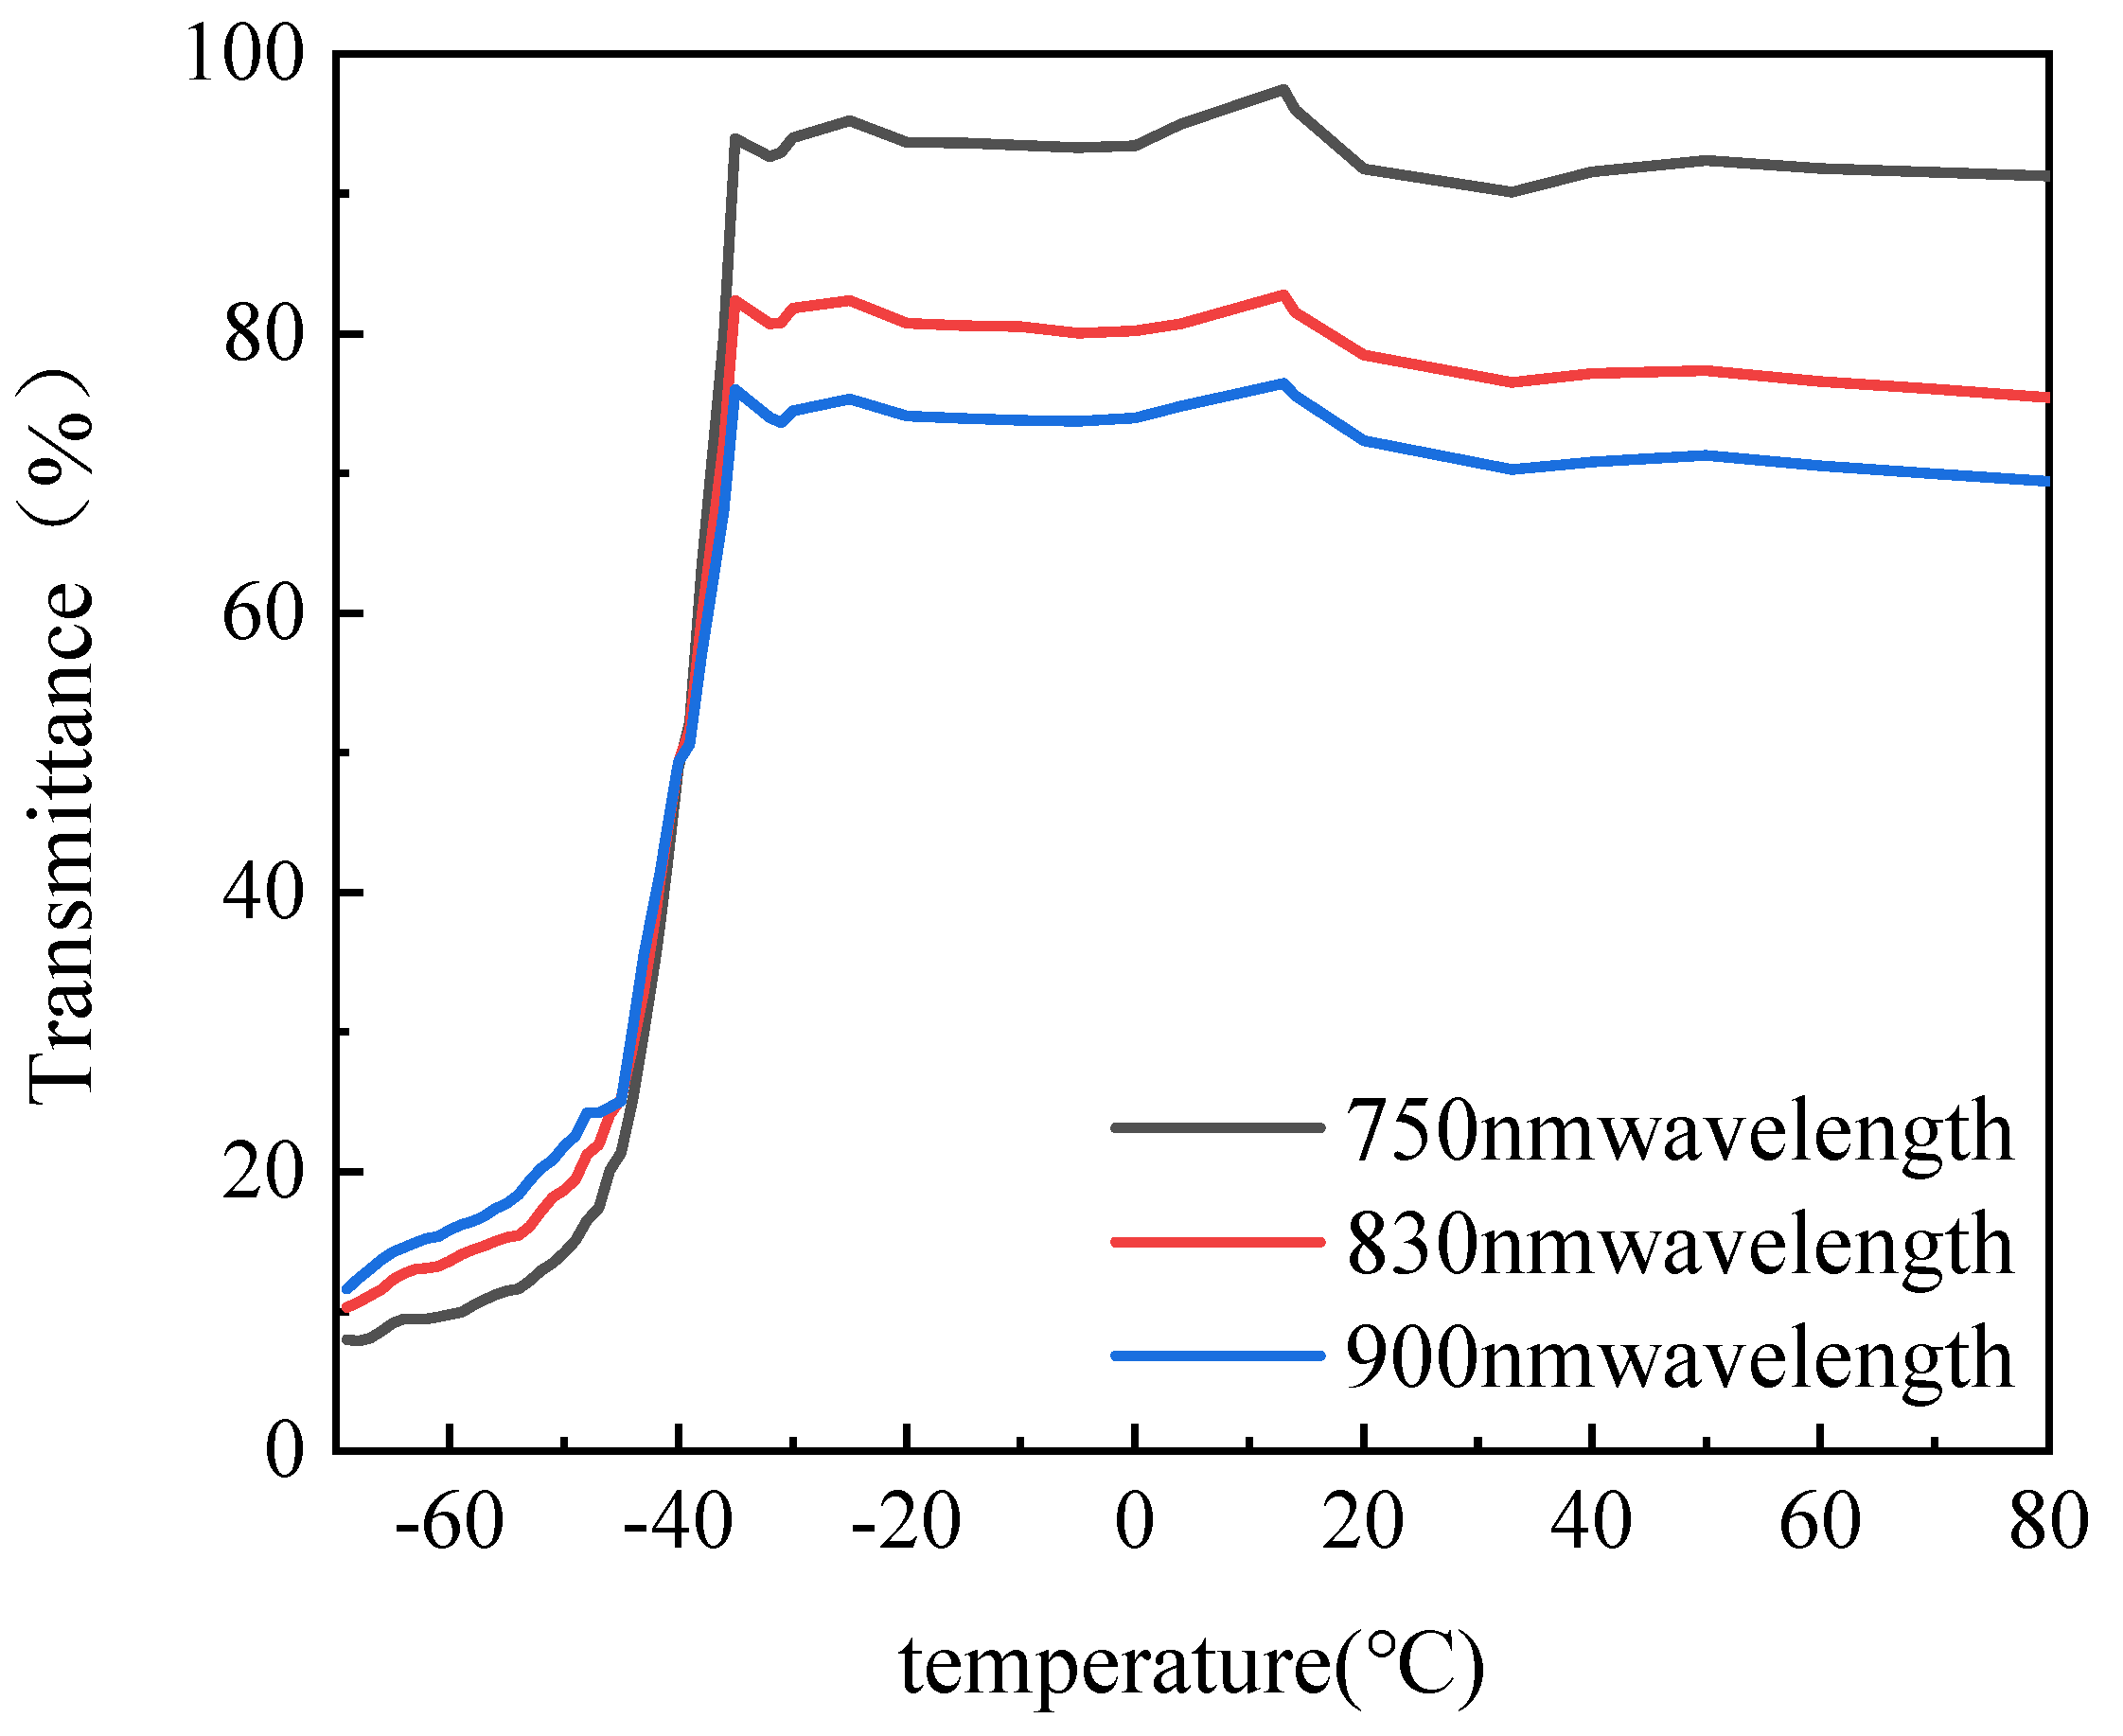
As shown in Figure 6, the relationship curves between the transmission rate of the lubricant and temperature at wavelengths of 750 nm, 830 nm, and 900 nm were derived from the data in Figure 4 and Figure 5. These curves clearly illustrate the connection between the temperature, transmission rate, and wavelength. Overall, when the temperature is above −35 °C, the transmission rate decreases as the wavelength increases. However, when the temperature drops below −42 °C, the transmission rate increases as the wavelength increases. In the temperature range from −35 °C to 80 °C, the transmission rate exhibits slight fluctuations with the decreasing temperature, following a pattern of decrease–increase–decrease. The maximum transmission rate for each wavelength occurs near 15 °C. In the temperature range from −35 °C to −42 °C, the transmission rate decreases sharply across all wavelengths. For instance, at 750 nm, the transmission rate decreases from 93.94% at −35 °C to 35.37% at −42 °C, a reduction of 62.34%, with a rate of decline of 8.36%/°C. Between −42 °C and −70 °C, the transmission rate continues to decrease, but the rate of decline slows down. For example, the rate of change in transmission at 750 nm drops from 5.46%/°C between −42 °C and −43 °C to just 0.11%/°C between −69 °C and −70 °C. These observations indicate that at different temperatures, the transmission rates of the lubricant at various wavelengths behave differently, and the trends of these variations are not the same. This means that if a light beam with an identical intensity and spectrum passes through a lubricant with different internal temperature distributions (while the optical path remains the same), it will produce distinct transmission spectra. By establishing a relationship between the transmission spectrum and temperature distribution, the internal temperature distribution of the lubricant can be inferred from the measured transmission spectra. This non-contact method of continuously measuring the internal temperature of molten liquids offers significant advantages. It avoids the spatial discontinuities and potential disruptions caused by temperature sensors, and it also overcomes the limitations of infrared thermography, which struggles to provide accurate thermal imaging at low temperatures.
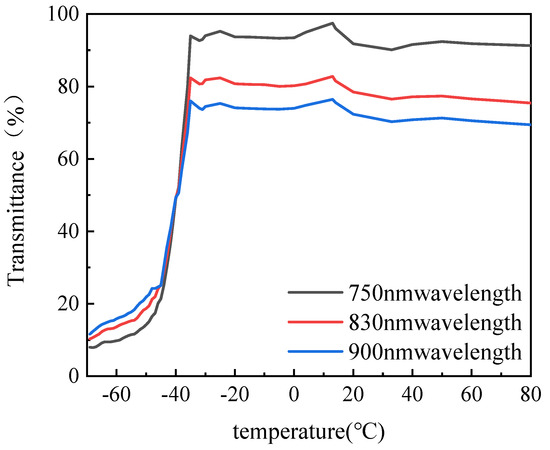
Figure 6.
Transmittance of lubricant at different temperatures.
Equation (1) shows the transmitted light intensity calculation formula:
where is the transmitted light intensity, is the incident light intensity, is the optical thickness, and is the transmission constant.
Equation (2) is the transmittance calculation formula:
where is the transmittance.
Then the spectrum of a molten-state lubricant that is in the process of melting and where the optical path is not parallel to the melting interface can be decomposed as:
where is the transmitted light intensity at wavelength, is the transmitted light intensity at wavelength, is the optical thickness, and is the weighted transmittance constant of the optical path at wavelength, where , , and can be measured by a spectrometer, expanding the above equation as:
where is the transmission constant for wavelength at temperature , is the optical path length at temperature is the minimum temperature of the system, and is the maximum temperature of the system.
can be solved by discretizing into , segments for :
similar to:
where is the minimum wavelength of the system and is the maximum wavelength of the system.
At this point, there are determinants:
where is the average transmission constant in the wavelength range of , over the temperature range of , and is the total length of the optical path. A determinant is formed with rows and columns. The optical distances at different temperatures along the optical path can be obtained by calculating Equation (7).
To verify the accuracy and reliability of the proposed non-contact internal temperature distribution monitoring method, this study focused on the melting process of the lubricant with a unidirectional interface in a low-temperature environment. During the experiment, transmission light spectrum data collected from the lubricant’s melting process were used to calculate the temperature distribution within the oil at various time points. These calculated temperature values were then compared to those obtained from temperature sensors for validation.
Figure 7 illustrates the schematic of the unidirectional interface melting experiment with the lubricant. The experimental boundary conditions are provided in Table 4. In this setup, the container, sensor holder, temperature sensor, light source fiber box, and collimating lens are placed inside the constant temperature chamber, while the temperature monitoring system, light source, and spectrometer are positioned outside the chamber.
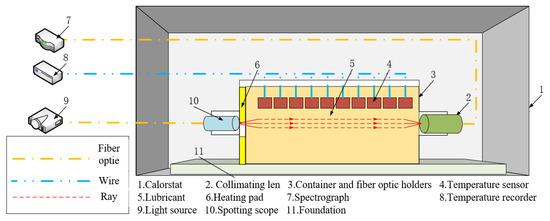
Figure 7.
Schematic diagram of lubricant unilateral interfacial melting test.
Table 4.
Test boundary conditions.
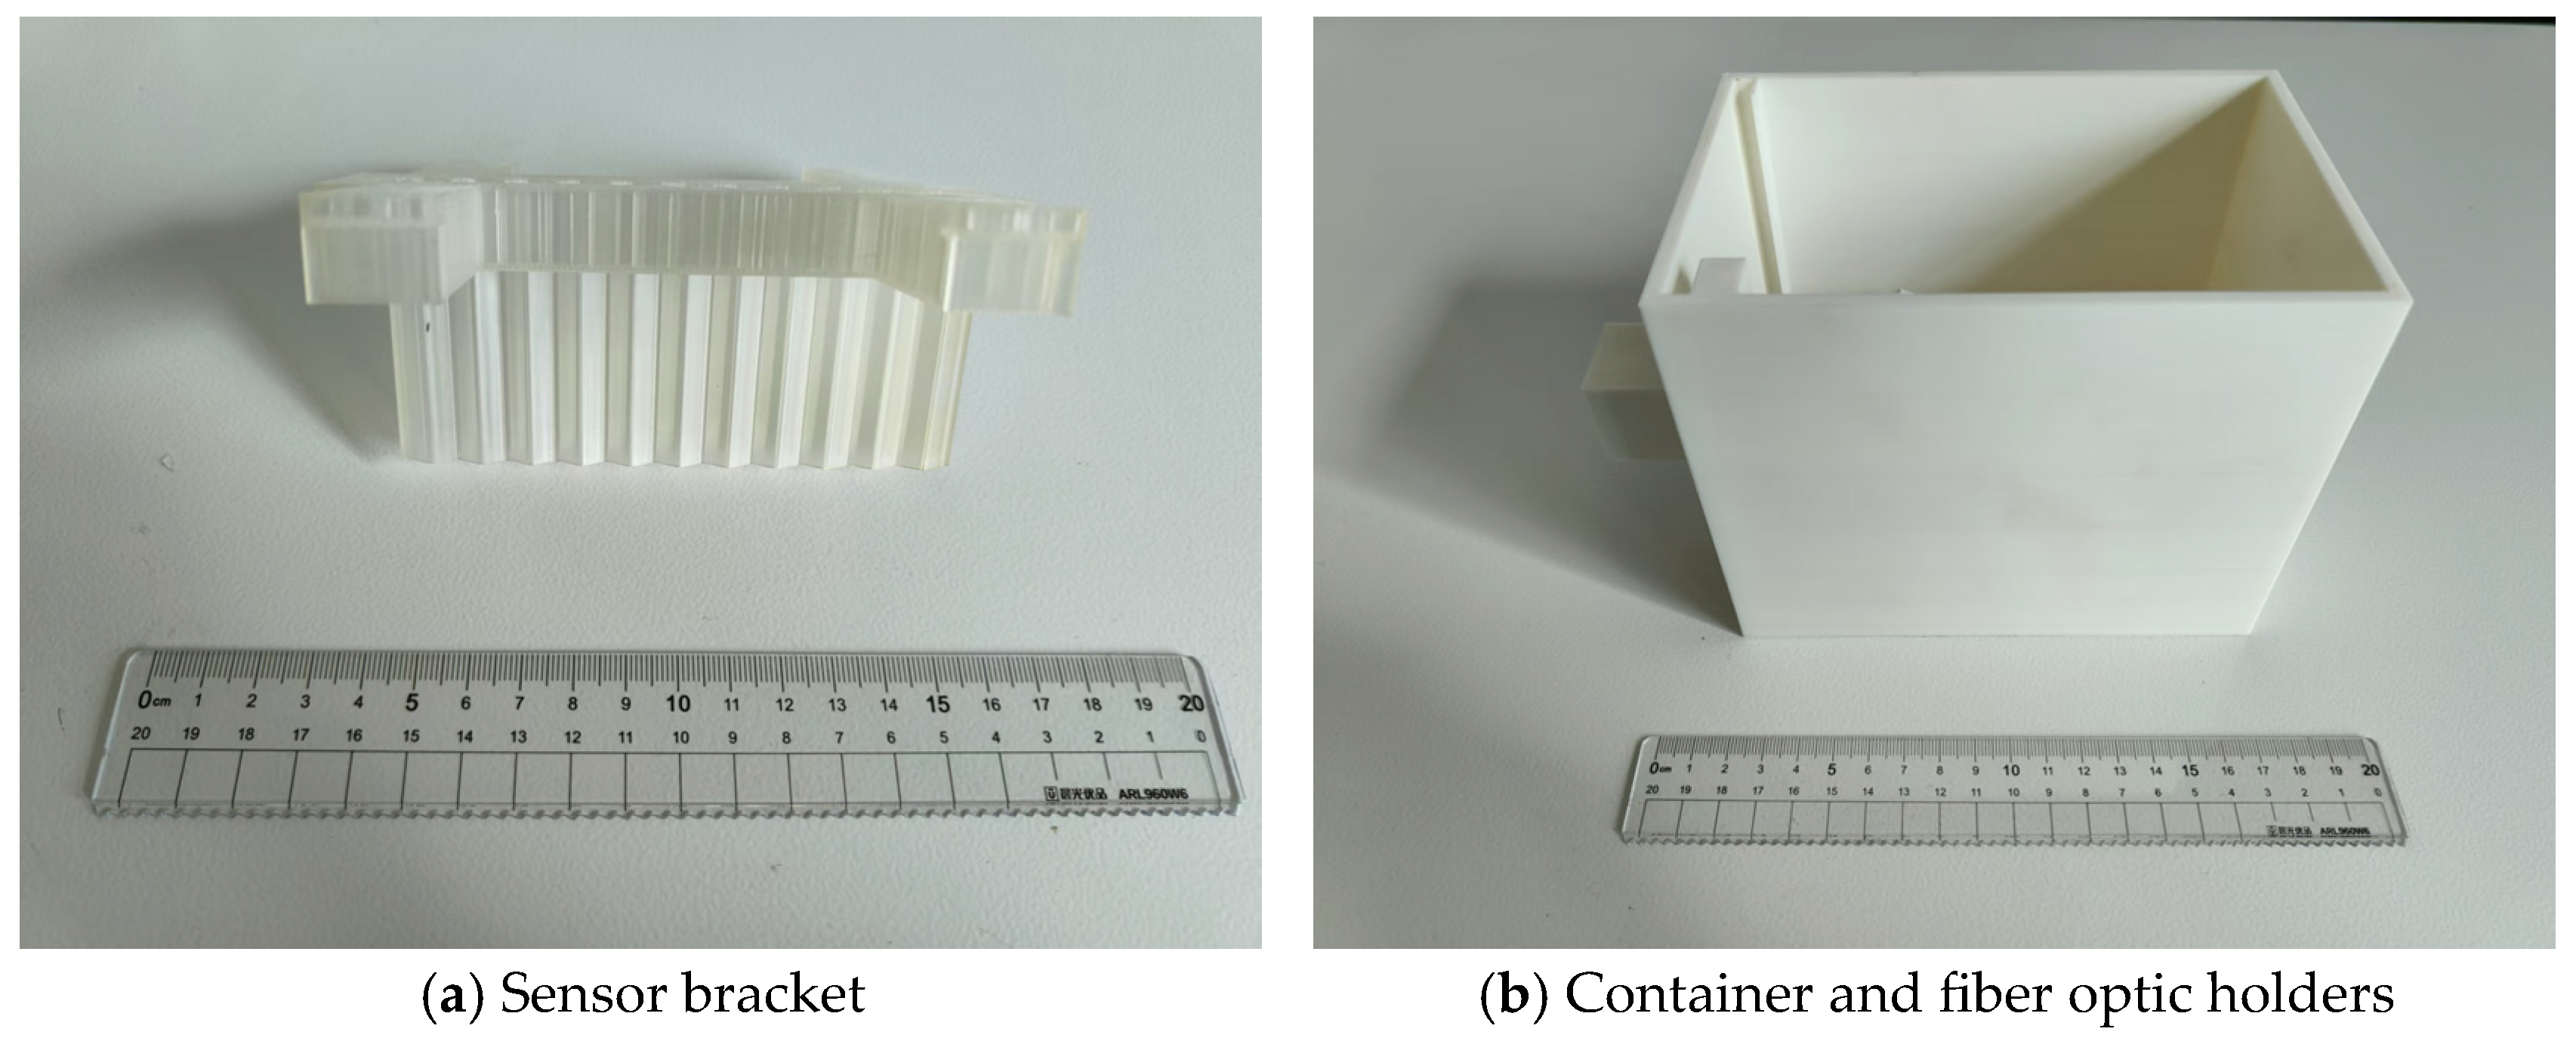
The lubricant container and associated bracket were fabricated using a 3D printer according to the relevant structural dimensions, as shown in Figure 8.
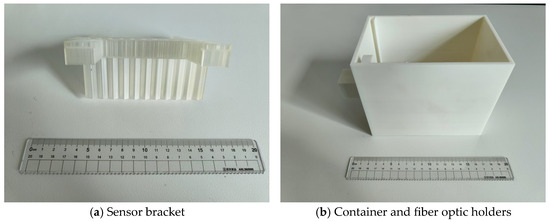
Figure 8.
Container and support.
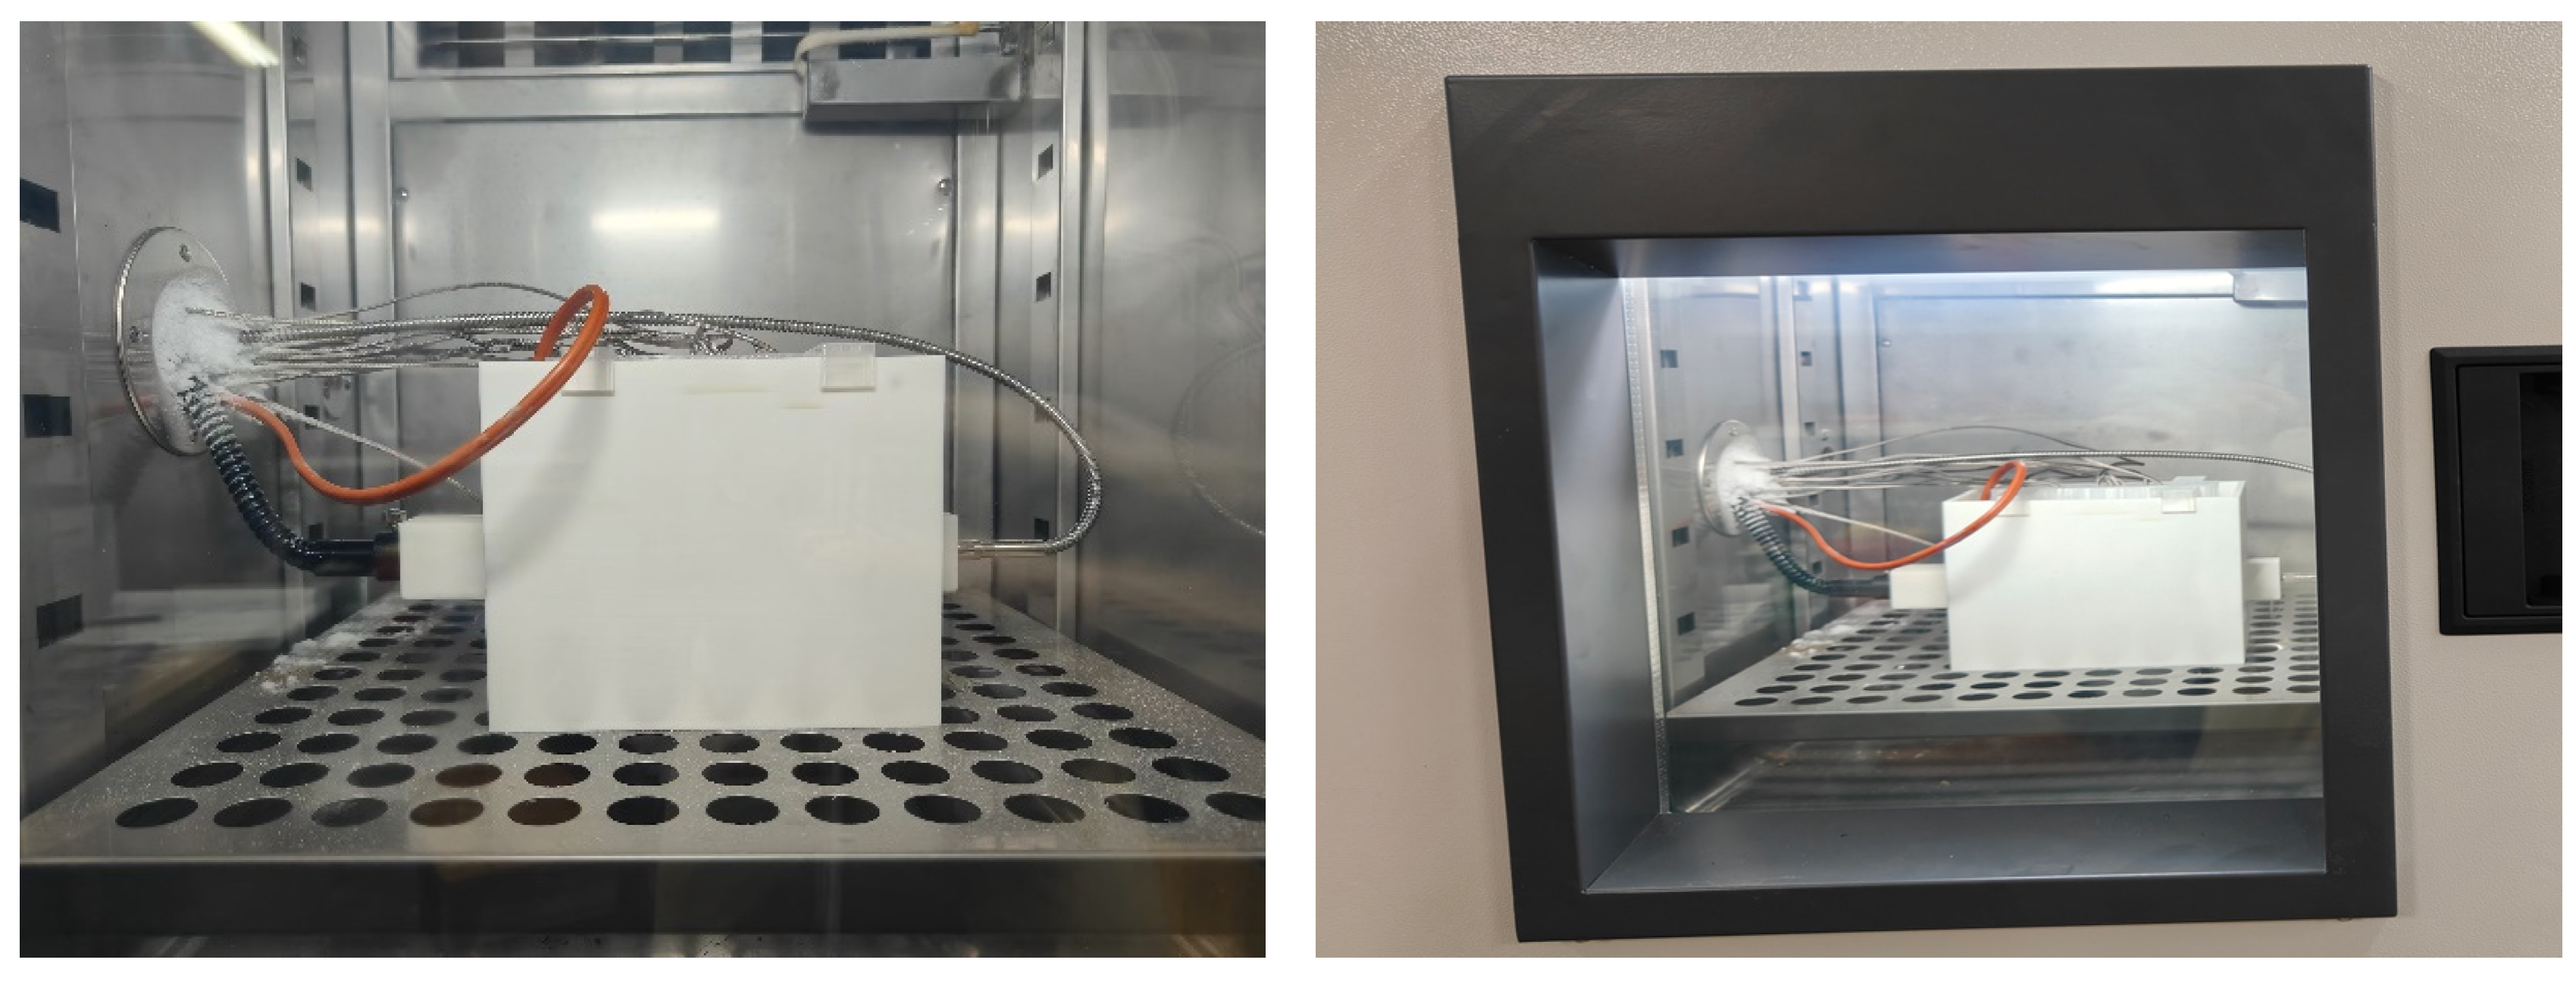
Combined with the boundary condition design, machining, and assembly of related workpieces, the lubricant unilateral interfacial melting test rig is obtained, as shown in Figure 9.
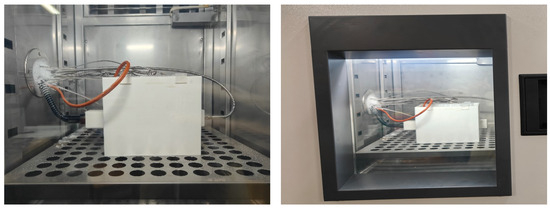
Figure 9.
Lubricant unilateral interfacial melting test.
The experimental steps for the unidirectional interface melting of lubricating oil are shown in Table 5.
Table 5.
The experimental steps of the lubricant unilateral lateral interfacial melt test.
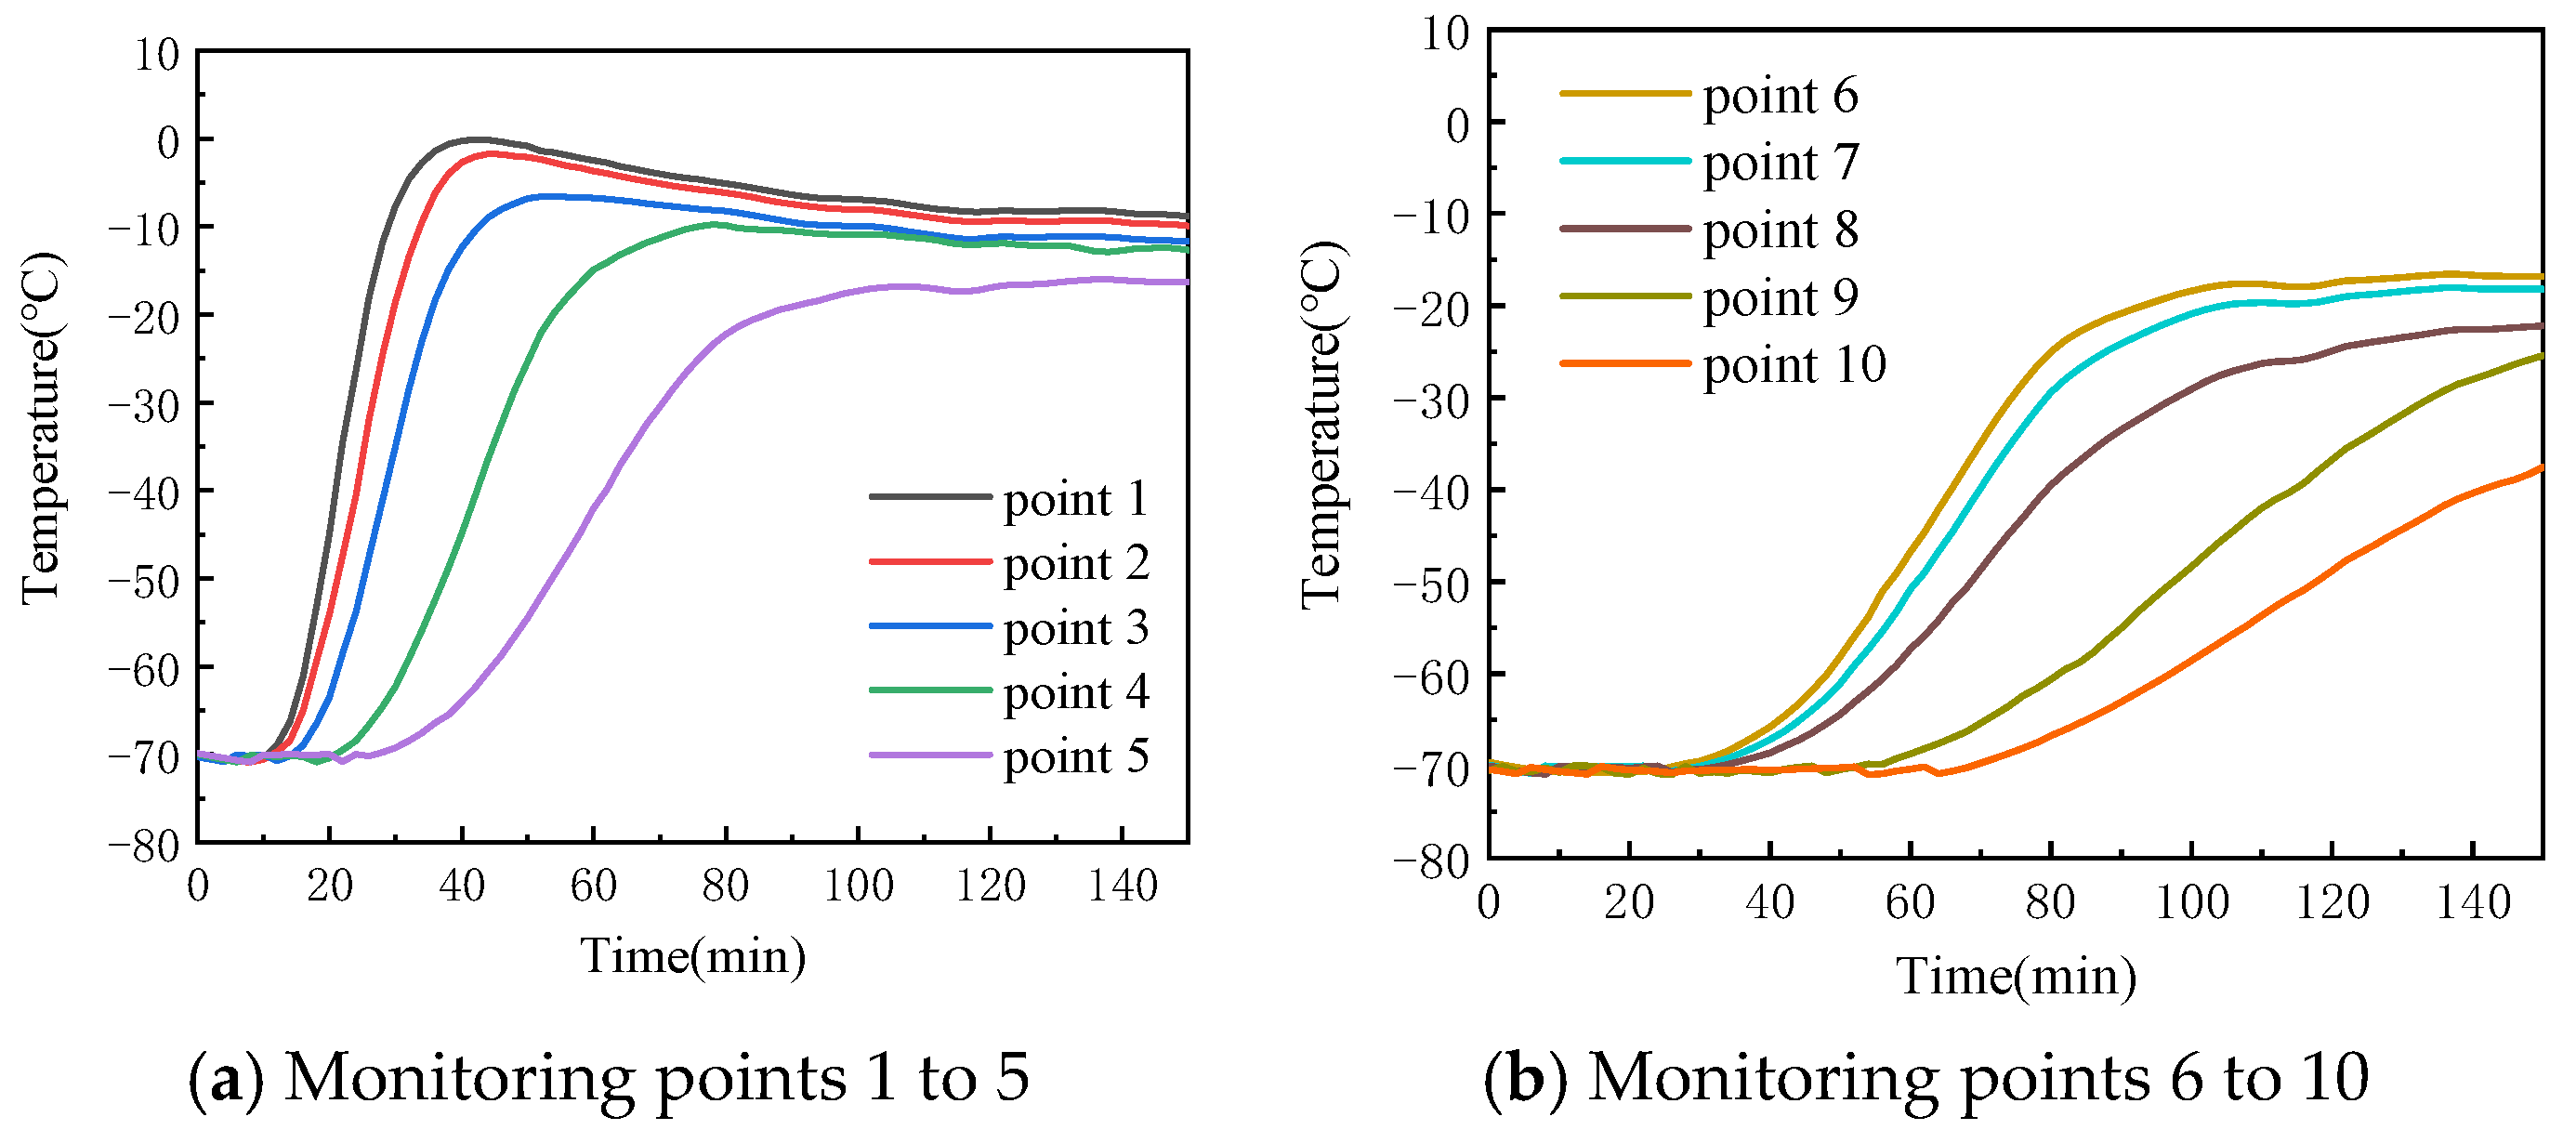
Following the procedure outlined above, transmission spectra of a specific heavy-duty power transmission lubricant in the wavelength range of 380 nm to 1040 nm, along with temperatures measured at 10 monitoring points, were recorded at 2 min intervals over a period of 150 min. Figure 10 presents the temperature–time variation curves for the monitoring points. The data show that the temperature at these points generally increases rapidly at first, followed by a slower rise. For monitoring points 1 to 4, which are closer to the heating plate, a slight temperature drop is observed after the initial rapid increase. This drop is caused by heat loss as the molten fluid comes into contact with the air. As heating continues, the temperature curve gradually flattens, indicating that the lubricant is approaching thermal equilibrium due to the combined effects of the external low-temperature environment and the heating plate. For monitoring points 6 to 10, which are farther from the heating plate, the temperature shows minimal fluctuation in the early stages of melting. This is because the solidified lubricant in this region primarily relies on heat transfer through conduction between the solid particles. Since the thermal conductivity of the solidified lubricant is much lower than that of its liquid state, heat transfer in the solid phase is slower than the convection heat transfer in the liquid phase. Consequently, the temperature in these regions rises more slowly, showing a clear time delay. As heating continues, heat gradually transfers to these areas, and the temperature rise accelerates.
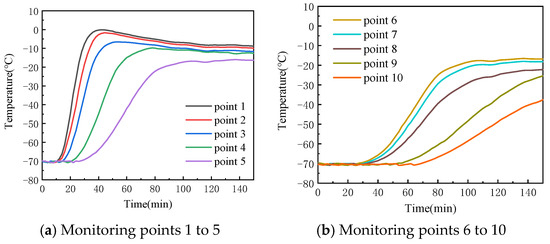
Figure 10.
Temperature change curve at monitoring point.
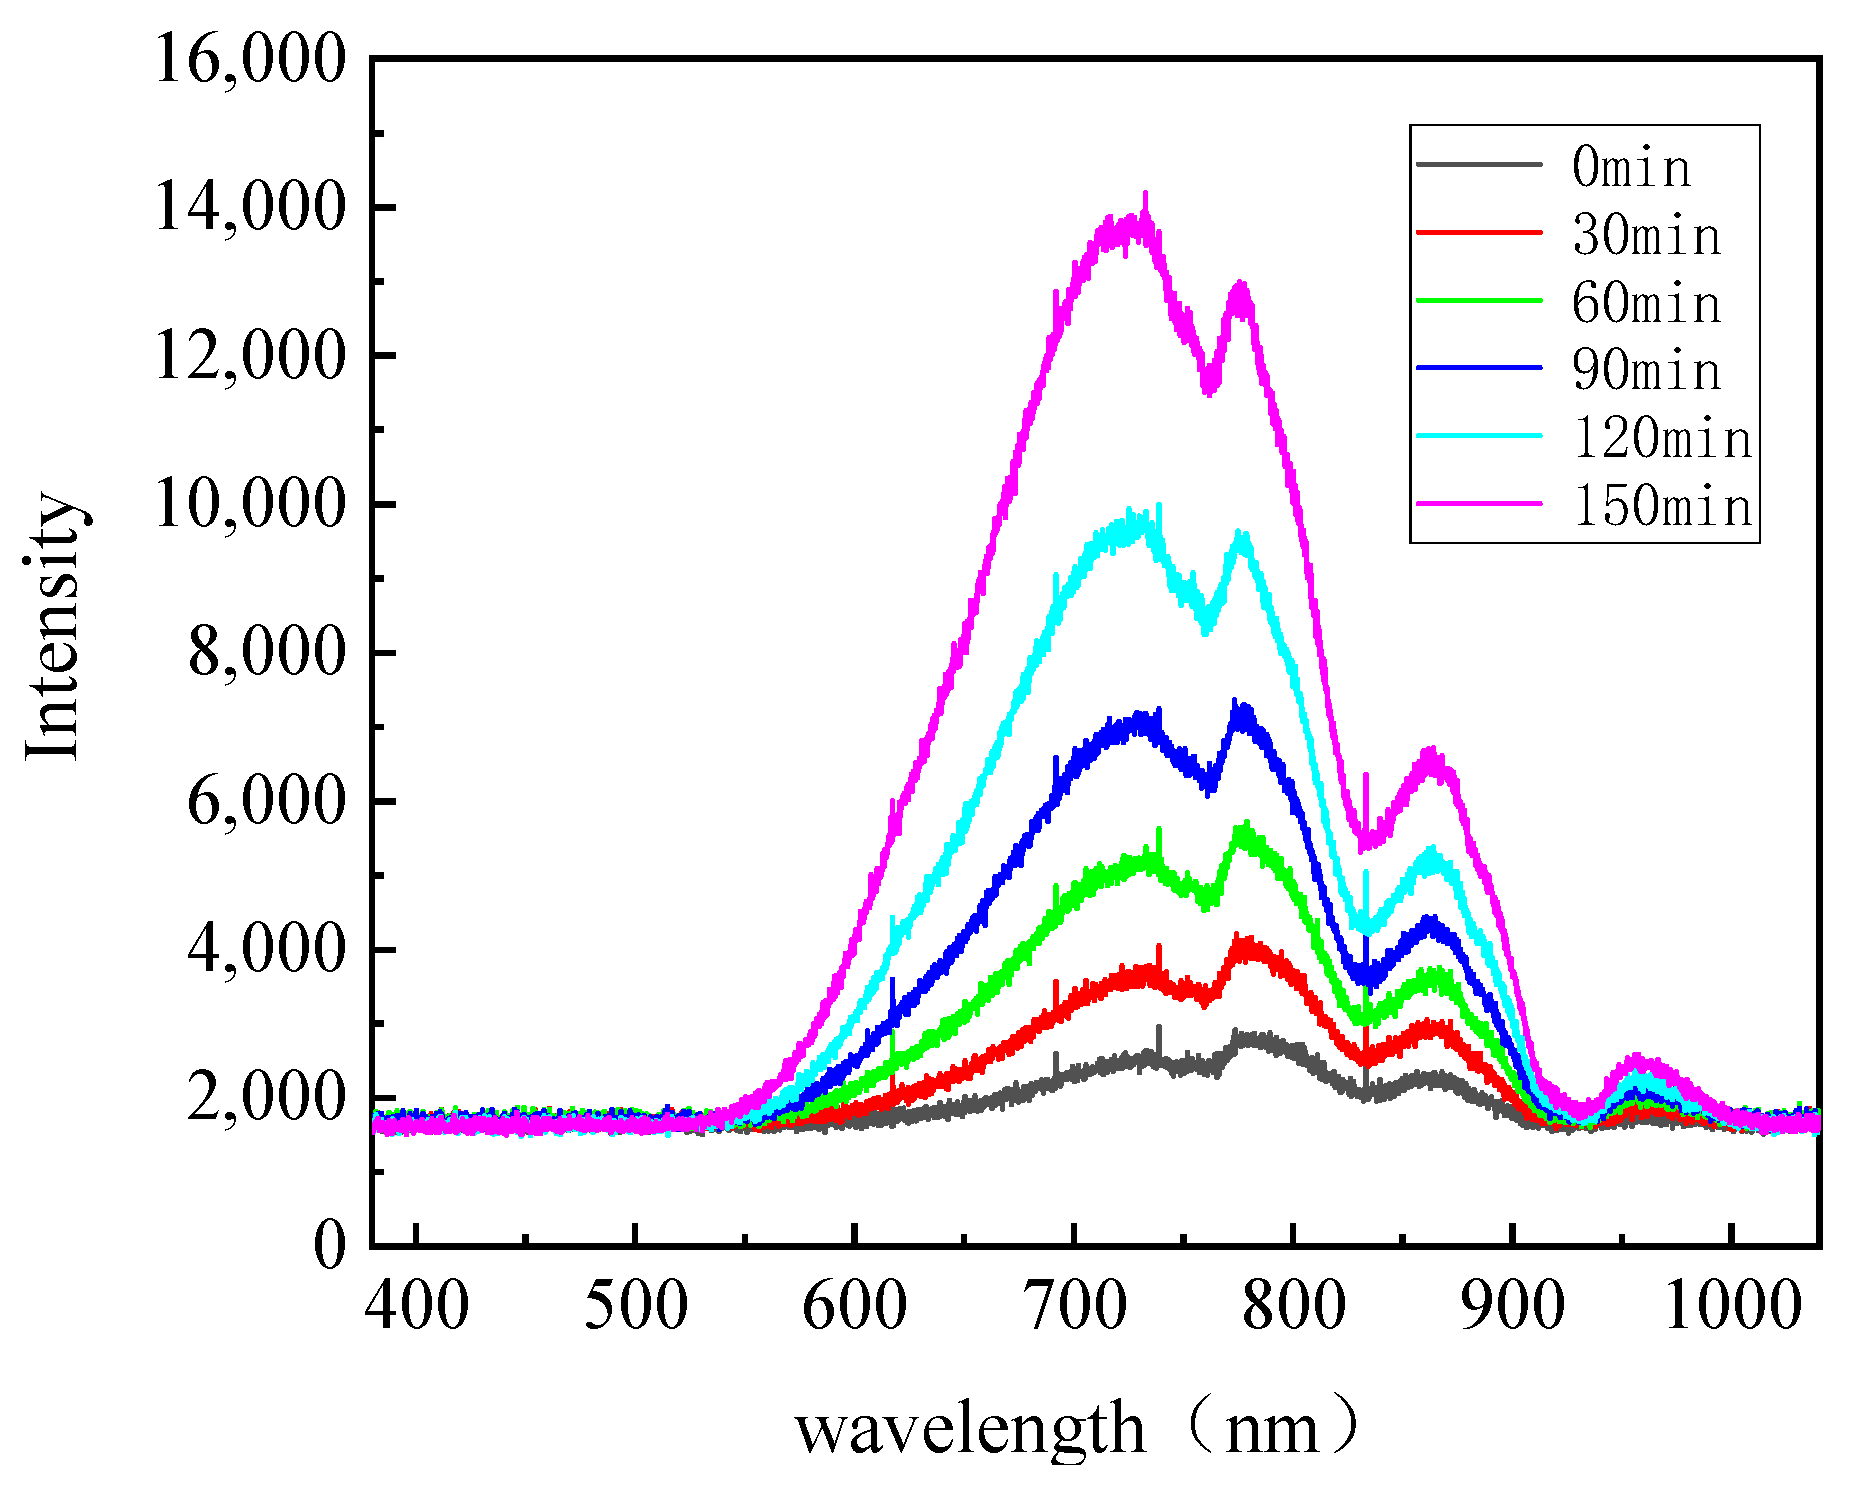
The transmission spectra at 0, 30, 60, 90, 120, and 150 min are shown in Figure 11. From the figure, it is evident that the transmission spectra change noticeably over time as heating progresses. Similar to the temperature changes at the monitoring points, the relative light intensity in the spectra remains relatively stable during the first 30 min of heating. However, between 30 and 150 min, as the temperature inside the lubricant rises, more areas of the oil reach temperatures above −37 °C. This significantly improves the oil’s transmissibility, leading to an increase in the relative light intensity recorded by the spectrometer. The changes in the relative light intensity at different wavelengths follow distinct patterns. During the first 30 min, the temperature of the lubricant along most of the light path remains below −42 °C, which results in a lower transmission at 750 nm and a corresponding decrease in the peak near 750 nm in the spectrum. As heating continues, the region where the temperature exceeds −37 °C gradually expands, improving the transmissibility of shorter wavelengths. This causes the peak near 750 nm to increase sharply, with the rise being notably faster than at other wavelengths.
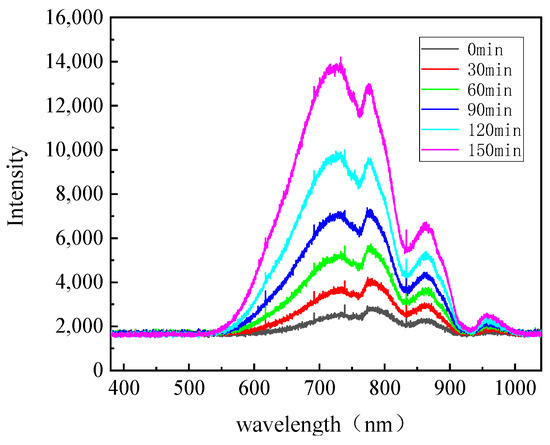
Figure 11.
Lubricant Transmission Spectrum.
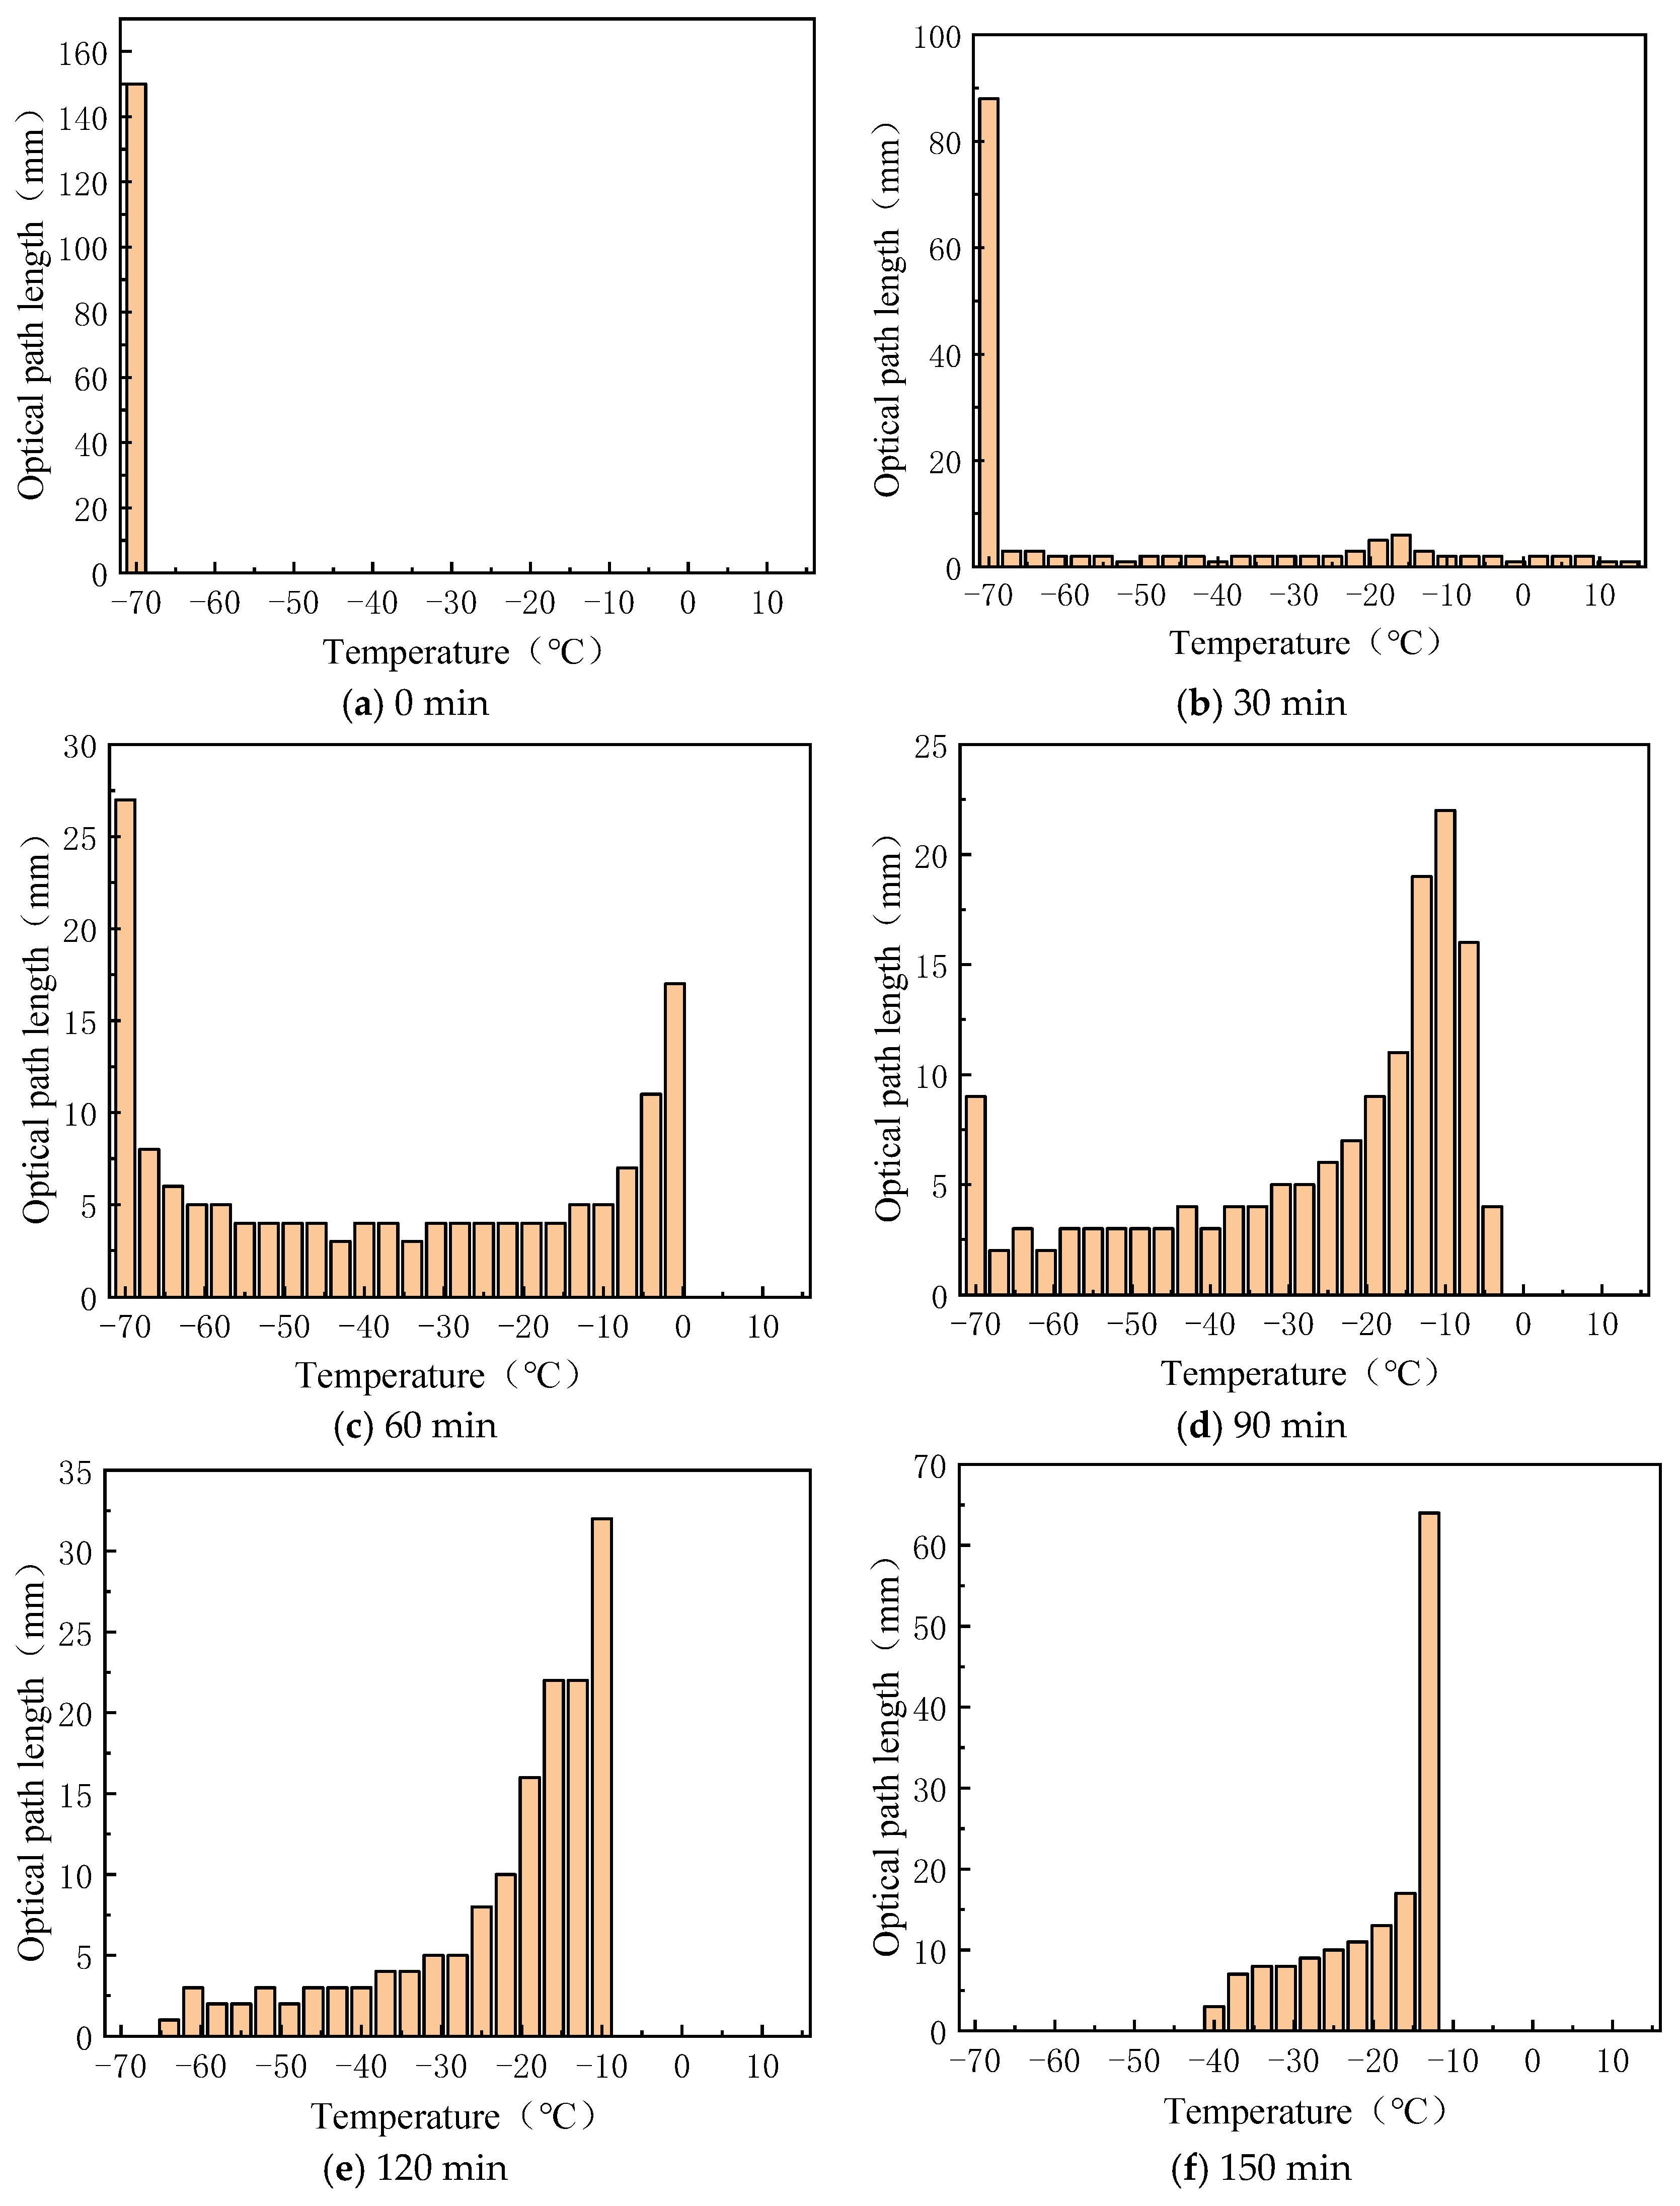
Based on the transmission spectra of a specific heavy-duty power transmission lubricant at different temperatures within the 380 nm to 1040 nm wavelength range (as shown in Figure 6), a temperature step of , a wavelength step of , and an optical path length of were used. By segmenting the transmission spectrum and applying the relevant data to Equation (7), the optical path determinant at each temperature for each time point was calculated. Solving this determinant provided the optical distance distribution at different temperatures over time. The histograms of the optical distance distribution at 0, 30, 60, 90, 120, 150, and 180 min are shown in Figure 12. From the figure, it is evident that the temperature distribution follows a U-shaped trend. In the initial stages of heating, most of the optical path is at lower temperatures. As heating continues, the low-temperature region decreases in size, and the temperature distribution shifts to a pattern where the ends are warmer and the middle is cooler. In the later stages of heating, this trend reverses: the high-temperature region expands and the size of the low-temperature region decreases as the temperature continues to rise.
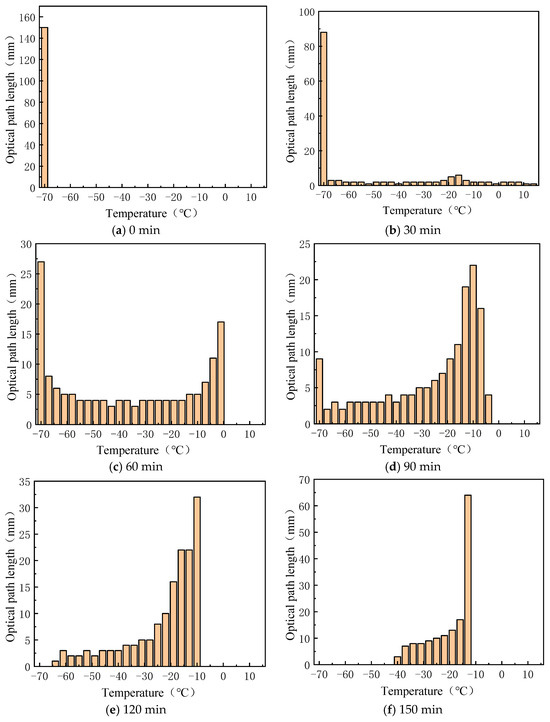
Figure 12.
Histogram of optical path length distribution for different temperatures at different moments in time.
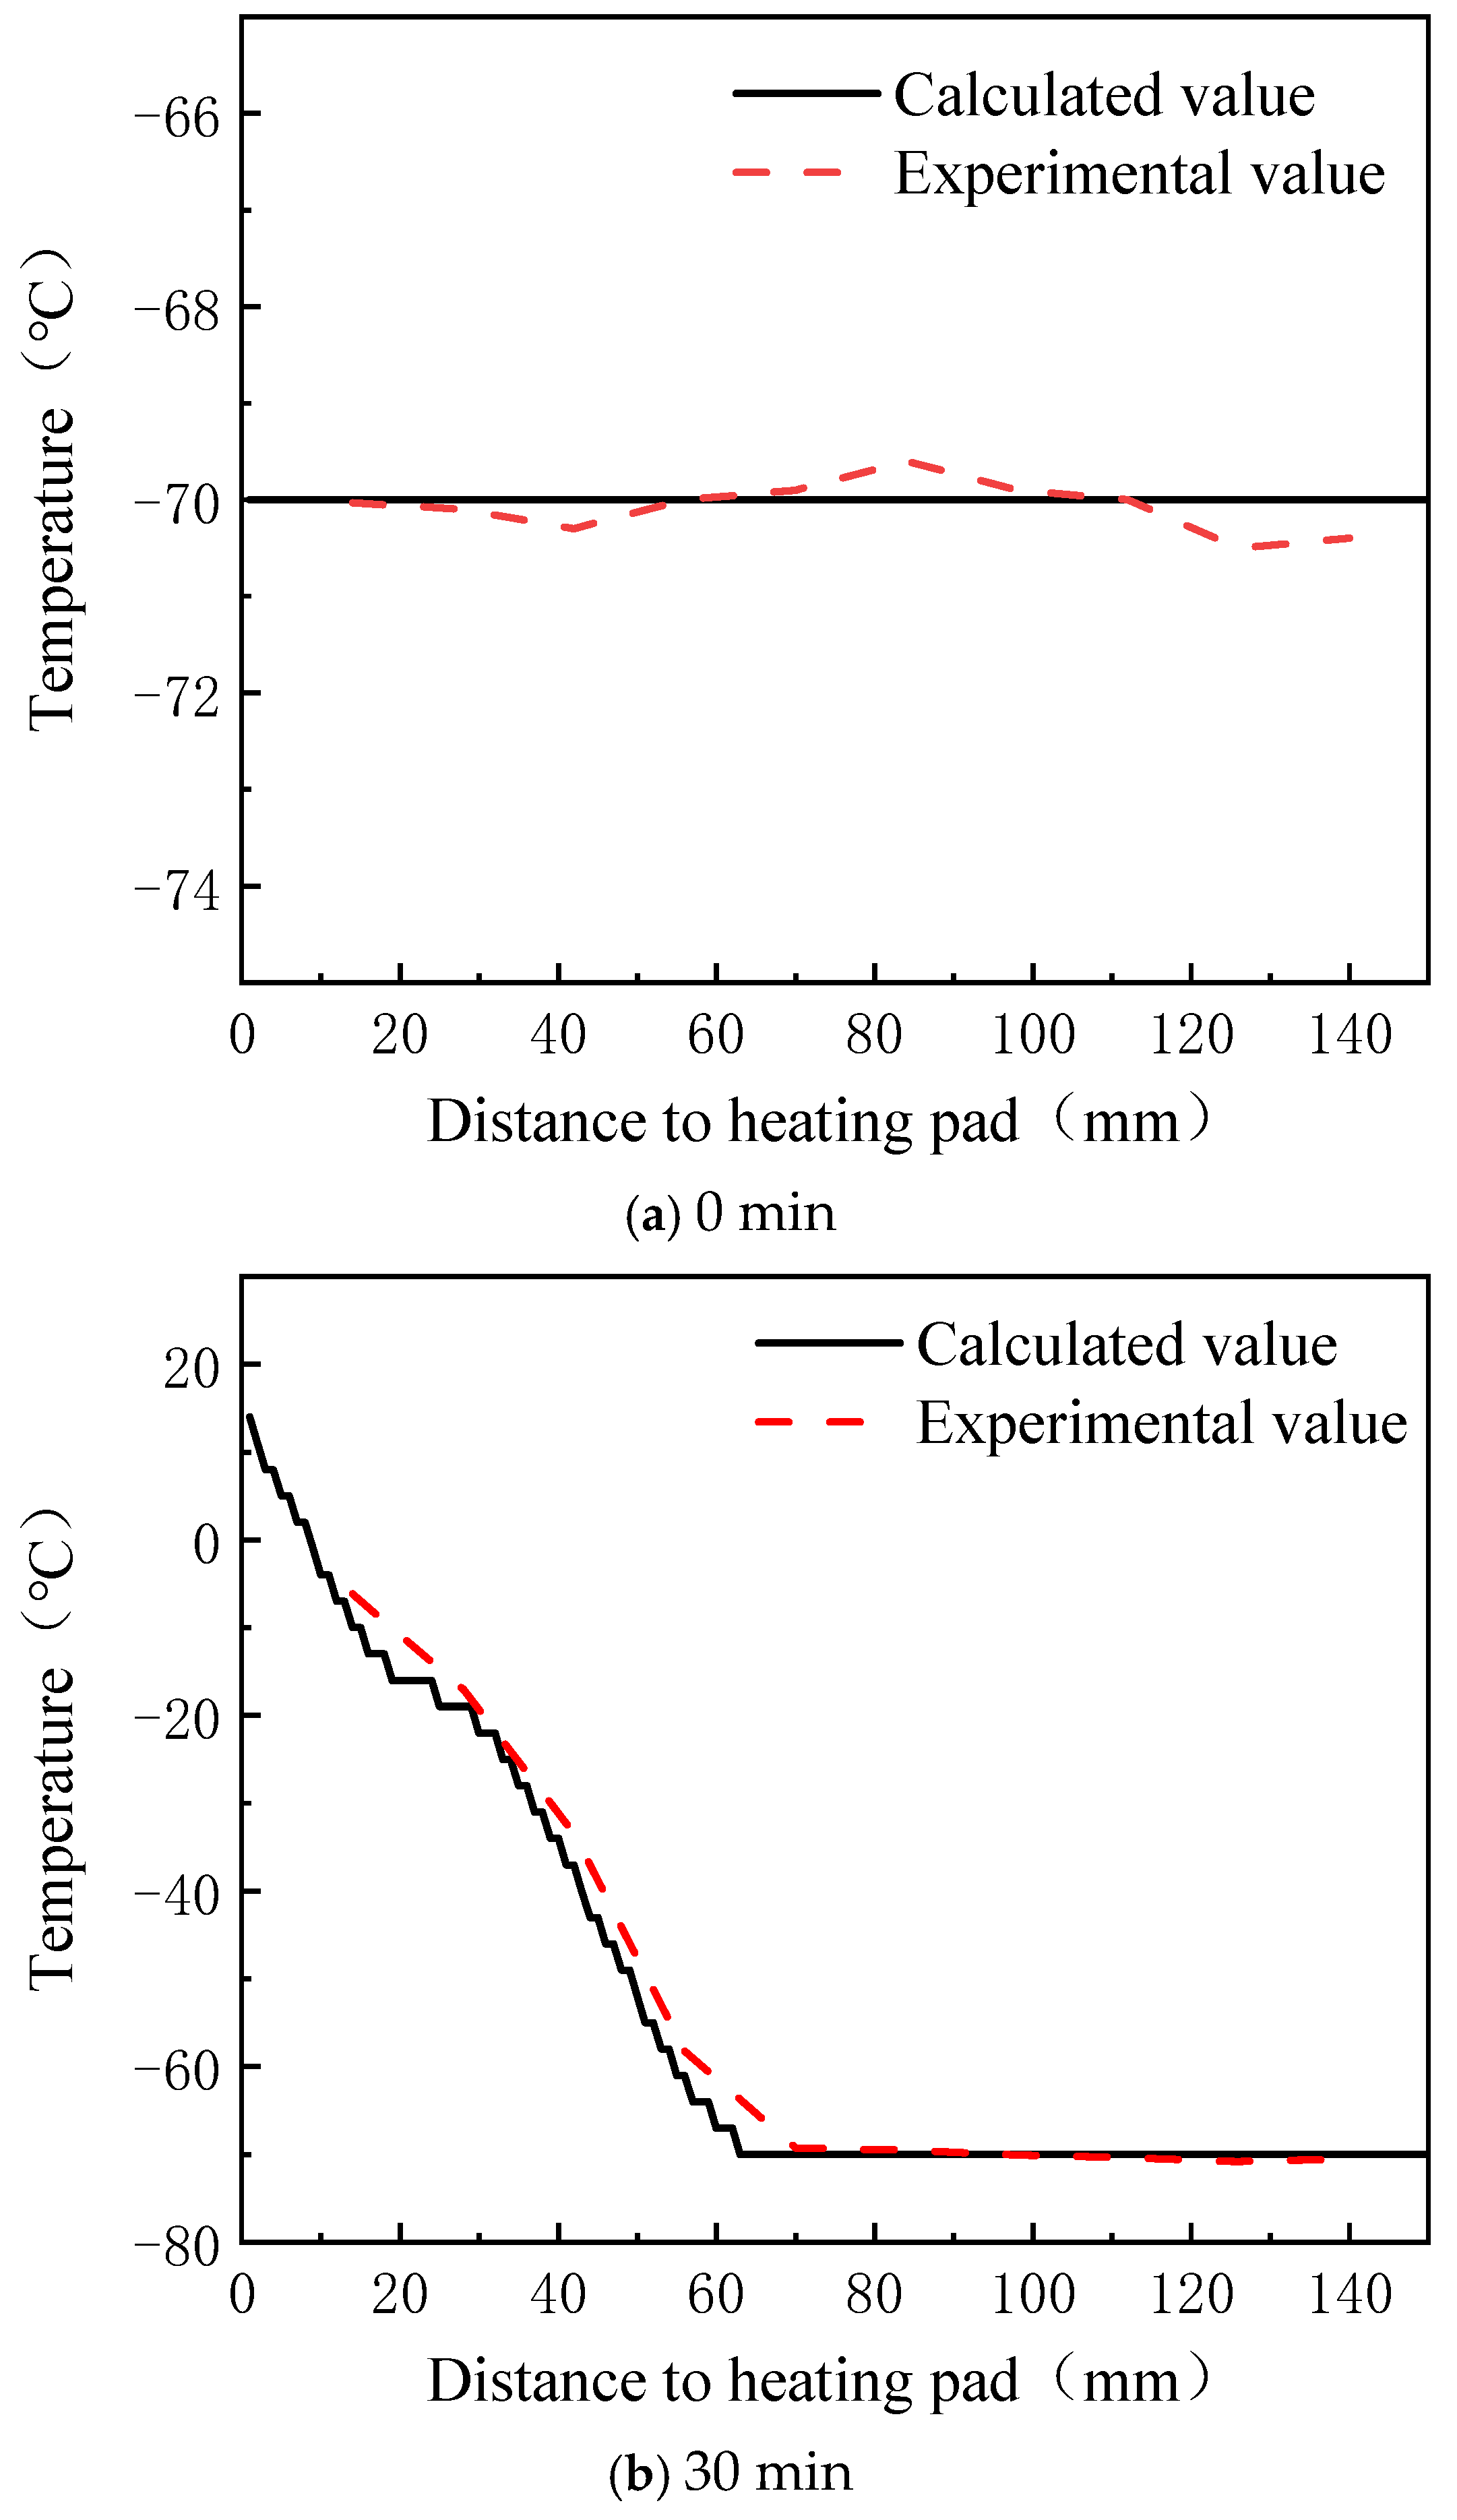
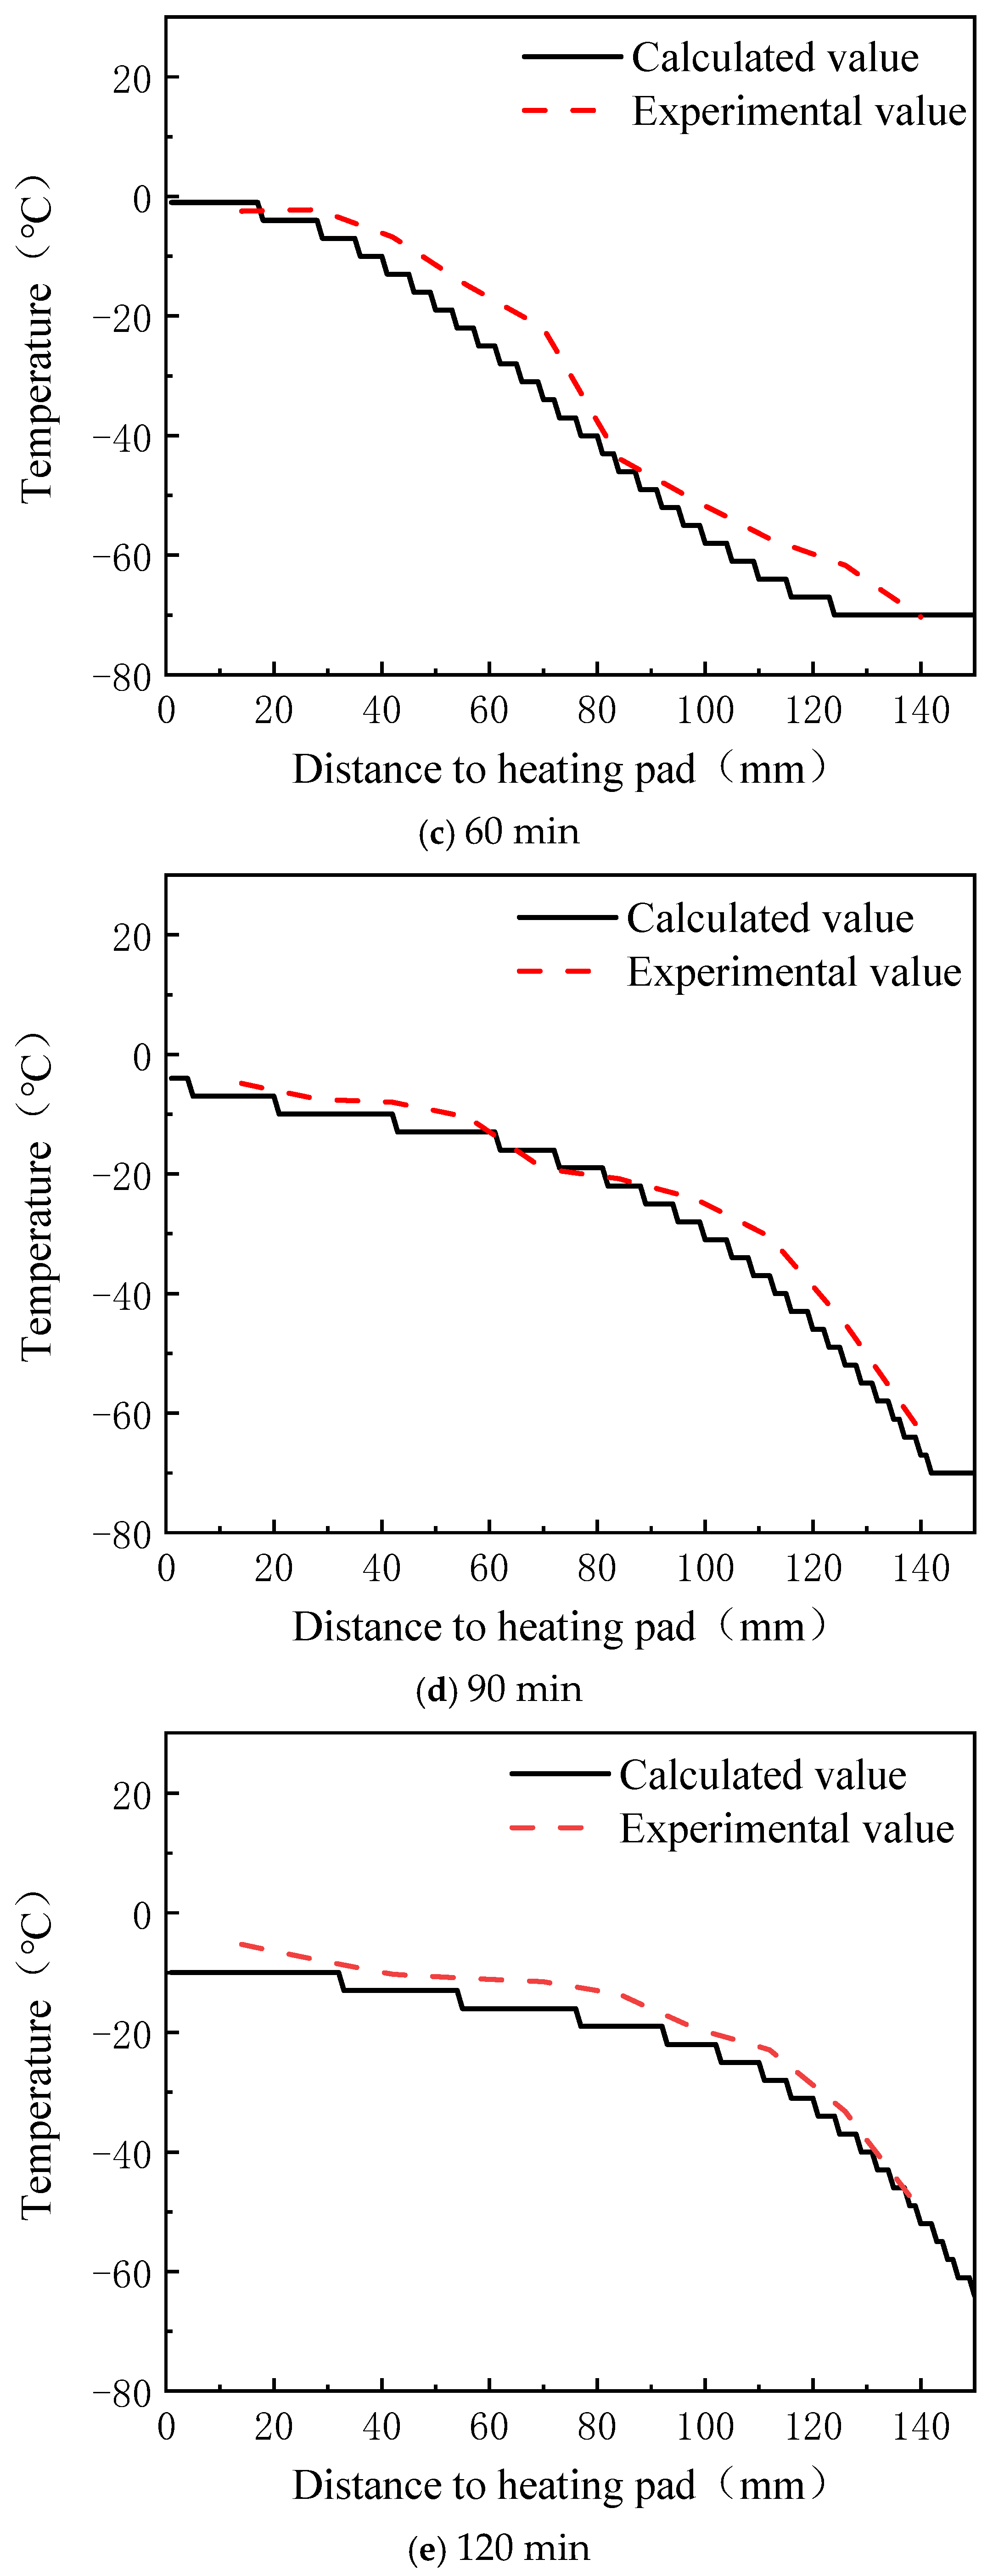
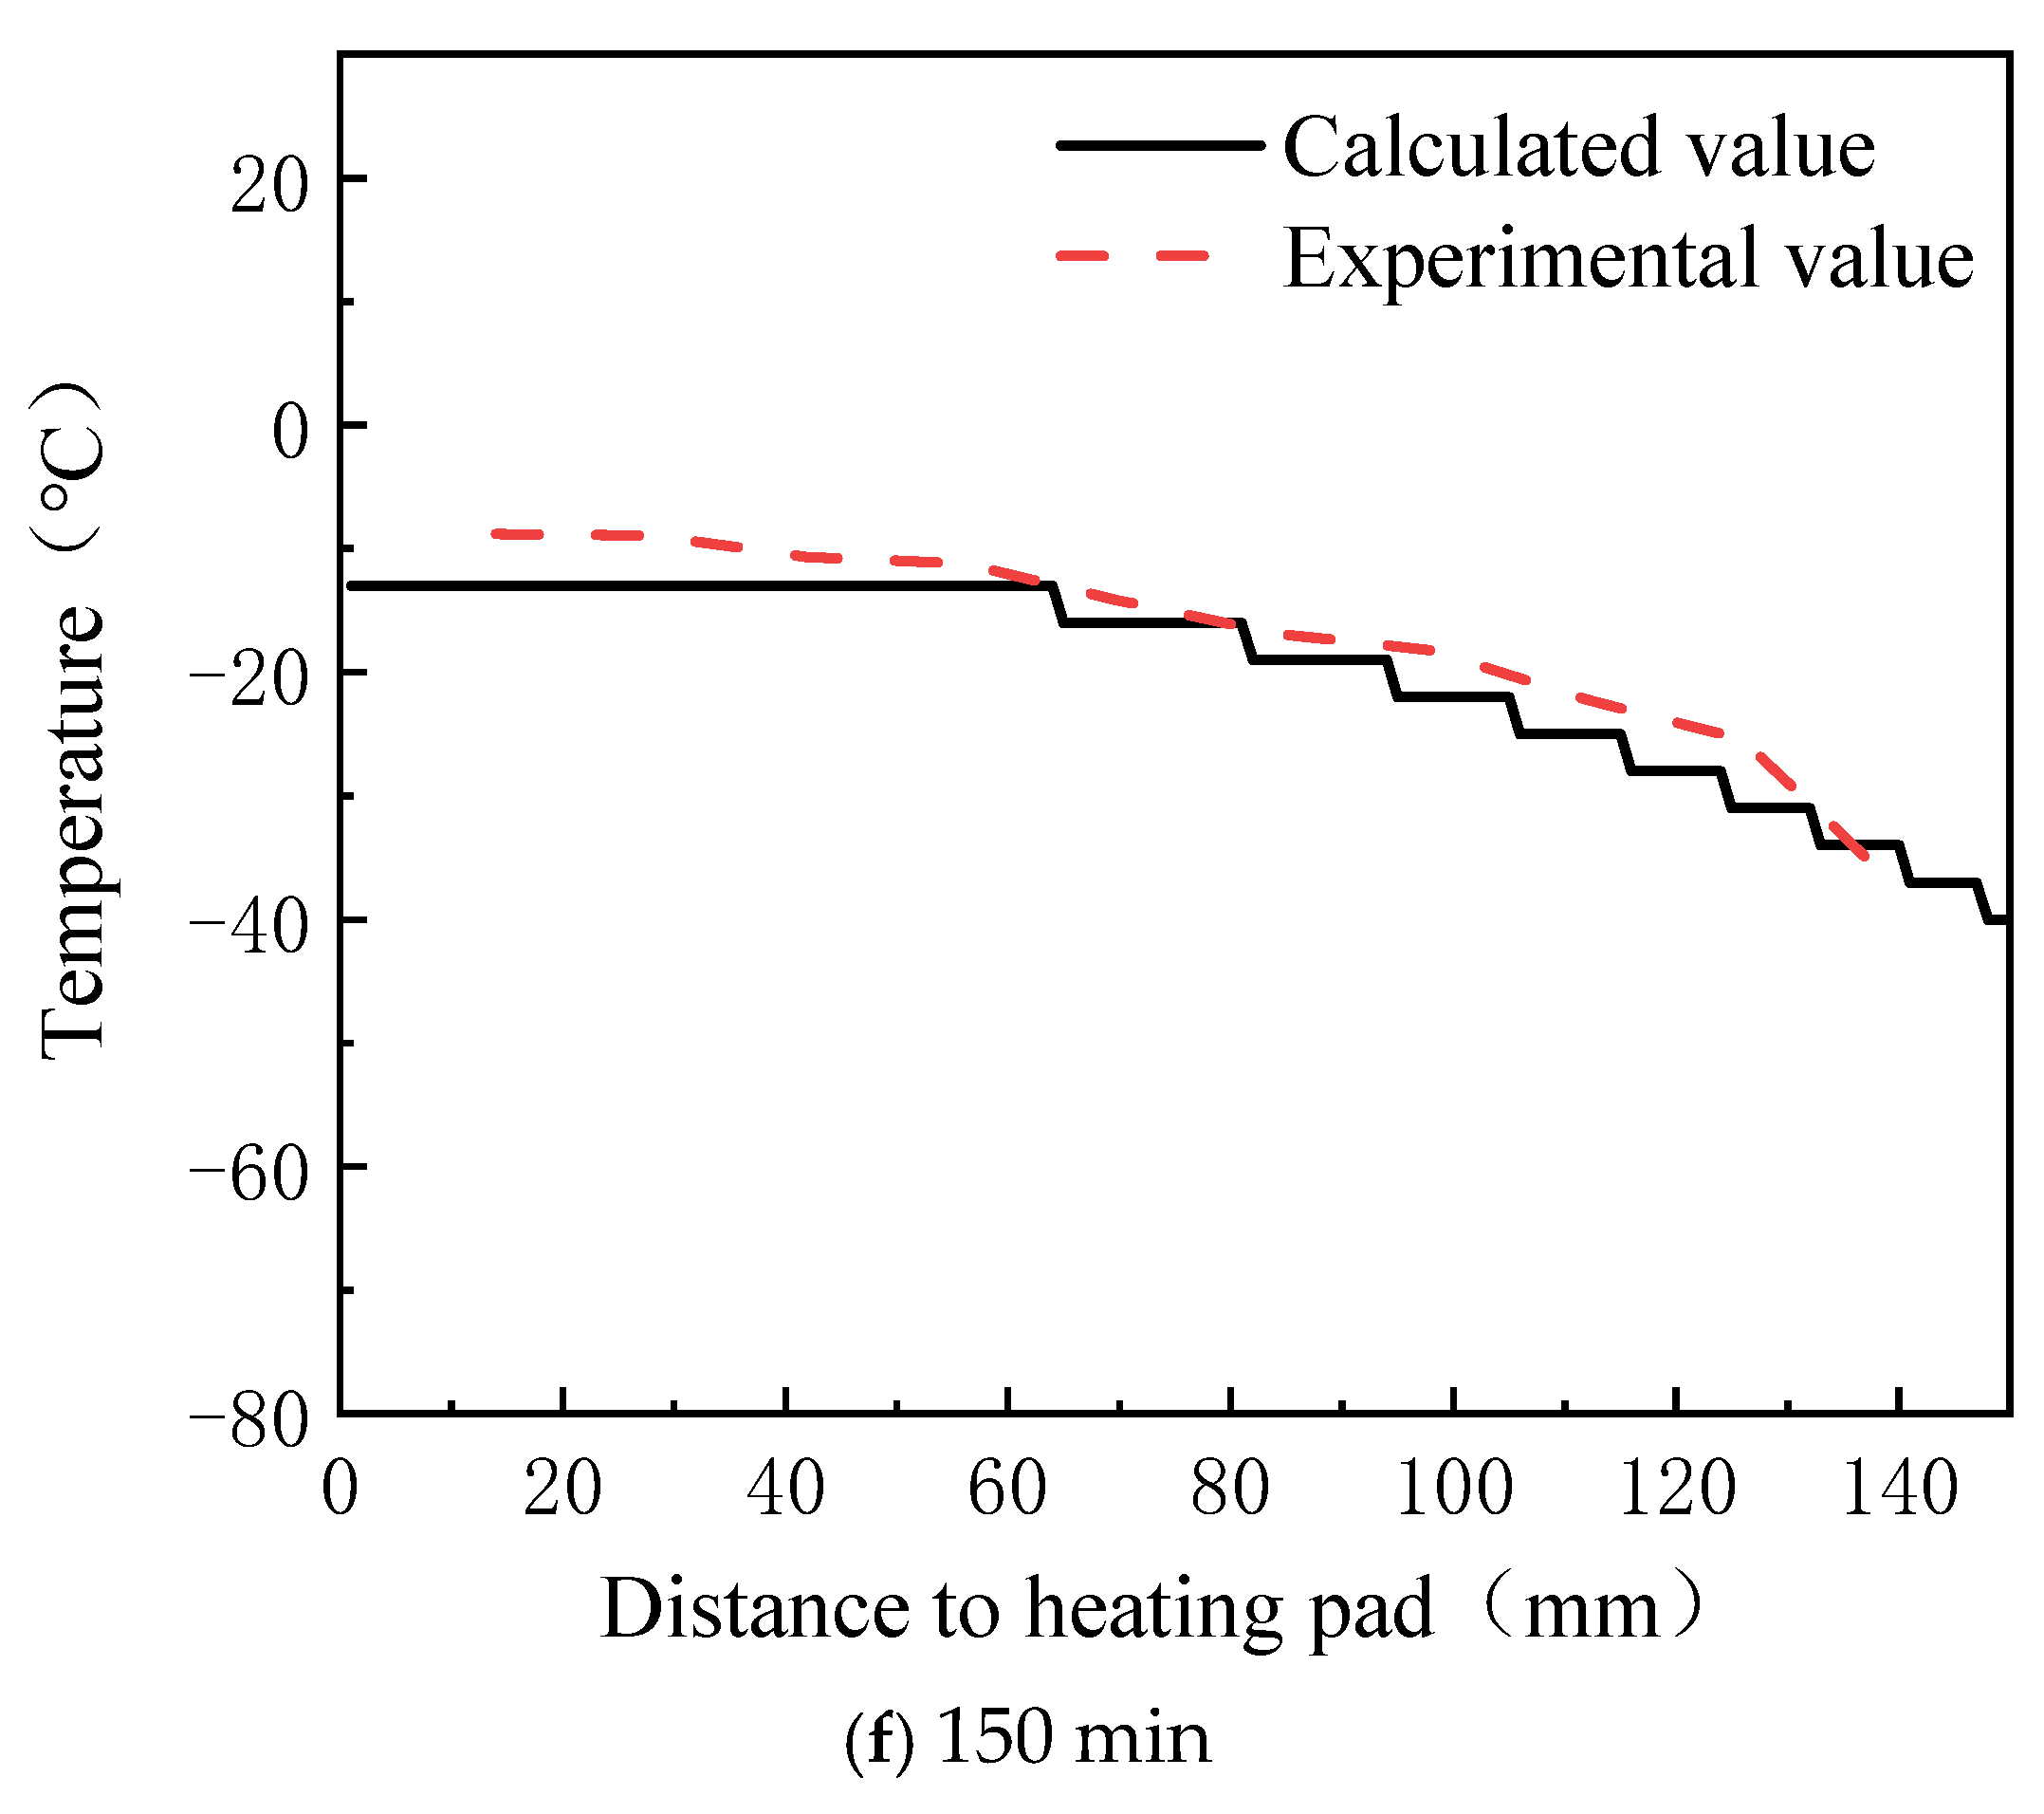
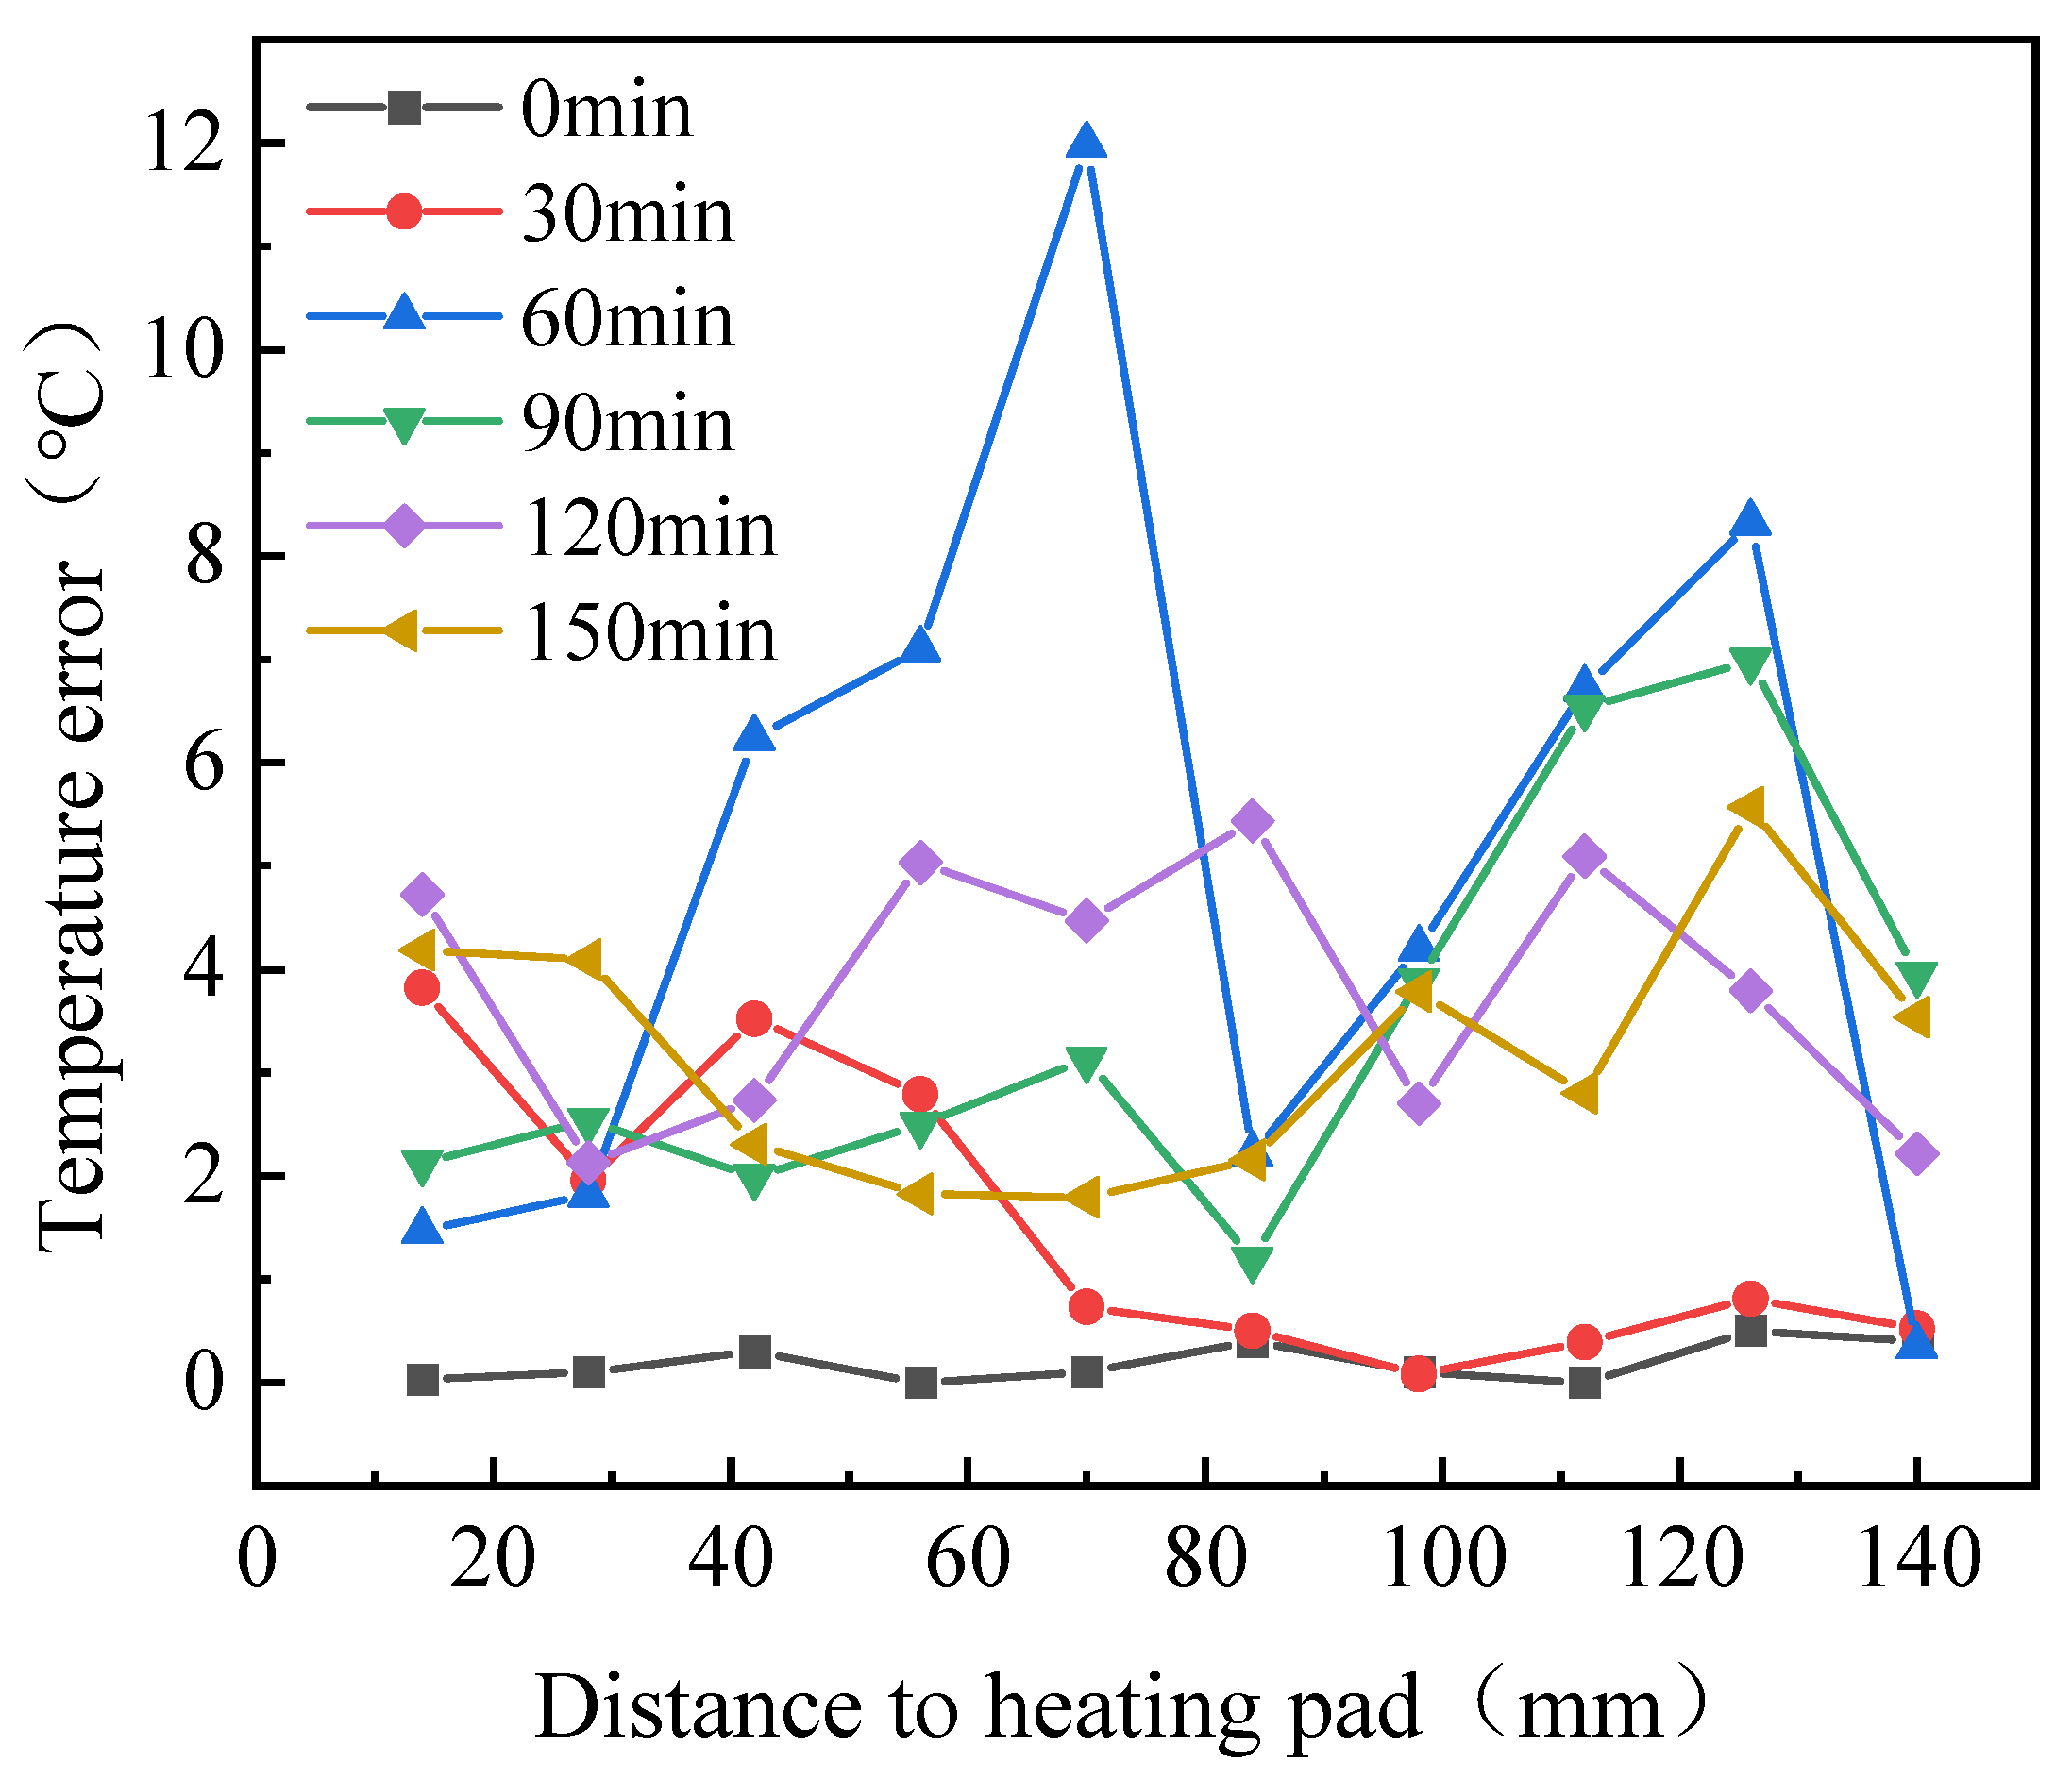
The melting process of the lubricant in a low-temperature environment, as studied in this paper, follows unidirectional melting, resulting in a temperature distribution that either monotonically increases or decreases. The temperature distribution curve derived from the optical distance data in Figure 12 is compared with the temperature distribution measured by sensors, as shown in Figure 13. The error between the calculated and experimental values is presented in Figure 14. From these figures, it is evident that the temperature distribution trend calculated by the proposed method closely matches the trend observed experimentally throughout the heating process. In the initial heating phase, the error between the calculated and experimental values is small, with an average error of 0.22 °C and a maximum error of only 0.50 °C across all ten monitoring points. As heating continues, the error gradually increases, reaching its peak at 60 min, with an average error of 5.67 °C and a maximum error of 11.98 °C. After this point, the error stabilizes and the average errors at 90, 120, and 150 min are 3.80 °C, 3.97 °C, and 3.41 °C, respectively, while the maximum errors are 6.98 °C, 5.43 °C, and 5.56 °C, respectively. The larger error at 60 min may be attributed to the rapid temperature rise and significant temperature gradient at that time. The temperature range step (∆T) is more sensitive to changes in the optical distance, which amplifies the impact of measurement errors on the accuracy of the equation solution. This results in greater discrepancies between the calculated and experimental values.
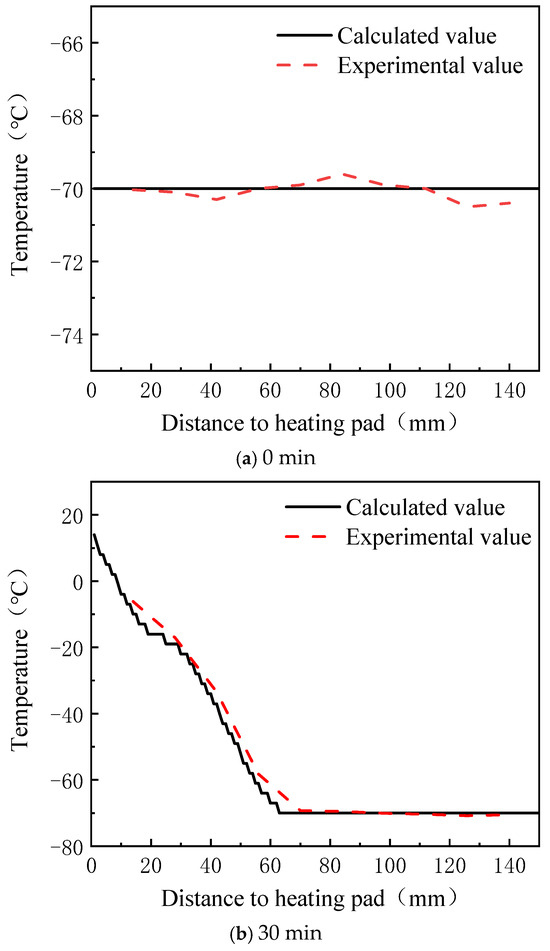
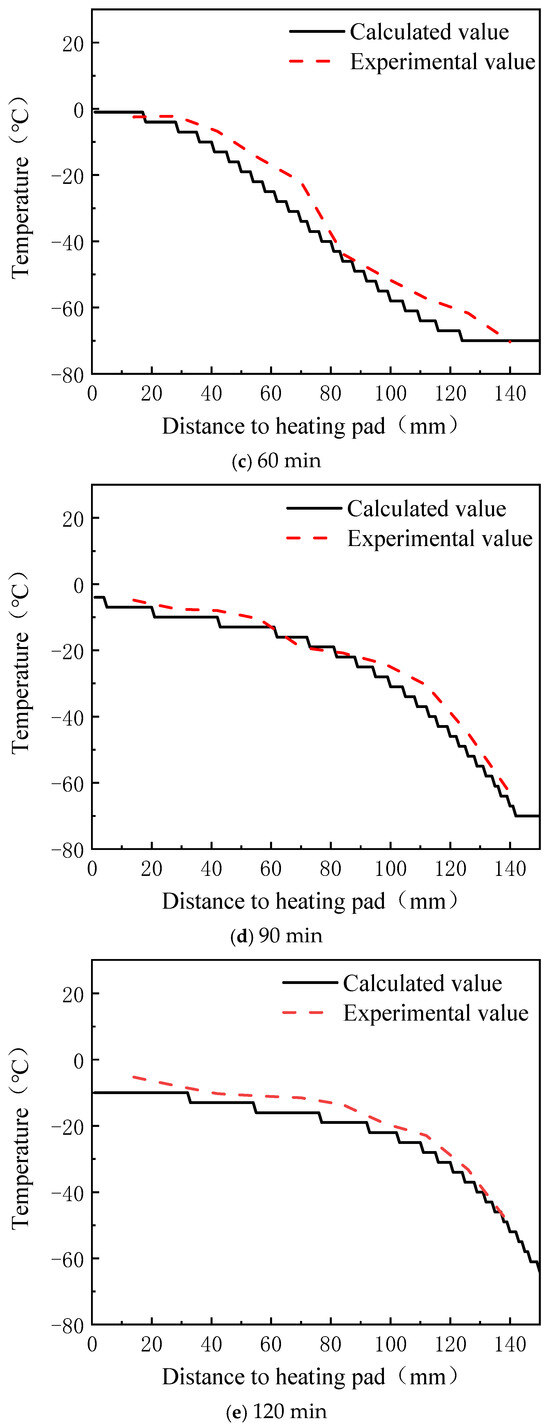
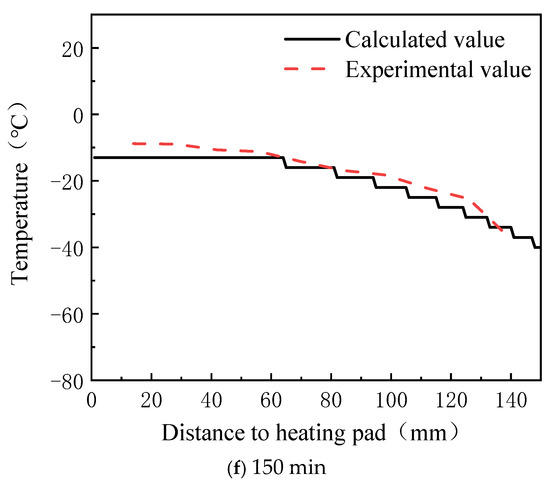
Figure 13.
Comparison of temperature profiles at different moments.

Figure 14.
Error between calculated and experimental values.
4. Conclusions
To enable the non-contact dynamic monitoring of the internal temperature distribution of a lubricant during the melting process in low-temperature environments, this paper proposes a temperature distribution calculation method based on transmission light spectrum analysis. First, the transmission rate of the lubricant in the wavelength range of 380 nm to 1040 nm at different temperatures was experimentally tested, and a mathematical relationship between the temperature distribution and light intensity was established. Then, optical experiments were conducted on the unidirectional melting process of the lubricant in a low-temperature environment. Using the collected spectral data, the internal temperature distribution of the lubricant was calculated and compared with temperature data collected from sensors. The results showed that in the initial heating phase, the average error between the calculated and experimental values was 0.22 °C. As heating continued, the error gradually increased, reaching its maximum value of 5.67 °C at 60 min. After that, the error stabilized and reached 3.80 °C by the end of the heating process. Throughout the entire heating period, the average error between the calculated and experimental values was 2.87 °C. These results validate the correctness and accuracy of the proposed temperature distribution calculation method.
However, this study only observed the unidirectional melting process of one type of lubricant and did not extend the proposed transmission light spectrum-based temperature distribution monitoring method to other lubricants. Additionally, the impact of different heating methods and lubricant conditions on the accuracy of the proposed method was not explored. Therefore, future work will focus on conducting optical property experiments with various heating methods for different types of lubricants. This will further investigate the low-temperature melting states and phase interface evolution processes. Additionally, an integrated observation model will be developed based on optical property calculations and artificial neural networks, aiming to enhance the accuracy and universality of the method.
Author Contributions
Conceptualization, L.L.; methodology, L.L.; software, Y.L.; validation, R.Z.; formal analysis, S.Y.; writing—original draft preparation, L.L.; writing—review T.S. All authors have read and agreed to the published version of the manuscript.
Funding
This research received no external funding.
Data Availability Statement
The original contributions presented in this study are included in this article.
Conflicts of Interest
The authors declare no conflicts of interest.
References
- Akbiyik, T.; Kahraman, N.; Taner, T. Investigation of the effect of boron additive to lubricating oil on engine performance, exhaust, and emissions. Fuel 2022, 312, 122931. [Google Scholar] [CrossRef]
- Dong, L.; Liang, X.; Shu, G. The influence of lubricating oil on deposits formation in a diesel engine under the operation condition of high power density. Lubr. Sci. 2013, 25, 441–451. [Google Scholar] [CrossRef]
- Hong, N.M.; Thang, B.H.; Hong, P.N.; Hong, N.T.; Khoi, P.H.; Minh, P.N. CNTs based lubricating oils for UAZ 31512 engines. Micro Nano Lett. 2016, 11, 636–639. [Google Scholar] [CrossRef]
- Ramteke, S.M.; Chelladurai, H.; Amarnath, M.; Ajay Vardhaman, B.S.; Ramkumar, J.; Siddiqui, J.A. Condition assessment of in-service SAE 10W-30 lubricating oil using spectroscopic and rheological analyses. Sādhanā 2022, 47, 218. [Google Scholar] [CrossRef]
- Singh, S.K.; Agarwal, A.K.; Sharma, M. Experimental investigations of heavy metal addition in lubricating oil and soot deposition in an EGR operated engine. Appl. Therm. Eng. 2006, 26, 259–266. [Google Scholar] [CrossRef]
- Sun, J.; Hao, F.; Liu, G.; Wang, H.; Teng, Q.; Miao, E.; Zhao, X.; Ren, Y.; Zhu, G. Research on the lubrication performance of engine piston skirt–cylinder liner frictional pair considering lubricating oil transport. Int. J. Engine Res. 2020, 21, 713–722. [Google Scholar] [CrossRef]
- Sun, J.; Huang, X.; Liu, G.; Zhao, X.; Miao, E.; Zhu, G.; Li, Y. Research on the status of lubricating oil transport in piston skirt-cylinder liner of engine. J. Tribol. 2018, 140, 041702. [Google Scholar] [CrossRef]
- Tippayawong, N.; Sooksarn, P. Assessment of lubricating oil degradation in small motorcycle engine fueled with gasohol. Maejo Int. J. Sci. Technol. 2010, 4, 201–209. [Google Scholar]
- Pape, F. Nano- and Micro-Tribological Investigations of Boundary Layers on Axial Bearing Washers Tested under WEC Critical Conditions. Lubricants 2022, 10, 198. [Google Scholar] [CrossRef]
- Asadova, A.; Masimov, E.A.; Imamaliyev, A.R.; Asadova, A.H. Spectrophotometric investigation of gel formation in water solution of agar. Mod. Phys. Lett. B 2020, 34, 2050147. [Google Scholar] [CrossRef]
- Ryzhov, A.A.; Ivanov, A.B.; Volkovich, V.A.; Griffiths, T.R. Reaction of tungsten dioxide with hydrogen chloride in alkali chloride melts: An electronic absorption spectroscopy study. In Proceedings of the VI International Young Researchers’ Conference 2019, Ekaterinburg, Russia, 20–23 May 2019; p. 020055. [Google Scholar]
- Matsumura, K.; Kawase, K.; Takeya, K. Observation of sublimation of ice using terahertz spectroscopy. R. Soc. Open Sci. 2020, 7, 192083. [Google Scholar] [CrossRef] [PubMed]
- Cordeiro, A.J.; Alves, K.C.; Mota, E.A.; Vasconcelos, D.L.; Lima, R.A.; da Silva, J.A.; Freire, P.T. Phase-transition of hydrophobic dipeptide l-phenylalanyl-l-alanine under high pressure via Raman spectroscopy. Spectrochim. Acta Part A Mol. Biomol. Spectrosc. 2025, 326, 125290. [Google Scholar] [CrossRef] [PubMed]
- Hegde, V. Spectroscopic analysis of Dy3+ in alkali-varied zinc barium borate glasses for solid-state lighting devices. Appl. Phys. A 2023, 129, 25. [Google Scholar] [CrossRef]
- Xu, G.; O’shea, N.; Drouin, G.; Pacheco-Pappenheim, S.; O’donnell, C.P.; Hogan, S.A. Application of in-line Raman spectroscopy to monitor crystallization and melting processes in milk fat. Food Res. Int. 2024, 191, 114690. [Google Scholar] [CrossRef] [PubMed]
- Meng, L.; Dong, K. Thermal experiment study on the self-luminous properties of metallic iron during solid–liquid phase transition. Ironmak. Steelmak. 2024. [Google Scholar] [CrossRef]
- Kosenkov, D.V.; Sagadeev, V.V. Spectral Emissivity of Transition Metals of the X Group in the Melting Point Region. Tech. Phys. 2024, 69, 1607–1610. [Google Scholar] [CrossRef]
- Dan, H.K.; Phan, A.L.; Ty, N.M.; Zhou, D.; Qiu, J. Optical bandgaps and visible/near-infrared emissions of Bin+-doped (n = 1, 2, and 3) fluoroaluminosilicate glasses via Ag+-K+ ions exchange process. Opt. Mater. 2021, 112, 110762. [Google Scholar] [CrossRef]
- Lenkennavar, S.K.; Eraiah, B.; Kokila, M.K. Spectroscopic investigation of Europium doped sodium lead borate glass for LED applications. In Proceedings of the 3rd International Conference on Condensed Matter and Applied Physics (ICC-2019), Bikaner, India, 14–15 October 2019; American Institute of Physics Conference Series. Volume 2220, p. 080034. [Google Scholar]
- Lin, Z.; Guo, X.; He, Z.; Liang, X.; Wang, M.; Jin, G. Thermal degradation kinetics study of molten polylactide based on Raman spectroscopy. Polym. Eng. Sci. 2021, 61, 201–210. [Google Scholar] [CrossRef]


Disclaimer/Publisher’s Note: The statements, opinions and data contained in all publications are solely those of the individual author(s) and contributor(s) and not of MDPI and/or the editor(s). MDPI and/or the editor(s) disclaim responsibility for any injury to people or property resulting from any ideas, methods, instructions or products referred to in the content. |
© 2025 by the authors. Licensee MDPI, Basel, Switzerland. This article is an open access article distributed under the terms and conditions of the Creative Commons Attribution (CC BY) license (https://creativecommons.org/licenses/by/4.0/).