Abstract
A single-plunger two-dimensional electro-hydraulic pump is an integrated unit in which a two-dimensional plunger pump is embedded inside the rotor of a permanent magnet synchronous motor, significantly improving the power density and power-to-weight ratio of electro-hydraulic pumps. The pursuit of a higher power-to-weight ratio has made high-speed operation and high-pressure output persistent research priorities. However, during the iterative design process of electro-hydraulic pumps, cavitation has been identified as a common issue, leading to difficulties in oil suction and even severe backflow. Based on the structure and motion characteristics of the single-plunger two-dimensional electro-hydraulic pump, a CFD numerical model was established to analyze the influence of different working conditions on the cavitation characteristics inside the pump. The study shows that cavitation mainly occurs in the plunger chamber, the distribution groove, and the triangular damping groove. The location and intensity of cavitation are directly reflected by the gas volume fraction. The simulation analysis of variable operating conditions has verified that suction pressure and rotational speed have a significant impact on cavitation—an increase in suction pressure can effectively suppress cavitation, while an increase in rotational speed will exacerbate cavitation development. Specifically, the non-cavitation working boundary of this type of pump was determined through theoretical derivation, and the coupling relationship between critical suction pressure and critical speed was clarified. This work provides an important theoretical basis for the optimization design of the new integrated electro-hydraulic pump.
1. Introduction
In oil pumps, cavitation is triggered by a drop in the local hydraulic oil pressure below its saturated vapor pressure. This leads to the formation of a large number of tiny bubbles, whose subsequent collapse erodes the flow passage components [1,2]. As the pressure inside the pump increases, these bubbles travel with the hydraulic oil to high-pressure areas, where they shrink or even rupture, creating vacuum regions accompanied by significant impacts that induce noise and vibration [3]. Once the bubbles adhere to the inner wall surfaces of the components, the impacts generated upon their rupture act on these surfaces, leading to fatigue damage, a phenomenon known as cavitation erosion. This severely accelerates the aging and breakdown of pump components, compromises the pump’s operational performance, and significantly reduces its service life. In the study of low-speed pumps, the gas volume fraction is extremely low, making cavitation less likely to occur. However, as the rotational speed increases, the pump oil suction capacity gradually decreases, thereby greatly increasing the likelihood of cavitation erosion.
Through research, it has been found that cavitation occurring in a single-plunger two-dimensional electro-hydraulic pump mainly falls into two categories: The first type is air cavitation, which occurs when the local pressure drops to the air separation pressure, causing all the air dissolved in the hydraulic oil to separate out. The second type is vapor cavitation, which takes place when the local pressure further decreases to the saturation vapor pressure, triggering a phase change in the hydraulic oil from liquid to vapor. However, since the saturation vapor pressure of hydraulic oil is significantly lower than the air separation pressure, for most oil pumps, the air separation pressure is chosen as the criterion for determining the onset of cavitation. With the occurrence of cavitation, primarily bubbles generated by the separation of air from the hydraulic oil, accompanied by a small number of bubbles produced through the phase change in the oil, can easily lead to discontinuity in the oil flow and a reduction in volumetric efficiency. Therefore, investigating the causes and types of cavitation under different operating conditions and exploring methods to suppress cavitation erosion is of great significance for the high-speed development of single-plunger two-dimensional electro-hydraulic pumps.
In order to reduce the impact of cavitation erosion and ensure the stability of the pump body in the hydraulic system, scholars at home and abroad have conducted corresponding research on the cavitation phenomenon of piston pumps. German researcher GOLD S [4] simulated a piston pump using a transparent pipeline made of plexiglass, built a cavitation research test bench, and then used a high-speed camera to capture the cavitation phenomenon inside the pipeline under different oil suction pressures. It was found that when the oil suction pressure was lower than a certain value, bubbles would obviously form and increase in number within the pipeline. As the oil flow moved to the high-pressure area, the bubbles would collapse, correspondingly causing cavitation erosion. However, due to the limited pressure-bearing capacity of glass, experiments under high-pressure working conditions were not carried out. Danish researcher MEINCKE O [5] first adopted the method of numerical simulation combined with experimental research. Not only did he use Pumplinx software (https://www.simerics.com/pumplinx/, accessed on 30 October 2025) to construct a cavitation model and simulate/analyze it to obtain the main cavitation distribution areas within the pump, but he also installed a high-speed camera inside the kidney-shaped groove of the valve plate in the piston pump during the experimental part to directly capture cavitation phenomena in the high-pressure area of the piston pump for verification. However, due to insufficient light inside the pump, the image display effect was unsatisfactory. Opitz K [6] from the University of Nuremberg, Germany, utilized high-speed cameras to capture cavitation phenomena within pumps. In his experiments, he investigated cavitation erosion in pumps under different valve design configurations and analyzed and discussed the results. Kim S [7] from RWTH Aachen University, Germany, primarily focused on cavitation phenomena in the valve-plate region of pumps. His experiments revealed that when the jet velocity was excessively high, the pressure inside the pump dropped significantly, leading to the generation of a large number of bubbles. Subsequently, as these bubbles were compressed and ruptured in high-pressure zones, micro-jet impingements occurred on the flow passage walls, causing material damage and increased noise. Schleihs C et al. [8] conducted simulation analyses on axial piston pumps using the fluid simulation software PumpLinx, discussing the distribution areas of cavitation within the piston pumps under different rotational speeds and swashplate inclination angles. Ye SG et al. [9] observed the cavitation erosion damage morphology on the valve-plate surface using confocal laser scanning microscopy and found a strong correlation between fluid velocity and erosion damage area. Their research identified two erosive mechanisms of cavitation: the presence of a large amount of vapor and direct jet impingement. Hutli E et al. [10] employed a customized image acquisition and processing system to visually observe and analyze cavitation phenomena induced by high-speed jets in piston pump experiments. He explored the influence of parameters such as dimensionless distance and nozzle geometry on the performance of underwater cavitating water jets. The accuracy of the theoretical model was validated through optical and scanning electron microscopy analyses, providing a theoretical basis for optimizing the design of cavitating water jets. Scholars, including TsukijiI T [11] from Sophia University, Japan, conducted two-dimensional observations of the internal flow in piston pumps using high-speed cameras, meticulously recording the dynamic process of cavitation. Their research, combined with CFD simulations, verified the cavitation range and further tested the cavitation characteristics of the pump under high-pressure conditions, offering an in-depth analysis of the cavitation erosion generation mechanism and significant contributions to the study of cavitation in pumps.
Chao Qun [12] and colleagues from Zhejiang University proposed that during the operation of high-speed piston pumps, the fluid centrifugal effect leads to non-uniform radial pressure distribution within the piston chamber. By constructing a cavitation model using PumpLinx software for simulation verification, they demonstrated that introducing inwardly inclined cylinder ports in EHA pumps and leveraging the centrifugal effect of rotating fluids can effectively reduce cavitation erosion. Guo Weiwei et al. [13] from Taiyuan University of Technology combined theoretical analysis with numerical simulation to investigate the internal flow field distribution and cavitation phenomena in axial piston pumps. They explained the cavitation erosion caused by submerged cavitating jets generated by pre-pressurization and unloading triangular grooves. Sun Zegang [14] and his team from Sichuan University of Science & Engineering proposed an improved anti-cavitation design for triangular throttle slots on the valve plate, which involves reducing the inclination angle of the triangular slots during the pre-decompression phase and increasing the outlet flow area during the pre-pressurization phase. Simulation verification showed that this design enhanced the anti-cavitation performance of axial piston pumps and reduced cavitation severity. Zhang Jing et al. [15] from Lanzhou University of Technology conducted simulation analysis and verification of cavitation in axial piston pumps using PumpLinx. Their results indicated that optimizing the transition zone of the valve plate effectively reduced pressure and flow pulsations, thereby alleviating cavitation phenomena. Li Ying [2] and her colleagues from Yanshan University explored the influence of suction pressure on cavitation in high-speed axial piston pumps. Simulation results revealed that cavitation initiation points were primarily located in the suction chamber, triangular grooves on the valve plate, and suction holes in the piston cylinder. Increasing suction pressure effectively suppressed cavitation, and there existed a maximum critical speed at which cavitation did not occur under each suction pressure.
Cavitation-induced vibration and noise represent a common challenge across both rotary and positive-displacement hydraulic components, not merely piston pumps. While triggering mechanisms vary structurally—such as trapped oil phenomena in gear pumps [16] and inlet flow separation in centrifugal pumps [17]—the underlying physical origin remains universal: vapor bubble formation and collapse occur when local pressure falls below the fluid’s saturation vapor pressure.
Within this universal context, this investigation focuses on a structurally integrated single-piston 2D electro-hydraulic pump. Its defining kinematic feature—a combined reciprocating-rotating piston motion—creates a cavitation development environment distinct from conventional pumps. This study establishes several original contributions: a novel analytical framework defining cavitation-free operational boundaries through critical suction pressure and rotational speed criteria; a high-fidelity 3D transient CFD model capturing the complete compound motion; and systematic multiphase flow analysis elucidating fundamental cavitation mechanisms, evolution patterns, and parametric dependencies. The research findings not only provide a solid theoretical foundation for the engineering design and performance optimization of this specific pump type but also offer valuable insights and references for understanding and mitigating cavitation phenomena in a broader range of hydraulic power components.
2. Principle of Pump Body Structure and Fluid Dominant Equation
2.1. The Structure of Pump and Operation Principle
The single-plunger two-dimensional electro-hydraulic pump (Abbreviated as SP2DEHP) is a highly integrated hydraulic power unit that embeds a permanent magnet synchronous motor (PMSM) within the pump body [18,19], with its overall structure illustrated in Figure 1. The mechanical characteristics of the entire assembly are as follows: The rotor core is secured to the coupling using screws, and the coupling is subsequently connected to the connector via a spline, which then directly interfaces with the plunger shaft. Thus, the rotational mechanical energy is transferred sequentially through the rotor, coupling, connector, and finally to the plunger shaft. The connector is designed to accommodate axial displacement of the plunger by providing adequate clearance. Additionally, the right side of the pump body is connected to the motor housing and pump adapter shoulder, and the entire assembly is fastened by inserting bolts through the front end cover of the pump.
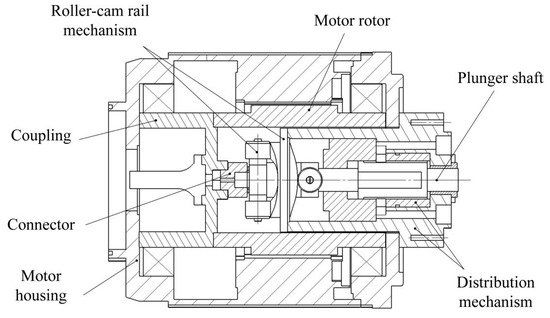
Figure 1.
The SP2DEHP structure drawing.
The SP2DEHP has an overall cylindrical shape and is mainly divided into a roller-cam rail mechanism and a distribution mechanism. In the roller-cam rail mechanism, one side of the guide rail in the cam is a flat surface, while the other side is a spatial cam curved surface. Two troughs and two peaks are designed on this curved surface. A roller frame equipped with rollers is installed at the corresponding position on the shoulder of the plunger shaft. Under the action of centrifugal force, the rollers are tightly pressed against the cam rail. The rotation of the rollers on the guide rail drives the plunger shaft to perform axial constant-acceleration and constant-deceleration motion. This causes periodic changes in the volume of the sealed cavity formed by the plunger, the cylinder block and the cylinder liner.
The initial position of the plunger shaft is set when the volume of the low-pressure cavity on the right side is zero. When rotating from 0° to 45°, the plunger shaft moves to the right with constant acceleration until it reaches the maximum speed. From 45° to 90°, the plunger shaft continues to move to the right with constant acceleration until it attains the maximum displacement, causing the left cavity to expand to its maximum volume. From 90° to 135°, the plunger shaft moves to the left with constant acceleration until it reaches the maximum speed in the opposite direction. From 135° to 180°, the plunger shaft continues to move to the left with constant acceleration until it reaches the maximum displacement, resulting in the right cavity expanding to its maximum volume, and the plunger shaft returns to its initial position.
The displacement, velocity, and acceleration of the plunger shaft during this working process can be expressed by Equations (1)–(3). The specific motion law of uniformly accelerated and uniformly decelerated motion is illustrated in Figure 2.
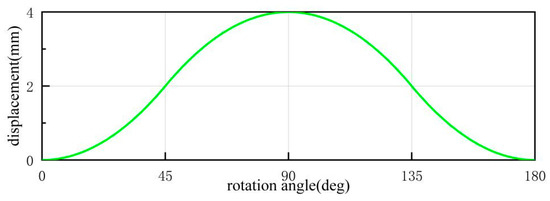
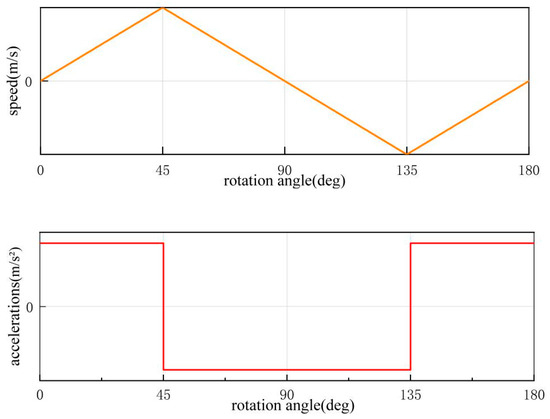
Figure 2.
Motion law of plunger pump shaft.
In the formula, is displacement of plunger shaft; is maximum displacement of plunger shaft; is speed; is acceleration; is rotational speed; is time.
The structural design of the internally embedded single-plunger two-dimensional pump is illustrated in Figure 3. In this diagram, the low-pressure connection is indicated in blue, the high-pressure connection in red, while the oil outlet and inlet channels are marked in yellow, respectively. When the chamber is compressed, the two distribution grooves connected to the oil outlet channel become high-pressure grooves, enabling oil discharge by linking to the outlet channel. Conversely, when the chamber expands, the two distribution grooves connected to the oil inlet channel become low-pressure grooves, facilitating oil suction by connecting to the inlet channel.
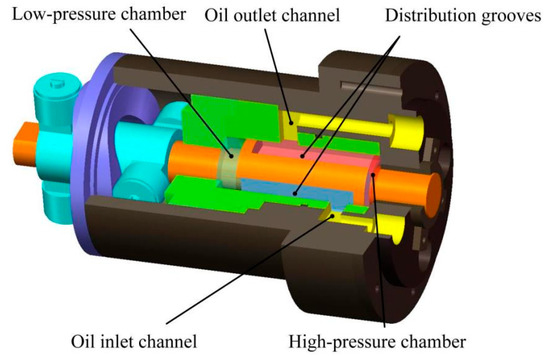
Figure 3.
Pump structure drawing.
Four distribution grooves, labeled J, K, L and M, are arranged to coordinate with the inlet distribution windows A and B, as well as the outlet distribution windows C and D. However, it was observed that the existing model exhibited significant flow reversal at the outlet, as depicted in Figure 4. To address this issue, triangular unloading grooves, serving pre-pressurization and pre-decompression functions, were incorporated along the edges of the valve-plate grooves. This ensures precise alignment of the valve windows, effectively mitigating backflow.
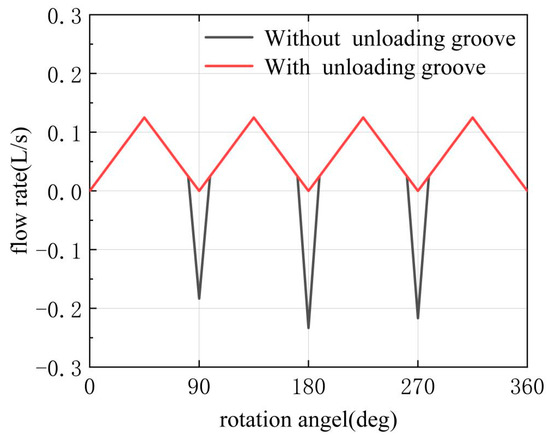
Figure 4.
Comparison of pump outlet flow rate.
The figure demonstrates a complete fluid distribution process, from initial connection to full disconnection, occurring within a quarter cycle (90°). The fluid distribution conditions among the distribution windows A, B, C, D and the distribution grooves J, K, L, M are illustrated in Figure 5, where red indicates high-pressure regions and blue represents low-pressure regions.
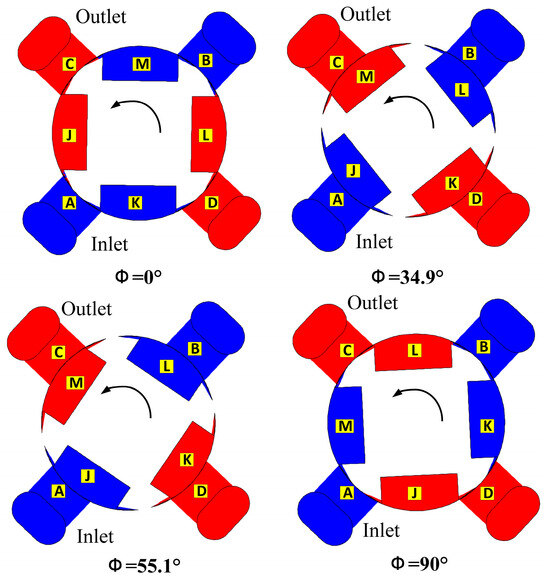
Figure 5.
Flow distribution diagram of the pump.
When the plunger shaft rotates to an angle Φ = 0°, the roller is positioned at the lowest point of the spatial cam guide rail. At this stage, the fluid distribution area is limited solely to the triangular unloading groove area. The right chamber has the minimum volume, while the left chamber has the maximum volume. As the plunger shaft rotates from Φ = 0° to 34.9°, the roller moves towards the highest point of the cam guide rail, causing the fluid distribution area to gradually increase until it matches the area of the distribution windows. During this phase, the right chamber functions as a low-pressure chamber in the oil suction state, while the left chamber serves as a high-pressure chamber in the oil discharge state. From Φ = 34.9° to 55.1°, the roller continues its ascent towards the highest point of the cam guide rail, with the fluid distribution area remaining constant. The right chamber maintains its low-pressure state for oil suction, and the left chamber remains in the high-pressure state for oil discharge. As the rotation angle progresses from Φ = 55.1° to 90°, the roller reaches the highest point of the cam guide rail, and the fluid distribution area progressively decreases, reaching a minimum equivalent to the triangular unloading groove area. Throughout this process, the right chamber remains a low-pressure chamber for oil suction, and the left chamber remains a high-pressure chamber for oil discharge, completing a full cycle of oil suction and discharge.
Similarly, between Φ = 90° and 180°, the working conditions of the right and left chambers are reversed, accompanied by abrupt pressure changes. As the plunger continues to rotate, completing a full 360° cycle, the chambers undergo four complete cycles of oil suction and discharge.
2.2. Fluid Dominant Equation
The 3D simulation of the fluid domain under the assumption of incompressible oil is governed by the fundamental conservation laws of continuity, momentum and energy.
Continuity equation
In the formula, is density of gas–liquid two-phase flow; is average velocity of gas–liquid two-phase flow; is volume fraction of the phase.
- Momentum equation, which belongs to mixture model for multiphase flow, is the sum of the momentum equations of all phases. And the calculation expression is shown below:
In the formula, is pressure; is number of phases; is external forces acting on fluids; is viscosity of the mixture; is drift velocity of phase.
- 2.
- Energy equation for the mixture is as follows:
In the formula, is effective thermal conductivity; is heat contribution of all other volumetric heat sources; is turbulent thermal conductivity coefficient.
The SST k-ω model was selected to capture the complex turbulence in the pump’s high-rotation, high-curvature channels, as it accurately resolves near-wall regions without wall functions and performs well under adverse pressure gradients and flow separation [18,19]. For an incompressible fluid, the k-equation is expressed as
The expression for ω is as follows:
The expression for turbulent viscosity is as follows:
In the formula, is fluid density; is turbulent kinetic energy; is production term of turbulent kinetic energy; are empirical coefficients.
Cavitation was simulated using the Schnerr-Sauer model, a bubble dynamics-based approach (see Appendix A for the complete derivation) that requires only the bubble number density (Using Fluent software’s default value of 1 × 10¹¹/m3) to determine vapor fraction and bubble diameter. This method eliminates empirical coefficients while maintaining high solution accuracy. The model expressions are presented below:
In the formula, is evaporation coefficient; is condensation heat transfer coefficient; is mixed phase density; is saturated vapor pressure; is volume fraction of nucleation sites.
To ensure reliable operation of the novel integrated pump under high-speed and high-pressure conditions, this study establishes its cavitation-free boundaries through theoretical derivation. Based on fluid energy conservation and system pressure loss modeling, analytical expressions for the critical suction pressure and rotational speed were developed for the first time (see Appendix A for the complete derivation).
In the formula, comma are kinetic energy correction factor, which is defined as α = 2 for laminar flow and α = 1 for turbulent flow; is flow velocity of the oil as it enters the inlet channel; is flow velocity of the oil as it enters the plunger cavity; is energy loss in the oil inlet channel; is energy loss in the distribution window area and distribution groove; are scale factors.
This approach clearly reveals the positive correlation between suction pressure and the critical speed, thereby establishing crucial theoretical foundations and safety boundaries for optimizing the pump towards high-power-density objectives.
3. Fluid Cavitation Simulation and Its Generation Mechanism
Using CFD software Fluent (Ansys 2022 R1) to conduct digital simulation research on the SP2DEHP is a crucial approach for exploring its internal transient flow patterns and cavitation evolution mechanisms. By setting relevant parameters, it is possible to simulate the internal flow characteristics of the electro-hydraulic pump under different operating conditions, capture these transient processes, and help identify problematic areas. This enables the prediction of issues during the pump design phase, reduces the number of prototype iterations, and lowers the physical and testing costs associated with experimental evaluations.
3.1. Grid Division and Independence Verification
The cavitation profile in the fluid domain of the SP2DEHP is critical for overall pump stability and accurate digital flow distribution. The modeling process involved extracting the flow passage volume in SolidWorks 2021 and importing the geometry into ANSYS 2022 R1 Meshing for grid division.
Grid independence was verified by monitoring the flow passage pressure drop versus element size, as plotted in Figure 6a. The pressure drop initially increases and then stabilizes with grid refinement, but exhibits substantial fluctuations and a sharp decrease for element sizes finer than 0.4 mm. A base size of 0.4 mm was selected for the fluid domain grid to optimally balance numerical accuracy and computational effort.
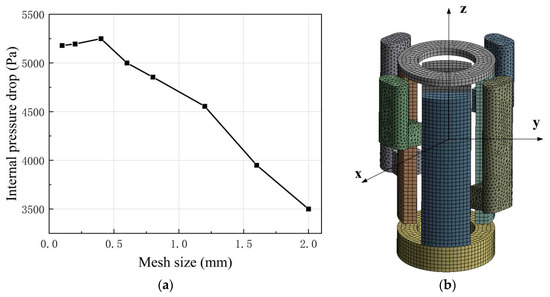
Figure 6.
Grid division of the fluid domain of the electro-hydraulic pump: (a) grid independence verification, (b) grid model image.
The resulting grid model, illustrated in Figure 6b, comprises distinct zones for the inlet/outlet ports, the distribution groove, and the left and right piston chambers.
The regulation of suction pressure mainly involves the installation of a small booster pump in front of the oil flow channel, while the regulation of load pressure requires connection between the outlet channel and the throttle valve. By changing the throttle area of the throttle valve, the load pressure of the pump can be adjusted, as shown in Figure 7.
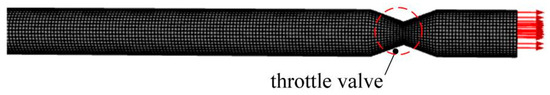
Figure 7.
The throttle valve design of electro-hydraulic pump.
The adjustment law of the throttle valve opening area can be expressed as
In the formula, is outlet flow; is flow coefficient; is outlet pressure; is oil density.
To ensure the computational accuracy of the SST k-ω turbulence model, the dimensionless wall distance (y+) across the computational domain was evaluated. As shown in Figure 8, the y+ values are generally less than 5, and the maximum value does not exceed 6. This range falls well within the recommended limits for the enhanced wall treatment used by the SST k-ω model, thereby ensuring reliable resolution of near-wall flow behavior.
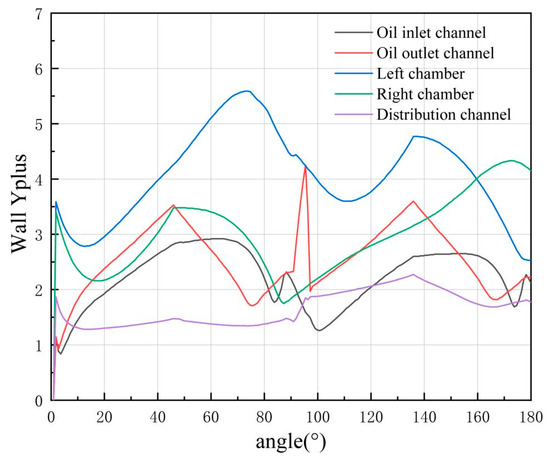
Figure 8.
Y+ curve.
Following grid independence verification and y+ validation, a mesh configuration with 937,572 elements was selected, at which point the gas volume fraction exhibited minimal variation. The final mesh unit sizes of 0.35 mm, with global maximum and minimum sizes of 5.8 mm and 0.5 mm, respectively.
3.2. Boundary Condition
This paper primarily focuses on the cavitation characteristics of the SP2DEHP operating under various working conditions. In the computational simulations, the inlet and outlet of the pump are set as pressure boundary conditions, while the walls are defined as no-slip and impermeable boundary conditions. The hydraulic oil at the inlet is treated as a continuous and incompressible fluid. Specifically, No. 46 hydraulic oil is used in this study, and its parameters are detailed in Table 1.

Table 1.
Oil parameters [19].
Numerical simulations were conducted using the Mixture multiphase flow model, the SST k-ω turbulence model, and the Schnerr–Sauer full cavitation model. The Coupled algorithm was employed to achieve iterative solution of velocity and pressure through separation, with a first-order temporal accuracy. The total simulation duration corresponds to one full rotation of the plunger shaft in the SP2DEHP. The temporal resolution of the plunger’s high-speed reciprocating-rotating motion is directly governed by the time step selection. To determine the optimal value, three different time steps corresponding to rotational increments of 1.8°, 0.9°, and 0.45° per step were evaluated. The resulting outlet flow peaks over one complete cycle are summarized in Table 2.
Table 2.
Time step independence verification.
The data indicate that reducing the time step from 1.8° to 0.9° produces a relative deviation in flow peak of less than 0.5%. Further reduction to 0.45° yields negligible variation (<0.1%), confirming temporal independence. Accordingly, a time step of 0.9° (2.5 × 10⁻⁵ s) was selected to balance computational accuracy and efficiency.
For investigating cavitation behavior under varying suction and load pressures, pressure-inlet and pressure-outlet boundaries were applied at the corresponding ports. The reference conditions were set at 0.3 MPa inlet pressure, 12 MPa load pressure, and 6000 RPM, with the simulation divided into 400 time steps per revolution. Convergence was ensured by requiring all equation residuals to fall below 10−3, which is particularly crucial for adequate resolution of turbulence and interphase mass transfer terms.
3.3. UDF Motion
During operation of the SP2DEHP, the geometry of the plunger chamber continuously changes over time, necessitating the use of a dynamic grid for simulation. The plunger shaft undergoes two distinct types of motion: one is its rotation about the central axis, which is modeled using a sliding grid technique; the other is its axial reciprocating movement constrained by the cam guide, which causes the cylindrical plunger chamber to expand and contract, simulated via dynamic grid technology. A user-defined function (UDF) was employed to define the translational and rotational laws of the plunger shaft, thereby controlling the oil intake and discharge processes.
For the rotational UDF settings of the plunger shaft, it is necessary to define the rotation axis and program the rotational speed. The translational motion follows a pattern of constant acceleration and deceleration. The acceleration for the translational motion is determined using the rotational speed, and the instantaneous velocity is calculated by multiplying the acceleration by the time step. An if-else statement is utilized to define the velocity curve over different time intervals.
The changes in the cylindrical plunger chambers can be simulated using the cylinder deformation option available in the dynamic mesh’s deforming settings. To prevent the occurrence of negative volumes during the simulation, a certain amount of reserved space is provided for the plunger chambers. The reserved chamber is set with a height of 1.5 mm. Consequently, the volume change formula for the left chamber (Va), which is initially the low-pressure chamber, can be expressed as follows:
3.4. Cavitation Distribution Area and Generation Mechanism in Fluid Domain
During the operation of the SP2DEHP, a certain degree of cavitation phenomenon occurs in the fluid domain. Cavitation primarily takes place in the plunger chamber within the oil-suction area of the pump, on the wall surface of the distribution groove, and at the bidirectional triangular damping groove. The maximum local gas volume fraction can reach 90%, with a higher gas volume fraction indicating more severe cavitation at that location.
3.4.1. Cavitation in the Plunger Chamber
The cavitation phenomenon that occurs in the plunger chamber during the oil-suction phase mainly manifests on the circular ring surface adjacent to the distribution groove, as illustrated in Figure 9. When the high-pressure plunger chamber is compressed to its limit point and subsequently connects with the oil-suction flow channel through the distribution groove, a significant increase in gas volume fraction rapidly occurs within the chamber. This is primarily due to the relatively small distribution area; the expansion rate of the chamber significantly exceeds the rate at which the distribution area increases, resulting in insufficient oil entering the rapidly expanding chamber and a consequent rapid decrease in the pressure of the residual oil. When the pressure drops to the air separation pressure, cavitation begins to occur. Furthermore, once the pressure falls below the saturated vapor pressure, cavitation bubbles continuously grow and expand, leading to a rapid increase in gas volume. These cavitation phenomena are predominantly distributed on the circular ring surface near the end connected to the distribution groove. Since the connected distribution groove is still delivering oil into the plunger chamber, the low-pressure area mainly forms in the unconnected part, exhibiting a symmetrical distribution. Subsequently, as the distribution area increases and sufficient oil enters the plunger chamber, the pressure recovers to a level close to that of the oil-suction port and eventually exceeds the air separation pressure by a significant margin. Consequently, the cavitation bubbles gradually collapse, and the gas volume gradually decreases to zero.
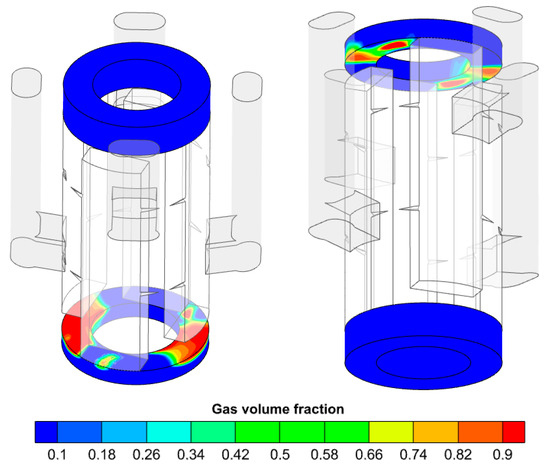
Figure 9.
Cavitation cloud diagram of plunger chambers.
Observe the pressure variations in the left and right plunger chambers as well as the overall pressure pulsation. As can be seen from Figure 10, there are two distinct abrupt change stages in the pressure curve. Stage ① occurs when the high-pressure chamber, which is about to enter the oil-suction phase during the oil-discharge stage, experiences a pressure rise. This is because the distribution groove and the window are almost not in communication, while the volume of the high-pressure chamber continues to decrease. As shown in the figure, the overshoot during this period is extremely large, even doubling the average high pressure. Secondly, in stage ②, during the oil-suction phase, when the pump body rotates to 45°, 135°, 225°, and 315°, the rotational speed reaches its extremes, transitioning from uniform acceleration to uniform deceleration. Due to inertia, the oil continues to accelerate into the chamber, resulting in a slight pressure increase. The overall pressure pulsation is relatively uniform, concentrated at the extreme points and the rotation angles corresponding to operating condition transitions.
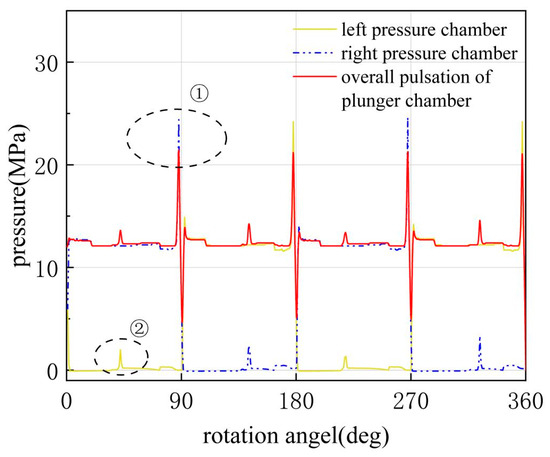
Figure 10.
Plunger chamber pressure curve.
Figure 10 demonstrates that when the pressure within the plunger chamber remains consistently above the air separation pressure, cavitation does not occur in the chamber. However, when a high-pressure plunger chamber transitions to a low-pressure one, there is a significant and abrupt pressure drop, resulting in negative pressure and, consequently, cavitation. Thus, the negative overshoot in the low-pressure stage is the primary cause of cavitation in the plunger chamber.
3.4.2. Cavitation in the Distribution Groove
During the high-speed rotation of the plunger shaft, after the high-pressure plunger completes the oil-discharge process, there remains residual high-pressure oil. The insufficient contact area between the oil-discharge flow channel’s distribution window and the distribution groove leads to the compression of a “trapped” volume. Consequently, even after complete oil discharge, the pressure within the plunger chamber further increases, exhibiting a positive pressure overshoot phenomenon. At this point, once the oil-suction flow channel’s distribution window begins to connect with the distribution groove, the oil pressure at the distribution window aligns with the inlet pressure. However, the oil pressure within the high-pressure plunger chamber, superimposed with the positive overshoot, is significantly higher than the outlet pressure. The substantial pressure difference causes the high-pressure oil to flow back into the distribution groove at an extremely high velocity. As the kinetic energy of the oil rapidly increases, its potential energy sharply decreases. When the low-pressure area on the wall of the distribution groove falls below the saturated vapor pressure, the gas volume fraction rapidly rises.
The primary location of cavitation in the distribution groove is concentrated on the side closer to the shaft center. This is because, during the high-speed rotation of the SP2DEHP, the enormous centrifugal force reduces the local pressure of the oil near the rotational center. Most of the oil is flung towards the outer side, resulting in a significantly lower local pressure on the inner side compared to that on the outer side, as shown in Figure 11.
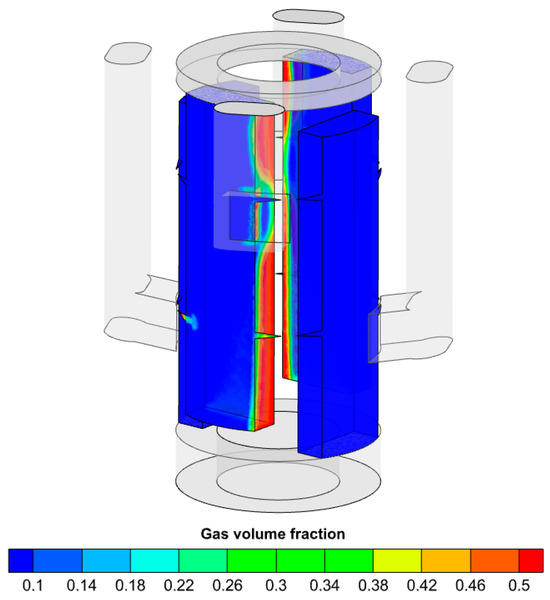
Figure 11.
Cavitation cloud diagram of the distribution groove.
3.4.3. Cavitation in the Triangular Unloading Groove
As shown in Figure 12, cavitation in the triangular unloading groove primarily occurs during the process when the distribution window of the oil outlet channel comes into contact with and separates from the distribution groove, interacting with the triangular unloading groove. In contrast, when the distribution window of the oil inlet channel contacts and separates from the distribution groove, there is no significant cavitation reaction observed in the triangular unloading groove, with the gas volume fraction remaining extremely low. The cavitation is attributed to the fact that, after the low-pressure plunger cavity has just been filled with oil, the distribution groove that connects to it comes into contact with the oil outlet channel. Under the influence of a substantial pressure difference, the oil in the oil outlet channel also experiences high-speed jet flow, entering the high-pressure plunger cavity from the oil outlet channel. This sudden drop in pressure potential energy leads to severe cavitation reactions at the location of the unloading groove.
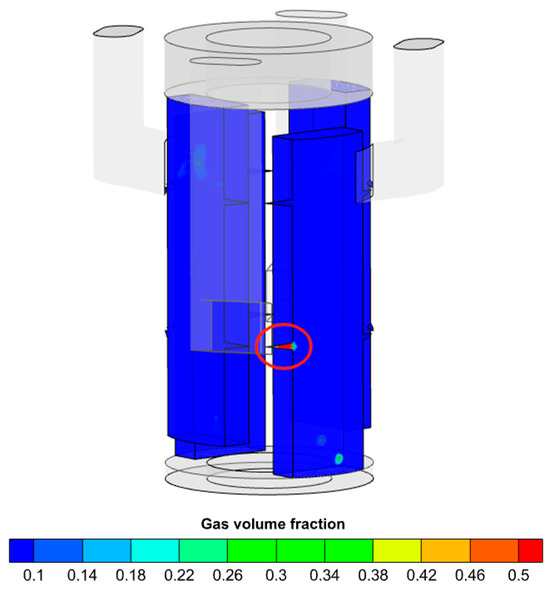
Figure 12.
Cavitation cloud diagram of the unloading groove.
4. Operating Parameters
4.1. Suction Pressure Influence
Three operating conditions with suction pressures of 0.1 MPa, 0.3 MPa and 0.6 MPa were selected to investigate the impact of oil-suction pressure on the cavitation characteristics of the SP2DEHP. The gas volume fractions within the oil-suction and oil-discharge chambers under different oil-suction pressures were obtained, as detailed in Figure 13 below.
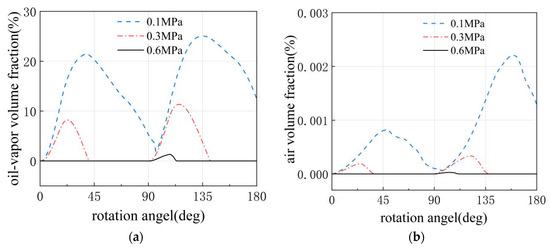
Figure 13.
Gas volume fraction of plunger chambers under three different inlet pressures: (a) vapor cavitation, (b) air cavitation.
Under different inlet pressure boundary conditions, a certain degree of cavitation erosion phenomenon occurs in the low-pressure chambers of the electro-hydraulic pump during oil suction. When oil is suctioned at a normal pressure of 0.1 MPa, cavitation pervades the entire working process of the chamber. The main increases in gas volume fraction occur at rotation angles of 0°, 90°, 180°, and 270°. Due to the numerous cavitation zones and the prolonged low-pressure periods, the peaks are higher and the reductions are slow, resulting in the continuous presence of dissociated gas throughout the oil-suction and oil-discharge chambers.
When the oil-suction pressure is increased to 0.3 MPa, the gas volume fraction rapidly rises to a certain level at the aforementioned four points and then abruptly drops to zero. Finally, when the oil-suction port is set to 0.6 MPa, the cavitation degree near 0–90° and 180–270° is minimal, with the gas volume fraction being small or even close to zero. Cavitation only begins to occur and quickly disappears during the chamber condition switching process when the rotation angle reaches 90° and 270°. During a complete rotation of the pump body, both the left and right plunger chambers undergo two oil-suction and oil-discharge cycles. Cavitation erosion occurs instantaneously when the high-pressure chambers of the left and right plungers transition to low-pressure chambers for oil suction. There are significant differences in the peak gas volume fractions generated during cavitation in the left and right chambers, with the peaks at 0° and 180° being lower than those at 90° and 270°. This is primarily because when the distribution window connects to the distribution groove corresponding to the left chamber, it is closer to the plunger chamber port, and the expansion dead volume caused by the insufficient distribution area is relatively small during the distribution process, resulting in a smaller peak gas volume fraction. Conversely, the position where the distribution groove corresponding to the right chamber connects is farther from the plunger chamber port, and the expansion dead volume caused by the insufficient distribution area is relatively large, leading to a larger peak gas volume fraction.
Figure 13 also reveals that the proportion of oil vapor gas volume fraction in the SP2DEHP is significantly higher than that of air gas volume fraction. This is mainly because the air content in the hydraulic oil is low, which is set at only 6.25%. During the conversion between high- and low-pressure chambers, the negative pressure overshoot value is too low, resulting in severe cavitation. After reaching the air separation pressure, the air in the oil has completely dissociated, with a relatively small amount. As the pressure continues to drop to the saturated vapor pressure, a large amount of oil vapor dissociates and persists for a long time, causing the gas volume fraction of the oil vapor product to be higher despite the lower saturated vapor pressure value.
As the inlet pressure increases, the gas volume fraction dissociated from the oil-suction and oil-discharge chambers gradually decreases. This is because with an increase in inlet pressure, the base pressure in the oil-suction chamber is higher, reducing the area where the pressure drops sharply to the saturated vapor pressure and air separation pressure due to the expansion of the dead volume, thereby decreasing the gas volume fraction dissociated by cavitation. The data proves that increasing the oil-suction pressure can effectively suppress cavitation during the long-term operation of the SP2DEHP.
Although the triangular unloading grooves are located on the edge of the distribution grooves, cavitation in the unloading groove lasts longer and is more pronounced, necessitating a separate discussion from the distribution groove. Figure 14 shows that as the suction pressure increases, the gas volume fraction at the triangular unloading groove position decreases at the same moment. However, the weakening effect on cavitation erosion is limited, with the peak gas volume fraction remaining at a relatively high level.
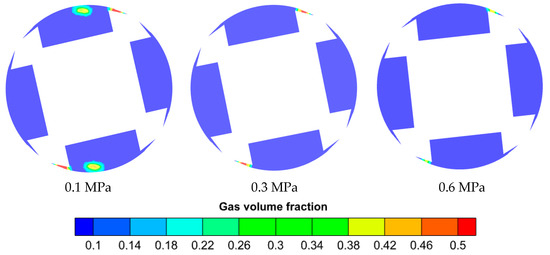
Figure 14.
Cavitation clouds in unloading groove under three suction pressures.
4.2. Load Pressure Influence
In the practical application of the SP2DEHP, adjustments to the pump’s load pressure are made in response to external environmental conditions and actual demands to meet external requirements. Since the primary method for increasing load pressure involves reducing the diameter of the oil-outlet flow channel, and as indicated in the pressure curve in Figure 10, the average pressure in the left and right chambers remains at 12 MPa when they transition to high pressure, with pulsations not exceeding 15 MPa, the effect of reducing the channel diameter on pressure elevation is quite limited. Therefore, three operating conditions with load pressures of 12 MPa, 14 MPa and 16 MPa were selected to investigate the impact of load pressure on the cavitation characteristics of the SP2DEHP, resulting in graphs of the gas volume fraction in the oil-suction and oil-discharge chambers under different load pressures.
Within the set range of 12–16 MPa, it can be observed from Figure 15 that when the load pressure is increased from 12 MPa to 14 MPa, the impact of load pressure variation on cavitation within the plunger chambers is not significant, with the peak gas volume fraction reaching a maximum of 11%. However, when the load pressure is further increased to 16 MPa, the oil-vapor volume fraction experiences a substantial decline, with values dropping by 6%. In contrast, the trend of air volume fraction remains unaffected by changes in load pressure. This is primarily because, under low-pressure conditions in the plunger chambers, air has already been fully expelled, and its average calculated value is small enough to be considered negligible.
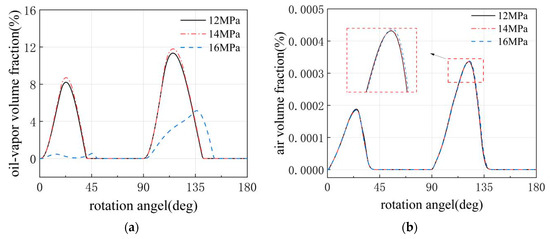
Figure 15.
Gas volume fraction of plunger chambers under three outlet pressures: (a) vapor cavitation, (b) air cavitation.
4.3. Rotational Speed Influence
To analyze the impact of rotational speed conditions on the cavitation characteristics of the SP2DEHP, simulation analyses were conducted under three operating conditions with rotational speeds of 4000 r/min, 6000 r/min, and 8000 r/min. Figure 16 illustrates the gas volume fraction within the oil-suction plunger chambers at different rotational speeds. As the rotational speed increases, cavitation in the SP2DEHP not only occurs instantaneously during chamber condition switching but also develops to be present throughout almost the entire working process of the chambers, with more severe cavitation and higher gas volume fractions. The primary reason is that as the rotational speed increases, the axial reciprocating motion speed of the plunger shaft accelerates, leading to a further increase in the volume change rate of the oil-suction and oil-discharge plunger chambers. The oil suction volume of the inlet flow channel cannot meet the volume change requirements of the oil-suction chambers, resulting in an enlarged dead volume, a sudden pressure drop, and an increase in cavitation severity and gas volume fraction. Secondly, an increase in rotational speed leads to a corresponding increase in the flow velocity of the hydraulic oil within the pump body. As the kinetic energy rapidly increases, the pressure potential energy sharply decreases, making it easier for low-pressure cavitation zones to form within the chambers and increasing the gas volume fraction.
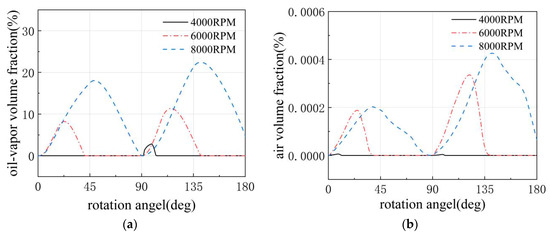
Figure 16.
Gas volume fraction of plunger pump cavities under three rotational speeds: (a) vapor cavitation, (b) air cavitation.
As shown in Figure 16, at 4000 RPM, there is hardly any noticeable cavitation throughout the entire process, with a relatively low overall gas volume fraction. Only the oil-vapor volume fraction shows slight fluctuations, while the air volume fraction remains essentially zero. When the rotational speed is increased to 6000 RPM, distinct cavitation zones emerge, primarily occurring during the high-to-low pressure switching moments in the chambers, with vapor cavitation becoming increasingly pronounced. At this point, the air volume fraction experiences a slight increase but does not exceed 1%. When the rotational speed reaches 8000 RPM, cavitation becomes even more severe, with overlapping cavitation zones causing a rapid rise in the gas volume fraction that is difficult to reduce and persists for a longer duration, occupying almost the entire working cycle of the chambers. At this speed, the air volume fraction shows an increase compared to the previous two rotational speeds. The main reason is that at 4000 RPM and 6000 RPM, although all the air in the oil is dissociated and sparsely distributed within the plunger chambers, quickly disappearing, the extracted average value is small and not noticeable in the graph. However, once the rotational speed is increased to 8000 RPM, the air remains dissociated for a longer period, leading to an increase in its value. Meanwhile, the oil-vapor volume fraction generated by vapor cavitation continuously rises with the increase in rotational speed due to the proliferation of low-pressure zones. This demonstrates that during the long-term operation of the SP2DEHP, the cavitation severity within the pump body increases with the rotational speed.
However, in the iterative development process of the pump, the demand for rotational speed has been consistently rising, necessitating an understanding of the locations and development processes of cavitation bubbles after speed increases. Within a quarter of a cycle, four representative angles are selected based on the operating condition switching process to investigate the distribution of gas volume fraction within the pump at different rotational speeds. The final results are shown in Figure 17. At a rotational speed of 4000 RPM, which is relatively low, the gas volume fraction inside the electro-hydraulic pump is comparatively low, with the primary cavitation locations occurring in the low-pressure chambers, as well as near the triangular unloading groove and the adjacent distribution groove windows, with low numerical values. When the rotational speed is increased to 6000 RPM, the cavitation severity intensifies, with more pronounced cavitation between the plunger chambers and the triangular unloading groove, and higher numerical values. At a rotation angle of Φ = 52.2°, when the distribution groove window for the oil-discharge flow channel is about to completely separate from the distribution groove, the maximum gas volume fraction is distributed in the regions directly in contact with the distribution surface and inside the triangular unloading groove, reaching as high as 50%. When the rotational speed reaches 8000 RPM, the oil-suction chamber of the electro-hydraulic pump experiences insufficient oil suction, and the cavitation severity further increases. At rotation angles Φ = 19.8° and Φ = 32.4°, cavitation locations also emerge on the centripetal side of the distribution groove and at positions far from the plunger chambers. Observing the four representative angles at different rotational speeds reveals that within the entire electro-hydraulic pump, the scope and severity of cavitation continuously increase with the rotational speed.
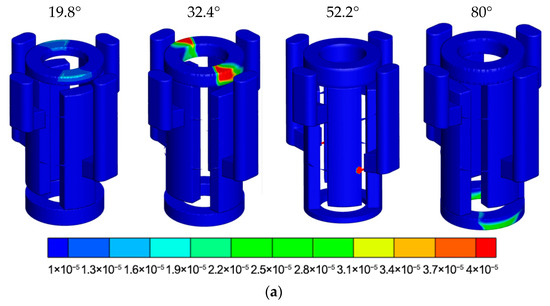
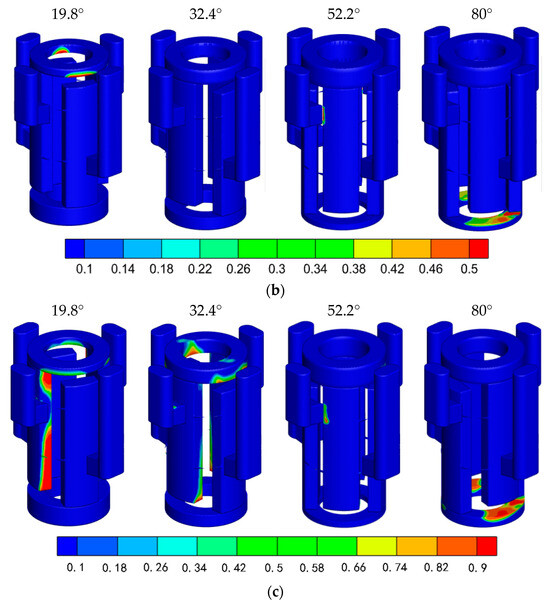
Figure 17.
Gas volume fraction diagram during the switching of chamber operating conditions under three rotational speeds: (a) 4000 RPM, (b) 6000 RPM, (c) 8000 RPM.
To verify the development process of cavitation bubbles, 11 gas volume fraction isosurfaces were set up to observe their changes with the rotation angle under different rotational speeds. The final results are shown in Figure 18.
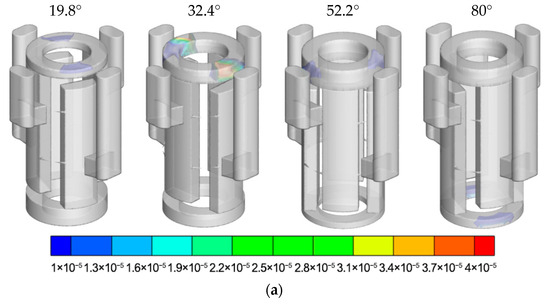
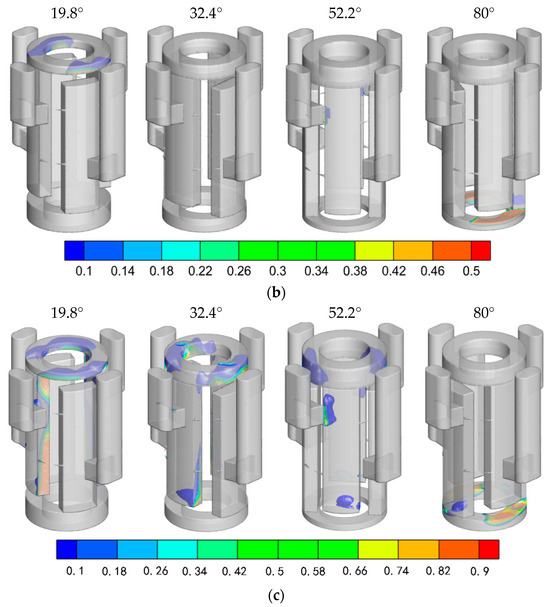
Figure 18.
Evolution of gas volume fraction contour surfaces during the switching of chamber operating conditions under three rotational speeds: (a) 4000 RPM, (b) 6000 RPM, (c) 8000 RPM.
Under the operating condition of 4000 RPM, cavitation bubbles primarily appear in the low-pressure chamber and the triangular unloading groove. During the process from 0° to 90°, gas volume fraction is generated at the corresponding positions only when the distribution window connects to the triangular unloading groove. Once the distribution window is connected to the distribution groove, the bubbles in the triangular unloading groove quickly disappear. In other fluid domain areas where the pressure does not fall below the air separation pressure, no cavitation bubbles are generated.
Under the operating condition of 6000 RPM, cavitation bubbles are generated in the suction chamber from Φ = 19.8° to 32.4°, with the gas volume fraction increasing as the distance from the distribution groove increases. Due to the increased development speed of the bubbles, they rapidly form and disappear during the expansion process in the suction chamber. At Φ = 52.2°, when the distribution window is about to leave the distribution groove and only contacts the triangular unloading groove, certain cavitation bubbles are generated around the distribution area and within the distribution groove, which quickly disappear as the distribution area approaches zero. At Φ = 80°, after the chamber operating conditions are successfully switched, the pressure drops sharply, and bubbles are regenerated in the low-pressure suction chamber.
Under the operating condition of 8000 RPM, at Φ = 19.8°, due to severe insufficient oil suction in the suction chamber, the speed of bubble generation further increases, and the bubbles fill the entire chamber and the near-center side of the connected distribution groove. At Φ = 32.4°, the bubbles within the chamber continue to develop. As the distribution area increases, the pressure in the distribution groove rises to a certain extent, and the bubbles only accumulate on the near-center side of the end far from the plunger chamber. At Φ = 52.2°, bubbles still exist in the chamber and the distribution groove, but they enter a stage of collapse and reduction, primarily concentrated around the distribution contact area. Until Φ = 80°, after the switch, cavitation bubbles begin to develop in the distribution groove and the suction chamber, entering a new oil suction and discharge stage.
4.4. Simulated Volumetric Efficiency
For three different sets of operating conditions, the output flow rates of the SP2DEHP were recorded. By calculating the ratio of the simulated flow rate to the theoretical flow rate, the volumetric efficiencies under different operating conditions were obtained. To investigate the variation in volumetric efficiency with rotational speed under different suction pressures, corresponding volumetric efficiency curves were plotted as shown in Figure 19. It can be observed that when the suction pressure is relatively high and the rotational speed is low, the variation in simulated volumetric efficiency is minimal; however, once the rotational speed is high, the volumetric efficiency rapidly decreases, resulting in a significant difference. When the suction pressure is 0.6 MPa and 0.3 MPa, from 4000 RPM to 6000 RPM, the volumetric efficiency changes little, but it drops rapidly at 8000 RPM. When the suction pressure is 0.1 MPa, the volumetric efficiency starts to decline rapidly at 6000 RPM. This indicates that after setting a specific suction pressure for the pump, there exists a corresponding cavitation-free critical rotational speed. It can be concluded that a specific inlet pressure defines a critical speed threshold for cavitation. Beyond this threshold, cavitation occurs, accompanied by flow reversal that diminishes the pump’s output flow.
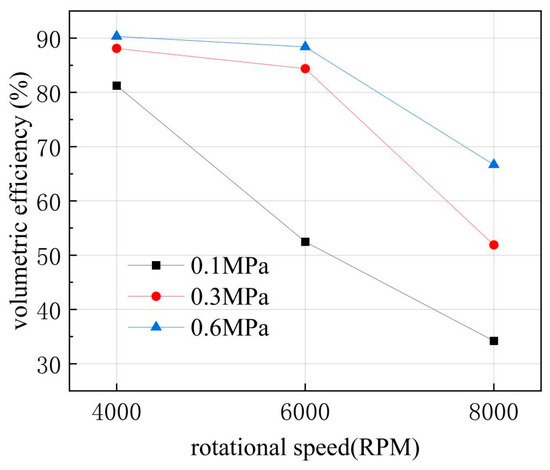
Figure 19.
Comparison of volumetric efficiency with rotational speed under three different inlet pressures.
The volumetric efficiency versus speed characteristics under different load pressures are presented in Figure 20. A clear trend of decreasing volumetric efficiency with rising load pressure is observed. This deterioration is attributed to the fact that load pressure sets the internal working pressure. When the load surpasses the rated pressure, further increases significantly aggravate internal leakage, which is the primary cause of the reduced output flow.
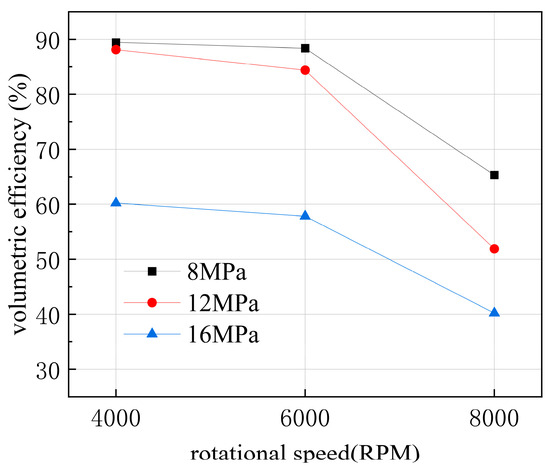
Figure 20.
Comparison of volumetric efficiency with rotational speed under three different load pressures.
5. Conclusions and Prospects
Based on the structure and flow distribution method of the SP2DEHP, the cavitation characteristics and type distribution within the fluid domain were analyzed, and the influence laws of three different operating conditions on cavitation were studied. The conclusions are as follows:
- (1)
- Calculations show that normal pump operation can be ensured when the set suction pressure is greater than the critical value. Additionally, for any given suction pressure, there is a corresponding critical rotational speed. Once the suction pressure falls below the critical value or the rotational speed exceeds the corresponding critical speed, significant cavitation will occur, which will affect the output flow and reduce the volumetric efficiency.
- (2)
- According to the simulation results, cavitation primarily occurs in the plunger chamber, on the wall surface of the distribution groove, and within the triangular unloading groove. Moreover, both pressure and rotational speed variations have an impact on cavitation.
- (3)
- As the suction pressure increases, the cavitation effect inside the plunger chamber weakens. When the suction pressure is too low, phenomena such as air suction and backflow are prone to occur within the plunger chamber.
- (4)
- When the load pressure increases from 12 MPa to 14 MPa, the enhancement effect on cavitation in the plunger chamber is not significant. However, when the load pressure increases to 16 MPa, the cavitation effect weakens to some extent.
- (5)
- An increase in the rotational speed of the plunger shaft leads to corresponding increases in the flow velocity and pressure within the fluid domain, which also intensifies cavitation in the three component parts. The main type of cavitation is vapor cavitation. At a low rotational speed of 4000 RPM, cavitation mainly occurs during flow distribution in the triangular unloading groove. When the rotational speed is increased to 6000 RPM, cavitation develops into the plunger chamber, rapidly forming and persisting for a period before disappearing, with the gas volume fraction rising to four times its original value. If the rotational speed is further increased to 8000 RPM, the gas volume fraction continues to rise, filling the interior of the plunger chamber during the working operation stage and extending into the distribution groove, resulting in more severe cavitation erosion.
To establish a comprehensive validation framework for cavitation analysis, future work will follow a dual approach combining experimental and numerical advancements. For experimental validation, we will develop transparent prototypes of critical flow components integrated with high-speed imaging systems. This will enable direct visualization of cavitation development in plunger chambers and distribution grooves. Particle image velocimetry (PIV) measurements will provide transient flow data for spatial-temporal correlation with simulation results. On the numerical modeling side, we will implement a thermodynamic cavitation model that incorporates phase-change latent heat effects. By activating the energy equation, the refined model can accurately capture localized temperature variations and their influence on saturation vapor pressure during cavitation processes.
This integrated methodology will not only provide essential validation for current simulations but also extend modeling capabilities to thermal-fluid-phase change interactions, establishing a more reliable foundation for developing high-power-density electro-hydraulic pumps with improved performance characteristics.
Author Contributions
Conceptualization, X.Q. and J.W.; Methodology, J.W. and H.L.; Software, J.W.; Validation, X.Q., J.W. and H.L.; Formal analysis, J.W.; Investigation, J.W.; Resources, X.Q. and J.W.; Data curation, J.W.; Writing—original draft preparation, J.W.; Writing—review and editing, X.Q., J.W. and H.L.; Visualization, J.W.; Supervision, X.Q.; Project administration, J.W. and H.L.; Funding acquisition, X.Q. All authors have read and agreed to the published version of the manuscript.
Funding
This research was funded by [Zhejiang Basic Public Welfare Research Project] grant number [LGG22E050032] And The APC was funded by [Xinguo Qiu].
Data Availability Statement
Data are contained within the article.
Conflicts of Interest
The authors declare no conflicts of interest.
Nomenclature
| Parameter | Sign |
| Displacement of plunger shaft | |
| Maximum displacement of plunger shaft | |
| Speed | |
| Acceleration | |
| Rotational speed | |
| Time | |
| Density of gas–liquid two-phase flow | |
| Average velocity of gas–liquid two-phase flow | |
| Volume fraction of the k-th phase | |
| Pressure | |
| Number of phases | |
| External forces acting on fluids | |
| Viscosity of the mixture | |
| Drift velocity of k-th phase | |
| Effective thermal conductivity | |
| Heat contribution of all other volumetric heat sources | |
| Turbulent thermal conductivity coefficient | |
| The total energy | |
| Specific enthalpy of the k-th phase | |
| Bubble radius | |
| Internal pressure of bubbles | |
| Hydraulic oil pressure away from bubbles | |
| Surface tension at gas–liquid two-phase interface | |
| Gas pressure | |
| Amount of substance of gas | |
| Ideal gas constant | |
| Gas thermodynamic temperature | |
| Amount of substance of the current gas | |
| Original radius of the bubble | |
| Original pressure of the bubble | |
| Original amount of substance of the gas | |
| Current gas content | |
| Original gas content | |
| Current gas volume | |
| Original gas volume | |
| Evaporation coefficient | |
| Condensation heat transfer coefficient | |
| Volume fraction of nucleation sites | |
| Cavitation number | |
| Average axial velocity of the plunger | |
| Reynolds number | |
| Oil dynamic viscosity | |
| Diameter of the plunger | |
| Turbulent kinetic energy | |
| Production term of turbulent kinetic energy | |
| Oil pressure at the oil inlet | |
| Oil pressure at the distribution window | |
| Kinetic energy correction factor | , , |
| Flow velocity of the oil as it enters the inlet channel | |
| Flow velocity of the oil as it enters the distribution window | |
| Energy loss in the oil inlet channel | |
| Frictional pressure loss coefficient | |
| Oil inlet channel length | |
| Oil inlet channel diameter | |
| Local drag coefficient | |
| Oil pressure in the plunger cavity | |
| Flow velocity of the oil as it enters the plunger cavity | |
| Energy loss in the distribution window area and distribution groove | |
| Proportional coefficient | |
| Revised proportional coefficient | |
| Throttle valve opening area | |
| Outlet flow | |
| Flow coefficient | |
| Outlet pressure |
Abbreviations
The following abbreviations are used in this manuscript: SP2DEHP, which is a single-plunger two-dimensional electro-hydraulic pump.
Appendix A. Theoretical and Model Deduction Details
Appendix A.1. Dynamics of Cavitation Bubbles and Gas Content
Cavitation refers to the process of formation, growth, and subsequent collapse of air or vapor bubbles within hydraulic oil due to locally low pressure during the contraction and expansion of a plunger cavity. The size of cavitation bubbles is influenced by the phase change between gas and liquid. As the hydraulic oil pressure decreases, the solubility and diffusion capacity of gases diminish, leading to the continuous exsolution of gases and an increase in their content, which in turn causes the bubble radius to grow.
Assuming that the cavitation bubbles formed in the pump under steady-state conditions are circular, and that the molar mass of the gas within the bubbles remains constant, while disregarding any mass exchange occurring at the gas–liquid interface, the force balance on the bubble can be described by an equilibrium equation for the internal and external pressures, as shown below:
In the formula, is bubble radius; is internal pressure of bubbles; is hydraulic oil pressure away from bubbles; is surface tension at gas–liquid two-phase interface.
Assuming that cavitation generates bubbles that satisfy the ideal gas state equation, the formula is:
In the formula, is gas pressure; is amount of substance of gas; is ideal gas constant; is gas thermodynamic temperature.
Incorporating the pressure equilibrium condition and the volume formula for a spherical bubble into the ideal gas state equation, and after rearranging the terms, we can obtain the following result:
is amount of substance of the current gas.
By applying Cardano’s formula for solving the relevant equations, and under the dominance of external pressure, the steady-state radius of the bubble can be determined as follows:
Moreover, considering that the initial state of the bubble still adheres to the ideal gas state equation, and in order to incorporate the formula for gas content variation, a corrected formula for the bubble radius can be derived as follows:
In the formula, is original radius of the bubble; is original pressure of the bubble; is original amount of substance of the gas.
The gas content in hydraulic oil refers to the volume fraction of gas dissolved in the liquid. If hydraulic oil is regarded as an incompressible fluid, its volume will not change. The gas content can be expressed as:
In the formula, is current gas content; is original gas content; is current gas volume; is original gas volume.
Substituting Equation (A5) into Equation (A6), equation is as follows:
Appendix A.2. Calculation of Cavitation Number and Reynolds Number
The cavitation number is also a core indicator for evaluating cavitation tendency, representing the relative relationship between local pressure and saturated vapor pressure, and is a key dimensionless number for predicting cavitation occurrence. The formula is as follows:
is average axial velocity of the plunger.
Before selecting, it is necessary to determine the flow state and use the Reynolds number to represent the ratio of fluid inertia force to viscous force. The formula is as follows:
In the formula, is oil dynamic viscosity; is diameter of the plunger.
Given the computed Reynolds number of 4347—which exceeds the turbulent transition threshold of 4000—the flow is confirmed as turbulent. To address the complex flow features in the SP2DEHP, including strong rotation, flow separation, and high wall curvature, the SST k-ω model was adopted.The empirical coefficient values for the turbulence model are shown in the Table A1 below.
Table A1.
Empirical constants of turbulence model.
Table A1.
Empirical constants of turbulence model.
| Parameter | Numeric Value |
|---|---|
| 0.55 | |
| 0.075 | |
| 0.09 | |
| 1 | |
| 2 | |
| 0.31 |
Appendix A.3. Critical Oil Suction Pressure Without Cavitation
In an open-loop hydraulic system, to prevent cavitation within the pump, the pressure at the oil inlet of the pump must be sufficiently high to overcome frictional losses, local losses and acceleration losses in the suction line and the flow channel of an SP2DEHP. This ensures that the oil pressure entering the plunger cavity remains above its saturated vapor pressure. Based on the Bernoulli equation, the energy conservation relationship between the suction port and the valve port of the SP2DEHP can be derived as follows:
In the formula, is oil pressure at the oil inlet; is oil pressure at the distribution window; , are kinetic energy correction factor; is flow velocity of the oil as it enters the inlet channel; is flow velocity of the oil as it enters the distribution window; is energy loss in the oil inlet channel.
Due to the viscosity of hydraulic oil, energy is dissipated during its flow into the pump, resulting in energy loss (denoted as ). This energy loss can be further categorized into frictional pressure loss () and local pressure loss (). Frictional pressure loss occurs when oil flows through a pipe of constant diameter, arising from viscous friction between the fluid and the pipe wall. In the oil inlet channel, the frictional pressure loss can be expressed as:
In the formula, is frictional pressure loss coefficient for oil flow in a pipe is given by under laminar flow conditions, is the Reynolds number; is oil inlet channel length; is oil inlet channel diameter.
The difference in local pressure loss lies in the fact that there is a sharp change in the cross-section of the pipeline, which generates vortex during the flow of oil, leading to an increase in the frictional force of the flow. The local pressure loss in the area where the oil inlet channel is connected to the distribution window can be expressed as
is local drag coefficient.
The energy conservation equation governing the flow from the valve port to the plunger cavity inlet in the SP2DEHP can be expressed as
In the formula, is oil pressure in the plunger cavity; is flow velocity of the oil as it enters the plunger cavity; is kinetic energy correction factor; is energy loss in the distribution window area and distribution groove.
Combine Equation (A10) and Equation (A13), which can be expressed as
The design requirement stipulates that cavitation must not occur in any part of the pump, particularly in critical regions where the pressure in the plunger cavity undergoes abrupt changes. To meet this requirement, the oil pressure must exceed the saturated vapor pressure of the oil, which is . Therefore, based on Equation (A14), the minimum oil suction pressure required to ensure cavitation-free operation during the oil absorbing must satisfy the following condition:
Appendix A.4. Critical Rotational Speed for Cavitation-Free Operation
Under the premise of ensuring the minimum oil suction pressure for cavitation-free operation, as the SP2DEHP undergoes iterative design improvements and the pump rotational speed driven by the motor continues to increase, the oil flow rate rises significantly. However, this also elevates the risk of insufficient oil supply, potentially rendering the anti-cavitation minimum oil suction pressure derived from traditional theoretical analyses inadequate for practical requirements. Subsequent investigations explore the relationship between oil suction pressure and pump rotational speed under varying operating conditions to ultimately determine the cavitation-critical rotational speed of the pump at a given oil suction pressure.
The energy losses calculated via Equations (A11) and (A12) are proportional to the square of the flow velocity (and thus the square of the angular velocity). Consequently, the simplified expressions for pressure losses across various regions within the pump fluid domain can be represented as
are proportional coefficients.
Similarly, Equation (A16) can be rewritten to correct the proportional coefficient and expressed as
are revised proportional coefficients.
However, since the correlation coefficients for pressure losses cannot be determined using conventional analytical formulas, the corresponding parameters (denoted as ) must be obtained through simulation or experimental measurements. To introduce the concept of rotational speed, substituting equation and Equation (A17) into Equation (A15):
After rewriting the above equation, it can be concluded that under a constant suction pressure, the maximum speed limit is
According to Equation (A19), the rotational speed is positively correlated with the oil suction pressure. During the pump iteration process, while increasing the rotational speed, the oil suction pressure must also be increased to ensure the normal operation of the pump body.
References
- Wan, Z.; Zhang, P.Z.; Liu, Y.Z.; Liu, S.Q. Experimental Study on the Influence of Rotational Speed on Cavitation Inside a Seawater Pump. Hydraul. Pneum. Seals 2021, 41, 16–20. [Google Scholar]
- Li, Y.; Xu, L.Y.; Wang, F.; Li, S.; Ma, J.W.; Yang, Y.S. Influence of Suction Pressure on Cavitation Characteristics in High-Speed Axial Piston Pumps. Chin. Hydraul. Pneum. Chin Hydrau Pneum. 2025, 49, 50–60. [Google Scholar]
- Zhang, J.C.; Wang, J.L.; Tang, H.S.; Ren, Y.; Zhao, Y.S. Unsteady Cavitation-Induced Flow Vibration Characteristics in Axial Piston Pumps. Chin. Hydraul. Pneum. Chin. Hydrau. Pneum. 2024, 48, 64–73. [Google Scholar]
- Gold, S.; Helduser, S.; Wusmann, W. Experimental and Numerical Investigations of Suction Permanee of Pumps. In Proceedings of the 6th International Fluid Power Conference, Dresden, Germany, 1–2 April 2008; pp. 156–161. [Google Scholar]
- Meincke, O.; Rahmfeld, R. Measurements, Analysis and Simulation of Cavitation in an Axial Piston Pump. In Proceedings of the 6th International Fluid Power Conference, Dresden, Germany, 1–2 April 2008; pp. 485–499. [Google Scholar]
- Opitz, K.; Schlücker, E. Detection of Cavitation Phenomena in Reciprocating Pumps using a High-Speed Camera. Chem. Eng. Technol. 2010, 33, 1610–1614. [Google Scholar] [CrossRef]
- Kim, S. Measurement of Effective Bulk Modulus and Its Use in CFD Simulation; Shaker: Aachen, Germany, 2012. [Google Scholar]
- Schleihs, C.; Viennet, E.; Deeken, M.; Ding, H.; Xia, Y.; Lowry, S.; Murrenhoff, H. 3D-CFD simmulation of an axial piston displacement unit. In Proceedings of the 9th International Fluid Power Conference, Aachen, Germany, 24–26 March 2014; pp. 332–343. [Google Scholar]
- Ye, S.G.; Zhang, J.H.; Xu, B.; Song, W.; Chen, L.; Shi, H. Experimental and numerical studies on erosion damage in damping holes on the valve plate of an axial piston pump. J. Mech. Sci. Technol. 2017, 31, 4285–4295. [Google Scholar] [CrossRef]
- Hutli, E.; Nedeljkovic, M.; Bonyar, A. Cavitating flow characteristics, cavity potential and kinetic energy, void fraction and geometrical parameters—Analytical and theoretical study validated by experimental investigations. Int. J. Heat Mass Transf. 2018, 117, 873–886. [Google Scholar] [CrossRef]
- Tsukiji, T.; Chen, Z.; Chen, J.J.; Wang, T. Visualization Analysis of Internal Cavitation Flow in Axial Piston Pumps. Chin. Hydraul. Pneum. Chin Hydrau Pneum. 2015, 1–7. [Google Scholar] [CrossRef]
- Chao, Q.; Zhang, J.H.; Xu, B.; Huang, H.; Zhai, J. Effects of inclined cylinder ports on gaseous cavitation of high-speed electro-hydrostatic actuator pumps: A numerical study. Eng. Appl. Comput. Fluid Mech. 2019, 13, 245–253. [Google Scholar] [CrossRef]
- Guo, W.W. Study on the Characteristics of Submerged Cavitation Jet in Axial Piston Pumps. Master’s Thesis, Taiyuan University of Technology, Taiyuan, China, 2021. [Google Scholar]
- Sun, Z.G.; Zhong, H.M.; Li, T. Research on structural improvement of anti-cavitation triangle throttle grooves in valve plate. Mach. Des. Manuf. 2021, 67–70. [Google Scholar] [CrossRef]
- Zhang, J.; Zhao, Q.W.; Zhang, H.; Nie, S.Q. Optimization of valve plate in piston pump based on pre-suction and pre-discharge oil structure. Chin. Hydraul. Pneum. Chin Hydrau Pneum. 2021, 48, 24–32. [Google Scholar]
- Han, G.Z. Research on the Comprehensive Volumetric Efficiency of Improved Double Arc Gear Pump Considering Cavitation Effect. Ph.D. Thesis, Hefei University of Technology, Hefei, China, 2025. [Google Scholar]
- Zhang, R.J.; Chen, L.Y.; Ceng, Y. Numerical simulation of cavitation flow characteristics of centrifugal pump impeller under high flow conditions. J. Hydroelectr. Eng. 2025, 44, 10–21. [Google Scholar]
- Jin, D.C.; Ruan, J. Design and research of two-dimensional fuel pump. Acta Aeronaut. ET Astronaut. Sin. 2019, 40, 318–327. [Google Scholar]
- Chen, K.G. Research on Flow Field Characteristics of Two-Dimensional Plunger-Type Electro-Hydraulic Pump Based on Fluid-Structure Interaction. Master’s Thesis, Zhejiang University of Technology, Hangzhou, China, 2024. [Google Scholar]


Disclaimer/Publisher’s Note: The statements, opinions and data contained in all publications are solely those of the individual author(s) and contributor(s) and not of MDPI and/or the editor(s). MDPI and/or the editor(s) disclaim responsibility for any injury to people or property resulting from any ideas, methods, instructions or products referred to in the content. |
© 2025 by the authors. Licensee MDPI, Basel, Switzerland. This article is an open access article distributed under the terms and conditions of the Creative Commons Attribution (CC BY) license (https://creativecommons.org/licenses/by/4.0/).