Abstract
This paper deals with solid lubricants for the wheel–rail interface; the topic is viewed from two different but complementary perspectives. By means of simulations, the potential contribution of these lubricants, applied for purposes of wheel flange lubrication on curved tracks, to the reduction in the wheel–rail wear level is estimated. Further, the relationship between frictional work in wheel–rail contact and guiding forces is investigated. The aim of this paper is to contribute to the knowledge of a physical basis for this relationship and to help understand the capability of these quantities to quantify the damaging effects of running vehicles on curved tracks. The mechanism of the observed increase in quasi-static guiding force on the leading wheel with lubricated wheel flanges is described in detail, using different quantities characterizing the steady running of a vehicle through a curve. The limitation of the contribution of wheel flange lubrication to the reduction in total frictional power on all wheels of the vehicle is also explained. In the second part, attention is paid to a practical assessment of the performance of solid lubricant samples using the testing methodology of the European standards EN 15427-2-1 and EN 16028. The aim of this part of the paper is to summarize the authors’ experience with twin-disc machine measurements, showing imperfections in the standardized testing methodology, as well as the significantly different performance of various solid lubricant samples, which is influenced by many factors. Based on their experience, further research on solid lubricant performance using wheel–rail roller rigs is outlined.
1. Introduction
Rail transport is an efficient mode of transport in urban transport networks, regional services, and long-distance routes; it has significant potential to reduce the negative environmental impacts of transport. To allow for the maximum utilization of the advantages of rail transport, it must be safe, comfortable, and economical. All these properties are connected with the conditions of the wheel–rail interaction.
The present research is focused on the aspects of the wheel–rail interaction that are described by the coefficient of friction (CoF) according to the Coulomb friction law, i.e., the ratio of the maximum possible tangential force magnitude to the normal load. A high CoF means that high tangential forces can act at the wheel–rail interface, allowing for high tractive or braking effort but also increasing the damage to the wheels and rails.
The frictional conditions at the wheel–rail interface are variable: as an open tribological system, it is influenced by environmental factors such as the presence of water or organic materials, natural or artificial contaminants, etc. [1,2,3,4]. There have always been efforts to control the frictional conditions, such as applying sand in the case of traction or braking problems. Nowadays, a wide range of tools is used to modify the interface conditions, collectively referred to as friction management [1,5].
The materials applied to the wheel or rail can be generally named friction modifiers (FMs) and include the following:
- Low-coefficient-of-friction (LCF) materials—lubricants that reduce the CoF at the wheel flange and gauge face (see Figure 1a), reducing the damage to the wheel and rail [6,7,8,9,10].
 Figure 1. (a) Wheel and rail profiles and their regions; (b) schematics of a solid flange lubrication device.
 - Moderate- to high-CoF materials applied on the wheel tread or top of rail (ToR, see Figure 1a), hence ToR products—ensuring that the CoF is sufficient for traction and braking but is not extremely high to prevent excessive damage and noise [1,11,12,13].
- Very-high-CoF materials applied at short periods, when necessary, even at the cost of increased damage (sanding) [14,15].
The application of the FM can be achieved by installing the following equipment:
- On the vehicle—on-board friction management systems (e.g., flange lubrication installed on a vehicle bogie);
- On the track—trackside friction management systems (e.g., stationary grease pumps installed in tight curves);
- On a special vehicle, such as the ‘lubricating tram’ in Prague or Railhead Treatment Trains (RHTTs) in Great Britain, providing rail conditioning for other vehicles running on the line.
Generally, the friction effect during wheel–rail contact is closely related to the wear of the wheels and rails. A review of simulation models for estimating wheel and rail wear is presented in [16]. Some studies and practical experience show that LCF materials can significantly reduce the level of wear in wheel–rail contact [17,18]. According to the information presented in [17], a decrease in the CoF at the gauge corner from 0.3 to 0.15 in an R390 m curve can extend the service life of the outer rail of a metro line by 60%. The simulation results presented in [18] then demonstrate how significantly a decrease in the CoF (caused by wet, LCF, oil, and grease conditions) on all wheels of a six-axle locomotive influences wear numbers and lateral wheel–rail forces in an R240 m curve. Study [19] deals with wear and crack growth in rail steel under dry and lubricated conditions.
This paper focuses on one of the instruments for friction control, namely, solid lubricants for wheel flanges. These are produced as short sticks, stacked inside a tube fastened to the bogie frame and pressed toward the wheel flange by a spring (see Figure 1b). This type of wheel flange lubrication device is often used in conditions of urban rail systems (e.g., metro vehicles). The lubricant, often based on molybdenum disulfide (MoS2) [20,21], is naturally transmitted by rubbing to the wheel surface in suitable quantities with no need for pumps, controllers, etc. (unlike spraying systems for liquid lubricants for the same purpose). However, different materials can be used as lubricants, e.g., graphite [22]. An advantage of solid lubricants is that there is no risk of lubricant migration on the wheel tread.
Some experimental results that describe the influence of solid flange lubricants on the CoF using small-scale testing equipment are presented in [6,9,23]. The industry also requires a standard testing methodology—in the European context, this is given in the EN 15427-2-1 [10] standard; however, the specification should still be improved to reach more consistent and repeatable results.
This paper combines aspects of solid lubricant testing, based on the authors’ experience, with the theory of wheel–rail wear and numerical simulations to characterize the impact of flange lubrication on wheel and rail damage in curves. The aim of the theoretical part is to analyze the relationship between the quantities usually applied to characterize the wheel–rail interaction in curves, i.e., the frictional work and guiding force, with respect to various levels of wheel flange lubrication. Whereas the guiding forces can be measured using instrumented wheelsets or wayside equipment, the frictional work cannot be practically measured under real operating conditions—it is estimated only by means of simulations. Although the importance of the frictional work in wheel–rail contact for the wear estimation is well known (see, e.g., [16,17,18]), a hypothesis that higher guiding force means a higher level of wear is sometimes accepted, even in the railway industry (see, e.g., [24]). In [8], a detailed analysis of lubricated conformal wheel–rail contact is performed, but attention is not paid to the overall force and creep conditions in a curve. In [25], the creepages and contact position are solved, but the connection with guiding forces is also not analyzed.
The experimental part of this paper summarizes the testing results obtained using an Amsler twin-disc machine. In addition to confirming the acceptability of assumptions about achievable friction coefficient levels when using solid lubricants (as an input in simulations), imperfections in the standardized testing methodology are highlighted, and the next direction of research in this field is indicated.
2. Wheel–Rail Interaction in Curved Tracks
The interaction between wheels and rails is a critical component of the vehicle–track system, greatly influencing the operational safety and comfort, performance, and efficiency of rail transport systems. Much attention has been paid to theoretical analyses, modelling, and experimental characterization of the wheel–rail interface. The conditions of the wheel–rail interaction can be conceived to start with macrogeometry (wheel and rail profiles), which determines the contact position and geometry [26,27]. The wheel and rail deform due to normal loading, forming contact patches around geometric contact points [28,29,30]. In these contact patches, normal and tangential stresses are distributed, linked to deformations and relative movements, expressed by creepages [29,30,31,32,33,34]. The resulting forces determine the movement of the wheels and the vehicle as a whole, the investigation of which is naturally a dynamical problem [33,34,35,36]. Selected issues, however, can be treated in a quasi-static way, which is often the case for steady curving behaviour.
The behaviour of a real vehicle is influenced by many factors, some of which are difficult to capture through modelling. Still, essential features of simple models can be observed to be present behind all the complex characteristics.
If an unconstrained wheelset moves on a curved track (see Figure 2a), it can achieve an ideal position relative to the track with free rolling, with the curve imposing no tangential contact forces. The angle of attack α is zero (i.e., the wheelset takes a radial position), and the lateral position of the wheelset, which results in the difference in rolling radius between outer and inner wheels, is limited only by the shapes of the wheel and rail profiles.
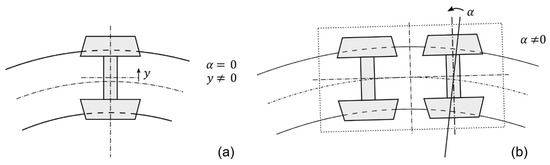
Figure 2.
(a) An unconstrained wheelset on a curved track; (b) wheelsets connected in a bogie on a curved track.
The wheelsets of a real vehicle, constrained within a (bogie) frame (see Figure 2b), are not allowed to assume their own respective ideal positions—their movement is limited and characterized by design properties of the running gear (wheelbase, stiffness of axlebox guiding). Moreover, in tight curves, the available rolling radius difference may not be sufficient to provide the required steering effect. Therefore, the wheelsets cannot maintain pure rolling. Creepage occurs in the wheel–rail contact, generating creep (tangential) forces and resulting in wear of wheels and rails. This effect is most noticeable on the outer wheel of the first (‘leading’) wheelset, where the contact area is shifted towards the flange and the angle of attack is largest.
To quantify the creep effects in the wheel–rail contact, the specific frictional work, also known as the wear number, or Tγ, can be introduced:
where Wf is the frictional work, l is the distance over which the frictional work is realized, Tx and Ty are the tangential (creep) forces in longitudinal and lateral direction, respectively, sx and sy denote the relevant creepages, Mz is the spin moment, and ϕz is the spin creepage. Sometimes, the spin effects are neglected (or—depending on the wheel–rail contact model used—included in a different way); in that case, the specific frictional work in the wheel–rail contact can be expressed as:
The wear number expresses the instantaneous intensity of energy dissipation in the vehicle–track interface. Although the Tγ value is always influenced by the method of wheel–rail contact modelling, it can be used to indicate the wear intensity level and represents a basic input to various wear prediction models, as presented, e.g., in [16,17,18,37,38,39].
During steady running through a curve, quasi-static Tγ is typically evaluated, representing a mean value within the range of dynamic variation. The sum of quasi-static Tγ values on all wheels of the vehicle corresponds to its curving resistance.
In general, a running gear design that allows more movement of the wheelsets within the frame should be more ‘track-friendly’ in relation to the wear of rails (but also wheels) in curves. However, the possibility of radial wheelset steering is practically limited because of requirements for vehicle running stability at higher speeds on straight tracks (high stiffness of the wheelset guiding is required). This presents an opportunity to utilize FMs to reduce wear by minimizing the frictional work generated in the wheel–rail contact in curves.
3. Modelling of the Potential Contribution of Solid Lubricants to Reducing Wheel and Rail Wear
The primary objective of applying LCF materials to the wheel–rail interface, including solid lubricants, is to minimize the level of wheel and rail wear in curves. The effects of these lubricants can be estimated using multibody simulations (MBSs) of vehicle running performance, as shown, e.g., in [17,18].
3.1. Models and Methods
To quantify the contribution of wheel flange lubricants to reducing the level of wheel and rail wear, MBSs of a railway vehicle running through a small-radius curve were performed with the in-house MBS tool ‘SJKV’, developed at the Faculty of Transport Engineering of the University of Pardubice. A more detailed description of this software can be found in [40]; some vehicle models created in ‘SJKV’ were validated with positive results—examples of comparison of the simulation results with results of measurements on a real vehicle are presented in [41,42]. Especially in tight curves, the accuracy of simulated wheel–rail forces is good, usually with deviations not exceeding 10%. The results were also compared with commercial MBS tools [43]. The considered vehicle model represents a single vehicle (intermediate traction coach) of a regional single-deck electric multiple unit (EMU). The vehicle body is supported by a pair of two-axle bogies (one traction and one trailer bogie); the secondary suspension of each bogie is realized by a pair of air springs and an anti-roll bar, supplemented by vertical, lateral, and longitudinal (anti-yaw) hydraulic dampers. The bogie frame is suspended on wheelsets by a pair of helical coil springs per axle box; wheelset guiding is realized by vertical cylindrical plugs with rubber elements, ensuring different stiffnesses in the longitudinal and lateral directions. In total, the MBS model has 55 degrees of freedom (DoFs) and consists of the following:
- Four wheelsets (4 × 6 DoFs);
- Two bogie frames (2 × 6 DoFs);
- Vehicle body (with seven DoFs—the additional one DoF represents its torsional flexibility);
- Eight equivalent masses of rails in the lateral direction (8 × 1 DoF) belonging to individual wheels;
- Four equivalent masses of air in the secondary suspension system (4 × 1 DoF). To reflect the real frequency-dependent dynamic behaviour of the secondary air suspension, the Gavriloski–Jovanova air spring model [44] was implemented into the MBS model, and its parameters were verified experimentally.
The basic model parameters are presented in Table 1; a more detailed description of the vehicle model can also be found in [45].

Table 1.
An overview of the basic parameters of the investigated model of an EMU traction coach.
3.2. Simulation Scenarios
The relevant simulations were performed in an R300 m curve with a cant of 150 mm. The vehicle speed was set to 80 km/h, corresponding to a cant deficiency of approximately 100 mm. The characteristics of the wheel–rail contact geometry were defined by the theoretical wheel profile S1002/h28/e32.5 [46] and the theoretical rail profile 60E1 [47] with a 1:40 inclination, a nominal track gauge of 1435 mm, and a nominal wheel back-to-back distance of 1360 mm. The purpose of the simulations was to analyze the force and creep conditions in the wheel–rail contact under different friction conditions that represent the effects of flange lubrication. Therefore, the CoF was defined as a function of the lateral contact position on the wheel profile. In addition to the basic simulation scenario with a constant CoF along the wheel profile (CoF = 0.4, which corresponds to dry rails), the CoF on the wheel flange was reduced in three steps to 75%, 50%, and 25% of the basic value. The reduced CoF value was applied to the position of the contact point (centre of the contact patch) on the wheel profile with yw ≥ 25 mm; in the range of 20 mm ≤ yw ≤ 25 mm, a linear transition of the CoF was considered (see Figure 3). Due to the system properties of the solid lubricants used for wheel flange lubrication (the solid sticks were pressed to the wheels at a defined lateral position continuously), it was not necessary to address the question of lubricant retentivity [48] (as in the case of spraying systems for liquid lubricants) during the simulations. Therefore, the reduced CoF on the wheel flange can be considered constant.
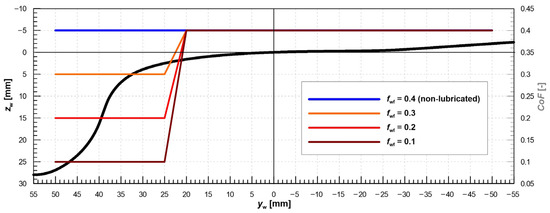
Figure 3.
Theoretical shape of the wheel profile and CoF considered along the wheel profile.
The simulations were performed in two versions: on a theoretical track without irregularities and on a track with measured vertical and lateral deviations of the right and left rails from their ideal position (defined by the track alignment).
3.3. Simulation Results—General Behaviour
Figure 4, Figure 5 and Figure 6 present selected MBS results on the track with irregularities. In these graphs, the results are demonstrated for the scenarios without flange lubrication (represented by the constant CoF of 0.4 on the whole wheel profile—blue lines) and with a 50% reduction in the CoF on the flange (reducing the CoF from 0.4 on the wheel tread to 0.2 on the wheel flange—red lines). The positions of the contact points on the outer and inner wheels of the first wheelset of the investigated vehicle during the simulation are presented in Figure 4. It is clear that flange lubrication does not significantly affect the position of the contact points on either wheel—the wheel–rail contact is realized on the lateral position of approximately 35 mm on the leading (outer) wheel, i.e., in the transition zone between the wheel tread and the wheel flange (oscillations in the lateral contact position are caused by track irregularities). In this zone, the wheel is considered lubricated in the relevant simulation scenario (see Figure 3). On the inner wheel, contact occurs near the lateral position of approximately −24 mm, i.e., in the non-lubricated zone.
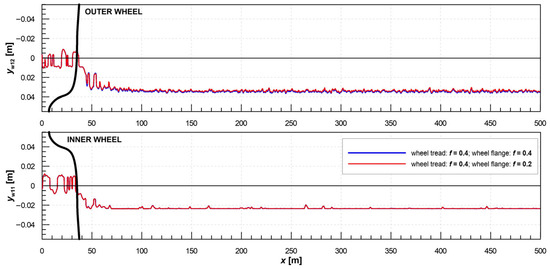
Figure 4.
Position of contact points on the outer and inner wheels of the first wheelset of the vehicle during the MBS of vehicle running through a R300 m curve with track irregularities—simulation scenarios for a non-lubricated wheel profile (blue lines) and for a 50% reduction in the CoF on the wheel flange (red lines).
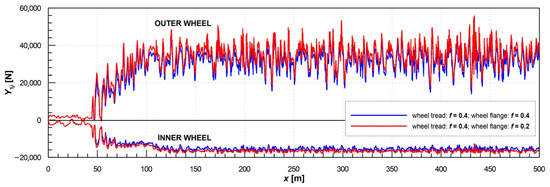
Figure 5.
Guiding forces on the outer and inner wheels of the first wheelset of the vehicle during the MBS of running through a R300 m curve with track irregularities—simulation scenarios for a non-lubricated wheel profile (blue lines) and for a 50% reduction in the CoF on the wheel flange (red lines).
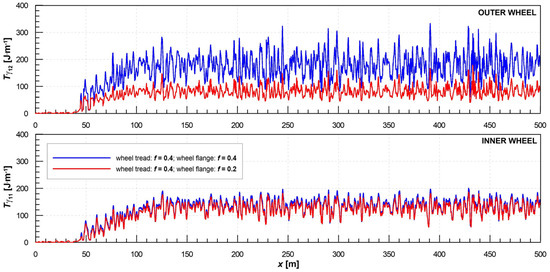
Figure 6.
Specific frictional work on the outer and inner wheel of the first wheelset of the vehicle during the MBS of vehicle running through a R300 m curve with track irregularities—simulation scenarios for a non-lubricated wheel profile (blue lines) and for a 50% decrease in the CoF on the wheel flange (red lines).
Figure 5 illustrates the impact of flange lubrication on the guiding forces for both wheels of the first wheelset of the examined vehicle. The guiding forces characterize the lateral force interaction between the wheels and the rails. An important finding is that slightly higher absolute guiding force values on the wheels of the leading wheelset (specifically about 10% higher on the leading wheel) are observed in the case of lubricated wheel flanges; this is explained in the next section.
Figure 6 shows a similar comparison of the observed values of specific frictional work (wear number) Tγ on both wheels of the first wheelset. While the difference between the simulation scenarios with and without flange lubrication is negligible on the inner wheel (because of the position of the wheel–rail contact in the non-lubricated zone on the wheel tread), the difference in results on the leading (outer) wheel is very significant. Whereas the observed average wear number on the inner wheel in the curve is approximately 130 J/m in both cases, flange lubrication leads to a decrease in the observed average wear number from ca. 180 J/m by slightly more than 50% in the simulation scenario. This means that with intensive flange lubrication of the leading wheelset, the inner wheel can actually experience higher specific frictional work than the outer wheel.
3.4. Simulation Results—Influence of Flange Lubrication
To better understand the effects of wheel flange lubrication on the vehicle–track interaction, trends in selected quantities characterizing wheel–rail contact in dependence on the intensity of the lubrication effect (i.e., the reduction in the CoF on the wheel flange) were studied. For these purposes, the MBS results of a vehicle running on the track without irregularities were used. In this way, it was possible to directly obtain the quasi-static values of relevant quantities in curves. The observed dependencies of the selected quantities on the CoF on the wheel flanges of the first wheelset are shown in Figure 7.
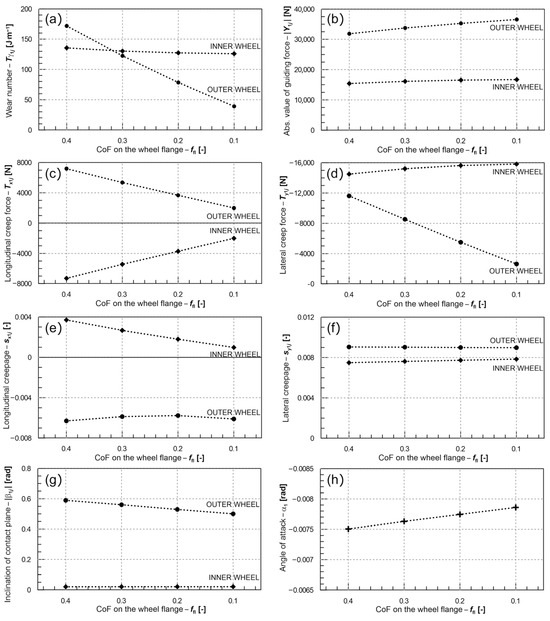
Figure 7.
Dependencies of selected quantities characterizing the quasi-static guiding behaviour of the first wheelset of the vehicle in the simulation run through an R300 m curve without irregularities on the CoF on the wheel flange: (a) wear number Tγ; (b) quasi-static guiding forces Y; (c) longitudinal creep forces Tx; (d) lateral creep forces Ty; (e) longitudinal creepages sx; (f) lateral creepages sy; (g) inclination of contact planes β; (h) angle of attack of the wheelset α.
The influence of the CoF is directly reflected in the calculation of the components of the specific frictional work (wear number) Tγ. For the first wheelset of the vehicle, the quasi-static values of the wear number on both wheels in the considered R300 m curve, depending on the CoF on the wheel flange, are presented in Figure 7a. In the case of the considered simulation scenario, it is clear that the decreasing CoF on the wheel flange results in a significant decrease in the specific frictional work on the outer (leading) wheel, whereas the wear number on the inner wheel retains an approximately constant value. A practical consequence of the observed effect is a notable reduction in wear intensity on the wheel flange, where the wheel–rail contact is realized. A more detailed analysis of individual wear number components (see graphs c to f in Figure 7) reveals that the primary cause of the reduction in the wear number on the leading wheel is a decrease in the magnitude of the lateral creep force Ty. This reduction is a direct consequence of the lower CoF and is reached despite an increasing angle of attack of the observed wheelset (Figure 7h), which, in turn, is caused by a decrease in the steering moment of longitudinal creep forces Tx (Figure 7c) acting on this wheelset.
Figure 7b confirms the slight increase in the quasi-static guiding forces Y due to the lubrication of the wheel flange, especially on the leading wheel, which is also observed in the results of the simulations on the track with irregularities (see Figure 5). This effect can be explained with the help of the force diagram in Figure 8: the lower lateral creep force Ty on the outer wheel counteracts a smaller part of the so-called leading force, i.e., the horizontal component of the normal force N. Therefore, the resulting guiding force Y has to be higher under the conditions of a lubricated wheel flange. The effect of the higher guiding force and the lower vertical component of the lateral creep force Ty influences the position of the wheelset within the gauge clearance, therefore leading to a small shift in the contact point position on the wheel profile. Due to the high sensitivity of the contact plane inclination in the wheel flange area, this little change also leads to a decrease in the contact plane inclination β on the leading wheel (Figure 7g).
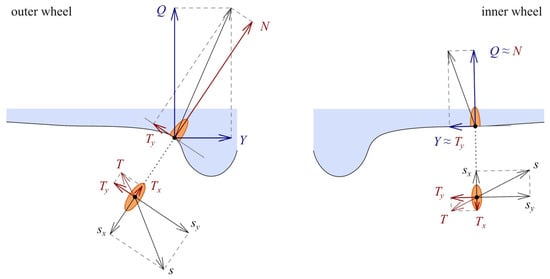
Figure 8.
Visualization of forces and creepages in the wheel–rail contact on both sides of the leading wheelset in a small-radius curve in the case of one-point contact on the outer wheel.
Regarding the contribution of wheel flange lubrication, it should be noted that this effect can be observed only in such operational conditions when the wheel–rail contact patch on the relevant wheel is located in the lubricated zone of the wheel profile. Therefore, a significant reduction in the wear number due to flange lubrication is typically obtained only on the leading wheels of the individual bogies of the vehicle during its run through a curve, as demonstrated in the MBS results in Figure 9 (see the top graph). This effect significantly contributes to the potential reduction in wheel and rail wear.
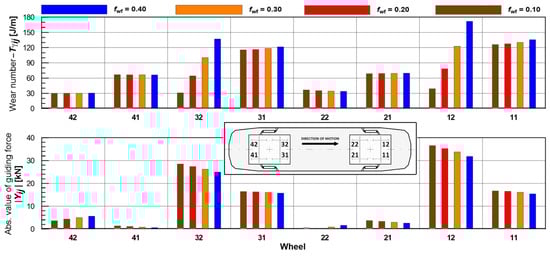
Figure 9.
Quasi-static Tγ values (top) and guiding forces Y (bottom) on individual wheels of the investigated vehicle when running through an R300 m right-hand curve under different conditions of the CoF on the wheel flange (leading wheels in the individual bogies: W12 and W32).
However, the calculated reduction in the wear number on the leading wheel of the first wheelset (i.e., 29%, 54%, and 77% on the wheel 12 at the decrease in the CoF on the wheel flange from 0.4 to 0.3, 0.2, and 0.1, according to Figure 3) cannot be simply extrapolated to estimate the sum of wear numbers on all wheels of the vehicle. The reason is that the frictional conditions on the non-leading wheels are not affected in this way, and the wear number on these wheels remains approximately constant, corresponding to the unchanged CoF on the ToR (and the wheel tread). According to the top graph in Figure 9, the achieved reduction in the sum of wear numbers of all the wheels (and also, e.g., in the curving resistance) is only 12%, 23%, and 33% with the reduction in the CoF on the wheel flange from 0.4 to 0.3, 0.2, and 0.1, according to Figure 3. Therefore, there is a significant difference between a situation where the CoF between the wheel and the rail is generally low (e.g., due to air humidity, as considered in [18,40]) and a situation where only the wheel flanges are lubricated under otherwise dry rail conditions.
Although the particular results (in terms of absolute Tγ values) are influenced by the wheel–rail contact model used (including the wheel–rail contact geometry conditions), the principles and trends can be generalized. On the other hand, the limited possibility of transmission of the lubricant on the wheel tread (as seen with solid lubricants) and, therefore, the insignificant effect of flange lubrication on the non-leading wheels, is beneficial for vehicle traction and braking performance.
The distribution of quasi-static guiding forces on the individual wheels of the vehicle is depicted in the bottom graph in Figure 9 for the discussed simulation scenarios. We can conclude the following:
- The reduced CoF on the flange of the leading wheel significantly reduces the wear number on that wheel and has almost no influence on other wheels (as expected);
- The influence on the guiding forces (often taken as representative quantities of vehicle curving behaviour) is not the same; it is even opposite, although with a lower sensitivity: flange lubricated leading wheels experience higher guiding forces.
4. Practical Assessment of Solid Lubricant Performance
The second part of this paper deals with the experimental assessment of the performance of solid lubricants for the wheel–rail interface and summarizes the authors’ experience with twin-disc machine measurements. Knowledge of lubricant performance is necessary to verify the credibility of assumptions about the friction coefficient in the wheel–rail contact as an input for simulations. Considering the limitations in the informative value of the results obtained using a twin-disc machine, further possibilities for improving the lubricant testing methodology are discussed.
4.1. Procedure
The effect of solid lubricants on the coefficient of friction can be tested on small-scale testing equipment. The standard testing methodology for a twin-disc machine is given in the European standard EN 15427-2-1:2022, Annex H [10]. Previously, this issue was dealt with in EN 16028:2012, Annex L [49]. Both standards describe the testing procedure in the same way, in the following steps:
- After mounting the test discs and setting the load, the machine runs at the required speed without lubricating the discs.
- When the coefficient of friction (CoF) reaches the initial level of 0.4, a solid lubricant sample (stick) is applied and pressed against one of the discs. If the lubricant is effective, the CoF decreases.
- After 200 s, the lubricant sample is removed without stopping the machine.
- The CoF gradually increases again. The test ends when the CoF reaches the reference dry level of 0.4.
- The lubricant sample is weighed to determine the lubricant consumption.
Minor differences in the determination of selected testing parameters, as specified by the standards, are shown in Table 2. From this comparison, it is clear that some parameters of the tests (disc diameter, lubricant stick loading) are not directly specified; in the case of the other parameters (creepage, rotational speed, disc contact pressure), the requirements of both standards differ more or less in the prescribed range of values. The standard also does not specify whether the contact pressure is the mean or maximum Hertzian.
Table 2.
An overview of parameters for twin-disc machine tests [10,49].
The following outputs are evaluated:
- Rate of CoF decrease after applying the lubricant;
- Steady CoF value during the lubrication of the discs;
- Retentivity, i.e., duration of CoF increase up to the reference dry level after the lubricant is removed.
The methodology is designed for comparative testing, allowing for the comparison of various lubricant materials on a given test machine. Comparability of results obtained on different testing machines is not guaranteed. In the authors’ experience, the methodology is not sufficiently specified to ensure general comparability of results, and the results are not always consistent, even with a single testing machine.
The test discs should be manufactured from real wheel and rail materials (cut from wheels and rails) and shaped so that the required Hertzian pressure is achieved by applying the force by the twin-disc machine (Figure 10). The lubricant samples are obtained by cutting the supplied sticks to dimensions suitable for a small-scale applicator (Figure 11). Before the actual testing begins, the standard requires that a sample of lubricant be run against the disc so that it conforms to the disc by abrasion. A conformal contact is created between the stick and the disc. Depending on the test conditions, the run-in can take several hours.
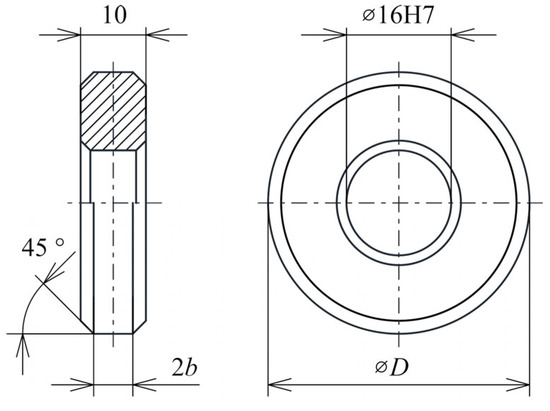
Figure 10.
Drawing of the test disc for the Amsler A-135 twin-disc machine.

Figure 11.
A full-size solid lubricant stick (left) and a cut-out sample for twin-disc machine testing (right).
4.2. Measured Response
The particular results presented in this section were obtained using a standard Amsler A-135 twin-disc machine with cylindrical discs approximately 40 mm in diameter.
After the start of the test, the CoF usually starts to increase and soon reaches the dry reference value. When the lubricant is applied, the CoF decreases. Depending on the lubricant’s performance, the lubricated CoF levels, as well as the general shape of the CoF history during the test, can differ considerably; examples for two different materials are shown in Figure 12 (the bottom example shows better performance than the top one).
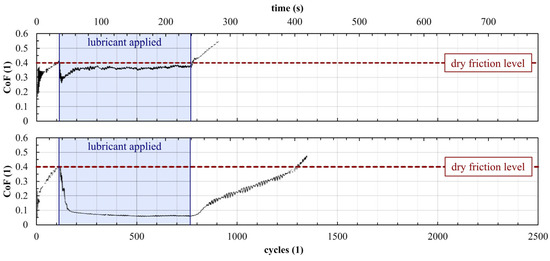
Figure 12.
Measured time histories of the CoF during twin-disc tests of two different solid lubricants (creepage 15%, bottom disc speed 193 rpm, maximum Hertzian pressure 875 MPa).
4.3. Factors Influencing the Results
During the testing of solid lubricant samples, several influences were observed that can significantly affect test results or repeatability. Their overview is given in the following text.
4.3.1. Temperature
Testing is usually carried out under natural temperature and humidity conditions in the laboratory. However, the surface temperature of the test discs, which has a significant physical influence on the tribological contact conditions, is substantially affected by frictional heating. Cooling is not specified in the standard. According to [50], air cooling of the discs is recommended. Continuous contactless measurement of the disc temperature is treated in [51].
Based on experience from testing solid lubricants, temperature can have a noticeable effect on the results. With inappropriate temperature conditions, it is possible to achieve significant changes on the surface of the test discs with the given testing parameters. High temperatures particularly promote the formation of an oxide layer on the surface of the discs (as observed in [50]). This layer can be beneficial for some types of lubricants. It ensures good adhesion of the lubricant to the disc surface. For some of the tested samples, the retentivity was significantly increased (Figure 13). However, other samples did not show this response.
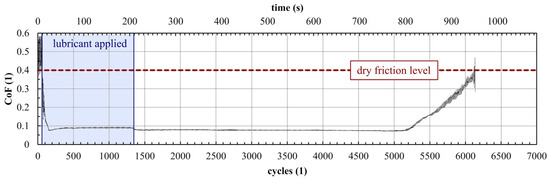
Figure 13.
Example record of a twin-disc test of a solid lubricant sample with high retentivity (creepage 10%, bottom disc speed 387 rpm, maximum Hertzian pressure 900 MPa).
4.3.2. Test Disc Manufacturing and Surface Quality
Obviously, the test discs should be manufactured from real wheel and rail materials [10]. The cutting method is not specified in the standard. To obtain comparable test results, it is necessary to choose a cut-out in such a way that the disc material is not affected by the hardened surface layer of the wheel or rail if it has been in service for some time.
The geometric accuracy of the discs must also be considered. It is evident from the performed tests that inaccuracies caused by misalignment or out-of-roundness lead to uneven distribution of contact stress, which may result in contact fatigue damage during the test. As a consequence, the results of various tests may be inconsistent.
The standard does not specify the surface treatment of the samples. It can be stated that the run-in duration of the disc increases with surface roughness. With a rough surface, a greater quantity of the lubricant may be pressed into the surface layer, which is beneficial for the lubricant’s performance but introduces uncertainties into the assessment of the lubricant alone.
4.3.3. Pressure on the Lubricant Sample
The next factor influencing lubricant performance is the application force or pressure. In a real vehicle, the pressure of the lubricant on the wheel can be regulated by the force of a spring, which is a part of the solid lubricant holder. This parameter is important from the user’s perspective because the choice of the optimum pressure value affects the efficiency of the lubricant and has an impact on its consumption.
The lubricant application force is not specified in the standard, although it includes a condition that the testing machine allows applying the same pressure as in the actual field application [10]. The question is whether it is desirable to apply the same pressure as in operation. In the case of a lubricated wheel flange in operation, the lubricant is supplied continuously, while its consumption—removal from the steel surface—occurs only occasionally. On a twin-disc machine, the contact and slip of the lubricated surfaces are constant, which means that the lubricant is consumed more from the discs. Therefore, a more intensive supply of lubricant is naturally required to achieve an effective amount of lubricant on the disc surfaces. This can be produced by increasing the contact force or reducing the contact area, which is also associated with other phenomena, as discussed below.
The twin-disc tests show that higher pressure results in higher efficiency; however, this is not a direct proportionality: a certain level of pressure is required to transfer a sufficient amount of lubricant on the discs. Then, there is a transition zone above which the lubricant’s performance does not change significantly. This phenomenon is more pronounced at higher slip values, where a lubricant sample without sufficient pressure may not even have the opportunity to show its effect.
4.3.4. The Lubricant Sample and Its Application Surface
According to the standard [10], the contact between the lubricant sample and the disc should be conformal as in actual operation. There is a view that, in this case, the stability of the contact conditions is not guaranteed. Therefore, alternative test conditions include a sharp end of the lubricant sample in contact with the disc, theoretically in a line, practically in a small area that grows somewhat with wear, but can be easily renewed. In our experiments, we use this setup, which results in significantly higher lubricant–disc contact pressure and more reliable formation of the effective lubricant layer.
Other influencing factors should also be observed. These include the porosity of the lubricant, where some samples are essentially continuous while others have quite large voids (see Figure 14). If there is a significant void in the small contact area, proper contact between the lubricant and the steel surface is not ensured, which affects the test consistency.
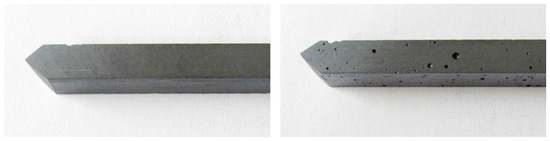
Figure 14.
Comparison of the porosity of different lubricant samples.
Lubricant composition naturally affects performance. The chemical composition of solid lubricants is quite complex and varied. Manufacturers typically do not disclose the composition of their products and only state the basis on which the products work. A basic lubricant is often supplemented with additives that affect deformation properties, internal residual magnetization, and flammability, increase corrosion resistance, improve performance in low-temperature conditions, etc. The microstructure observation of the solid lubricant samples (Figure 15) shows not only their heterogeneity but also the varying arrangements and sizes of the individual lubricant components in the base matrix.

Figure 15.
Comparison of the structure and chemical composition of two different lubricant samples (electron microscope images, same scale; the sample on the right shows a large ferrous particle).
4.4. Limitations of the Current Testing Methodology and Possible Improvements
As can be seen from the above, the standardized testing methodology for solid lubricants has limitations, making it suitable only for comparative testing to quantify lubricant performance. One question is the transferability of results from the small-scale testing device into real operating conditions. This phenomenon is particularly connected to the effects of inhomogeneity in the samples (on a small scale, an inhomogeneity can have a more significant effect on the results than on a large scale—see Section 4.3.4) and with temperature effects (an influence of the thermal capacity of small samples compared to a railway wheel). Another limitation stems from the principle of the CoF measurement using the Amsler twin-disc machine, where the creepage is set to a constant value. The complete adhesion characteristics (also used in the relevant simulation models) express the dependence of the adhesion/friction coefficient on creepage, as presented in Figure 16, on an example function defined by Freibauer [52] as:
where f(s) is the CoF function on the creepage s and ε expresses the slope of a linearized shear stress increase.
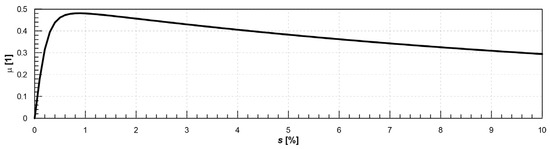
Figure 16.
Example of an adhesion characteristic by Freibauer [52].
When using the Amsler twin-disc machine, the result for the steady state is a single point of the adhesion characteristic for a given creepage value. The subject of further research will therefore be the use of a wheel–rail roller rig (see, e.g., [53]) to measure adhesion characteristics, still under laboratory conditions, but on a larger scale (real tram wheel) and, in particular, with the possibility of controlling creepage in order to obtain complete adhesion characteristics when applying solid lubricants.
5. Conclusions
This paper presents the complex issue of solid lubricants for wheel–rail contact from two different perspectives. First, attention is paid to their benefits with respect to the minimization of wheel (and rail) wear in curves. The impact of wheel flange lubrication on the physical quantities describing the wheel–rail interaction is investigated by means of the MBS of an EMU coach negotiating a small-radius curve. Lubrication is modelled by setting a reduced CoF (only) on the wheel flange. Generally, the appropriate CoF is found by experiments; here, a range of values is used to cover various operating conditions from efficient lubrication (CoF 0.1) to non-lubricated contact (CoF 0.4).
The simulation part of this work provides a qualitative estimation of the reduction in specific frictional work realized in the wheel–rail contact and, therefore, the intensity of wheel and rail wear as well. It should be noted that the simulation results are always influenced by the model and the assumptions made. In case of the ‘SJKV’ system, the wheel–rail contact model is based on a 2D geometrical description, and the tangential force model by Polách [54] is applied. During the simulations, no tractive/braking effort is considered.
Although the 2D description of the wheelset–track geometry leads—especially on the leading wheels in small-radius curves—to underestimated values of the wear number, it can be assumed that the observed trends in the relevant quantities correspond to reality. The MBS results allow for explaining the effects in the dynamic behaviour of the investigated wheelset in dependence on the intensity of wheel flange lubrication, characterized by the CoF. Simultaneously, the performed twin-disc machine tests show that a decrease in the CoF down to the value of approximately 0.1 is practically achievable using solid lubricants. An important finding is that the decrease in the CoF on the wheel flange leads, under the considered conditions, to a decrease in the wear number (and, therefore, wear intensity) on the leading wheel and simultaneously to an increase in lateral (guiding) forces. The mechanism of the increase in quasi-static guiding force acting on the leading wheel under the conditions of a lubricated wheel flange is described in detail in Section 3.4. This phenomenon is completely opposite to the decrease in the quasi-static guiding forces (under otherwise the same conditions) in the case when the decrease in the CoF is considered on all wheels of the vehicle (or bogie)—see, e.g., [18,40]. Based on this observed (and physically explained) effect, it is possible to state that the quasi-static guiding force is definitely not a suitable measure for evaluation of the wear intensity because it can even show opposite trends in comparison with the behaviour of the (specific) frictional work in the wheel–rail contact (as demonstrated, e.g., in the graphs in Figure 9).
Another important fact is that the observed significant reduction in the wear number on the leading (lubricated) wheel in a small-radius curve does not mean that the total frictional power acting on all wheels of the vehicle decreases in a similarly significant way because the contact on the other (non-leading) wheels does not occur in the lubricated zone, especially in the case of applying solid lubricants with a strongly limited risk of migration of the lubricant on the wheel tread.
The method for laboratory testing of the performance of solid lubricants on a twin-disc machine is given in EN 15427-2-1 [10], formerly EN 16028 [49]. The test methodology is intended to compare different samples of solid lubricants on a given test rig. However, the comparability of tests between different test machines or laboratories is not guaranteed. This is because, in many aspects, the test conditions are not precisely defined. The measurement results can be influenced by various factors (temperature conditions, preparation of test samples, pressure of the solid lubricant, design of the lubricant application surface). In particular, sufficient loading of the solid lubricant sample is crucial for creating an effective lubricant layer and providing the correct function. According to the authors’ experience, the lubricant often does not provide as good performance as expected, although under slightly different testing conditions, the results are favourable. It is questionable whether improvements in test methodology can lead to universally comparable results. However, it is desirable to address the problem of ensuring that a solid lubricant interacts with steel surfaces in a regime that is relevant to the actual operation. Therefore, further research in this field will focus on the verification of the twin-disc machine results in full-scale laboratory conditions, i.e., using a roller rig.
In the field of simulations, further research can focus on MBS model validation under the conditions of different CoF levels and possible integration of selected effects influencing lubrication performance into the model. One of the possible ways to improve the model with respect to lubrication performance is the integration of the temperature effects. A simple way to upgrade the model includes implementing the basic thermomechanical principles, as presented in the example of a railway buffer model in [55], considering the frictional work as an input into the calculation. However, model validation (which is also necessary for thermomechanical model calibration) is a very challenging issue because of the complicated experimental measurability of the frictional work, as well as the random nature of the CoF in real conditions on railway tracks, which is also influenced by contaminants, etc.
Author Contributions
T.M. built the simulation model, performed the simulations and their evaluation, and prepared the final version of this article. J.Š. summarized the theory regarding the wheel–rail wear mechanism and contributed to the evaluation and verification of the simulation results. P.V. and S.L. prepared the twin-disc machine experiments, performed their evaluation, and summarized their results. S.L. conducted laboratory measurements with solid lubricant samples. P.V. performed the theoretical analysis of wheel–rail contact conditions and wrote the introduction of this paper. All authors have read and agreed to the published version of the manuscript.
Funding
This work was supported by the Technology Agency of the Czech Republic under Grant No. TN02000054 ‘Božek Vehicle Engineering National Center of Competence (BOVENAC)’ and by the University of Pardubice within the support for research teams at the Faculty of Transport Engineering.
Data Availability Statement
The raw data supporting the conclusions of this article will be made available by the authors on request.
Conflicts of Interest
The authors declare no conflicts of interest.
Abbreviations
The following abbreviations are used in this manuscript:
| CoF | Coefficient of friction |
| DoF | Degree of freedom |
| FM | Friction modifier |
| LCF | Low coefficient of friction |
| MBS | Multi-body simulation |
| RHTT | Railhead Treatment Trains |
| SJKV | Simulace jízdy kolejového vozidla [in Czech]—Simulation of the running of a rail vehicle |
References
- Buckley-Johnstone, L.E. Wheel/Rail Contact Tribology: Characterising Low Adhesion Mechanisms and Friction Management Products. Ph.D. Dissertation, University of Sheffield, Sheffield, UK, 2017. [Google Scholar]
- Lewis, R.; Olofsson, U. Wheel-Rail Interface Handbook; Woodhead Publishing: Cambridge, UK, 2009. [Google Scholar]
- Singh, R.K.; Shindhe, M.; Rawat, P.; Srivastava, A.K.; Singh, G.K.; Verma, R.; Bhutto, J.K.; Hussein, H.S. The Effect of Various Contaminants on the Surface Tribological Properties of Rail and Wheel Materials: An Experimental Approach. Coatings 2023, 13, 560. [Google Scholar] [CrossRef]
- Butcher, T. Understanding and Modelling Low Adhesion Risk in the Wheel-Rail Interface. Ph.D. Dissertation, University of Sheffield, Sheffield, UK, 2022. [Google Scholar]
- Galas, R. Friction Modification Within Wheel-Rail Contact. Ph.D. Dissertation, Brno University of Technology, Brno, Czech Republic, 2017. [Google Scholar]
- Chen, H.; Fukagai, S.; Sone, Y.; Ban, T.; Namura, A. Assessment of lubricant applied to wheel/rail interface in curves. Wear 2014, 314, 228–235. [Google Scholar] [CrossRef]
- Eadie, D.; Oldknow, K.; Santoro, M.; Kwan, G.; Yu, M.; Lu, X. Wayside gauge face lubrication: How much do we really understand? Proc. IMechE Part F J. Rail Rapid Transit 2012, 227, 245–253. [Google Scholar] [CrossRef]
- Fang, C.; Ding, Y.; Yan, H.; Chen, J.; Zhou, W.; Meng, X. Prediction and analysis of wheel flange wear on small curved track considering wheel-rail conformal and lubricated contact. Wear 2024, 558–559, 205569. [Google Scholar] [CrossRef]
- Rey, T.; Papin, E.; Fridrici, V.; Dassenoy, F. Experimental study of the tribological performance of a solid lubricant stick with MoS2 for wheel-rail contact. Wear 2025, 570, 205941. [Google Scholar] [CrossRef]
- EN 15427-2-1:2022; Railway Applications—Wheel/Rail Friction Management—Part 2–1: Properties and Characteristics—Flange Lubricants. European Committee for Standardization: Brussels, Belgium, 2022.
- Stock, R.; Stanlake, L.; Hardwick, C.; Yu, M.; Eadie, D.; Lewis, R. Material concepts for top of rail friction management—Classification, characterisation and application. Wear 2016, 366–367, 225–232. [Google Scholar] [CrossRef]
- Eadie, D.; Kalousek, J.; Chiddick, K.C. The role of high positive friction (HPF) modifier in the control of short pitch corrugations and related phenomena. Wear 2002, 253, 185–192. [Google Scholar] [CrossRef]
- White, B.; Lee, Z.S.; Lewis, R. Towards a Standard Approach for the Twin Disc Testing of Top-Of Rail Friction Management Products. Lubricants 2022, 2022, 124. [Google Scholar] [CrossRef]
- Omasta, M.; Machatka, M.; Smejkal, D.; Hartl, M.; Křupka, I. Influence of sanding parameters on adhesion recovery in contaminated wheel-rail contact. Wear 2015, 322–323, 218–225. [Google Scholar] [CrossRef]
- Skipper, W.A.; Chalisey, A.; Lewis, R. A review of railway sanding system research: Wheel/rail isolation, damage, and particle application. Proc. IMechE Part F J. Rail Rapid Transit 2019, 234, 567–583. [Google Scholar] [CrossRef]
- Bosso, N.; Magelli, M.; Zampieri, N. Simulation of wheel and rail profile wear: A review of numerical models. Railw. Eng. Sci. 2022, 30, 403–436. [Google Scholar] [CrossRef]
- Wang, S.; Bingguang, W.; Ren, D.; Ding, Y.; Wen, Z.; Dong, D.; Tao, G. Analysis of the causes of severe side wear of the high rail on metro curves by numerical simulation and field investigation. Proc. ImechE Part F J. Rail Rapid Transit 2024, 238, 381–393. [Google Scholar] [CrossRef]
- Sun, Y.Q.; Spiryagin, M.; Wu, Q.; Cole, C. Wheel-rail contact wear analysis on curved lubricated track for heavy haul locomotive studies. Proc. ImechE Part F J. Rail Rapid Transit 2024, 238, 967–976. [Google Scholar] [CrossRef]
- Maya-Johnson, S.; Santa, J.F.; Toro, A. Dry and lubricated wear of rail steel under rolling contact fatigue—Wear mechanisms and crack growth. Wear 2017, 380–381, 240–250. [Google Scholar] [CrossRef]
- Vazirisereshk, M.R.; Martini, A.; Strubbe, D.A.; Baykara, M.Z. Solid Lubrication with MoS2: A Review. Lubricants 2019, 7, 57. [Google Scholar] [CrossRef]
- Wong, K.C.; Lu, X.; Cotter, J.; Eadie, D.T.; Wong, P.C.; Mitchell, K.A.R. Surface and friction characterization of MoS2 and WS2 third body thin films under simulated wheel/rail rolling–sliding contact. Wear 2008, 264, 526–534. [Google Scholar] [CrossRef]
- Cebulska, W.; Bąkowski, H.; Hadryś, D. The Influence of Selected Solid Lubricants on the Wear of the Rolling–Sliding Interface in the Wheel–Rail System According to the Standard PN-EN 15427-2-1:2022. Materials 2025, 18, 1672. [Google Scholar] [CrossRef]
- Fletcher, D.I.; Lewis, S. Creep curve measurement to support wear and adhesion modelling, using a continuously variable creep twin disc machine. Wear 2013, 298–299, 57–65. [Google Scholar] [CrossRef]
- Wu, P.; Zhang, F.; Wang, J.; Wei, L.; Huo, W. Review of wheel-rail forces measuring technology for railway vehicles. Adv. Mech. Eng. 2023, 15, 16878132231158991. [Google Scholar] [CrossRef]
- Yang, Y.; Guo, X.; Ling, L.; Wang, K.; Zhai, W. Effect of gauge corner lubrication on wheel/rail non-Hertzian contact and rail surface damage on the curves. Acta Mech. Sin. 2022, 38, 521522. [Google Scholar] [CrossRef]
- Ye, Y.; Vuitton, J.; Sun, Y.; Hecht, M. Railway wheel profile fine-tuning system for profile recommendation. Railw. Eng. Sci. 2021, 29, 74–93. [Google Scholar] [CrossRef]
- Vollebregt, E.A.H. Detailed wheel/rail geometry processing using the planar contact approach. Veh. Syst. Dyn. 2020, 60, 1253–1291. [Google Scholar] [CrossRef]
- Stratmann, I.; Goersch, J.; Schindler, C. Overview of methods to identify the static normal wheel-rail contact. Proc. IMechE Part F J. Rail Rapid Transit 2021, 236, 783–792. [Google Scholar] [CrossRef]
- Liu, B.; Bruni, S. Comparison of wheel–rail contact models in the context of multibody system simulation: Hertzian versus non-Hertzian. Veh. Syst. Dyn. 2020, 60, 1076–1096. [Google Scholar] [CrossRef]
- Jing, L.; Zhou, X.; Wang, K. An elastic-plastic theoretical analysis model of wheel-rail rolling contact behaviour. Acta Mech. Sin. 2023, 39, 422465. [Google Scholar] [CrossRef]
- Meymand, S.Z.; Keylin, A.; Ahmadian, M. A survey of wheel–rail contact models for rail vehicles. Veh. Syst. Dyn. 2016, 54, 386–428. [Google Scholar] [CrossRef]
- Fang, C.; Jaafar, S.A.; Zhou, W.; Yan, H.; Chen, J.; Meng, X. Wheel-rail contact and friction models: A review of recent advances. Proc. IMechE Part F J. Rail Rapid Transit 2023, 237, 1245–1259. [Google Scholar] [CrossRef]
- Knothe, K.; Stichel, S. Rail Vehicle Dynamics; Springer: Cham, Switzerland, 2017. [Google Scholar] [CrossRef]
- Iwnicki, S.; Spiryagin, M.; Cole, C.; McSweeney, T. (Eds.) Handbook of Railway Vehicle Dynamics, 2nd ed.; CRC Press: Boca Raton, FL, USA, 2019. [Google Scholar] [CrossRef]
- Higa, D.N.; Kina, E.J.; Gay Neto, A. Wheelset-rail mechanical model for a steady-state dynamic condition and prediction of rolling contact fatigue locci. Veh. Syst. Dyn. 2020, 60, 281–308. [Google Scholar] [CrossRef]
- Pacheco, P.A.P.; Ramos, P.G.; Sá, T.L.; Santos, G.F.M.; Gay Neto, A.; Santos, A.A. Comparison between quasi-static and multibody dynamic simulations for wheel-rail contact analysis. Multibody Syst. Dyn. 2025, 63, 63–81. [Google Scholar] [CrossRef]
- Tunna, J.; Sinclair, J.; Perez, J. A Review of wheel wear and rolling contact fatigue. Proc. IMechE Part F J. Rail Rapid Transit 2007, 221, 271–289. [Google Scholar] [CrossRef]
- Wu, Q.; Bernal, E.; Spiryagin, M.; Krishna, V.; Ding, H.; Stichel, S.; Cole, C. Heavy haul rail/wheel wear and RCF assessments using 3D train models and a new wear map. Wear 2024, 538–539, 205226. [Google Scholar] [CrossRef]
- Luo, K.; Liu, X.; Yang, Y.; Cong, T.; Zhang, F.; Wang, W. Modeling the competitive relationship between wear and rolling contact fatigue of railway wheel steel. Wear 2025, 560–561, 205615. [Google Scholar] [CrossRef]
- Michálek, T.; Zelenka, J. Reduction of lateral forces between the railway vehicle and the track in small-radius curves by means of active elements. Appl. Comput. Mech. 2011, 5, 187–196. [Google Scholar]
- Michálek, T.; Zelenka, J. Simulations of dynamic behaviour of locomotive 744.001 CZ LOKO. In Proceedings of the 9th International Conference on Railway Bogies and Running Gears, Budapest, Hungary, 9–12 September 2013; BME Budapest: Budapest, Hungary, 2014; pp. 109–118. [Google Scholar]
- Michálek, T.; Kohout, M. On the problems of lateral force effects of railway vehicles in S-curves. Veh. Syst. Dyn. 2022, 60, 2739–2757. [Google Scholar] [CrossRef]
- Zelenka, J.; Michálek, T.; Kohout, M. Comparative simulations of guiding behaviour of an electric locomotive. In Proceedings of the 20th International Conference Engineering Mechanics, Svratka, Czech Republic, 12–15 May 2014; ITAM CAS: Prague, Czech Republic, 2014; pp. 740–743. [Google Scholar]
- Gavriloski, V.; Jovanova, J.; Tasevski, G.; Đidrov, M. Development of new air spring dynamic model. FME Trans. 2014, 42, 305–310. [Google Scholar] [CrossRef]
- Michálek, T.; Jeniš, F. Modelling of secondary suspension for electric multiple unit. In Proceedings of the 38th Conference with International Participation Computational Mechanics, Srní, Czech Republic, 23–25 October 2023; University of West Bohemia: Plzeň, Czech Republic, 2023; pp. 116–118. [Google Scholar]
- EN 13715:2020; Railway Applications—Wheelsets and Bogies—Wheels—Tread Profile. European Committee for Standardization: Brussels, Belgium, 2020.
- EN 13674-1:2017; Railway Applications—Track—Rail—Part 1: Vignole Railway Rails 46 kg/m and Above. European Committee for Standardization: Brussels, Belgium, 2017.
- Galas, R.; Valena, M.; Jordan, T.; Kvarda, D.; Omasta, M.; Skurka, S.; Wu, B.; Ding, H.; Wang, W.; Krupka, I.; et al. A benchmarking methodology for top-of-rail products: Carry distance and retentivity. Tribol. Int. 2024, 197, 109810. [Google Scholar] [CrossRef]
- EN 16028:2012; Railway Applications—Wheel/Rail Friction Management—Lubricants for Trainborne and Trackside Applications. European Committee for Standardization: Brussels, Belgium, 2012.
- Lewis, R.; Magel, E.; Wang, W.; Olofson, U.; Lewis, S.; Slatter, T.; Beagles, A. Towards a standard approach for the wear testing of wheel and rail materials. Proc. IMechE Part F J. Rail Rapid Transit 2017, 231, 760–774. [Google Scholar] [CrossRef]
- Gallardo-Hernandez, E.A.; Lewis, R.; Dwyer-Joyce, R.S. Temperature in a twin-disc wheel/rail contact simulation. Tribol. Int. 2006, 39, 1653–1663. [Google Scholar] [CrossRef]
- Freibauer, L. Adheze kola vozidla na dráze. In Proceedings of the 7. Vedecká Konferencia Vysokej Školy Dopravy a Spojov v Žiline, Žilina, Slovakia, 13–15 September 1983; VŠDS Žilina: Žilina, Slovakia, 1983; pp. 214–219. (In Czech) [Google Scholar]
- Buckley-Johnstone, L.E.; Trummer, G.; Voltr, P.; Six, K.; Lewis, R. Full-scale testing of low adhesion effects with small amounts of water in the wheel/rail interface. Tribol. Int. 2020, 141, 105907. [Google Scholar] [CrossRef]
- Polách, O. A Fast wheel-rail forces calculation computer code. In Proceedings of the 16th IAVSD Symposium, Vehicle System Dynamics Supplement, Pretoria, South Africa, 30 August–3 September 1999; Volume 33, pp. 728–739. [Google Scholar]
- Michálek, T.; Liberová, S.; Vágner, J.; Jaroš, P.; Šlapák, J. Stiffness characteristics of railway buffers: Requirements, testing and proposal of a new computational model. Appl. Comput. Mech. 2025, 19, 69–86. [Google Scholar] [CrossRef]
Disclaimer/Publisher’s Note: The statements, opinions and data contained in all publications are solely those of the individual author(s) and contributor(s) and not of MDPI and/or the editor(s). MDPI and/or the editor(s) disclaim responsibility for any injury to people or property resulting from any ideas, methods, instructions or products referred to in the content. |
© 2025 by the authors. Licensee MDPI, Basel, Switzerland. This article is an open access article distributed under the terms and conditions of the Creative Commons Attribution (CC BY) license (https://creativecommons.org/licenses/by/4.0/).