You are currently viewing a new version of our website. To view the old version click .
Machines
  • Article
  • Open Access

14 February 2024

Designing an Industrial Product Service System for Robot-Driven Sanding Processing Line: A Reinforcement Learning Based Approach

,
,
,
and
State Key Laboratory for Manufacturing Systems Engineering, Xi’an Jiaotong University, Xi’an 710054, China
*
Author to whom correspondence should be addressed.
These authors contributed equally to this work.
This article belongs to the Section Advanced Manufacturing

Abstract

The Industrial Product Service System (IPS2) is considered a sustainable and efficient business model, which has been gradually popularized in manufacturing fields since it can reduce costs and satisfy customization. However, a comprehensive design method for IPS2 is absent, particularly in terms of requirement perception, resource allocation, and service activity arrangement of specific industrial fields. Meanwhile, the planning and scheduling of multiple parallel service activities throughout the delivery of IPS2 are also in urgent need of resolution. This paper proposes a method containing service order design, service resource configuration, and service flow modeling to establish an IPS2 for robot-driven sanding processing lines. In addition, we adopt the modified Deep Q-network (DQN) to realize a scheduling scheme aimed at minimizing the total tardiness of multiple parallel service flows. Finally, our industrial case study validates the effectiveness of our methods for IPS2 design, demonstrating that the modified deep reinforcement learning algorithm reliably generates robust scheduling schemes.

1. Introduction

The study of Servitization and Product Service Systems (PSS) has become an intriguing and evolving field, showing significant progress in the last thirty years []. PSS has been acclaimed as a highly effective tool for driving society toward a resource-efficient, circular economy and sparking a necessary ‘resource revolution’ since its inception []. In recent years, the Industrial Product Service System (IPS2) has been regarded as an integrated offering of products and services, and it can adapt to changing customer demands and provider abilities dynamically and deliver values in industrial applications []. However, with the increase in the degree of customization in industrial production, the performance parameters, manufacturing processes, and additional services between similar industrial products increasingly show considerable differences. Therefore, designing an industrial product service system that can fully meet individual needs and properly arrange manufacturing and maintenance services is very important.
With the trend of product modularization, emerging knowledge bases such as digital innovation, the Internet of Things (IoT), and closed-loop supply chains have received more attention []. Nowadays, the competitive capability of companies is not focused on adding various offline functions to products anymore but on fulfilling customer demands with specific functions such as dynamic scheduling, remote monitoring, and preventive maintenance []. As a result, the development and application of emerging technologies can help improve the design and delivery of IPS2 at various stages, including product and service requirements analysis, manufacturing system configuration, comprehensive workflow modeling, and production service activity scheduling.
With the intention of maximizing the service value, both human processes and physical processes are supposed to be unified and considered comprehensively for the PSS design []. Formalized configuration rules are crucial to efficiently and rapidly configuring the PSS []. Significantly, few kinds of research concentrate on the overall process of IPS
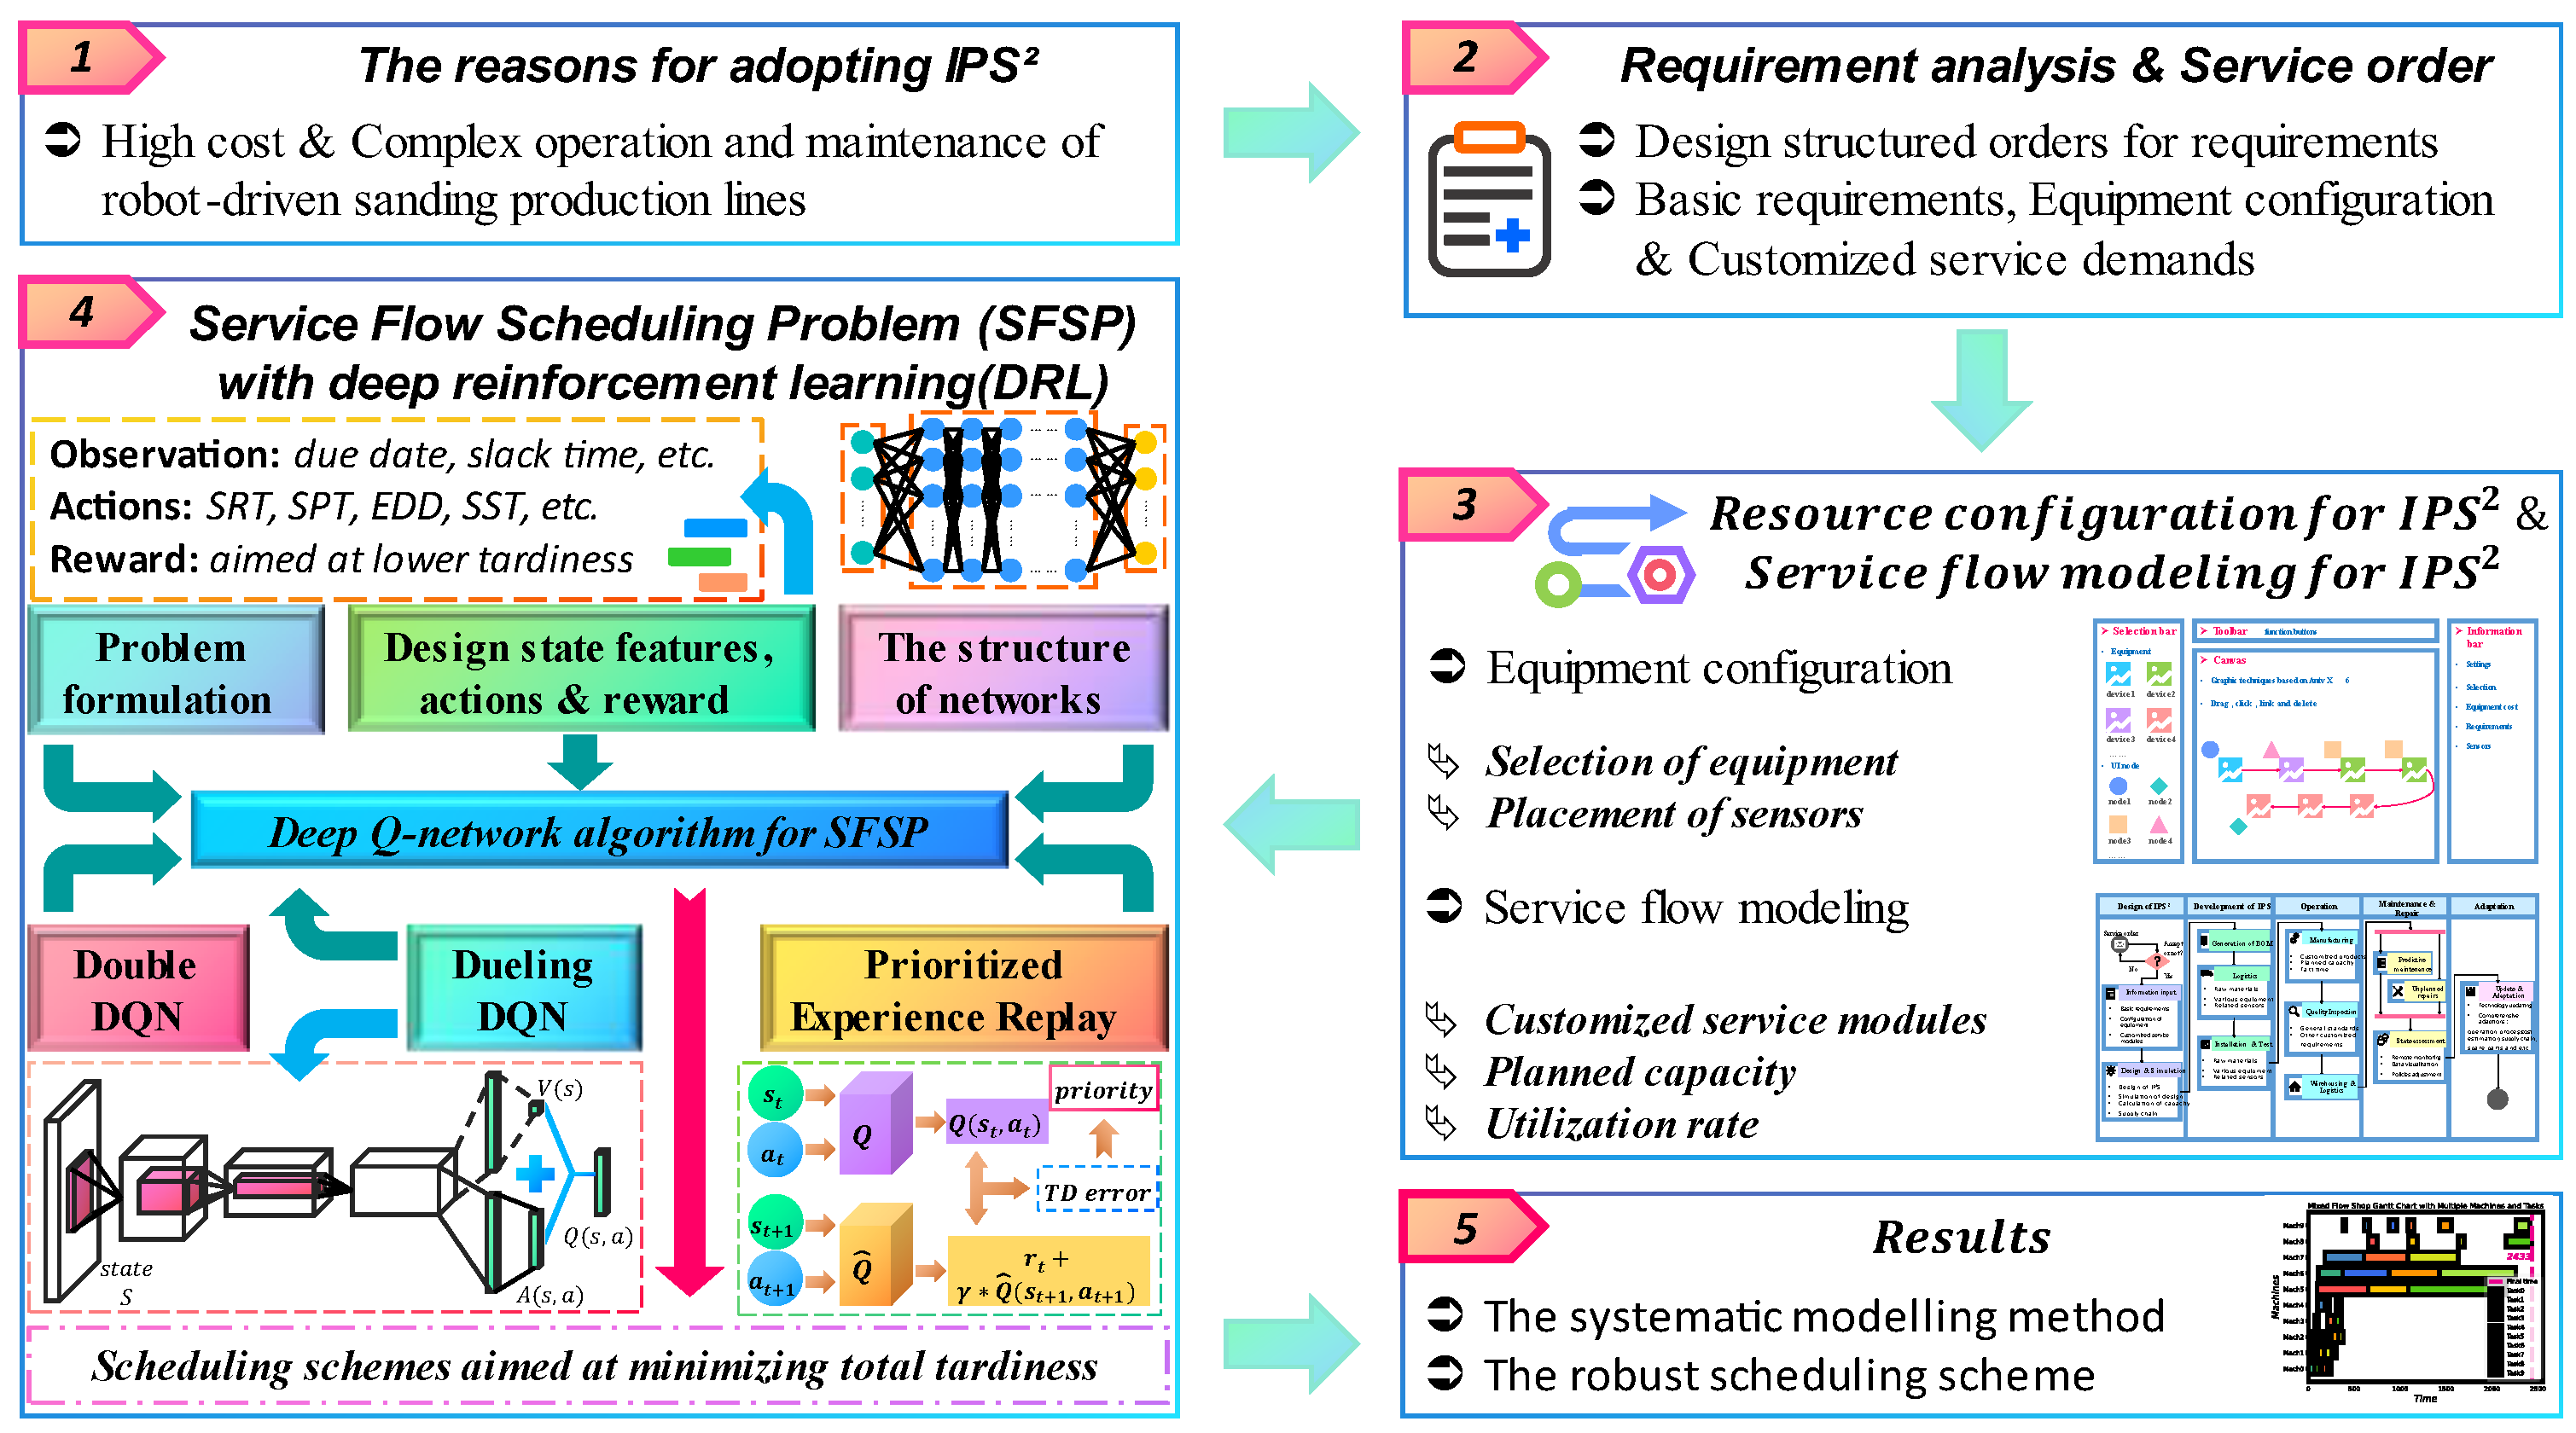
2 design, especially consisting of the equipment configuration, the service flow modeling, and the scheduling optimal method for service activities. This paper takes the actual case study of robot-driven sanding processing lines as the object of study, and its overall architecture is shown in Figure 1. In the production process of traditional carbon anode sanding, employees have to endure not only high-intensity physical labor but also the harsh environment caused by a high level of dust. The application of robot-driven sanding processing lines can easily solve the problems of environment and efficiency; however, they are difficult to popularize due to the high cost and the complexity of operation and maintenance. In addition, the accompanying problem of multi-process parallelism of production requires appropriate planning and scheduling solutions. Hence, with the purpose of promoting the application of robot-driven sanding processing lines, this paper proposes an order-based, autonomous configuration, and flow-driven design approach for developing IPS2, together with a scheduling method for service activities based on deep reinforcement learning.
Figure 1. The overall architecture of robot-driven sanding processing lines.
The main contributions of this paper can be listed as follows: (1) A comprehensive IPS2 design framework is proposed, which includes structured service order design, customized resource configuration, and fine-grained service flow modeling. (2) Aimed at solving the problem of multiple service flows in parallel during the delivery process of IPS2, a scheduling method based on deep reinforcement learning is proposed. (3) The design framework and scheduling method proposed are based on the foundation of a real industrial case of robot-driven sanding processing lines, and the results of the IPS2 design using this framework are supported by the relevant data concerning this case.
The remainder of this paper is organized as follows: Section 2 gives a brief overview of the existing studies related to this paper. Section 3 provides a detailed explanation of the modeling method and the scheduling method proposed in this paper. Section 4 elaborates a practical case study to verify the performance of methods proposed in Section 3. Section 5 discusses the main achievements and potential research directions of proposed methods, and the conclusions are summarized in Section 6.

3. Methodology

The main implementation flow of the methodology is shown in Figure 2.
Figure 2. The main implementation flow of the methodology.

3.1. Service Flow Designing

As is known, workflow scheduling is strongly concerned in cloud computing services. Meanwhile, the Job Shop Scheduling Problem (JSSP) highlights the disjunctive graph. Considering that IPS2 contains production and service activities, we propose the service flow to describe its fine-grained processes. Nevertheless, the specific demands of customers and the detailed resource configuration should be fully considered in advance.

3.1.1. Service Order Design

Accurately identifying customized requirements, especially hidden ones, throughout the product life cycle and transforming them into specific characteristics is highly significant for PSS design []. Modularization is pivotal in PSS development for supporting and addressing individual conceptual design []. Therefore, we divide the order into three sections to comprehensively capture customers’ requirements, including the basic requirements, the equipment configuration, and the customized service modules. Under the background of robot-driven sanding processing lines, the information that needs to be collected in the structured service order for IPS2 is extremely abundant. In the basic requirements section, the information on production, service, and other details in the manufacturing field must be recorded. In the equipment configuration section, not only the main equipment used for the sanding carbon anode can be selected by customers according to the product specifications and process requirements, but also the auxiliary equipment and workshop layout. Considering the diverse demands in the delivery process of IPS2, various services for the carbon anode and the processing line are optional in the customized service modules. The mapping of the service order to the robot-driven sanding processing line is shown in Figure 3. The specific requirements of the IPS2 designed for robot-driven sanding processing lines can be perceived by the suppliers of IPS2 in-depth through the use of the above information, and they are crucial to the subsequent design.
Figure 3. Mapping of the service order to the real industrial case.

3.1.2. Resource Configuration

PSS must be systematically configured to attain the desired benefits for manufacturers and industrial customers []. With increasing attention to individualized demands, configuring an appropriate product–service with complex constraints becomes more challenging due to service uncertainties []. We propose a resource configuration method for IPS2, which can configure the detailed equipment and service resources utilizing the interface techniques of graphic editing. Different from the detailed and often complex models created in the existing software like Siemens Plant Simulation or AnyLogic, the proposed method emphasizes visualization and simplification in the configuration phase, aiming to be more intuitive and accessible as a complementary approach. The realization of the proposed method is shown in Figure 4. The graphic elements, representing different equipment of IPS2, are displayed on the left side of the interface, which can be dragged into the canvas to set the relevant information. The canvas drawn should match the information from service orders, especially regarding the selection of devices. In addition, in order to meet the demands of customized process monitoring, one special element is also displayed on the left selection bar, named the UI node, which is designed for the configuration of various sensors. When taking the robot as an example, in addition to the required and inherent monitoring information such as position, torque, and current, users can configure relevant sensors to monitor temperature and vibration information themselves. Similarly, the customized configuration of service resources can be realized by connecting the detailed resource information, primarily technicians, kits, and spare parts, to certain services. After the settings of all elements are completed, the whole canvas can be saved into a database in JSON format. The details of the proposed resource configuration method can be seen in Figure 5.
Figure 4. Configuration of IPS2 based on graphic techniques.
Figure 5. Realization of the proposed IPS2 resource configuration method.

3.1.3. Service Flow Modeling

The modeling of individual business processes for the delivery of IPS2 is essential, requiring a wide range of process types, from production to maintenance, to ensure smooth and economically feasible IPS2 operation []. We propose a service flow modeling method of IPS2 supported by an extended UML Activity Diagram (Figure 6), which can concretely describe the operation of both the production and service activities. The graphic techniques mentioned above are also applied in service flow modeling, and some additional details can be added, such as the precedence constraints, the waiting time, the fork conditions, and the join conditions. Unlike Digital Twins, MES, and PLM systems, which offer solutions for product design and manufacturing processes, IPS2 puts forward a new framework that can support comprehensive customer solutions, flexibly respond to specific requirements, and encourage value-added services. The proposed method of service flow modeling is presented in Figure 7. Both the activity nodes and the basic elements of the UML Activity Diagram are available in the left selection bar. The icons in the left selection bar can be dragged into the different swim lanes in the canvas, as well as linked with each other. The detailed information of each element can be set or changed in the right information bar when clicked. The information bar contains the estimated costs and the planned capacity per month based on the previous data from the database. The selectable edited information of estimated costs and planned capacity is saved in the database to overwrite the previous data or just in this service flow. Particularly, the icon ‘Sanding Production’ represents quite a complex activity, including several detailed subtasks, which can be added to a son diagram for the sake of clearer description. However, the modeling of service flow is not arbitrary, as the service orders and the equipment configuration of IPS2 must be strictly complied with.
Figure 6. Service flow of IPS2 based on the UML Activity Diagram.
Figure 7. Realization of the proposed IPS2 service flow modeling method.

3.2. Service Flow Scheduling

Planning and scheduling is a broad thematic area involving manufacturing and service industries []. In real-world scheduling problems, the environment is so dynamic that much of the information is usually unknown in advance []. While ERP, MES, and SCADA systems excel in managing resources, executing manufacturing processes, and supervising control and data acquisition, respectively, the IPS2 focuses on integrating products and services to create value-added solutions that are tailored to specific customer needs. This paper proposes a method for service flow scheduling problems (SFSPs) of IPS2, adopting the deep reinforcement learning algorithm and aiming at minimizing the total tardiness of IPS2 service flows.

3.2.1. Markov Decision Process

A Markov Decision Process (MDP) is a model used in situations with uncertain outcomes to guide sequential decision making [], and it is the basis of reinforcement learning []. Similarly, the planning and scheduling problems are generally aimed at searching for the best strategy to obtain the most return, and this process can be described by MDP. MDP is the interaction between agents and the environment, which can be generally represented by a five-tuple [ S , A , P , γ , R ] . From the perspective of scheduling problems, A can be seen as pre-defined dispatching rules, and S can be described by specific parameters based on the current condition of IPS2 service flows. Then, the main challenge lies in properly and comprehensively connecting SFSPs with MDP.

3.2.2. Problem Formulation

We have to attach importance to the delivery cycle, the service demands, the warehousing cost, and even more constraints in IPS2 due to its characteristics of servitization when solving its scheduling problems. Meanwhile, Just in Time (JIT) production aims to reduce waste and improve efficiency, which is regarded as an important production mode in industrial manufacturing nowadays. Therefore, the total tardiness of IPS2 service flows is the primary objective considered in this paper. Given the nature of IPS2, the scheduling of service flows can be considered as the Hybrid Flow Shop Scheduling Problem (HFSP), where the machines can be represented by the swim lanes, the processing sequences can be represented by service flows, and different processing times of operations can be represented by delivery cycles of service activities. In addition, state features, dispatching rules, and the reward function are all supposed to be reasonably designed to build the environment of reinforcement learning.
a.
State Features
In the reinforcement learning environment, the observation of state features helps the agent make decisions to take proper actions, which means that the more comprehensive state features can be used to obtain a more reasonable strategy of actions. We define 18 state features to describe the detailed characteristics of the SFSPs containing m service flows, g service groups, and n i ( i = 1 , 2 , , m ) service activities in each service flow, as follows:
  • The rate of service flows waiting to be started, r S F , as defined by r S F = W S F / m , where W S F means the number of service flows waiting to be started.
  • The total processing time of each service flow T P i   ( i = 1 , 2 , ,   m ) .
  • The remaining processing time of each service flow R P i   ( i = 1 , 2 , , m ) .
  • The slack time of each service flow S T i   ( i = 1 , 2 , , m ) , as defined by S T i = D D i R P i t e . Where: D D i   ( i = 1 , 2 , , m ) means the due date of each service flow; t e means the earliest available time for the next service group.
  • The estimated tardiness loss of all service flows E T D , as defined in Equation (1):
    E T D = i = 1 m E S A i i = 1 m R S A i
    where E S A i means the number of service activities estimated to be overdue in the i th service flow at the current step; R S A i means the number of remaining service activities in the i th service flow at the current step.
  • The actual tardiness loss of all service flows A T D , as defined in Equation (2):
    A T D = i = 1 m A S A i i = 1 m R S A i
    where A S A i means the number of overdue service activities in the i th service flow at the current step.
  • The completion rate of each service flow R S F i   ( i = 1 , 2 , · · · , m ) , as defined by R S F i = C S A i / n i , where C S A i means the number of completed service activities in the i th service flow.
  • The average completion rate of service activities R S A , as defined in Equation (3):
    R S A = i = 1 m C S A i i = 1 m n i
  • The utilization rate of each service group U S G k   ( k = 1 , 2 , · · · , g ) , as defined in Equation (4):
    U S G k = i = 1 m j = 1 C S A i P i j k J i j k t c k t s k   i = 1 , 2 , , m ; j = 1 , 2 , , n
    where P i j k means the processing time of the j th service activity in the i th service flow when assigned to the k th service group; J i j k decides whether the j th service activity in the i th service flow is assigned to the k th service group; t s k means the start time of the k th service group; t c k means the completion time of the last operation on the k th service group at the current step.
  • The actual tardiness of each service flow A T i   ( i = 1 , 2 , , m ) , as defined in Equation (5):
    A T i = 0 , t c i D D i t c i D D i , t c i > D D i
    where t c i means the time of the last operation completed in the i th service flow at the current step.
  • The estimated tardiness of each service flow E T i   ( i = 1 , 2 , , m ) , as defined in Equation (6):
    E T i = 0 , S T i 0 S T i , S T i < 0
At last, we choose the mean and standard deviation of the T P i , R P i , S T i , R S F i , A T i , E T i and U S G k , together with original values of the E T D , A T D , r S F , and R S A as 18 state features of the SFSPs.
b.
Dispatching Rules
The Priority Dispatching Rule (PDR) is a general scheduling method, that provides various processing sequences based on different state features in scheduling problems. Considering that tardiness is the prime factor, 10 dispatching rules are set in the action set of SFSP, which is shown in Table 2.
Table 2. The dispatching rules in the action set of SFSP.
c.
Reward Function
The reward function should be designed reasonably to improve the efficiency and effectiveness of reinforcement learning. As the objective of SFSP proposed in this paper is minimizing the tardiness of service flows, the reward function is preferably capable of reflecting the changing of total tardiness at each step. Additionally, considering that the reward may be sparse in the early stage of scheduling and the utilization rate is an important factor in evaluating resource efficiency, the average utilization rate of service groups is set as the reward reference to increase differentiation and performance. The reward function takes the importance of these characteristic quantities into account and can be divided into three parts, which are listed in Equations (7)–(10).
t o t a l   r e w a r d = r a + r e + r u
r a = 0 , A T D n e x t = A T D c u r r e n t = 0 20 , A T D n e x t = A T D c u r r e n t > 0 100 , A T D n e x t > A T D c u r r e n t
r e = 0 , E T D n e x t = E T D c u r r e n t = 0 20 , E T D n e x t = E T D c u r r e n t > 0 10 , E T D n e x t < E T D c u r r e n t 100 , E T D n e x t > E T D c u r r e n t
r u = 0 , U S G ¯ n e x t > 0.95 U S G ¯ c u r r e n t 5 , U S G ¯ n e x t > 0.9 U S G ¯ c u r r e n t 10 , U S G ¯ n e x t 0.9 U S G ¯ c u r r e n t
where t o t a l   r e w a r d means the reward of the current step; r a means the reward related to A T D ; r e is related to E T D ; r u is related to the average utilization rate U S G ¯ ; A T D n e x t   &   A T D c u r r e n t , E T D n e x t   &   E T D c u r r e n t and U S G ¯ n e x t   &   U S G ¯ c u r r e n t mean the A T D ,   E T D ,   U S G ¯ at the next step and the ones at the current step.

3.2.3. Deep Reinforcement Learning

The Deep Q-Network (DQN) algorithm is a value-based method that adopts the deep neural network to approximate the Q-value function, which differs from the Q-table used in traditional Q-learning algorithms. The application of deep neural networks is capable of reducing the storage space and improving the generalization ability. The application of experience replay, target network, and ε -greedy strategy technology make the DQN remarkably successful in various applications. Considering the overestimation in DQN, the Double DQN uses two Q-networks, one to search for the action with the maximum Q-value and the other one to obtain the Q-value of this action. The difference between DQN and Double DQN can be seen in Equations (11) and (12). Intending to promote the efficiency and stability of the algorithm, the Dueling DQN divides the Q-function into two parts: the state value function V ( s ) and the advantage value function A ( s , a ) . The state value function is applied to estimate the absolute values of states and the advantage value function for the advantage value of each action. The output of these two functions can be combined to obtain the Q-value in a certain way.
DQN :   Q t a r g e t = r t + γ max a Q ^ ( s t + 1 , a )
DDQN :   Q t a r g e t = r t + γ Q s t + 1 , a r g max a Q ( s t + 1 , a )
a.
Network Architecture
The Q-network in this paper has three kinds of layers, encompassing the input layer, the output layer, and several hidden layers. Generally, the number of nodes in the input layer is supposed to be the same as the number of state features, and the one in the output layer should be the same as the number of actions. The structure of the hidden layers depends on the complexity of the problems to be dealt with. In addition, the online Q-network and the target Q-network in DQN have the same architecture. The architecture of the Double DQN is no different from that of DQN. Additionally, the architecture of the Dueling DQN is somewhat different, as there are individual hidden layers and output layers for the state value V and the advantage value A . The output layer of the state value network consists of one node, and one advantage value network matches the available actions. The structure of the input layer and the public hidden layers are unchanged. In addition, to solve the instability arising from the split of the Q-value, the combination of the state value and the advantage value can be modified, as shown in Equation (13).
Dueling   DQN :   Q s , a = V s + A s , a 1 N a A ( s , a )
where N means the number of available actions.
b.
Other Parameters and Settings
Besides the architecture of DRL, some other parameters and settings must be designed carefully. In experience replay, the minibatch size is generally set as a power of 2, and the max length of the buffer should be large enough to store sufficient experiences for training. The initial ε in the ε -greedy strategy is set to a high value to enhance exploration and continuously decreases as the training progresses. The discount factor depends on the emphasis placed on the long-term return, and they are positively correlated. The frequency of updates of the target network is also important because a too-low frequency leads to low efficiency and a too-high one leads to instability. The online network generally updates tens of times more frequently than the target network. The learning rate is also significant in training effectiveness. For complex scheduling problems, we can initially set it as 10−4 and use the Adam optimizer for adaptive adjustment. The priority of experience can be defined as ( T D e r r o r + α ) β , where T D e r r o r means the temporal difference error at the current step; α is a const, generally set as 10−4 or 10−5; β is generally a const between 0 and 1, but in this paper, we would set it gradually change from 0.5 to 1 by β = e x p a x + b to avoid a high frequency of sampling unstable experiences stored at the early stage of training. Priority is also stored in the replay buffer as an important factor in determining the sampling probability when obtaining the minibatch. In addition, a kind of coefficient for priority is proposed in this paper called C p , which increases the probability of sampling experiences with some special transformation of certain state features. The details about C p can be seen in Equation (14). Similarly, this coefficient also gradually decreases to prevent overfitting and instability.
C p = C p a , A T D c u r r e n t = 0   a n d   A T D n e x t > 0 C p e , E T D c u r r e n t = 0   a n d   E T D n e x t > 0 C p u , A T D n e x t > A T D c u r r e n t > 0   o r   E T D n e x t > E T D c u r r e n t > 0
c.
The Modified DQN Algorithm
Considering that the Double DQN and the Dueling DQN mentioned before are variants of the DQN designed to promote performance and stability, we take the whole realization process of the DQN as an example. The details of the modified DQN in this paper are presented in Algorithm 1 below. Additionally, the overall framework is presented in Figure 8.
Algorithm 1. The Training Method of the Modified DQN
Input: the environment and the structure of DQN
Output: the trained model of DQN
1. Initialize the experience replay buffer D to capacity N
2. Initialize the online network Q with random weights θ
3. Initialize the target network Q ^ with weights θ = θ
4. For episode = 1 : M  do
5.   Initialize the state sequence s 1 as the feature vector 1 = s 1
6.   For  t = 1 : T  do
7.   Select an action a t using the ε -greedy policy
8.   Take action a t , obtain reward r t and obverse next state s t + 1
9.   Calculate the priority with TD error
10.    Multiple the priority by the coefficient C p if the conditions are met
11.    Store the experience ( s t , a t , r t , s t + 1 , d o n e , p r i o r i t y ) in D
12.    Sample mini-batch of experiences from D with proportional sampling
13.    If the episode terminates at step j + 1  do
14.     y j = r j
15.    Else
16.     y j = r j + γ max a t + 1 Q ^ ( j + 1 , a t + 1 ; θ )
17.    Update the online network Q parameters θ with gradient descent
18.    If  t % C = 0 ( C means the target network update frequency)
19.    Update the target network Q ^ parameters θ = θ
20.  End for
21. End for
Figure 8. The overall framework of the modified DQN algorithm.

4. Case Study

In recent years, robots have emerged as the workhorse of modern industrial production and advanced manufacturing facilities globally, especially in repetitive or hazardous tasks [,], such as industrial robots in automatic forging processing lines [] and vision-aided robots in welding tasks []. In this paper, we take the robot-driven sanding processing line as a practical research case, which is used to sand prebaked carbon anodes in a severely dusty environment. The approach to designing an industrial product service system for a robot-driven sanding processing line is studied in detail. In the meantime, a scheduling method for service flows in the delivery stage of IPS2 based on deep reinforcement learning is proposed.

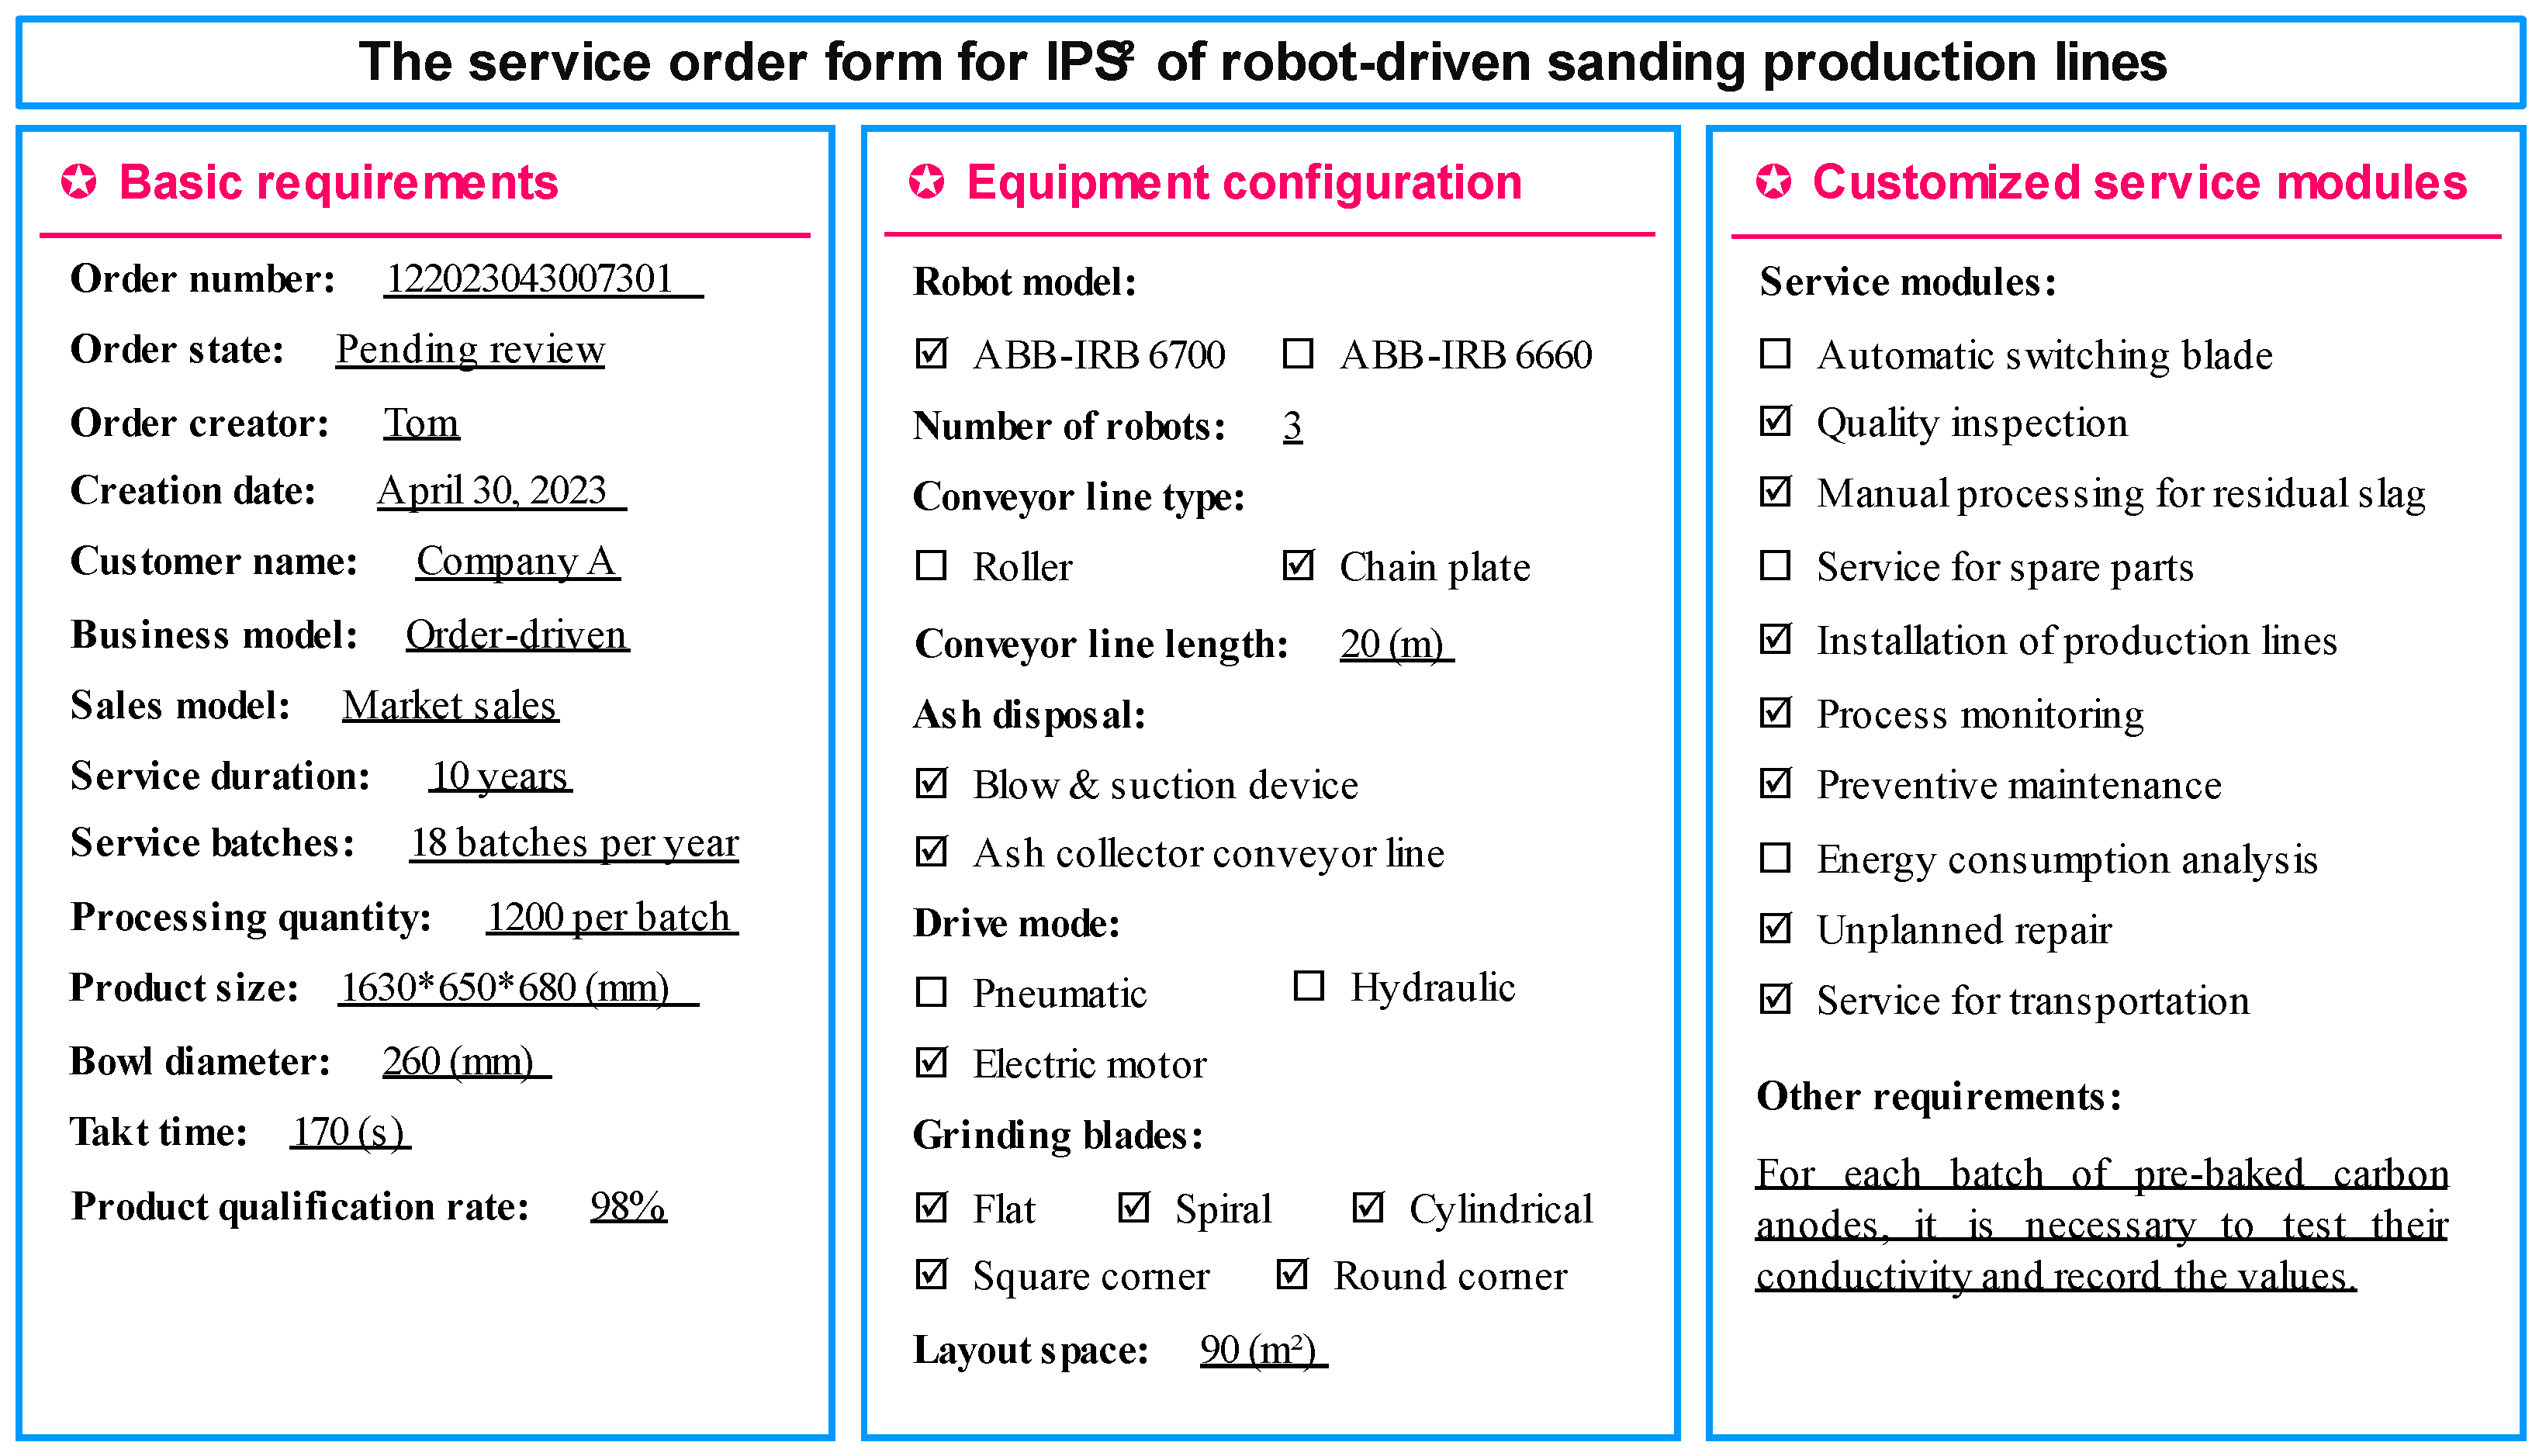
4.1. IPS2 Service Order

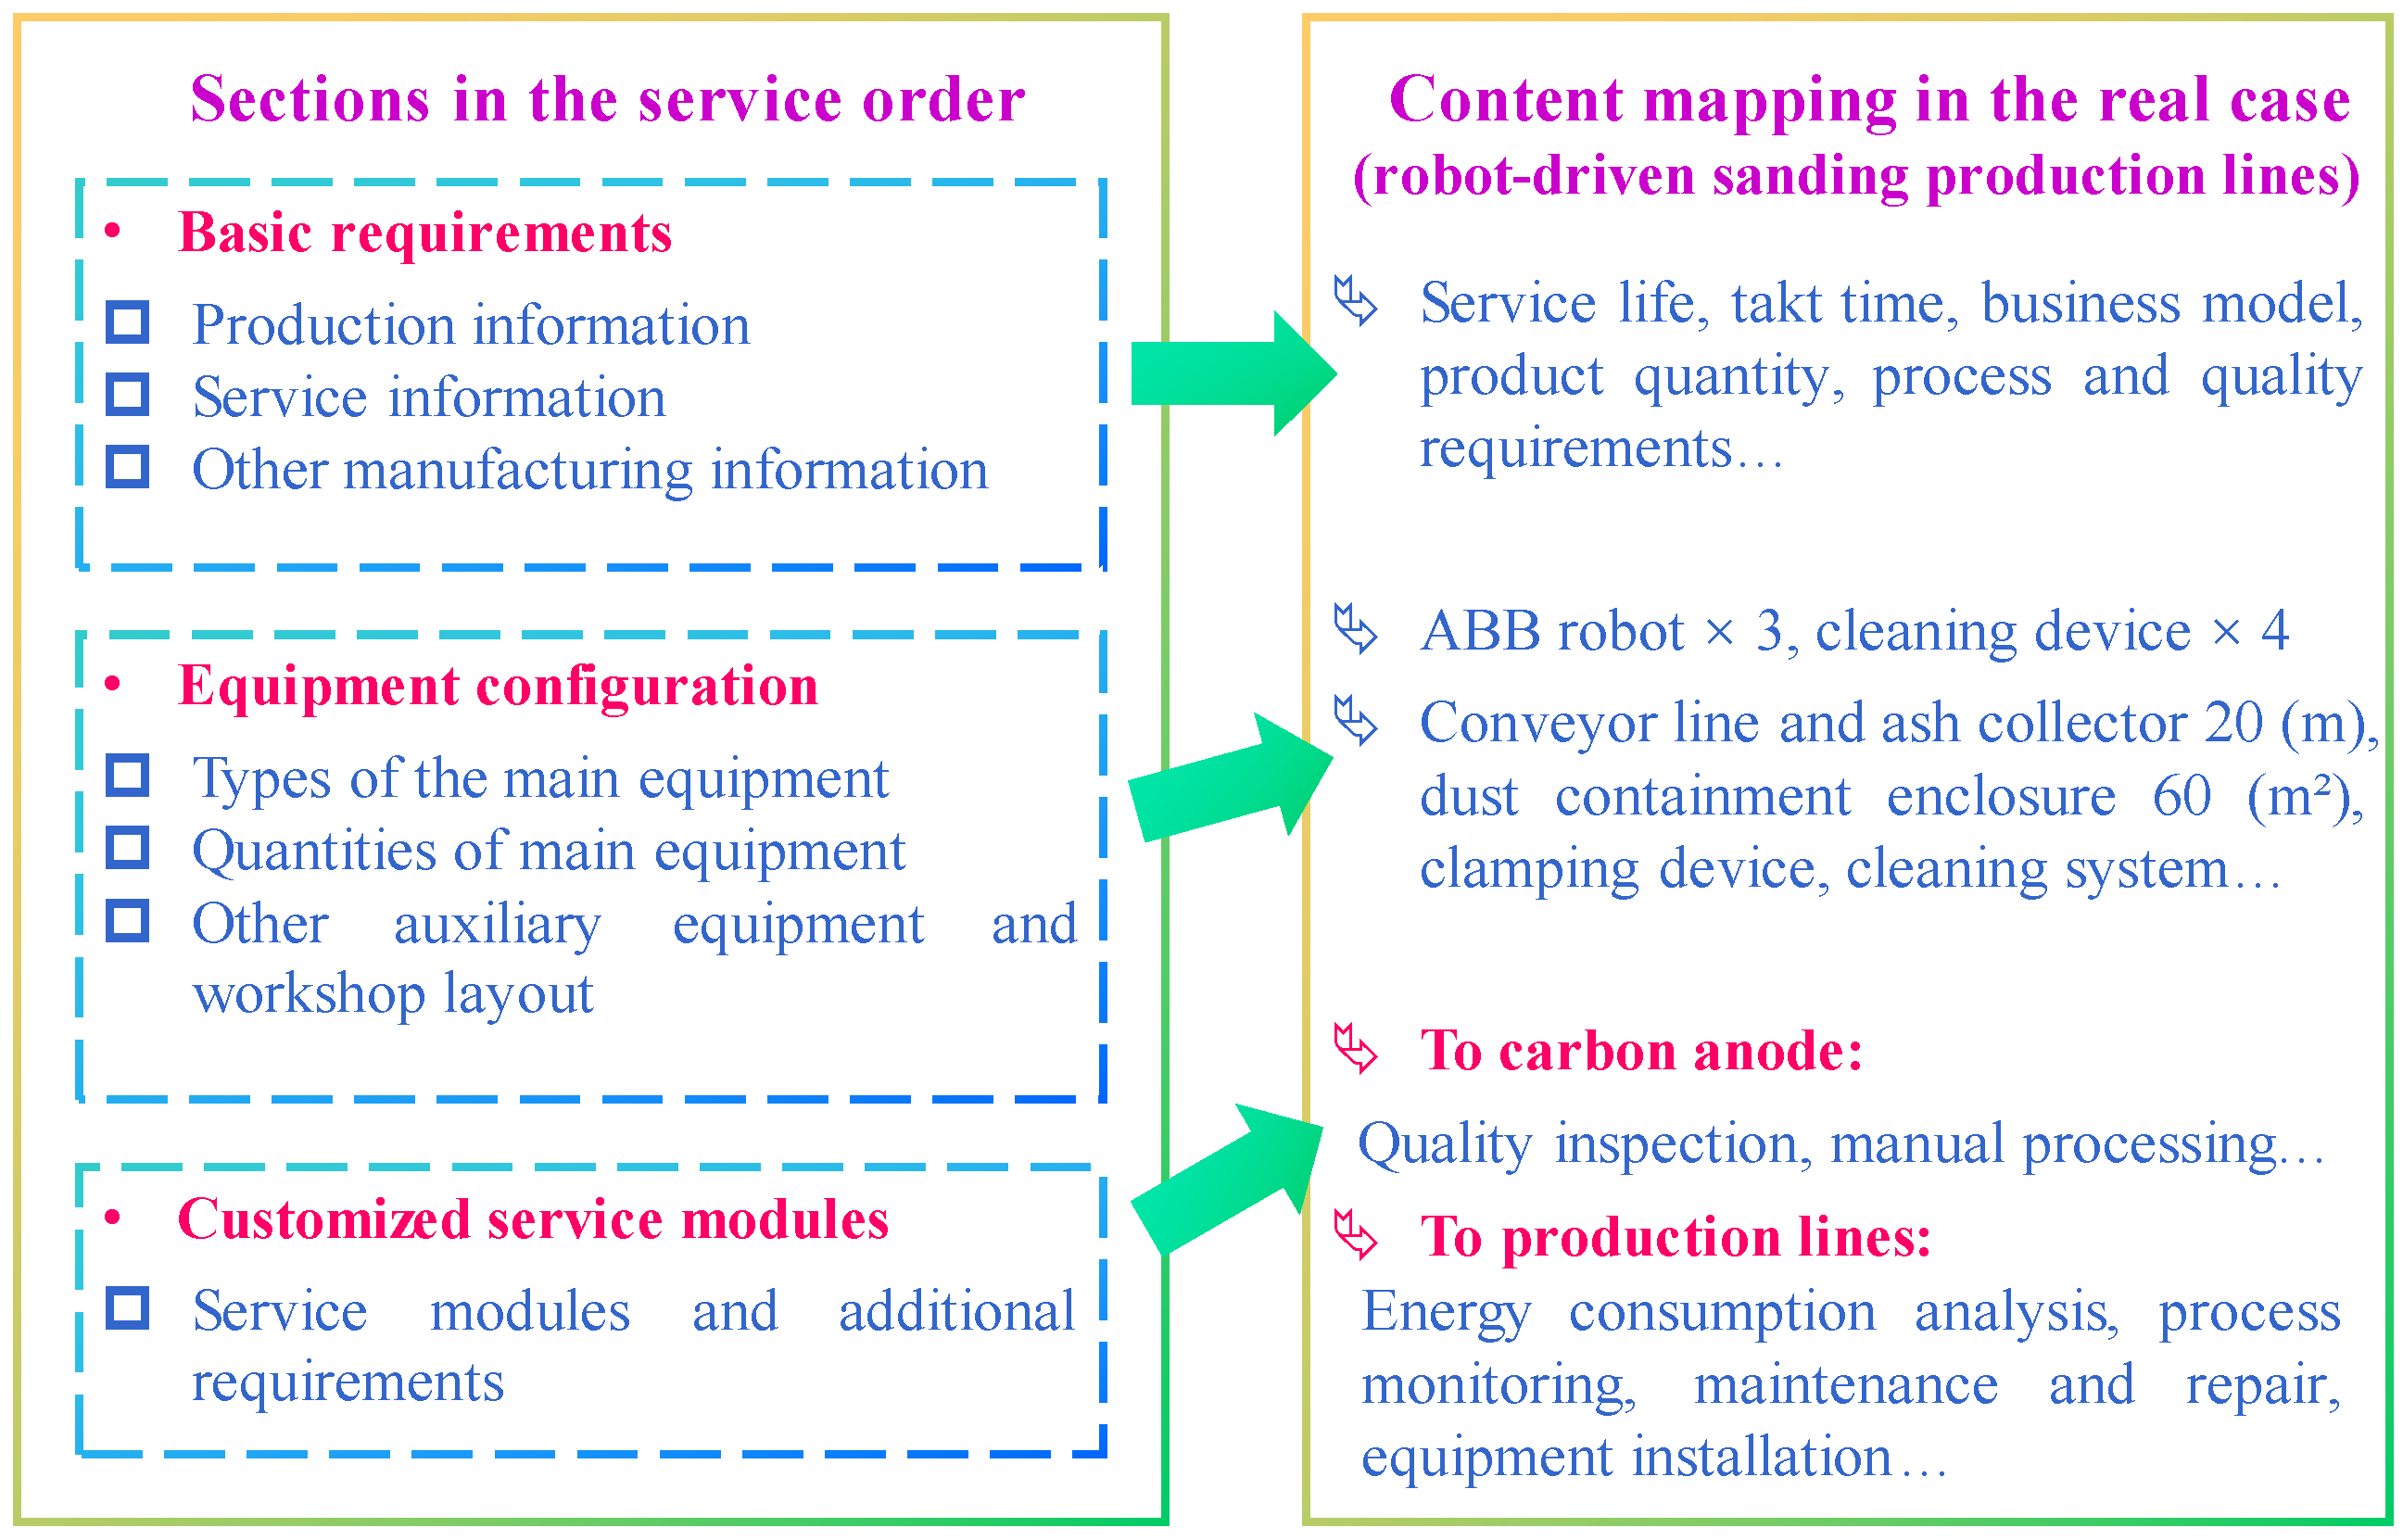
On account of the different requirements of prebaked carbon anodes that need to be sanded, developing an industrial product service system solution for the robot-driven sanding processing line is beneficial for those customers with a history of long-term cooperation. Service orders are the foundation for implementing IPS2 design and development, which includes specific demand information such as hardware selection, production capacity planning, machining features, delivery cycles, and additional services. In IPS2 robot-driven sanding processing lines, the specific content of the order design is divided into three parts according to the method mentioned: basic requirements, equipment configuration, and customized service modules. A case for the proposed service order can be seen in Figure 9.
Figure 9. A case for the service order proposed for IPS2 of robot-driven sanding processing lines.

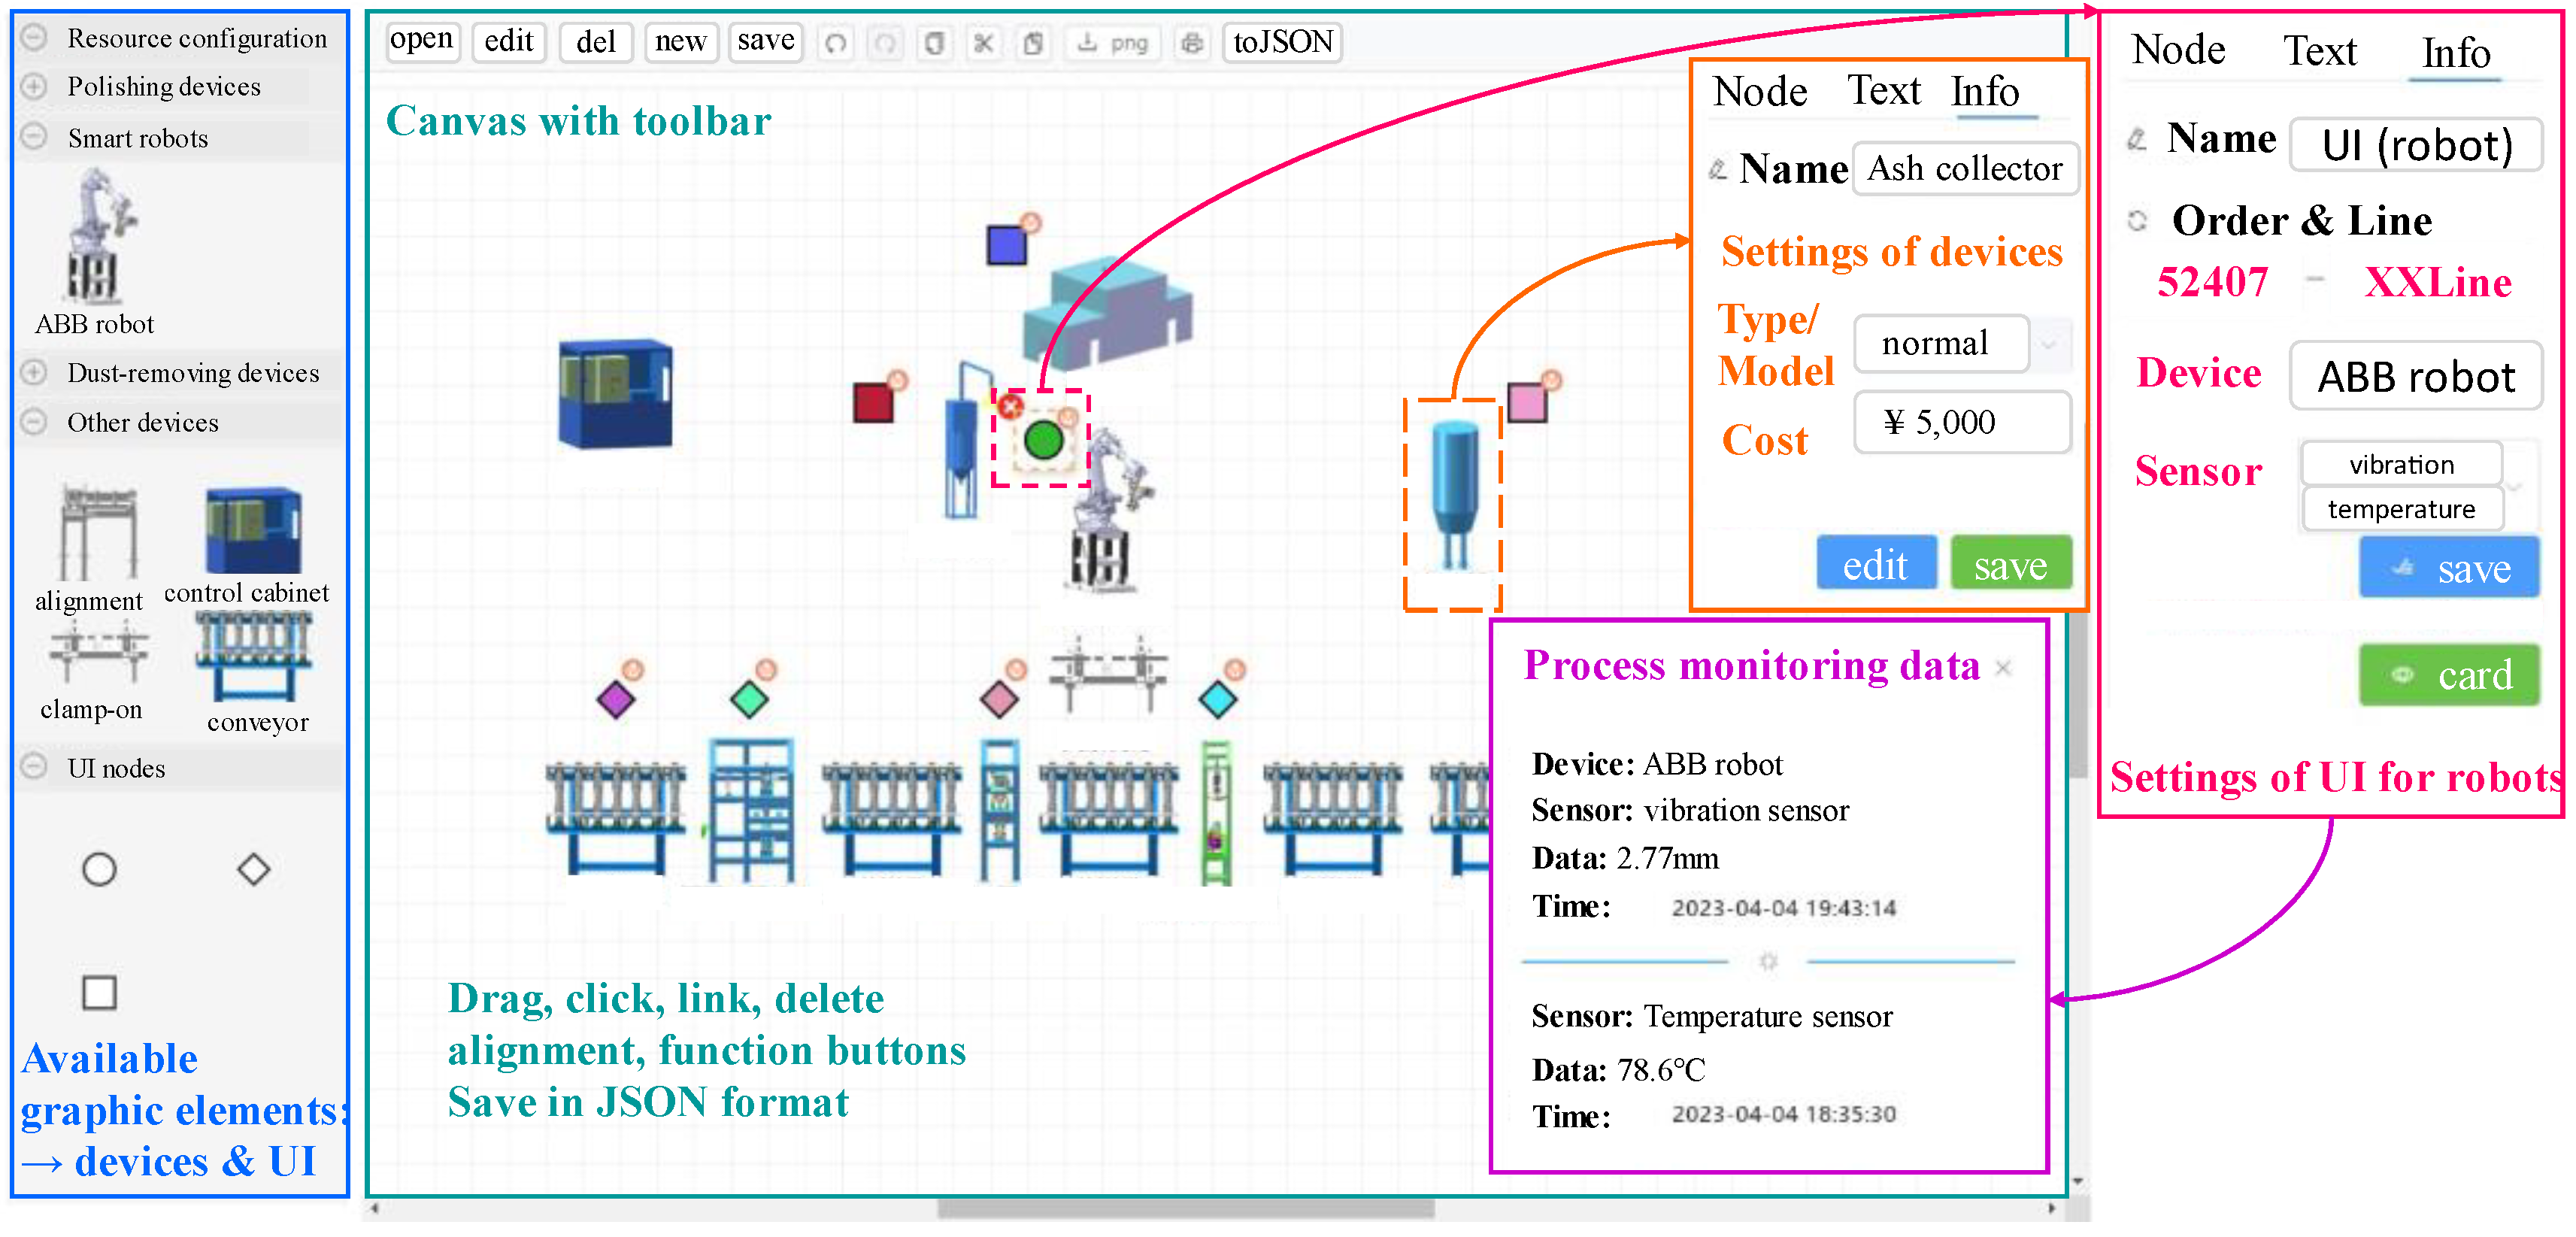
4.2. IPS2 Resource Configuration

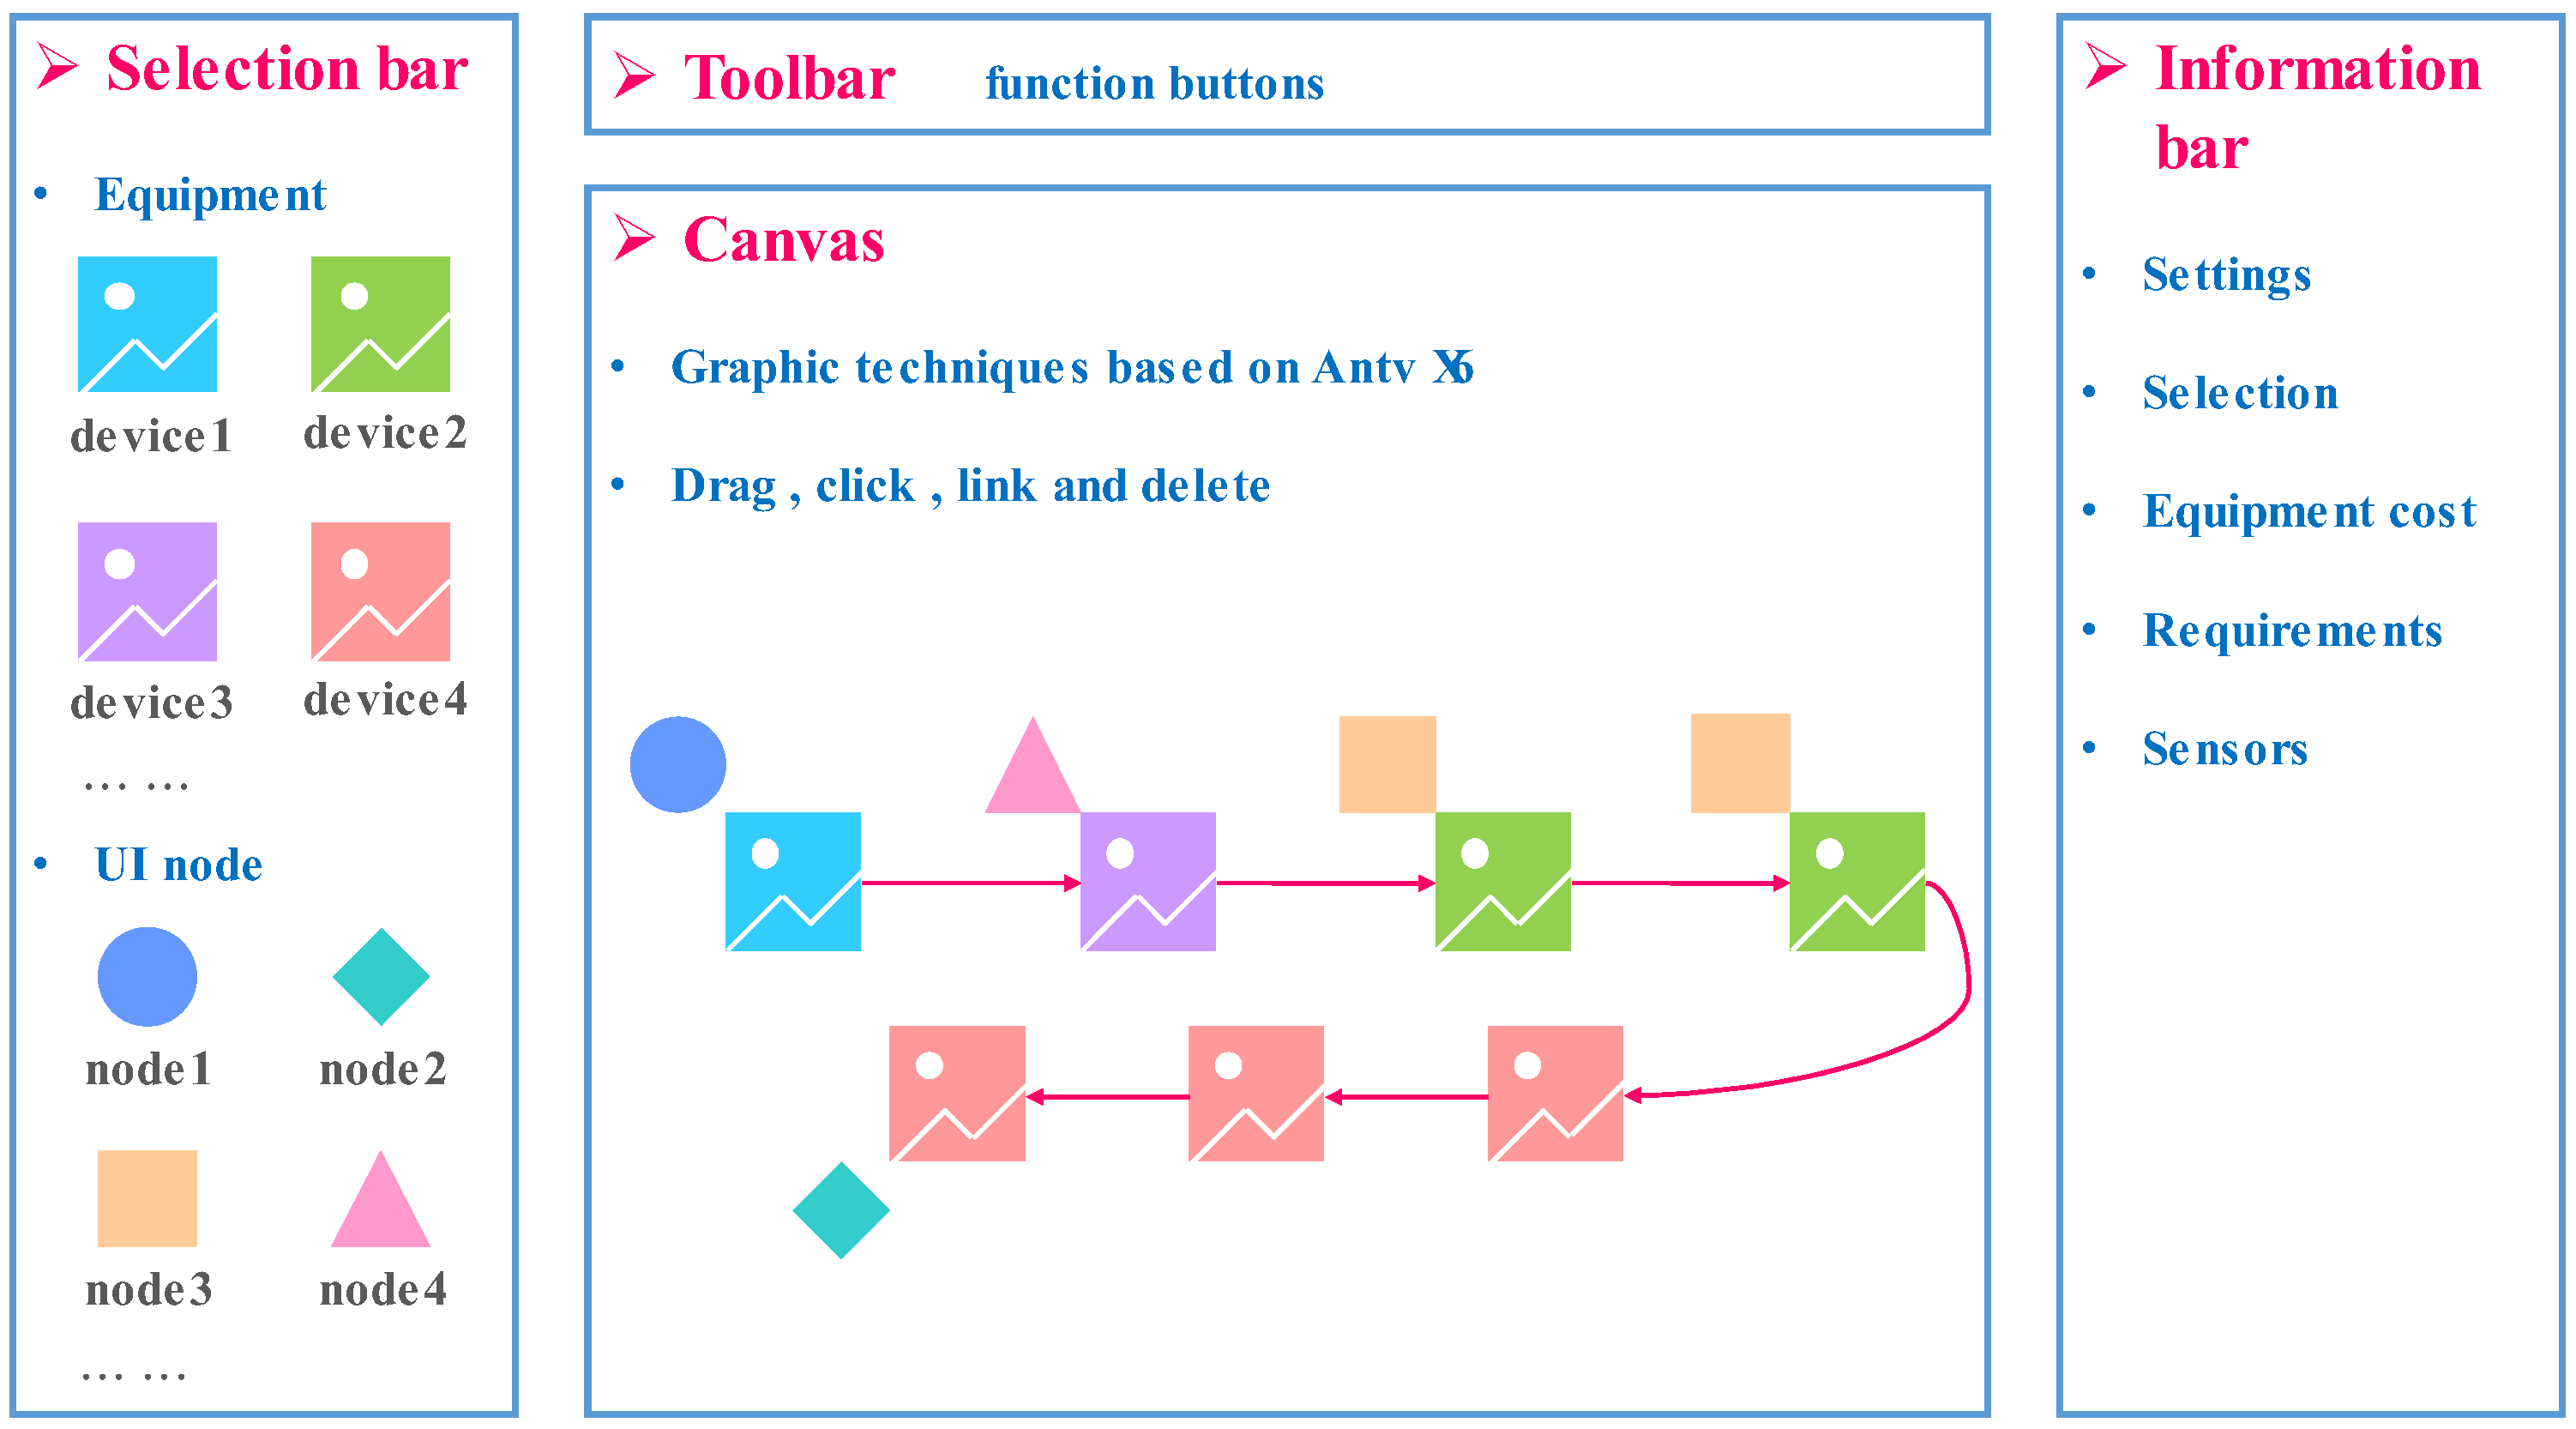
This industrial case uses the interface technology of graphic editing to perform detailed resource configuration of robot-driven sanding processing lines. Firstly, the canvas of resource configuration is supposed to be bound to the service order. Then, the graphic elements can be dragged into the canvas, including the main equipment/service activities of robot-driven sanding processing lines and the UI nodes. The detailed information on each graphic element can be edited in the information bar, which contains the selection of types, the equipment cost, and the different demands of sensors in the configuration of equipment resources. For instance, if an element named ‘Ash collector device’ in the canvas is clicked, the information bar on the right of the canvas can jump to the detailed information setting, where the different types and equipment costs obtained from the database are available for selection.
Some special elements are appended with extra details describing their quantities or dimensions, such as area and length. Additionally, the information bar relating to the UI nodes is quite different. The equipment and the types of sensors can be selected in the information bar of the UI nodes to satisfy various requirements in terms of data visualization and real-time monitoring. For example, the UI node for the ash collector device can select the temperature sensor since it has been equipped with the gas flow sensor and the gas pressure sensor in advance. If the processing line bound to the equipment configuration canvas has been put into operation, a data card can pop up when clicking the UI node, and the sensor data can be updated in real time. The realization case of the configuration of equipment resources for IPS2 of robot-driven sanding processing lines can be seen in Figure 10. In the aspect of service resources, the configuration process is similar to that of equipment resources. Using the ‘Sanding Production’ activity as an example, the service resources should include technicians, kits, spare parts, and extra devices, as detailed in Table 3.
Figure 10. The equipment configuration for IPS2 of robot-driven sanding processing lines.
Table 3. The service resources for the ‘Sanding Production’ activity.

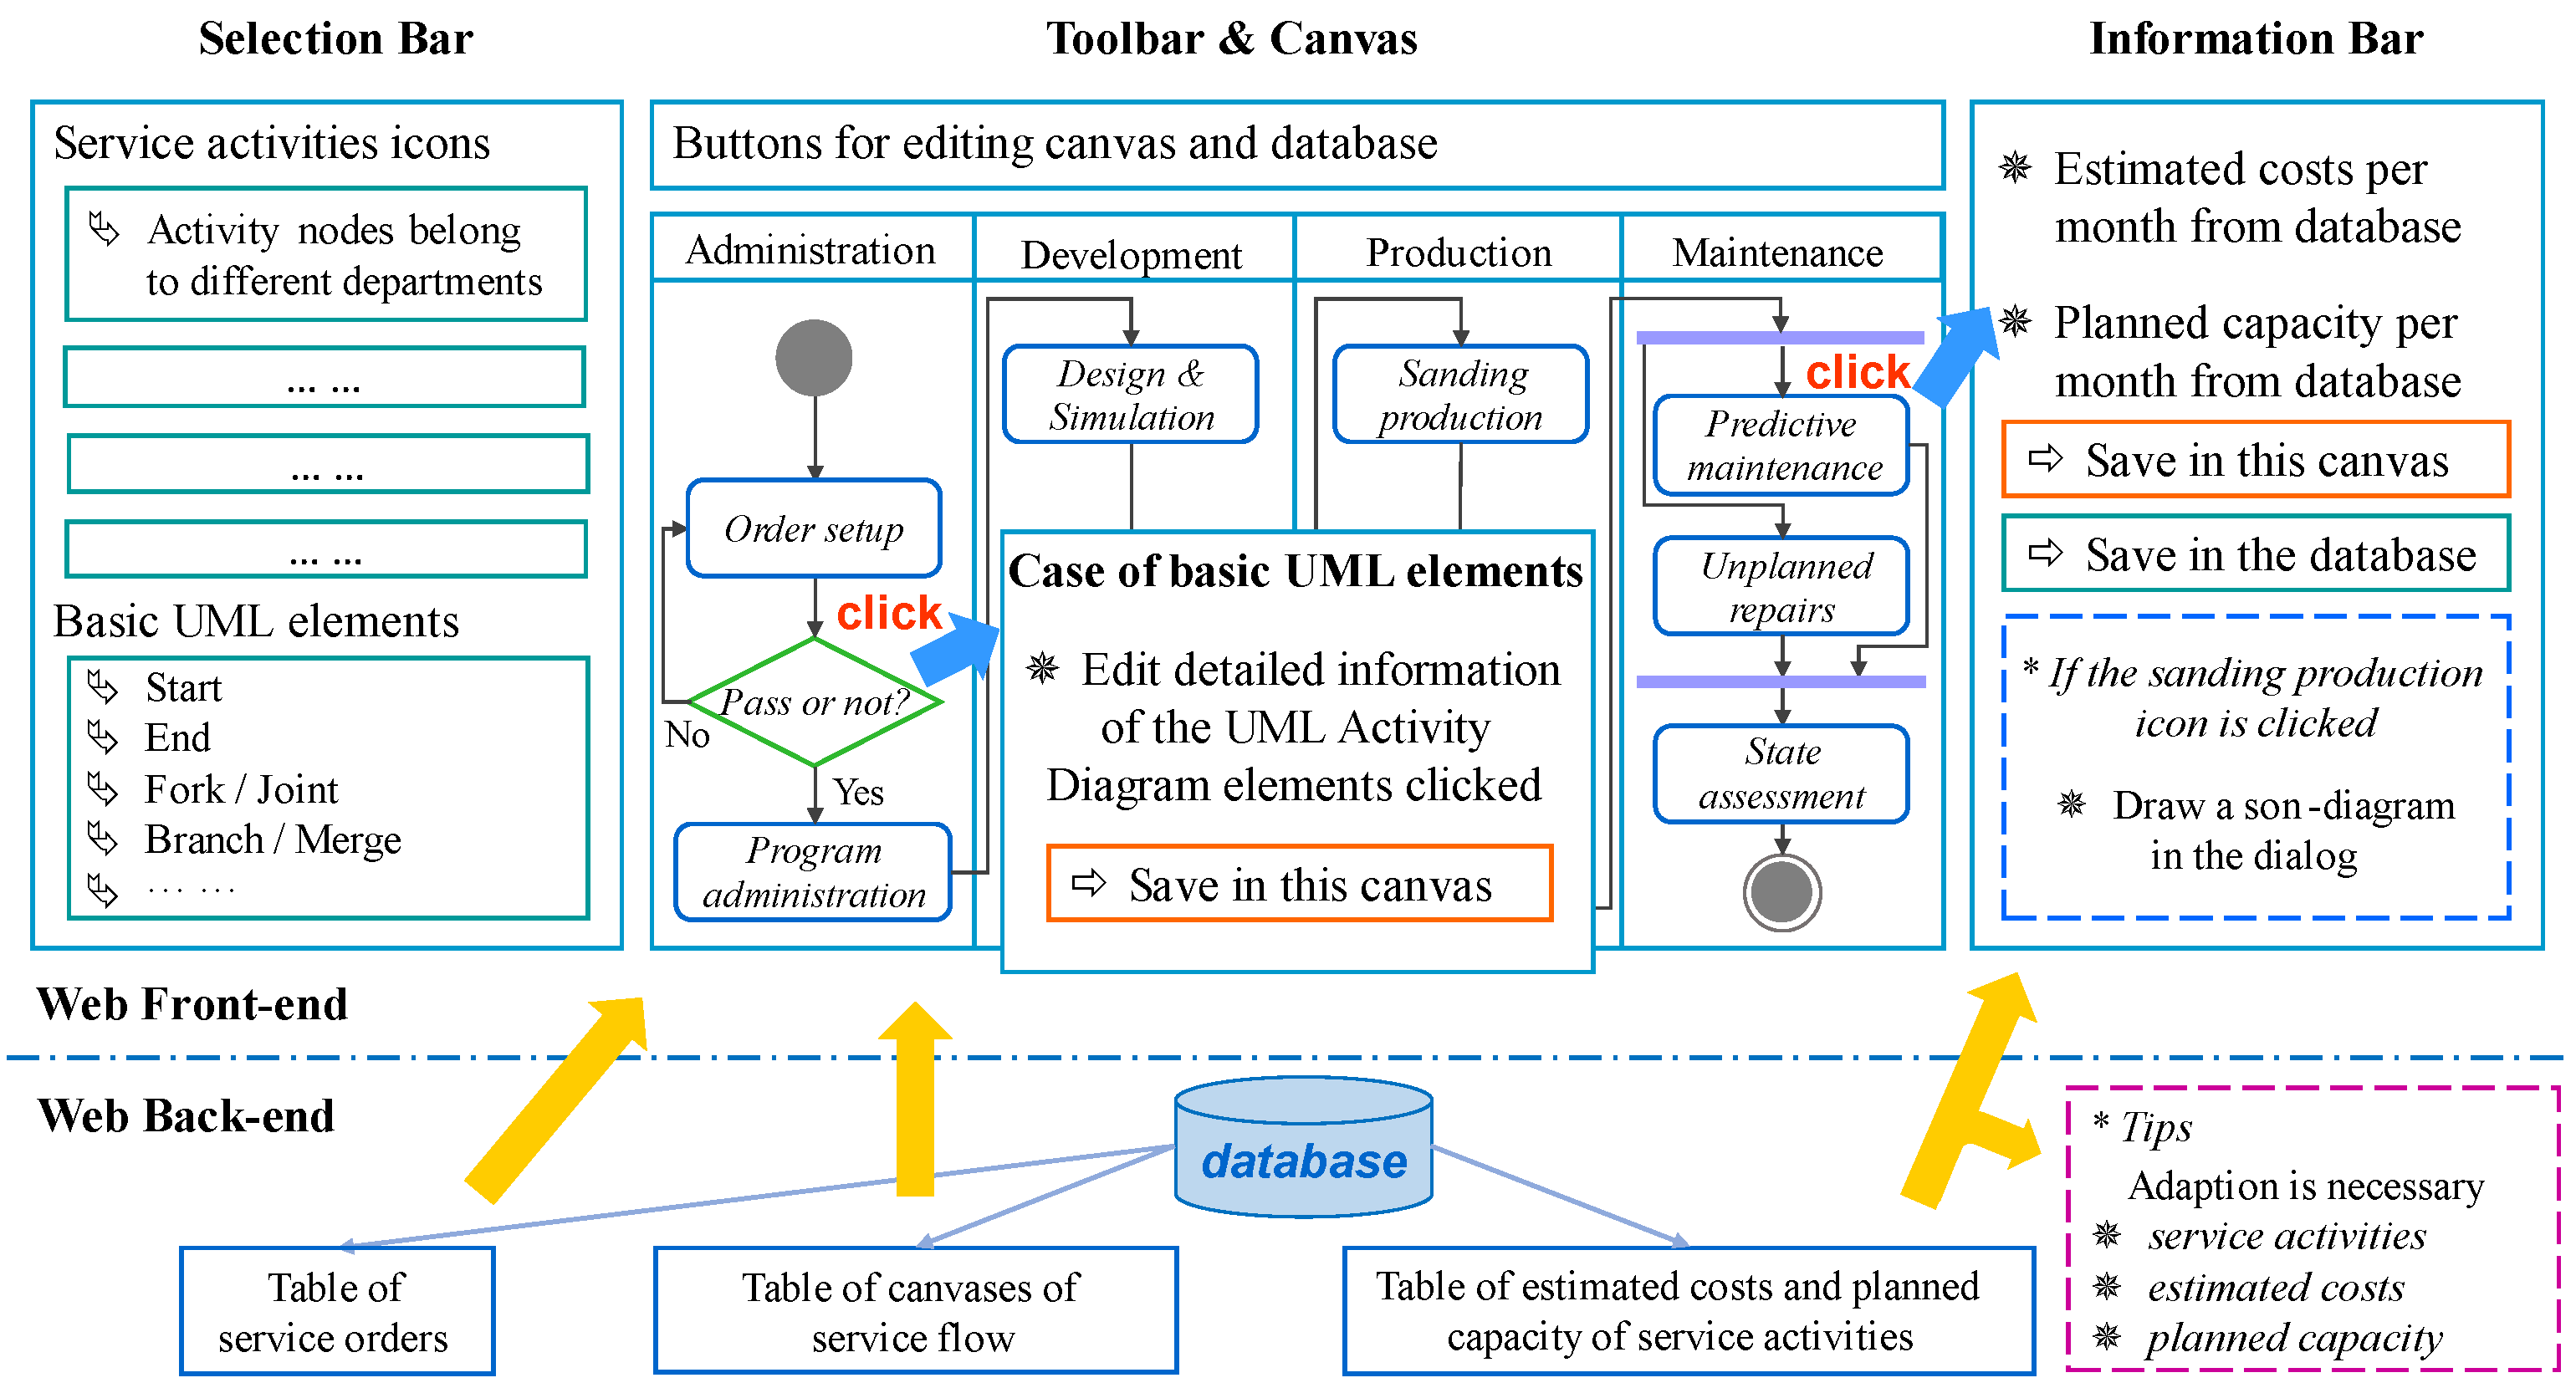
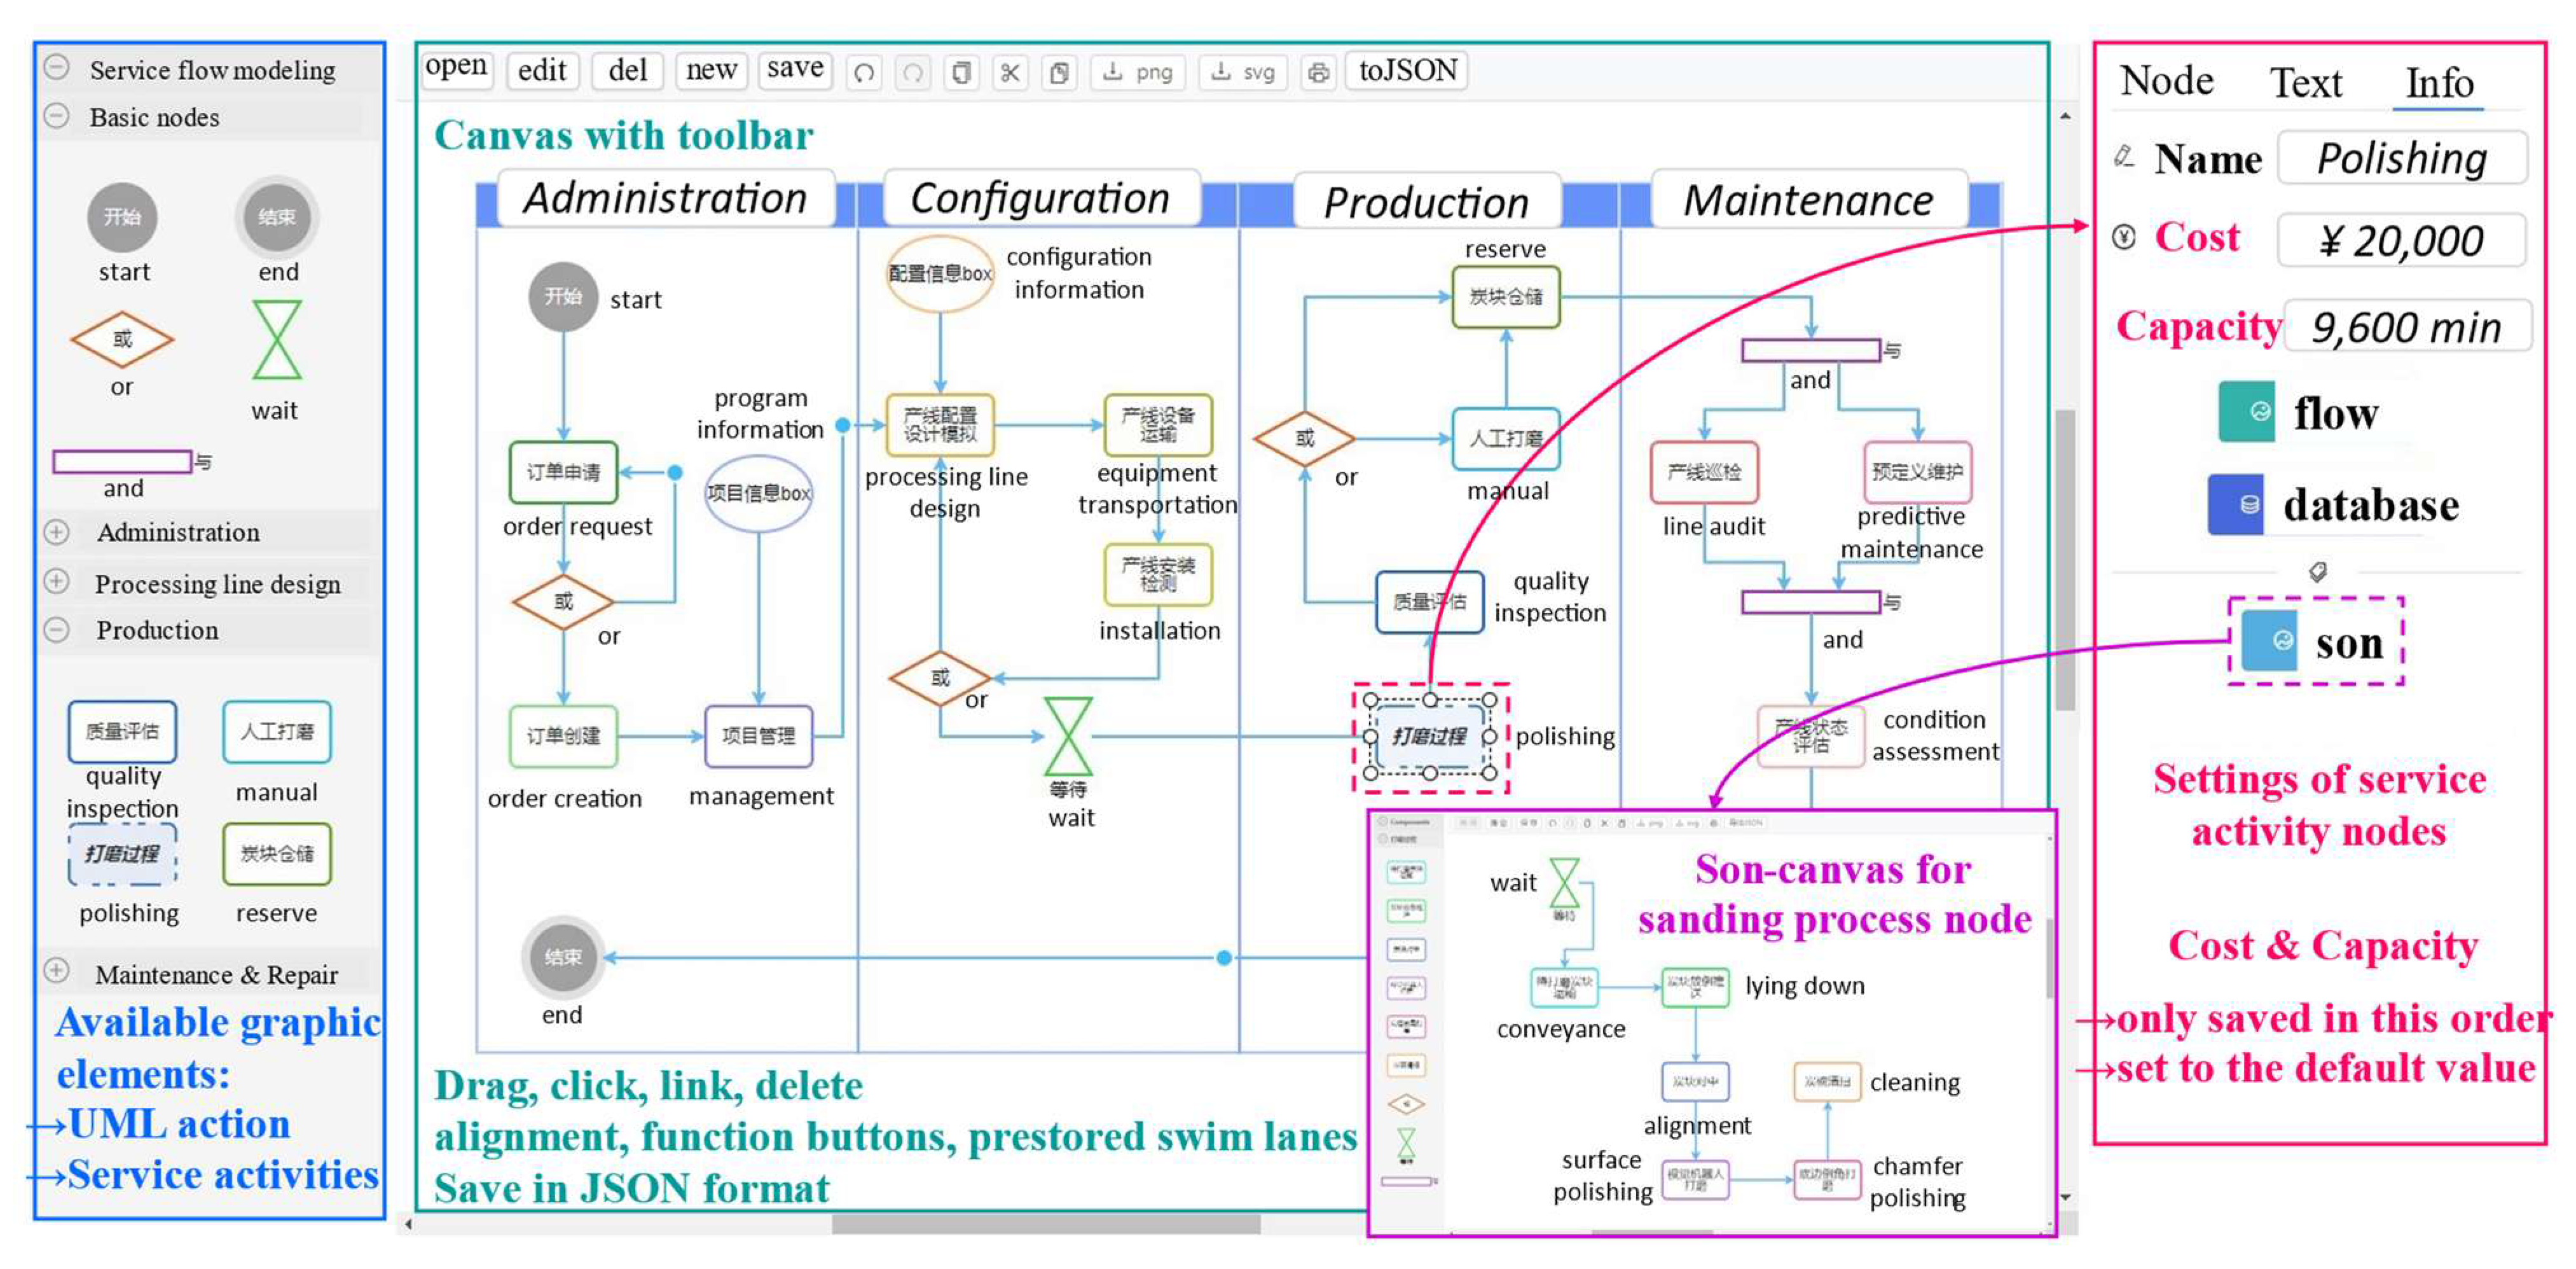
4.3. IPS2 Service Flow

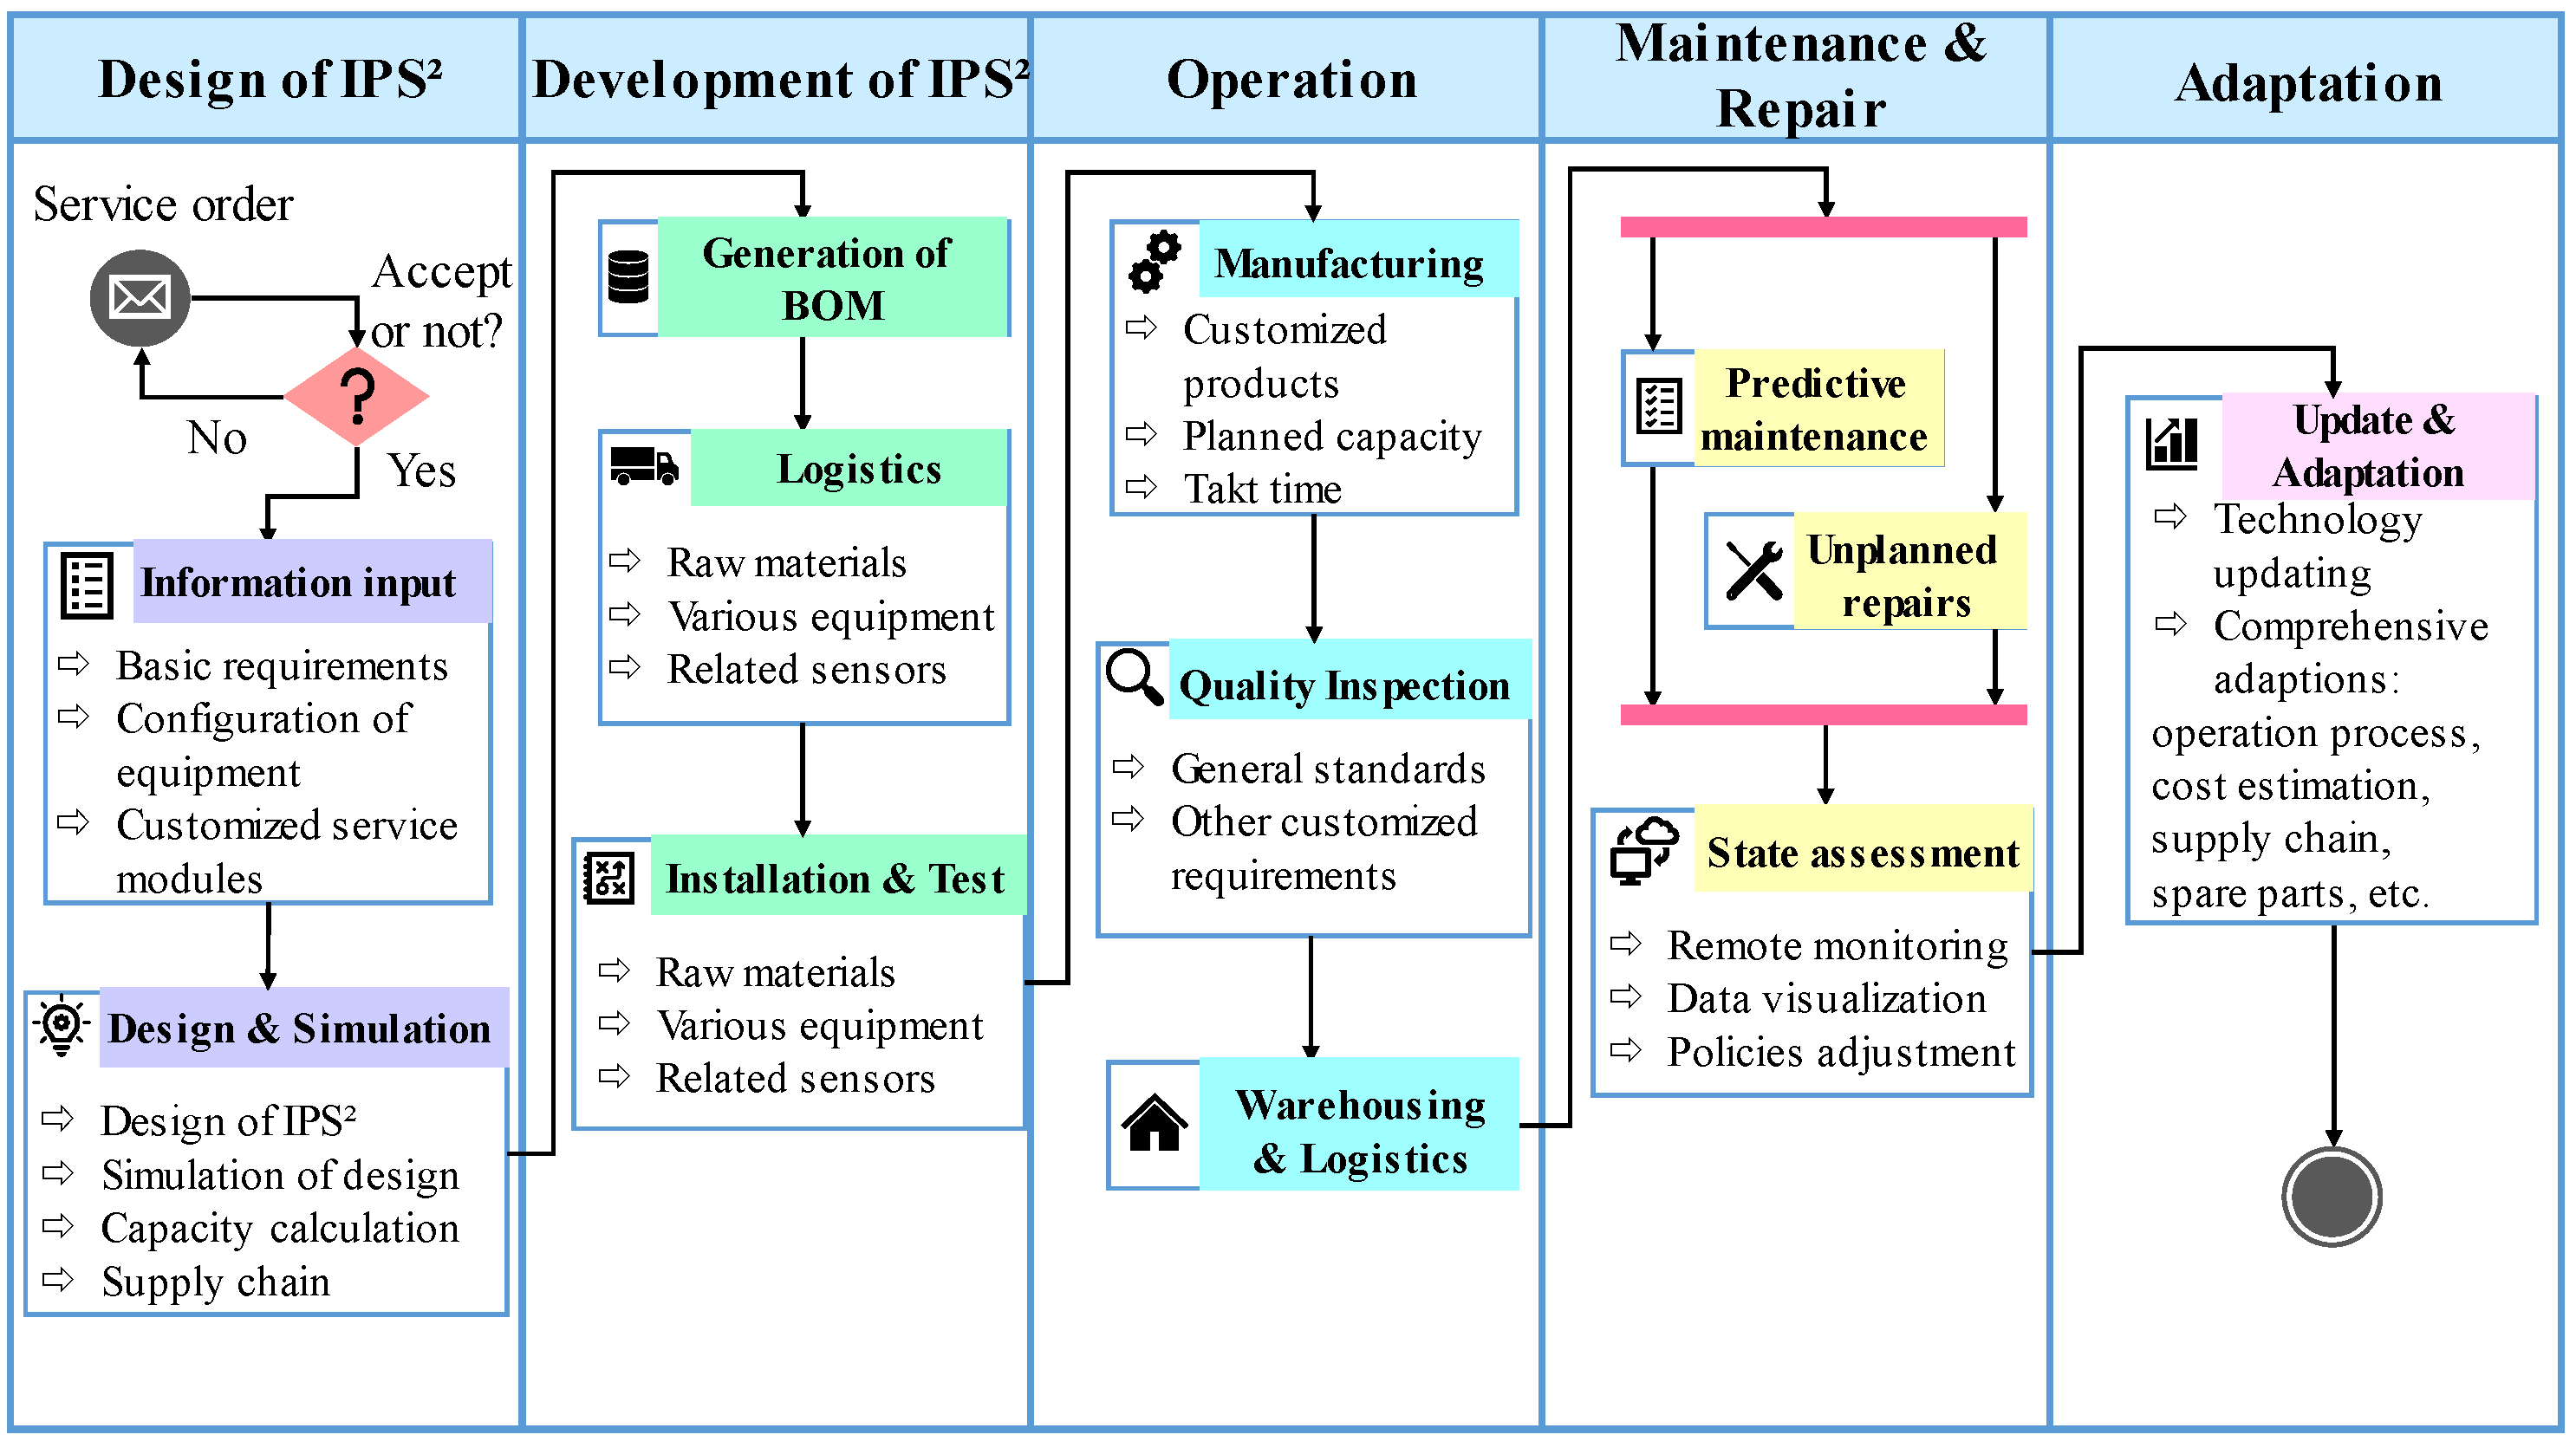
After the completion of the service order design and the resource configuration of IPS2, the service flow can be designed based on the concrete service activities in the whole life cycle of robot-driven sanding processing lines. In this industrial case, the main activities include the order setup, the program administration, the design and simulation of processing lines, the logistics of equipment needed, the installation and test of processing lines, the production of sanded prebaked carbon anodes, quality inspection, product warehousing, the predictive maintenance of processing lines, the unplanned repairs of sudden equipment failure, and the state assessment of processing lines. The process of service flow design still adopts graphic technologies to realize the extended UML Activity Diagram. The elements named by main service activities are divided into four parts by different departments, called the swim lanes, including the administration department, the design and development department, the production department, and the maintenance and repair department. We can drag the graphic elements into the swim lanes in the canvas, connect them, and edit detailed information containing the estimated capacity and cost so that a service flow for IPS2 can be modeled in a fine-grained form. The realization case of the service flow modeling for the IPS2 robot-driven sanding processing lines can be seen in Figure 11.
Figure 11. The service flow modeling for IPS2 robot-driven sanding processing lines.

4.4. IPS2 Service Flow Scheduling

In the real case of robot-driven sanding processing lines, a considerable number of orders for prebaked carbon anodes are waiting to be completed. The finite resources should be arranged properly and fully utilized to maximize benefit. In this section, we first try to solve SFSP based on the modified DRL algorithm, and then we conduct some comparison experiments to verify the effect of our scheduling method. These numerical experiments are implemented in PyCharm 2022.1.4 and run on a PC with 2.10 GHz 12th Gen Intel (R) Core (TM) i7-12700 CPU and 16 GB RAM.

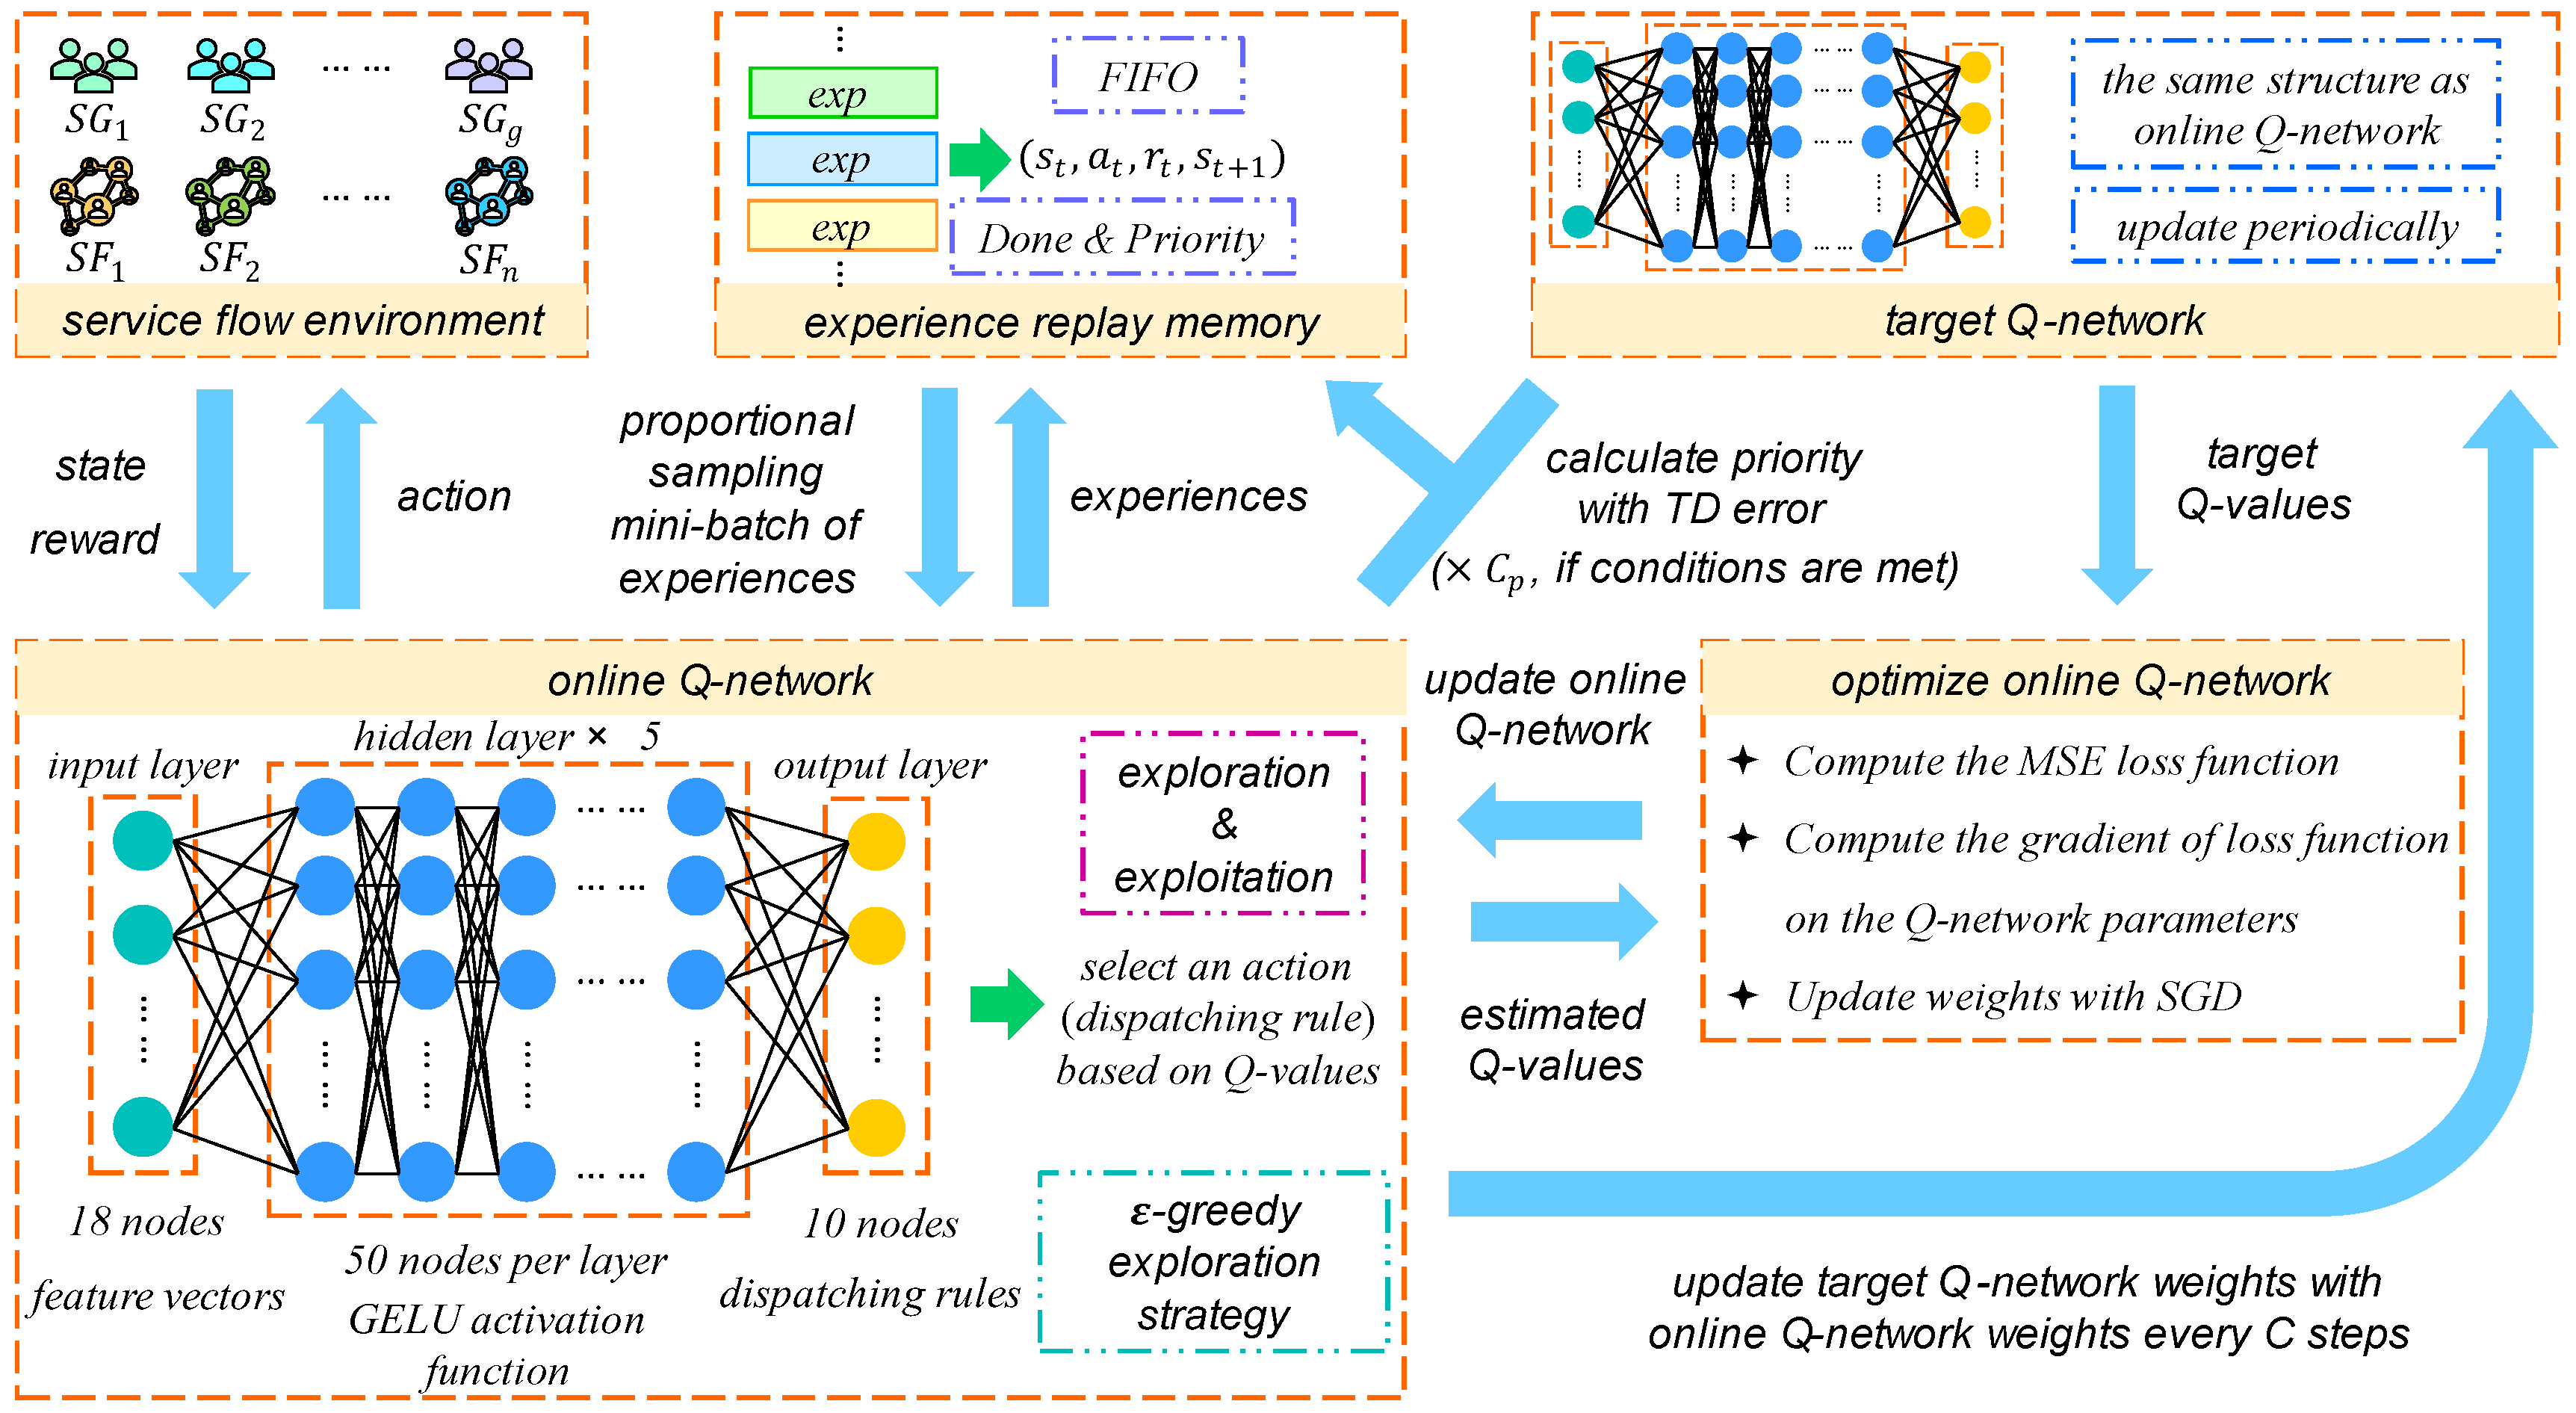
4.4.1. Settings and Hyperparameters

Under the background of robot-driven sanding processing lines, we designed a service flow scheduling problem with 10 service flows and 10 service groups, and these groups belong to the four different departments mentioned before. The processing time of each service activity in service flows is randomly generated with some constraints, where the ‘Production’ activity ( S A 3 ) takes the longest time during the whole service flow, and the processing time of the ‘Maintenance & Inspection’ activity ( S A 4 ) is approximately 10% to 30% of the ‘Production’ activity. Considering that minimum tardiness is our goal, we set the due date of each service flow as 2.4 times its duration. In addition, all service flows waiting to be scheduled arrive simultaneously. After experiments on network structure, the number of hidden layers in the Q-Network is set to 5, and the number of nodes in each hidden layer is 50. The ‘GELU’ activation function is applied to hidden layers. Meanwhile, the input layer contains 18 nodes, and the output layer contains 10 nodes, without any activation functions, to preserve the original state information and output actions from the DRL environment. Moreover, we adjust the method for calculating the priority of each experience to set the β as a low value (about 0.5) initially and gradually increase it to 1 to reduce potential instability and overfitting. The details of the hyperparameters can be seen in Table 4. Additionally, a case of processing time of service activities in service flows is listed in Table 5.
Table 4. Hyperparameters of DRL.
Table 5. A case of processing time of service activities in the service flow.

4.4.2. Experimental Results

We first test the performance of the single dispatching rule in the action set on solving the SFSP, and the results are listed in 
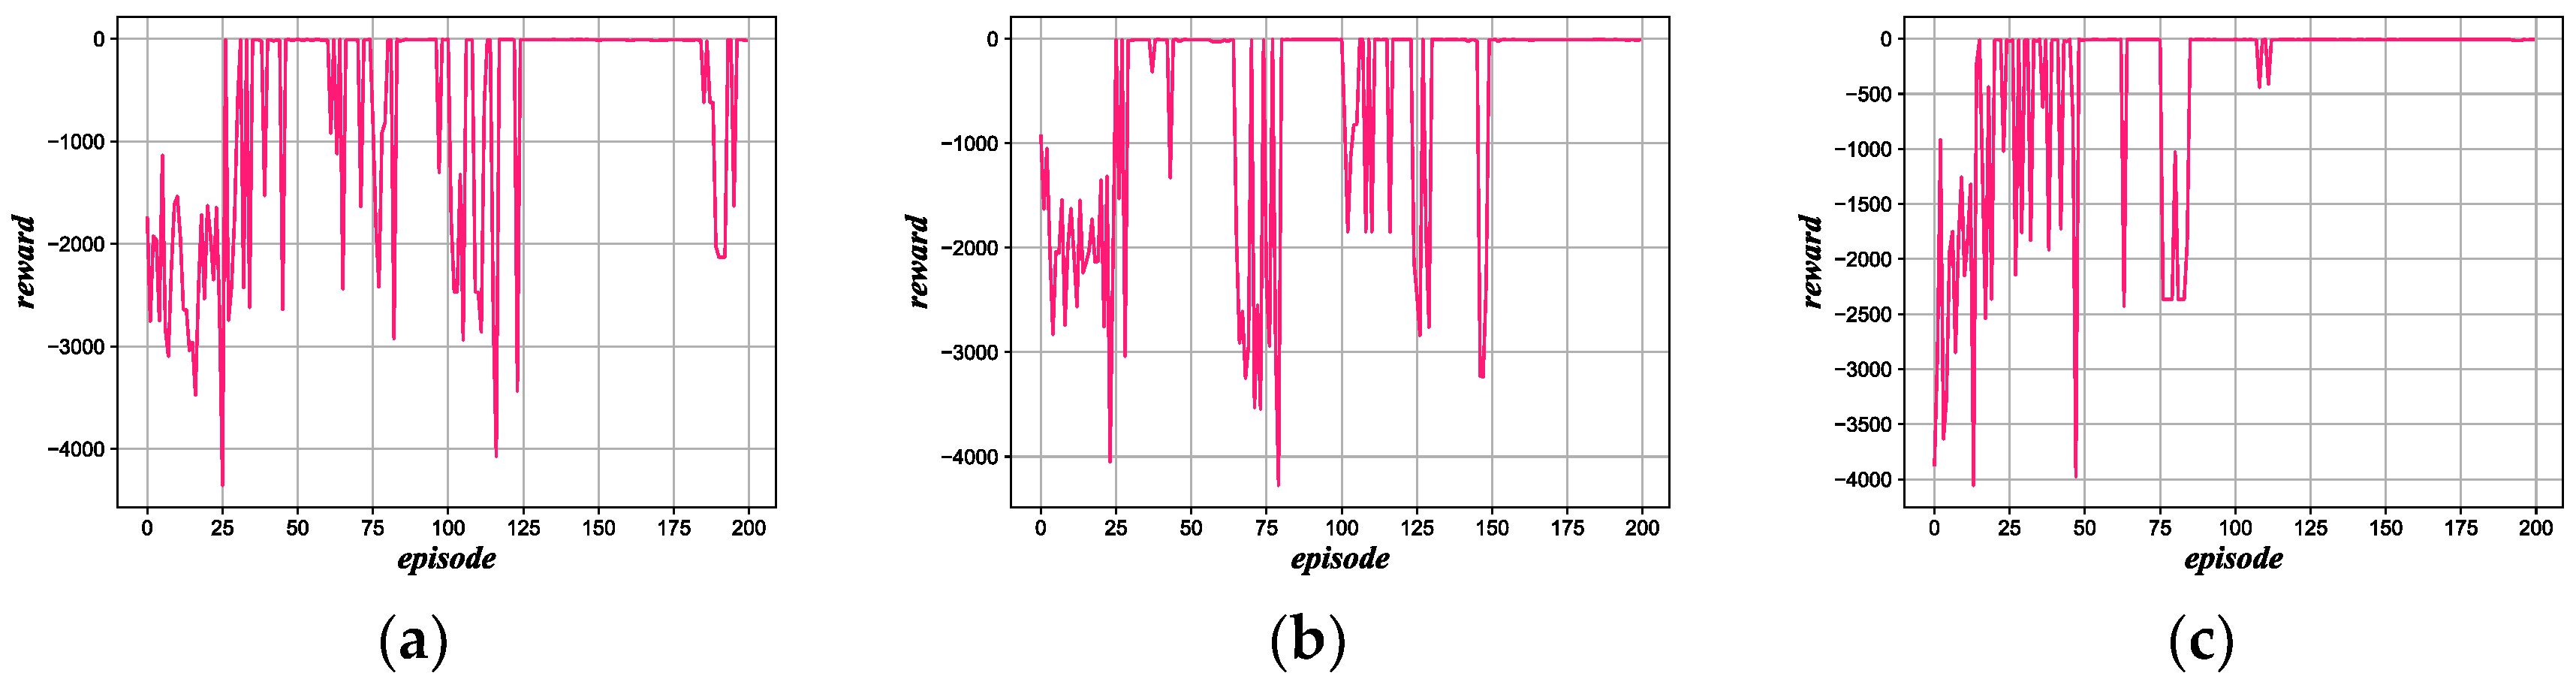
Table 6. According to this, we can find that the dispatching rule of SRPT, EDD, SOST, and SROT can obtain scheduling schemes without tardiness, but the makespan and the average utilization rate show that these schemes can be further optimized. Then, we try to verify the effect of Prioritized Experience Replay (PER). The reward line of DQN, Double DQN, and Dueling DDQN (the combination of Dueling DQN and DDQN) with the mentioned settings and hyperparameters without PER is shown in Figure 12, which indicates the severe instability of the training processes, especially DQN and Double DQN. The performance of these algorithms adopting PER can be seen in Figure 13, which shows that PER is effective in reducing instability and accelerating convergence. The comprehensive comparison of DQN and its modified versions can be seen in Figure 14, which shows the gradual optimization in terms of efficiency and stability from the traditional DQN algorithm to the Dueling DDQN containing PER. The average reward in 200 episodes is presented in Table 7 for comparison.
Table 6. The performance of dispatching rules in the action set.
Figure 12. The reward of DQN, Double DQN and Dueling DDQN without PER. (a) DQN without PER; (b) Double DQN without PER; (c) Dueling DDQN without PER.
Figure 13. The reward of DQN, Double DQN and Dueling DDQN with PER. (a) DQN with PER; (b) Double DQN with PER; (c) Dueling DDQN without PER.
Figure 14. The comparison of moving average rewards of DQN and its modified versions.
Table 7. The average rewards of the DRL algorithm in 200 episodes.
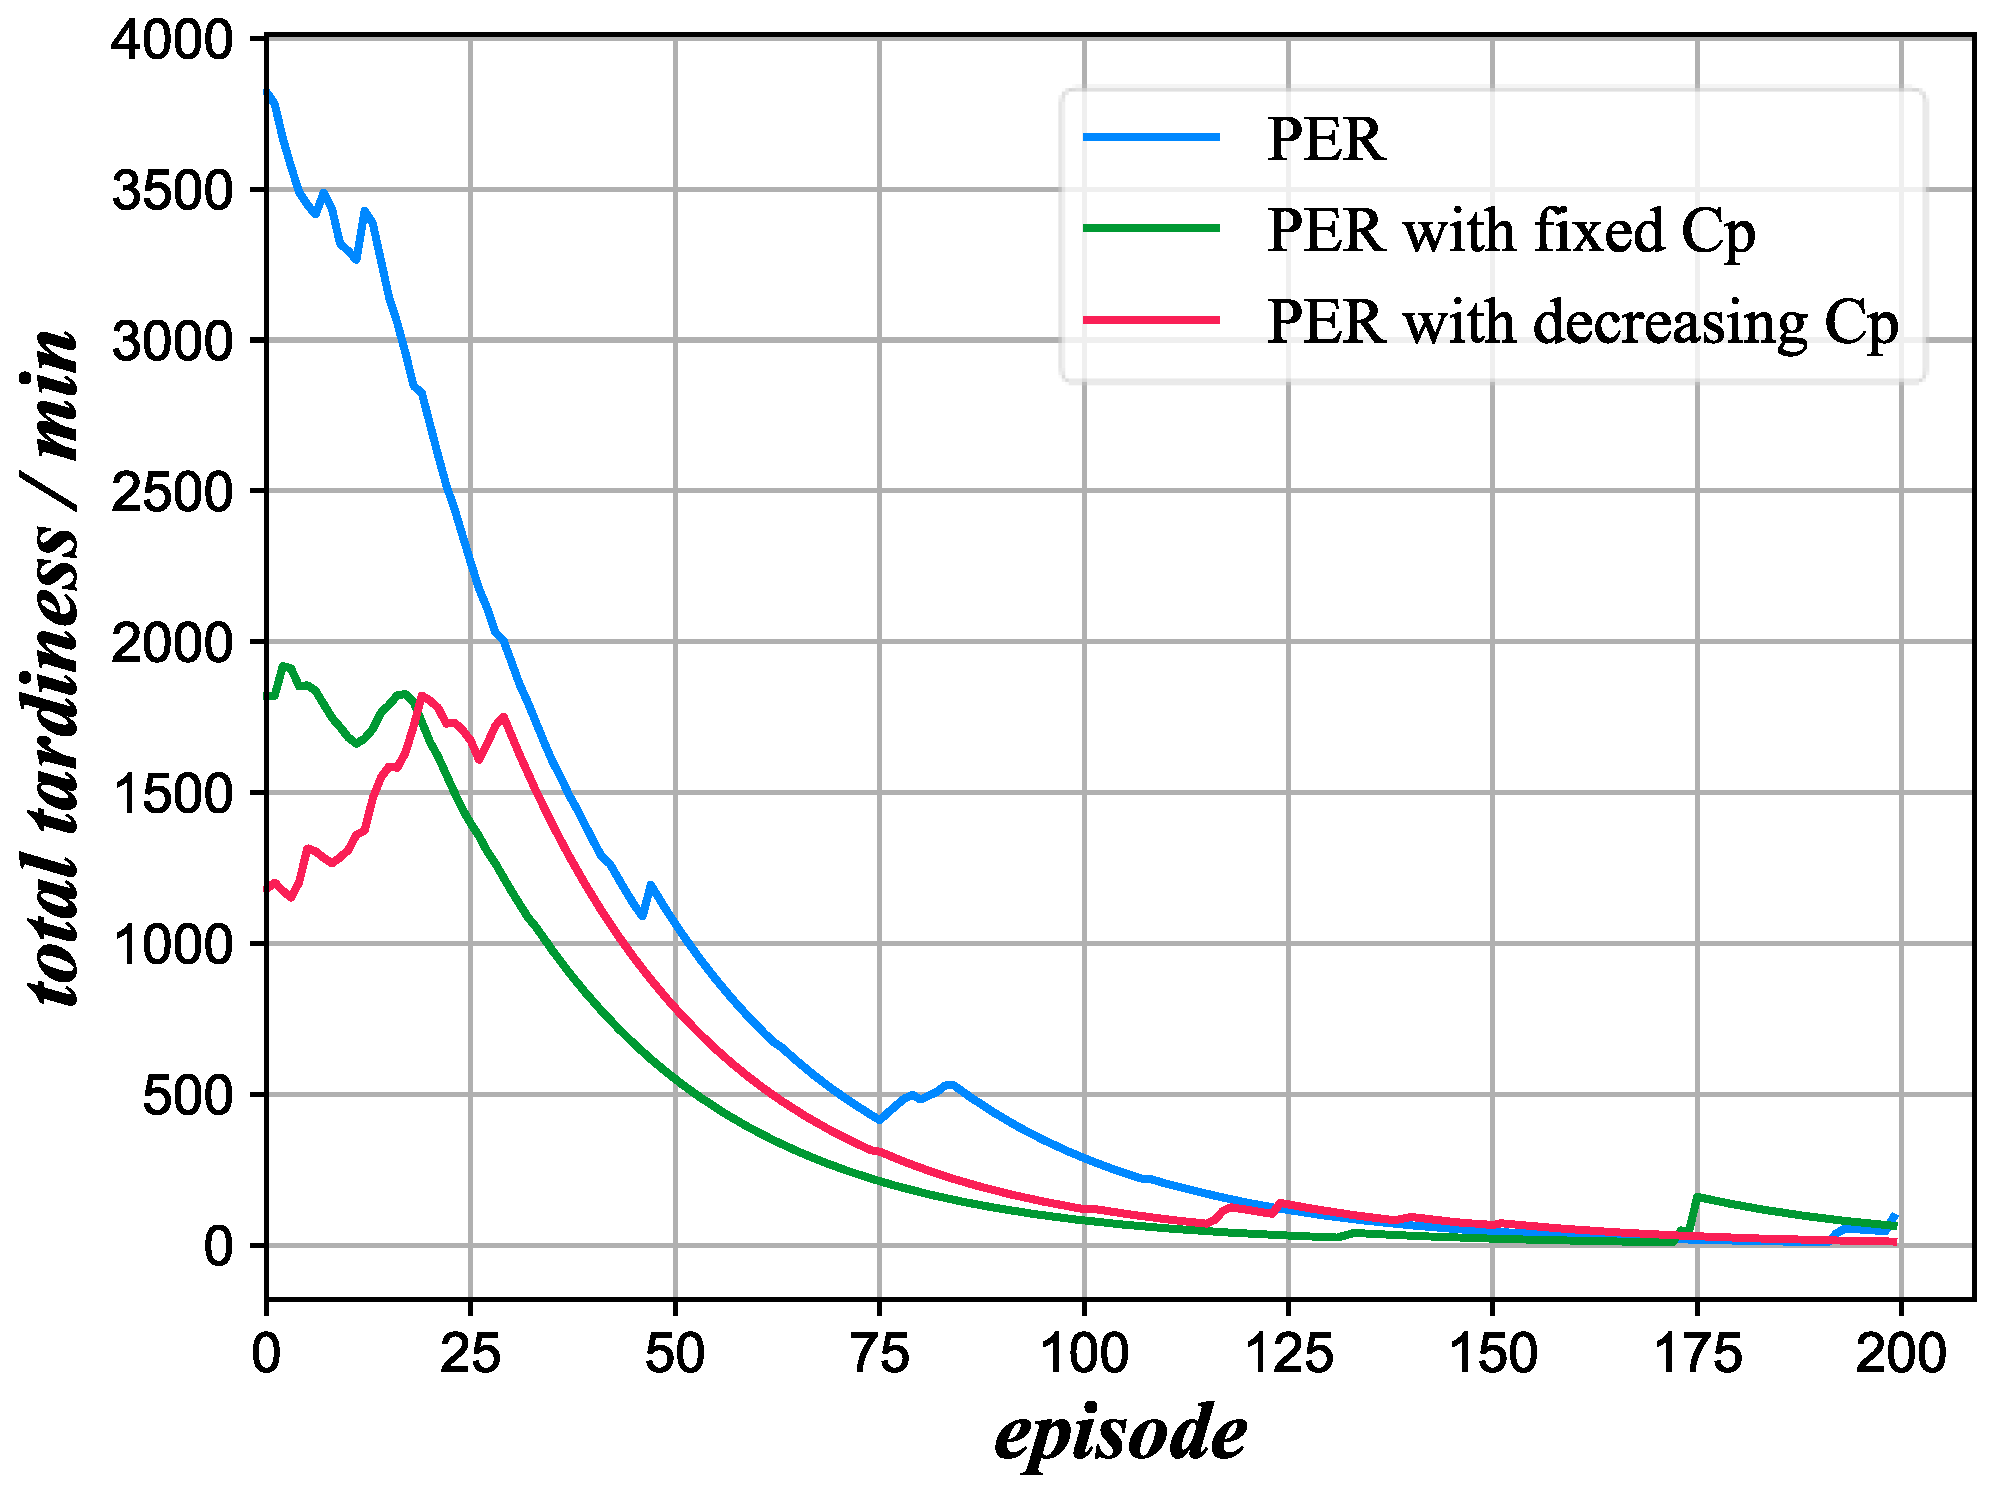
Then, we conduct experiments on the performance of the priority coefficient ( C p ) through Dueling DDQN, and the comparison of results can be seen in Figure 15, which clearly shows that C p can contribute to promoting training efficiency since it encourages sampling experiences with important state feature transformation. Moreover, the comparison also indicates that the fixed C p may accelerate the convergence and the decreasing C p is likely to be more stable.
Figure 15. A comparison of the performance on C p of modified Dueling DDQN.
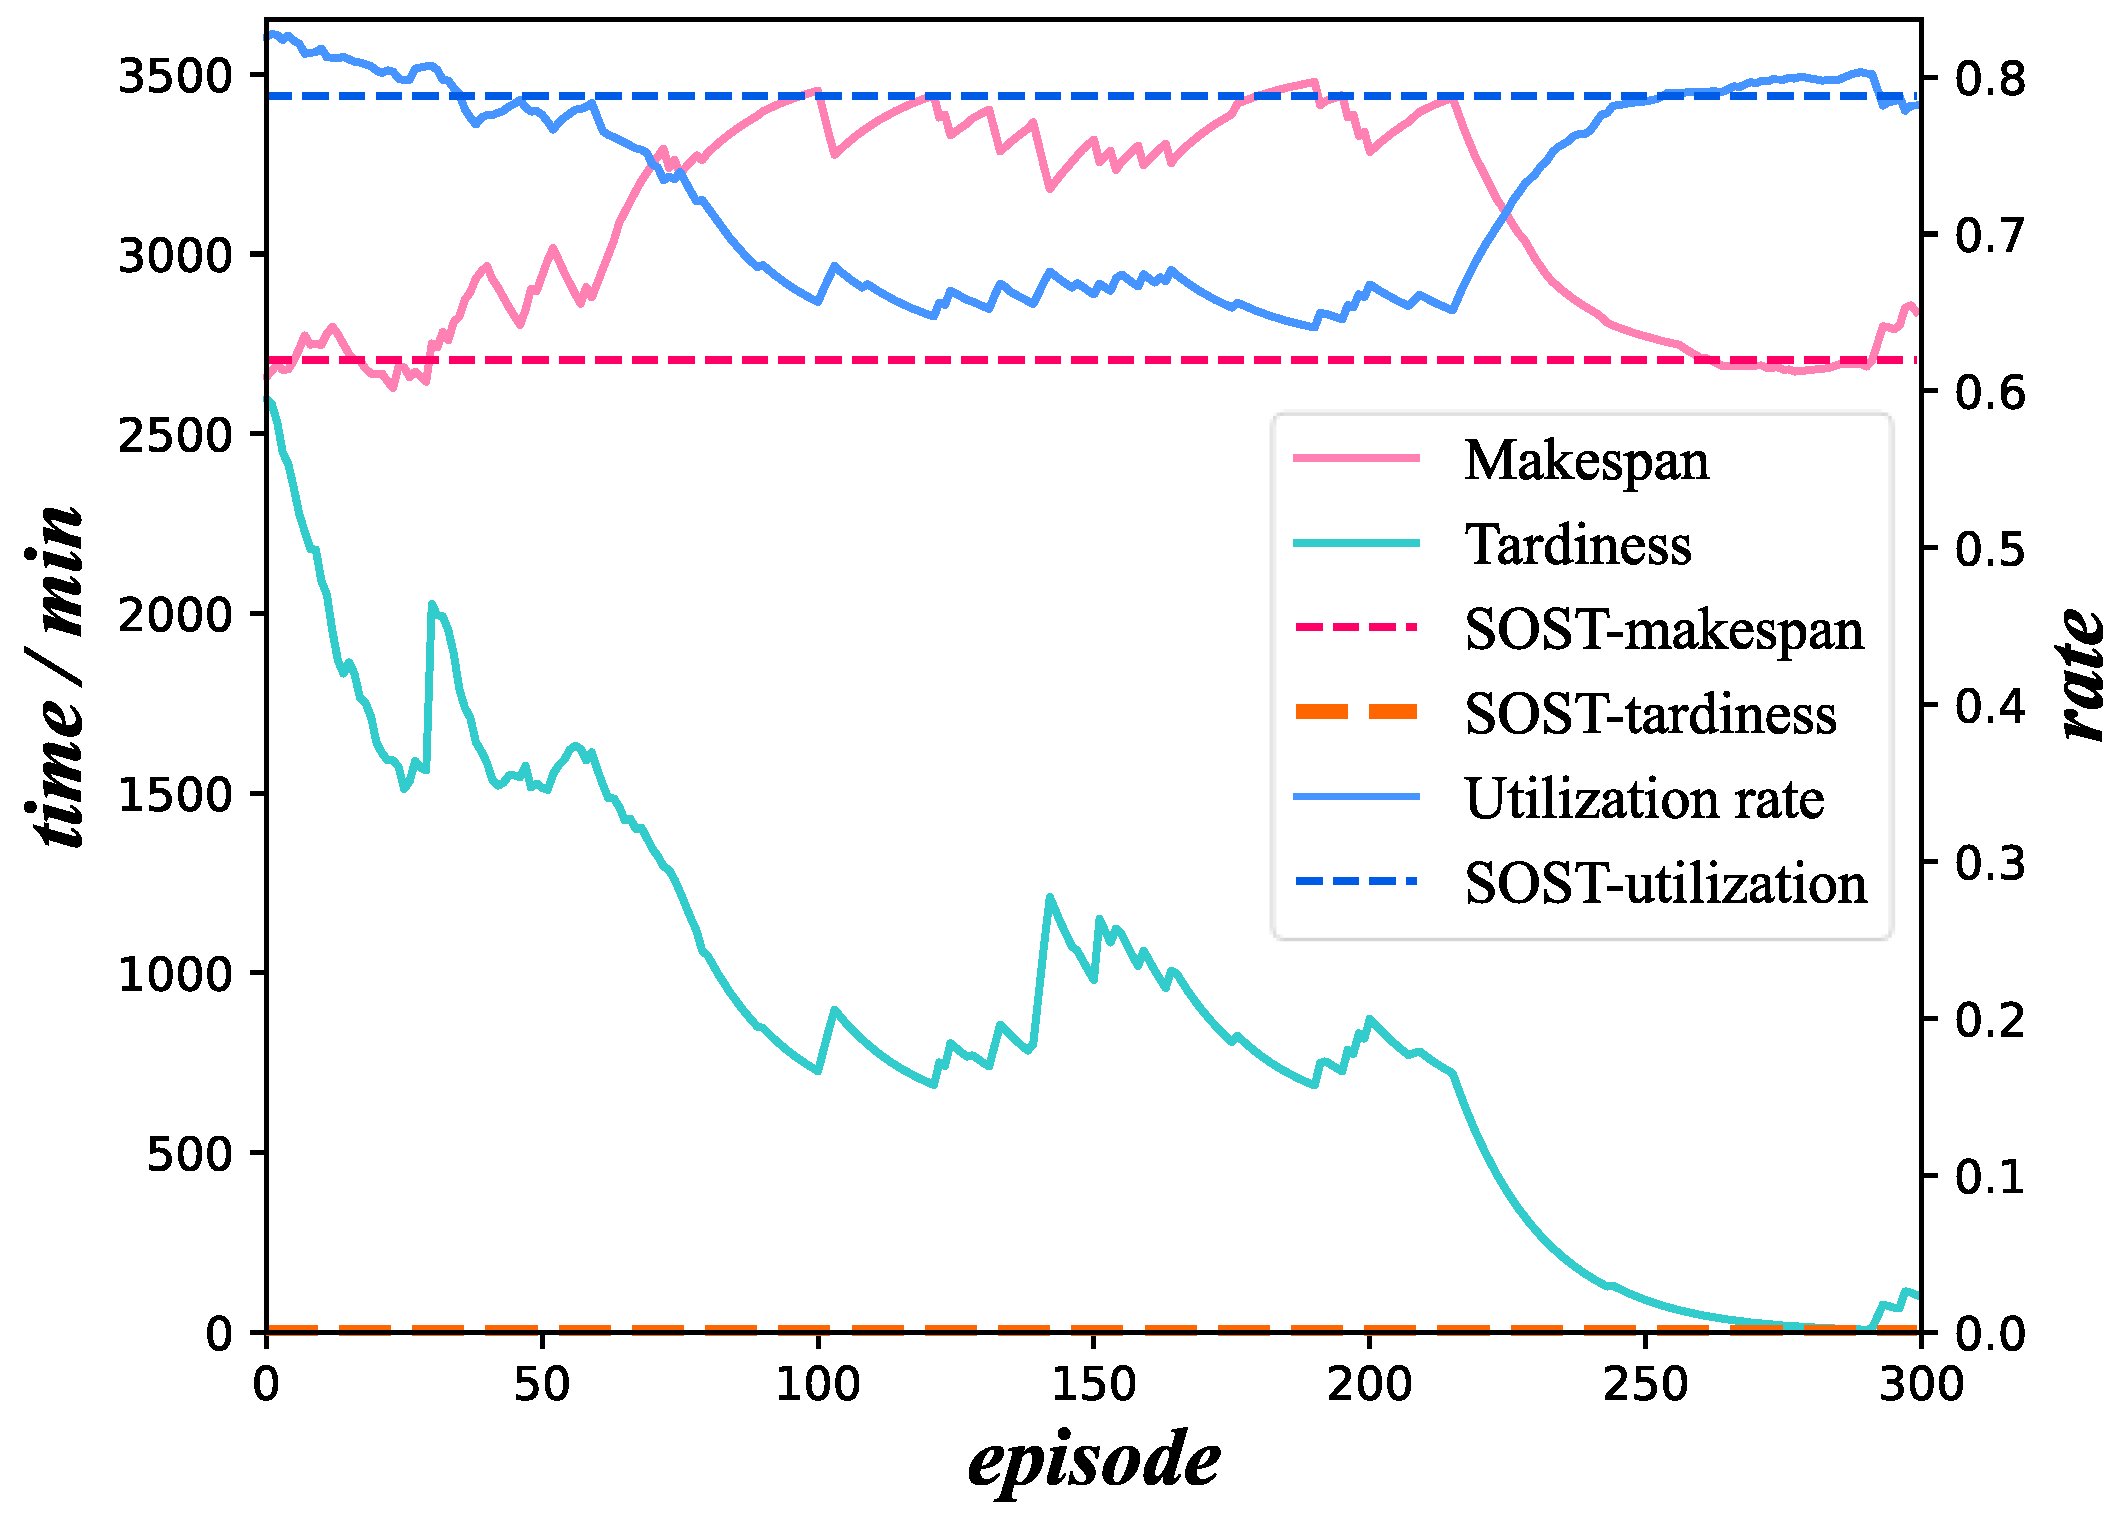
Through all the experiments above, we can find dozens of scheduling schemes without tardiness differences from that of the scheme with the single dispatching rule. The scheme with the shortest makespan we find is presented in the form of a Gantt chart, as shown in Figure 16, whose makespan is 2422, and the average utilization rate is 0.823292. In the absence of tardiness, this scheme reduces the makespan by over 10% and promotes the average utilization rate by 4.5% compared with the SOST. At last, we compare the performance of the modified Dueling DDQN model trained by the specific case with the original model and genetic algorithm (GA) through random cases and different due dates, and the relevant data can be seen in Table 8. To avoid potential influence from C p since we think it may be dependent on the actual situation of industrial cases, the model is trained without C p . The results in Table 8 show the high effectiveness and stability of the modified Dueling DDQN in obtaining scheduling schemes of SFSP with low tardiness compared with the original model. Meanwhile, we can find that GA achieves better outcomes when the deadlines are generous, whereas in situations with tighter deadlines, the performance of modified Dueling DDQN is superior.
Figure 16. The scheme with the shortest makespan was found using modified Dueling DDQN.
Table 8. The tardiness from modified Dueling DDQN and original DQN on random cases.

5. Discussion

5.1. Adaptation and Scalability

The design method proposed for IPS2 mainly contains service order design, resource configuration, and service flow modeling. Additionally, it matches up with some former research in certain aspects. The application of IPS2 aims to obtain a low-cost, high-customization, and high-efficiency solution, which is the same purpose as most industrial enterprises. At this point, the proposed design method can not only be applied in robot-driven sanding processing lines but also be popularized in most industrial areas. The internal connection of the design method shows the process from customized requirements to the realization and delivery of IPS2. However, the most important and difficult point is to summarize all possible requirements and enumerate comprehensive resource information so that the service flow can be modeled completely in relevant industrial fields.

5.2. Modifications of DRL

5.2.1. Reward Shaping

In our experiments, the reward once contained both positive and negative values. However, we find that the positive value may influence the agent to pursue its reward in a short period, which may even lead to instability. A comparison of the reward function is shown in Figure 17, and the details are shown in Table 9. The performance of the two cases shows that both of them can describe the situation of tardiness through the reward, and the positive reward during the intermediate states may reduce the convergence rate and stability. In addition, the reward function without positive values appears to be slower to get a high return, possibly due to differences in the range and scale of rewards. A possible explanation is that the agent tends to pursue the positive reward utilitarianly, while the positive reward may not match up so well with the terminal goal.
Figure 17. The comparison of the reward function with positive values or not. (a) The reward function with positive values; (b) the reward function without positive values.
Table 9. The differences in reward values of the reward function.
Additionally, we also tried to set a reward at the last step of each episode to give preference to the shorter makespan and the higher utilization rate. The details of the episode-based reward are shown in Equation (15). Its performance is shown in Figure 18, which indicates that the pre-defined preference has a weak effect since it can only almost converge to the result of SOST within 300 episodes. The most likely reason is the difficulty in learning an anticipant strategy through the episode-based reward because of its sparsity and great difference.
M a k e s p a n :   r s p a n = m a k e s p a n S O S T m a k e s p a n c u r r e n t T a r d i n e s s :   r t a r d = t a r d i n e s s c u r r e n t U t i l i z a t i o n   r a t e : r u t i = 500 ( u c u r r e n t u S O S T )
Figure 18. The performance of the modified Dueling DDQN with the episode-based reward.

5.2.2. Priority Adjusting

As previously proven, Prioritized Experience Replay (PER) is effective in the training process of DRL, while the priority coefficient ( C p ) proposed in this paper deserves further discussion. C p increases the priority of certain experiences with transitions and changes of specific state features, including A T D and E T D . Although the contrast experiments above have shown that C p is capable of accelerating the speed of convergence on a specific case, there is still doubt about the application in other cases, especially cases that are highly likely to be overdue. Therefore, we set experiments on different due dates to verify the universality of C p . The average rewards can be seen in Table 10, and we find that C p is strongly effective only on the due date 2.4. The poor performance on the due date 1.5 and the due date 2.0 shows that C p maybe not so stable and need further adjustment to adapt to different conditions.
Table 10. The average rewards of DRL on different due dates with different C p .

6. Conclusions

In this paper, we propose a design method for IPS2 based on robot-driven sanding processing lines to solve the difficulties triggered by the high cost and the complex operation and maintenance. Moreover, a scheduling method is put forward in the face of multiple concurrent service flows. The main contributions of this paper lie in three aspects: (1) A comprehensive design method for IPS2 is propounded to obtain a highly customized scheme, which includes service order design, resource configuration, and service flow modeling. (2) A scheduling method adopting the deep reinforcement learning algorithm for service flows is proposed in an attempt to satisfy the requirements of the due date, optimize the makespan, and promote the average utilization rate. (3) A real industrial case of robot-driven sanding processing lines and their relevant data are implemented to verify the practicability and performance of the proposed methods. In addition, the modifications of reward shaping and priority coefficient in the Dueling DDQN are discussed to pursue more efficient and robust scheduling schemes.
Nevertheless, some existing limitations in our methods should be addressed. Firstly, the transformation from the Service Flow Scheduling Problem into the Hybrid Flow Scheduling Problem is somewhat idealized since it ignores the logistics activity and the potential risk of sudden breakdowns. Furthermore, despite the “Fork” and the “Join” in the UML Activity Diagram, the modeling method for service flows does not seem to fit the profoundly complex combination of parallel activities so well. Therefore, further research is required to establish a more flexible and refined modeling method for service flows. Meanwhile, the possible dynamic factors during the scheduling process deserve serious consideration to prevent an unstable and inefficient scheme.

Author Contributions

Conceptualization, P.J., Y.Y., X.C. and M.Y.; methodology, Y.Y. and X.C.; software, X.C.; validation, Y.Y. and W.G.; formal analysis, M.Y.; investigation, X.C.; resources, Y.Y.; data curation, Y.Y. and X.C.; writing—original draft preparation, X.C. and W.G.; writing—review and editing, Y.Y., M.Y. and X.C.; visualization, X.C.; supervision, M.Y. and P.J.; project administration, W.G. and P.J.; funding acquisition, W.G. All authors have read and agreed to the published version of the manuscript.

Funding

This research was funded by the National Key Research and Development Program of China, grant number 2021YFE0116300.

Data Availability Statement

Data are contained within the article.

Conflicts of Interest

The authors declare no conflicts of interest. The funders had no role in the design of the study; in the collection, analyses, or interpretation of data; in the writing of the manuscript; or in the decision to publish the results.

References

  1. Annarelli, A.; Battistella, C.; Costantino, F.; Di Gravio, G.; Nonino, F.; Patriarca, R. New Trends in Product Service System and Servitization Research: A Conceptual Structure Emerging from Three Decades of Literature. CIRP J. Manuf. Sci. Technol. 2021, 32, 424–436. [Google Scholar] [CrossRef]
  2. Tukker, A. Product Services for a Resource-Efficient and Circular Economy—A Review. J. Clean. Prod. 2015, 97, 76–91. [Google Scholar] [CrossRef]
  3. Meier, H.; Roy, R.; Seliger, G. Industrial Product-Service Systems-IPS2. CIRP Ann.—Manuf. Technol. 2010, 59, 607–627. [Google Scholar] [CrossRef]
  4. Mertens, K.G.; Rennpferdt, C.; Greve, E.; Krause, D.; Meyer, M. Current Trends and Developments of Product Modularisation—A Bibliometric Analysis. In Proceedings of the 23rd International Conference on Engineering Design (ICED), Gothenburg, Sweden, 16–20 August 2021; Cambridge University Press: Cambridge, UK, 2021; Volume 1, pp. 801–810. [Google Scholar]
  5. Maleki, E.; Belkadi, F.; Bernard, A. Industrial Product-Service System Modelling Base on Systems Engineering: Application of Sensor Integration to Support Smart Services. IFAC-PapersOnLine 2018, 51, 1586–1591. [Google Scholar] [CrossRef]
  6. Shimomura, Y.; Hara, T.; Arai, T. A Unified Representation Scheme for Effective PSS Development. CIRP Ann.—Manuf. Technol. 2009, 58, 379–382. [Google Scholar] [CrossRef]
  7. Long, H.J.; Wang, L.Y.; Zhao, S.X.; Jiang, Z.B. An Approach to Rule Extraction for Product Service System Configuration That Considers Customer Perception. Int. J. Prod. Res. 2016, 54, 5337–5360. [Google Scholar] [CrossRef]
  8. Lerch, C.; Gotsch, M. Digitalized Product-Service Systems in Manufacturing Firms: A Case Study Analysis. Res. Technol. Manag. 2015, 58, 45–52. [Google Scholar] [CrossRef]
  9. Pezzotta, G.; Pirola, F.; Rondini, A.; Pinto, R.; Ouertani, M.Z. Towards a Methodology to Engineer Industrial Product-Service System—Evidence from Power and Automation Industry. CIRP J. Manuf. Sci. Technol. 2016, 15, 19–32. [Google Scholar] [CrossRef]
  10. Zhao, M.; Wang, X. Perception Value of Product-Service Systems: Neural Effects of Service Experience and Customer Knowledge. J. Retail. Consum. Serv. 2021, 62, 102617. [Google Scholar] [CrossRef]
  11. Song, W.; Ming, X.; Han, Y.; Wu, Z. A Rough Set Approach for Evaluating Vague Customer Requirement of Industrial Product-Service System. Int. J. Prod. Res. 2013, 51, 6681–6701. [Google Scholar] [CrossRef]
  12. Müller, P.; Schulz, F.; Stark, R. Guideline to Elicit Requirements on Industrial Product-Service Systems. In Proceedings of the 2nd CIRP International Conference on Industrial Product/Service Systems, Linkoping, Sweden, 14–15 April 2010; pp. 109–116. [Google Scholar]
  13. Wang, Z.; Chen, C.H.; Zheng, P.; Li, X.; Khoo, L.P. A Graph-Based Context-Aware Requirement Elicitation Approach in Smart Product-Service Systems. Int. J. Prod. Res. 2021, 59, 635–651. [Google Scholar] [CrossRef]
  14. Mourtzis, D.; Zervas, E.; Boli, N.; Pittaro, P. A Cloud-Based Resource Planning Tool for the Production and Installation of Industrial Product Service Systems (IPSS). Int. J. Adv. Manuf. Technol. 2020, 106, 4945–4963. [Google Scholar] [CrossRef]
  15. Wang, P.P.; Ming, X.G.; Wu, Z.Y.; Zheng, M.K.; Xu, Z.T. Research on Industrial Product-Service Configuration Driven by Value Demands Based on Ontology Modeling. Comput. Ind. 2014, 65, 247–257. [Google Scholar] [CrossRef]
  16. Yang, M.; Yang, Y.; Jiang, P. A Design Method for Edge-Cloud Collaborative Product Service System: A Dynamic Event-State Knowledge Graph-Based Approach with Real Case Study. Int. J. Prod. Res. 2023, 1–12. [Google Scholar] [CrossRef]
  17. Li, H.; Ji, Y.; Chen, L.; Jiao, R.J. Bi-Level Coordinated Configuration Optimization for Product-Service System Modular Design. IEEE Trans. Syst. Man Cybern. Syst. 2017, 47, 537–554. [Google Scholar] [CrossRef]
  18. Ntanos, E.; Dimitriou, G.; Bekiaris, V.; Vassiliou, C.; Kalaboukas, K.; Askounis, D. A Model-Driven Software Engineering Workflow and Tool Architecture for Servitised Manufacturing. Inf. Syst. E-Bus. Manag. 2018, 16, 683–720. [Google Scholar] [CrossRef]
  19. Uhlmann, E.; Gabriel, C.; Raue, N. An Automation Approach Based on Workflows and Software Agents for Industrial Product-Service Systems. Procedia CIRP 2015, 30, 341–346. [Google Scholar] [CrossRef]
  20. Ding, K.; Jiang, P.; Zheng, M. Environmental and Economic Sustainability-Aware Resource Service Scheduling for Industrial Product Service Systems. J. Intell. Manuf. 2017, 28, 1303–1316. [Google Scholar] [CrossRef]
  21. Meier, H.; Uhlmann, E.; Raue, N.; Dorka, T. Agile Scheduling and Control for Industrial Product-Service Systems. Procedia CIRP 2013, 12, 330–335. [Google Scholar] [CrossRef]
  22. Zhang, Y.; Dan, Y.; Dan, B.; Gao, H. The Order Scheduling Problem of Product-Service System with Time Windows. Comput. Ind. Eng. 2019, 133, 253–266. [Google Scholar] [CrossRef]
  23. Li, X.; Wen, J.; Zhou, R.; Hu, Y. Study on Resource Scheduling Method of Predictive Maintenance for Equipment Based on Knowledge. In Proceedings of the 2015 10th International Conference on Intelligent Systems and Knowledge Engineering, ISKE 2015, Taipei, Taiwan, 24–27 November 2015; Institute of Electrical and Electronics Engineers Inc.: New York, NY, USA, 2016; pp. 345–350. [Google Scholar]
  24. Jiang, C.; Hu, X.; Xi, J. A Hybrid Algorithm of Product-Service Framework for the Multi-Project Scheduling in ETO Assembly Process. Procedia CIRP 2019, 83, 298–303. [Google Scholar] [CrossRef]
  25. Mourtzis, D.; Boli, N.; Xanthakis, E.; Alexopoulos, K. Energy Trade Market Effect on Production Scheduling: An Industrial Product-Service System (IPSS) Approach. Int. J. Comput. Integr. Manuf. 2021, 34, 76–94. [Google Scholar] [CrossRef]
  26. Leng, J.; Yan, D.; Liu, Q.; Zhang, H.; Zhao, G.; Wei, L.; Zhang, D.; Yu, A.; Chen, X. Digital Twin-Driven Joint Optimisation of Packing and Storage Assignment in Large-Scale Automated High-Rise Warehouse Product-Service System. Int. J. Comput. Integr. Manuf. 2021, 34, 783–800. [Google Scholar] [CrossRef]
  27. Lagemann, H.; Meier, H. Robust Capacity Planning for the Delivery of Industrial Product-Service Systems. Procedia CIRP 2014, 19, 99–104. [Google Scholar] [CrossRef]
  28. Dan, B.; Gao, H.; Zhang, Y.; Liu, R.; Ma, S. Integrated Order Acceptance and Scheduling Decision Making in Product Service Supply Chain with Hard Time Windows Constraints. J. Ind. Manag. Optim. 2018, 14, 165–182. [Google Scholar] [CrossRef]
  29. Yi, L.; Wu, X.; Werrel, M.; Schworm, P.; Wei, W.; Glatt, M.; Aurich, J.C. Service Provision Process Scheduling Using Quantum Annealing for Technical Product-Service Systems. Procedia CIRP 2023, 116, 330–335. [Google Scholar] [CrossRef]
  30. Liu, C.; Jia, G.; Kong, J. Requirement-Oriented Engineering Characteristic Identification for a Sustainable Product-Service System: A Multi-Method Approach. Sustain. Switz. 2020, 12, 8880. [Google Scholar] [CrossRef]
  31. Sun, J.; Chai, N.; Pi, G.; Zhang, Z.; Fan, B. Modularization of Product Service System Based on Functional Requirement. Procedia CIRP 2017, 64, 301–305. [Google Scholar] [CrossRef]
  32. Aurich, J.C.; Wolf, N.; Siener, M.; Schweitzer, E. Configuration of Product-Service Systems. J. Manuf. Technol. Manag. 2009, 20, 591–605. [Google Scholar] [CrossRef]
  33. Pinedo, M.L. Scheduling; Springer: Berlin/Heidelberg, Germany, 2012; Volume 29. [Google Scholar]
  34. Jiménez, Y.M. A Generic Multi-Agent Reinforcement Learning Approach for Scheduling Problems. Ph.D. Thesis, Vrije Universiteit Brussel, Brussel, Belgium, 2012; p. 128. [Google Scholar]
  35. Zhao, X.; Song, W.; Li, Q.; Shi, H.; Kang, Z.; Zhang, C. A Deep Reinforcement Learning Approach for Resource-Constrained Project Scheduling. In Proceedings of the 2022 IEEE Symposium Series on Computational Intelligence, SSCI 2022, Singapore, 4–7 December 2022; Institute of Electrical and Electronics Engineers Inc.: New York, NY, USA, 2022; pp. 1226–1234. [Google Scholar]
  36. Luo, H.; Zhang, K.; Shang, J.; Cao, M.; Li, R.; Yang, N.; Cheng, J. High Precision Positioning Method via Robot-Driven Three-Dimensional Measurement. In Proceedings of the 2022 2nd International Conference on Advanced Algorithms and Signal Image Processing (AASIP 2022), Hulun Buir, China, 19–21 August 2022; SPIE: Bellingham, WA, USA, 2022; p. 83. [Google Scholar]
  37. Maric, B.; Mutka, A.; Orsag, M. Collaborative Human-Robot Framework for Delicate Sanding of Complex Shape Surfaces. IEEE Robot. Autom. Lett. 2020, 5, 2848–2855. [Google Scholar] [CrossRef]
  38. Han, L.; Cheng, X.; Li, Z.; Zhong, K.; Shi, Y.; Jiang, H. A Robot-Driven 3D Shape Measurement System for Automatic Quality Inspection of Thermal Objects on a Forging Production Line. Sensors 2018, 18, 4368. [Google Scholar] [CrossRef]
  39. Lei, T.; Rong, Y.; Wang, H.; Huang, Y.; Li, M. A Review of Vision-Aided Robotic Welding. Comput. Ind. 2020, 123, 103326. [Google Scholar] [CrossRef]
Disclaimer/Publisher’s Note: The statements, opinions and data contained in all publications are solely those of the individual author(s) and contributor(s) and not of MDPI and/or the editor(s). MDPI and/or the editor(s) disclaim responsibility for any injury to people or property resulting from any ideas, methods, instructions or products referred to in the content.

Article Metrics

Citations

Article Access Statistics

Multiple requests from the same IP address are counted as one view.