Abstract
Runway lights are essential components of the airstrip. However, there is currently no international standard that outlines methods for the testing of runway light fixtures. In this study, a novel testing method is developed to simulate the forces exerted on the lights during landing. The testing equipment is specifically designed to be easily mounted on a standard hydraulic press commonly used for tensile tests. This system allows for the regulation of the normal force between the aircraft tire and the fixture of the runway lighting system. To minimize load fluctuations during part sliding, Belleville washers are employed. The overall compliance of the system is validated through finite element analysis. Tests carried out by means of the proposed testing equipment allow the effective description of the variations in load at different positions during sliding. The system presented in this paper can be used to investigate the effects of landing on various combinations of cap design and tire material.
1. Introduction
Runway edge lighting is used to outline the edges of runways during periods of darkness or in restricted visibility conditions [1,2]. The functionality of these lights holds paramount significance in ensuring the safety of flight operations [3]. Research in this domain has predominantly focused on monitoring the optical efficacy of these lighting systems to ascertain the attainment of adequate visibility [4,5]. Nevertheless, ensuring the proper functionality of the lighting system necessitates the assurance of the structural resilience of these lights. The lights are protected by aluminium caps (fixtures) that are required to withstand the possible impacts with aircraft wheels, especially during landing, where the highest applied forces are achieved. Notably, there remains an absence of studies addressing the determination or assessment of such protective structures. Presently, there are no established standards providing guidance for the design or testing of this specific fixture. Moreover, no previous studies have addressed this issue by proposing methodologies to evaluate the performance of runway light fixtures on a laboratory scale. The objective of this study is to fill this void by introducing a test method and equipment capable of replicating the loading conditions experienced by the fixture during landings. The proposed test method outlined in this research aims to serve as a benchmark for future investigations in this field.
To design the equipment, relevant standards and technical documentations have been taken into account. The shear load, responsible for the deformation of caps’ edges, has been assessed by comparing four standards regarding the landing of specific plane models (the Airbus A380 [6] and the Boeing 777 [7]), one regarding specifications for runway and taxiway light fixtures [8] and one regarding specifications for large planes in general [9]. In particular, ref. [8] has been used to determine the shear load for the elastic model, whereas [6,7,9] have been used to determine the shear load for the elastic–plastic model. An intermediate value of deceleration between the one from [7] and the one from [9] was considered (), whereas the maximum plane weight at landing (MLW) was taken from [6], as the A380 has a higher MLW than the Boeing 777.
Section 2 details the design of the testing equipment. Specifically, an experimental test bench has been designed and manufactured to be able to run experimental campaigns on these light fixtures. The conceptual scheme of this test is discussed in Section 2.1. The ad hoc designed apparatus allows for the accommodation of the test piece on a standard Instron 1275 500 kN universal testing machine and the application of (i) a normal force to the planar upper surface of the light fixture by means of a series of bolts and of an interchangeable rubber pad and of a (ii) tangential motion to the planar upper surface of the light fixture in order to adequately simulate the impact between the wheel and the fixture itself. The design of the architecture is presented in Section 2.2, while Section 2.3 provides an insight into the clamping system used to generate the normal force on the rubber pad.
FEA models have been developed, applying the retrieved shear loads, in order to determine the entity of the deformation in a worst-case scenario. These calculations are presented in Section 2.4.
Section 2.5 focuses on the design of the connection to the universal testing machine. Finally, Section 2.6 covers the handling and operation of the equipment.
The applications of the proposed testing equipment to actual fixtures and tires are outlined in Section 3 to illustrate the effectiveness of the proposed solution in measuring contact forces. Ultimately, conclusions regarding the current work are drawn in Section 4.
Issues of novelty arise from the lack of studies both in the scientific and in the technical literature dealing with the development of similar devices. The developed testing rig can be used not only for FEA validation purposes, but also for experimental tests aimed at assessing the safety of the light fixtures. The originality of the performed non-trivial design task arises also from the lack of specific standards providing recommendations or reference schemes for the execution of lab tests aimed at assessing the structural response of the light fixtures under their normal duty cycle.
2. Design of the Equipment
2.1. Conceptual Scheme of the Test
For the scope of these tests, the landing gear tire is substituted by a cylindrical rubber pad of 200 mm diameter, fabricated from the same elastomeric material. Considering that the objective of the test is to replicate the contact experienced during landing, the rubber pad must be pushed against the light fixture with a specific normal force denoted as . Equation (1) may be used to estimate the value of .
where is the mass of the airplane, g is the acceleration of gravity and is the number of landing gear tires. Table 1 reports the values calculated for an Airbus A380 and a Boeing 777, the acceleration of gravity being m/s.

Table 1.
Calculation of the normal force in two aircraft.
In Figure 1a, a schematic illustrates the gear making contact with the fixture during landing. Here, the load presses the gear against the fixture as it moves forward, resulting in the generation of a tangential force due to the friction between the tire and the fixture. To examine the loading conditions that arise when the tire component moves on the runway lighting fixture, the testing system must facilitate the sliding motion of the rubber pad with respect to the cap, as illustrated in Figure 1b.
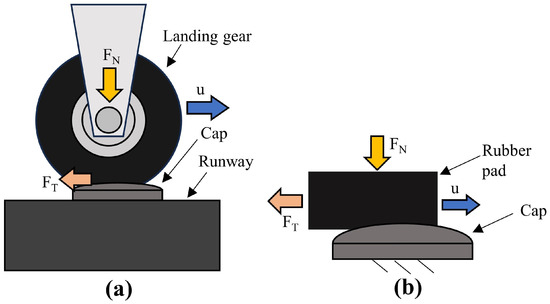
Figure 1.
(a) Schematic representation of the tire touching the fixture during landing and (b) conceptual scheme of the test.
The controlled parameter of the test is the displacement, denoted as u, in the direction of sliding. Additionally, the testing system should enable the measurement of the tangential force resulting from the friction between the rubber pad and the cap.
The testing apparatus was designed to be adaptable to a standard universal testing machine equipped with a load cell, which is commonly utilized for tensile testing purposes. Specifically, a INSTRON 1275, load capacity 500 kN, by Instron®, Norwood, MA, USA, was used.
2.2. Architecture of the Equipment
An assembly drawing of the testing system developed for these experiments is shown in Figure 2.

Figure 2.
Assembly of the testing equipment.
The rubber pad, labeled as (1) in Figure 2, is mounted on a support (2) that is connected to the piston of the hydraulic press through an adapter (3). The pad support is linked to a base plate (4) via rails, allowing relative sliding between these two elements along the piston axis. The base plate is then connected to the fixed crossbeam of the press. As shown in Figure 2, an intermediate block (5) is bolted to the base plate and connected to the machine using a second adapter (6). This configuration enables the alignment of the two adapters, i.e., the forces, along the axis of the hydraulic press. The linear variable differential transducer (LVDT) of the press is used to measure the movement u of the pad, while the load cell measures the tangential force . All the components mentioned thus far, except for the elastic pad, are made of S355JR steel.
The runway light fixture under testing (7) is mounted on a S355JR counterplate (8). This counterplate is pressed against the base plate (4) by six bolts (9). The normal force Fn can be adjusted by varying the tightening torque of these bolts [10]. However, it is important to note that the high elasticity of the rubber pad, combined with the variable height of the cap, may result in significant variations in the preload of the bolts. To monitor fluctuations in the normal force , four strain gauges, L2A-06-125LW-350 (Micro Measurements, Raleigh, NC, USA), arranged in a full bridge configuration (two longitudinal and two transverse), were applied to each of the two specular central columns of the system, as shown in Figure 3.

Figure 3.
Picture of the strain gauges applied on the central columns.
A custom software program running in the LabVIEW 2020 (National Instruments, Austin, TX, USA) environment and sampling through a NI cDAQ 9184 carrier equipped with a bridge module NI 9237 was used to acquire the signal from these gauges and synchronize it with those from the LVDT and load cell. The analog inputs from the machine were sampled by means of an NI 9219 module, plugged into the same carrier. Further details regarding the dimensioning of the clamping system are presented in Section 2.3.
2.3. Design of the Clamping System
Figure 4 depicts a detailed view of the clamping system.

Figure 4.
Detail of the clamping screw.
As illustrated in Figure 4, the screw is tightened on a central column, which transfers the load to the base plate (not shown in Figure 4). To this end, 6 screws, M20X60 grade 10.9, were used. According to ISO 898-1 [11], these screws have a proof load equal to 203 kN. Therefore, the maximum value of Fn before yielding is 1218 kN, i.e., more than 5 times the maximum estimated value in Table 1.
The stiffness of each screw can be approximately calculated as in Equation (2):
where E is the elastic modulus of the material, is the nominal stress area and is the free length of the screw. Assuming 205,000 MPa, and with mm and mm [11], it can be found that . As there are six parallel screws, the total stiffness is .
Fluctuations in resulting from the elastic deformations of the pad, previously discussed in Section 2.2, can lead to a sudden variation in preload, which may in turn lead to the inconsistent application of the normal force (thus, the shear force) to the fixture along the stroke. To prevent this issue, a set of Belleville washers is employed against the counterplate. As depicted in Figure 4, the screw underhead region makes contact with a cap, which in turn compresses six Belleville washers against the counterplate.
The Belleville washers have an external diameter mm, an internal diameter mm, a thickness mm and a free height mm. The stiffness is determined using the elastic modulus GPa. The stiffness of an individual washer can be calculated using Equation (3), with and defined as in Equation (4) and Equation (5), respectively [12], where :
The arrangement of the washers consists of three pairs of washers (i.e., parallel-connected), working in series. This configuration will be named 2P-2P-2P in the following. Given that each of the six columns is equipped with a similar set of washers, the final spring arrangement is as depicted in Figure 5.
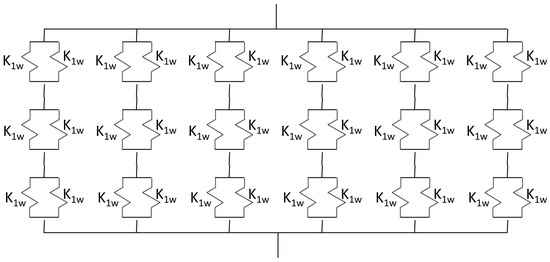
Figure 5.
Scheme of the washers’ configuration.
Consequently, the overall equivalent stiffness is equal to .
Figure 6 illustrates the displacement () versus force (F) plot for the Belleville washers.

Figure 6.
Displacement () versus force (F) plot for the set of Belleville washers.
As observed in Figure 6, this configuration effectively reduces the variation in axial load on the pad–fixture contact in the event of slight thickness variations thereof. Specifically, a nominal force of 240 kN corresponds to a displacement of 3.31 mm for the washers. Deviations of ±20% from this displacement value result in corresponding variations of ±16% in the contact force.
It is interesting to highlight that the adoption of Belleville washers allows for the easy adaptation of the stiffness of the system to the loads used for testing. For example, assuming that all six washers are used, the following alternative configurations can be obtained:
- Six washers in parallel (6P);
- Three washers in parallel with the other three washers in parallel (3P-3P);
- Two pairs of washers in parallel and two single washers, working in series (2P-2P-P-P);
- One pair of washers in parallel and three single washers, working in series (2P-P-P-P-P);
- Six washers in series (P-P-P-P-P-P).
Figure 7 compares the force versus displacement curves of the different configurations, including the one presented above.

Figure 7.
Displacement () versus force (F) plot for different configurations of Belleville washers.
By observing Figure 7, it can be seen that a broad range of properties can be achieved by simply changing the orientation of the washers.
2.4. Numerical Assessment of Stiffness
To validate the stiffness of the testing system, a finite element analysis (FEA) was conducted. The objective of this analysis was to estimate the maximum displacement of the plate and counterplate following the tightening of the screws. For safety purposes, the calculation incorporated a preload of 203 kN on each bolted connection, corresponding to the force at which the screws yield. The model employed for the calculation is illustrated in Figure 8.

Figure 8.
Finite element model used for the stiffness verification.
The model was simplified for the analysis, which was run by Ansys R.17.2. Firstly, extraneous details such as centering holes were eliminated from the 3D model. Additionally, since the Belleville washers were fully compressed under the investigated load, they were substituted with an annular element having a height of 21.6 mm, which was six times the thickness of a single washer. The rubber pad was treated as a rigid element made of steel that comes into contact with the counterplate at the location of the cap ring. The connections between the equipment and the testing machine were disregarded as they had a minimal influence on the analysis. Finally, the simulation took advantage of the equipment’s symmetry to reduce the computational effort.
The mesh used for simulation, which is shown in Figure 9, comprised 351,189 nodes and 147,511 elements. Second-order hexahedral and tetrahedal elements were used.
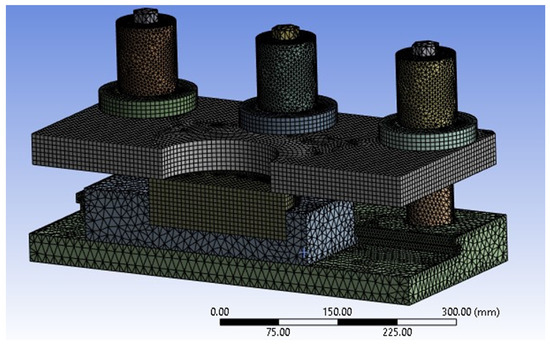
Figure 9.
Mesh of the assembly used for the finite element analysis.
Contacts among the elements of the system were assumed to be fixed in the case of planar mating surfaces and frictionless in the case of cylindrical coupling. CONTA174-TARGE170 elements were used in the contact regions.
For the purposes of the calculation, the system was assumed to be fixed on one side of the blue-colored base plate shown in Figure 8. The bolt pretension tool was employed to apply the axial force to the bolts, which were modeled by means of solid bodies and meshed with tetrahedral elements. The contact element in the underhead region was bonded for the sake of simplicity.
The simulation results, indicating the overall displacement of the two plates, are presented in Figure 10.

Figure 10.
Results of the FEA in terms of total displacement on the plates (scale 2100×).
The maximum displacement observed on both plates was found to be slightly below 1.5 μm, which is considered negligible for this particular application. This negligible displacement aligns with the discussion in Section 2.3, where the clamping system’s design aims to maintain the load as constant as possible during the deformation of the rubber pad. For instance, in a realistic configuration employing a 2P-2P-2P arrangement of washers and a nominal normal load kN, referring to the characteristic curve shown in Figure 6, at , the value of measures 180.03 kN. Deviations of ±15 μm on result in a fluctuation of kN, representing an error of on . Moreover, it is essential to note that the calculated value of 1.5 μm considers the maximum admissible preload on each bolt, significantly higher than the actual load used for testing.
2.5. Design of the Connection to the Testing Machine
As described in Section 2.2, the base plate is connected to an intermediate block, which in turn is solid with the adapter. The connection between the base plate and the block is achieved by means of 5 screws M20x60 grade 10.9, placed as shown in Figure 11.
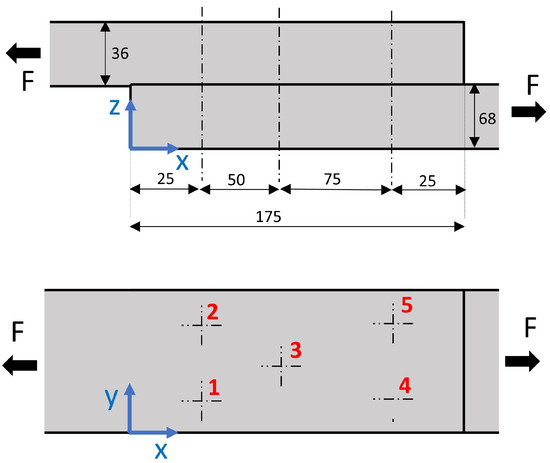
Figure 11.
Schematic representations of the screws connecting the base plate to the intermediate block (parts 4 and 5, respectively, in Figure 2). All the dimensions are in mm.
To design this connection, an estimation of the tangential force , namely the measured variable, was needed. This estimation was made considering the tangential force acting on the tire during braking. In more detail, the design landing stop acceleration according to [9] is m/s. As an A380 has braking wheels, the tangential force on each tire can be estimated as in Equation (6):
The clamp exerted by the bolts must be sufficient to avoid the sliding between the mating surfaces. The load that each screw must apply to this end can be calculated as in Equation (7):
where is the number of screws, and is the coefficient of friction. The latter is assumed to be in the case of non-lubricated steel on steel surfaces [13]. Under this hypothesis, each screw must ensure a 93.3 kN clamping force.
As the two plates are not aligned, a bending moment arises in the region of the bolts. The modulus of this bending moment is calculated as in Equation (8):
where and are the thickness of the base plate and intermediate block, respectively. According to the dimensions shown in Figure 11, it is Nm.
As all the screws have the same size, their centroid coordinate along the X-axis can be calculated as in Equation (9):
where is the x-coordinate of the generic screw. It can be found that mm. The additional preload to be applied on the generic j-th screw in order to balance the momentum is given in Equation (10):
It can be found that the most critical elements are the screws numbered 4 and 5 in the scheme of Figure 11, whose additional preload is = 16,095 N. Indicating as the preload on the screw, the safety factor can be calculated as in Equation (11):
As discussed in Section 2.3, the proof load of M20 10.9 equal to 203 kN. Assuming an utilization factor equal to 0.8, it can be found .
2.6. Handling and Operation of the Testing System
For testing purposes, the rubber pad is mounted on the plate, while the cap is positioned on the counterplate. The system is subsequently closed, as illustrated in Figure 2, using six screws.
The total weight of the testing system is approximately 360 kg. Therefore, the assembly and installation of the equipment require the use of a forklift. The supports highlighted in Figure 12 are specifically designed to accommodate the forklift truck’s fork, enabling the convenient and safe handling of the equipment.

Figure 12.
Supports for handling of the testing equipment by means of a forklift.
The testing equipment is lifted into the testing area using the forklift, and the machine is connected to the two adapters (labeled as 3 and 6 in Figure 2). The testing system installed on the Instron press is shown in Figure 13.

Figure 13.
Testing equipment assembled on the Instron hydraulic press.
After assembling the system, the six bolts are tightened to achieve the desired value of the normal load () as indicated by the strain gauges. Subsequently, the test begins by lowering the piston of the testing machine until the pad completely disengages from the cap. Following this, the piston movement is reversed, applying compression to induce the pad to slide in the opposite direction.
After testing a configuration, loosening the six screws allows the adjustment of the counterplate, enabling the replacement of the rubber pad and fixture without the need to remove the entire equipment from the testing machine. This feature significantly saves time, especially when conducting multiple tests.
3. Results and Discussion of Experimental Tests
The equipment was used to test an innovative design of runway light fixtures in combination with different tire materials. The tests were conducted at a speed of 1 mm/s, with a 30-s delay before the backward movement. Given that the diameter of the tested fixtures was 200 mm, the entire test duration amounted to 5 min and 30 s.
A representative diagram of the force measured during the test is shown in Figure 14.
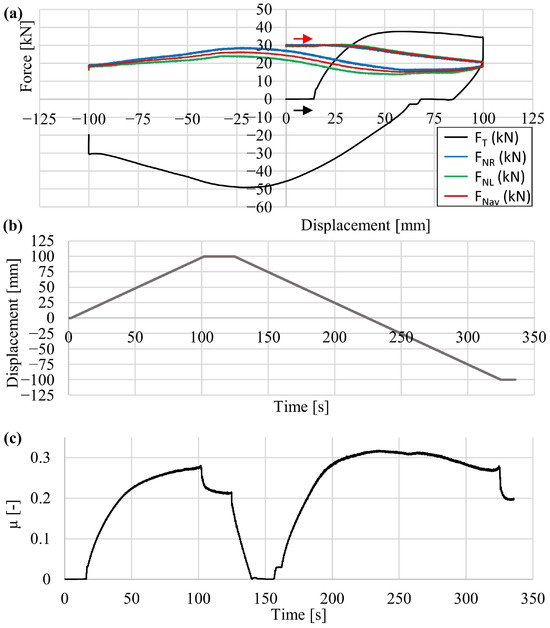
Figure 14.
Plot of (a) tangential and normal forces versus displacement, (b) Displacement versus time and (c) apparent coefficient of friction versus time (initial normal force kN).
Figure 14 shows several values, expressed as functions of the displacement u, namely (i) the tangential force measured by the load cell (), (ii) the normal load on the left and right columns ( and , respectively) read by the strain gauges and (iii) their average value (). The plots should be read in the direction indicated by the arrows to observe the evolution of forces during the test. For clarity, the displacement versus time plot of the test is reported in the bottom part of Figure 14. The zero displacement position corresponds to the configuration in which the rubber pad is coaxial to the cap.
By observing the plot of , it is possible to distinguish different phases.
In the first interval, the tangential load remains almost constant while the displacement increases. During this phase, the elastomer of the pad is prestressed by shear stress. Once the elastic deformation of the pad is completed, rapidly increases to a maximum value and then slightly decreases. This region corresponds to the sliding of the pad on the first half of the cap.
Once the value of u reaches 100 mm (roughly half the diameter of the light fixture), the motion of the system is inverted, i.e., a compression force is applied by the press on the testing equipment. In this phase, force decreases to 0 as the compression of the rubber pad is released. Then, there is a phase of null tangential load similar to that observed at the beginning of the test, during which the pad is deformed. Finally, the absolute value of the tangential load increases to a peak around mm and then decreases, moving to mm. This finding is consistent with the shape of the light fixture, whose maximum thickness is in the central region.
By observing the trend of normal forces, it can be seen that the initial force on each column was set to 30 kN, i.e., the nominal value of for this test was 180 kN. During the first sliding, the normal force slightly decreases while the pad moves away from the central point. This can be attributed to the reduction of the compression force on the pad due to the lower height of the cap. The decrease in normal force at mm is approximately 38% of the nominal value.
In the second run, the normal force increases to a maximum corresponding to that of ; it then decreases while approaching mm. It is worth mentioning that the peak reached in this phase is 12% lower than the initial value. This indicates the occurrence of several phenomena, among which are (i) embedding of the elastomeric pad in the receptacle of the sliding carriage, (ii) wear/abrasion of the elastomeric component on the contact side and (iii) self-adjustment of the loose parts of the apparatus.
The calculation in Equation (12) is an estimation based on the hypothesis that the plate is perfectly rigid, i.e., all the Belleville washers undergo the same displacement. It can be observed that the coefficient of friction increases during the second run. This is consistent with the wear of the elastomeric pad on the contact side.
For the sake of comparison, Figure 15 shows the plots of tests carried out with an initial value of equal to 100 kN.
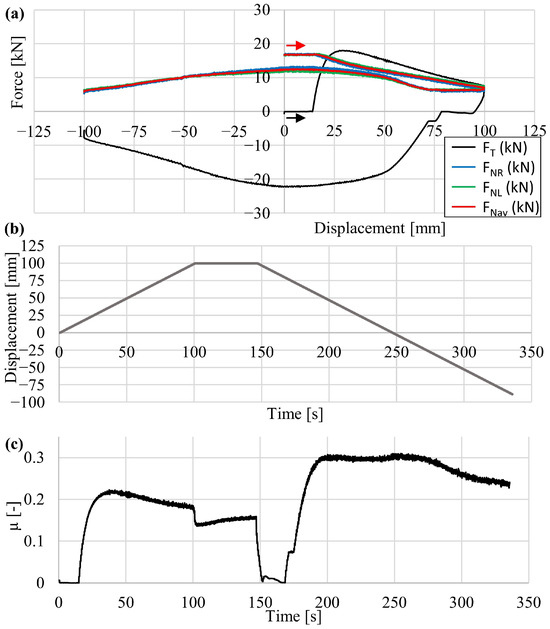
Figure 15.
Plot of (a) tangential and normal forces versus displacement, (b) Displacement versus time and (c) appearent coefficient of fricion versus time (initial normal force kN).
By comparing Figure 14 and Figure 15, it can be observed that the percent reductions in are more relevant in the second case. Specifically, the reduction in at the end of the first sliding is equal to 58% of the initial value, while the difference between the initial value and the second peak is equal to 24%. This finding suggests that the normal load applied by the system is more stable at higher values. This result is consistent with the characteristics of the elastic system presented in Section 2.3 and shown in Figure 6.
It is crucial to note that due to the lack of alternative equipment designed for this specific type of testing, the comparison of these results with any existing primary data is currently not possible.
4. Conclusions
The research detailed in this paper outlines the development and construction of an innovative piece of equipment specifically designed to evaluate the interaction between tires and runway light fixtures during landing sequences. The finalized design exhibits ease of manufacturability while ensuring exceptional stiffness during testing, substantiated through finite element analysis (FEA). The use of Belleville washers enables the seamless reconfiguration of the system to accommodate the varying normal loads required for the tests.
Significantly, this equipment does not necessitate specialized actuation, as it is tailored for use with a universal testing machine. This feature broadens its accessibility, offering numerous research centers and companies the opportunity to conduct analyses on runway light fixtures. Furthermore, the design’s incorporation of forklift supports simplifies the handling of the testing equipment.
Preliminary tests have evidenced the efficacy of this equipment in measuring the tangential force exerted on the runway fixture. Notably, the utilization of washers contributes to minimizing the force fluctuations attributable to fixture shapes.
The collective merits outlined above position the testing equipment elucidated in this paper as a notable advancement in experimental methodologies for the assessment of runway lighting.
Author Contributions
Conceptualization, M.D.A. and S.F.; methodology, M.D.A., S.F. and D.C.; validation, M.D.A., G.O., M.M. and C.S.; formal analysis, G.O.; investigation, D.C., M.D.A., S.F., M.M., G.O. and C.S.; data curation, G.O.; writing—original draft preparation, M.M. and C.S.; writing—review and editing, M.M., C.S. and M.D.A.; supervision, D.C. and M.D.A.; project administration, M.D.A. and S.F.; funding acquisition, M.D.A., S.F. and D.C. All authors have read and agreed to the published version of the manuscript.
Funding
The research on the equipment described in this paper has been partially funded by OCEM Airfield Technology, Energy Technology srl.
Data Availability Statement
Additional information can be requested from the authors.
Acknowledgments
The authors would like to thank Matteo Mazzotti at OCEM Airfield Technology, Energy Technology srl, Bologna (IT) for supporting this project.
Conflicts of Interest
The authors declare no conflicts of interest.
References
- Granado, J.; Chávez, J.; Torralba, A.; Oria, A.C. Modeling airfield ground lighting systems for narrowband power-line communications. IEEE Trans. Power Deliv. 2010, 25, 2399–2405. [Google Scholar] [CrossRef]
- Sudjoko, R.I.; Hartono; Hariyadi, S.; Suwito. Design and Simulation of Airfield Lighting System Using 8 Luminaire in Airfield Lighting Laboratory at Politeknik Penerbangan Surabaya. J. Phys. Conf. Ser. 2021, 1845, 012034. [Google Scholar] [CrossRef]
- Chlebek, J. Runway lighting systems as a key tool to extend operational capabilities of VFR airports. Transp. Res. Procedia 2019, 43, 236–242. [Google Scholar] [CrossRef]
- McMenemy, K.; Niblock, J.; Peng, J.X. Monitoring the Performance of Aerodome Ground Lighting. Int. Airpt. Rev. 2008, 12, 60–64. [Google Scholar]
- Sitompul, D.S.D.; Surya, F.E.; Suhandi, F.P.; Zakaria, H. Runway Edge Light Photometry by Vertical Scanning Method Using Drone Mounted Photodiode Array. In Proceedings of the International Conference on Electrical Engineering and Informatics, Bandung, Indonesia, 9–10 July 2019; pp. 301–305. [Google Scholar] [CrossRef]
- Hebborn, A. A380 Landing Gear and Systems—The Feet of the Plane; Airbus: Hamburg, Germany, 2008. [Google Scholar]
- Commercial, B. 777-200/300 Airplane Characteristics for Airport Planning; Boeing Co.: Seattle, WA, USA, 1998. [Google Scholar]
- Administration, F.A. Advisory Circular AC150/5345-42H; Technical Report; Federal Aviation Administration, U.S. Department of Transportation: Washington, DC, USA, 2015.
- EASA. Certification Specifications for Large Aeroplanes; Cs-25; EASA: Cologne, Germany, 2005; p. 750.
- Croccolo, D.; De Agostinis, M.; Fini, S.; Mele, M.; Olmi, G. Effect of different underhead shot-peening and lubrication conditions on high-strength screws undergoing multiple tightenings. Tribol. Int. 2023, 188, 108874. [Google Scholar] [CrossRef]
- ISO 898-1: 2013; Mechanical Properties of Fasteners Made of Carbon Steel and Alloy Steel. Part 1: Bolts, Screws and Studs with Specified Property Classes—Coarse Thread and Fine Pitch Thread. Technical Report; ISO: Geneva, Switzerland, 2013.
- Wahl, A. Mechanical Springs, 2nd ed.; Mc GrawHill Book Company: Berlin, Germany, 1964. [Google Scholar]
- Niemann, G.; Winter, H.; Hohn, B.R. Maschinenelemente Bd I; Springer: Berlin, Germany, 2005. [Google Scholar]
Disclaimer/Publisher’s Note: The statements, opinions and data contained in all publications are solely those of the individual author(s) and contributor(s) and not of MDPI and/or the editor(s). MDPI and/or the editor(s) disclaim responsibility for any injury to people or property resulting from any ideas, methods, instructions or products referred to in the content. |
© 2024 by the authors. Licensee MDPI, Basel, Switzerland. This article is an open access article distributed under the terms and conditions of the Creative Commons Attribution (CC BY) license (https://creativecommons.org/licenses/by/4.0/).