Article

New Method for Precise Measurement of Clamping Plate Deformations on Forming Presses

1
ICM—Institute for Mechanical and Plant Engineering Chemnitz e.V., Otto-Schmerbach-Straße 19, 09117 Chemnitz, Germany
2
Machine Tool Development and Adaptive Controls, Institute of Mechatronic Engineering, TUD Dresden University of Technology, Helmholtzstraße 7a, 01069 Dresden, Germany
*
Author to whom correspondence should be addressed.
Machines 2024, 12(1), 40; https://doi.org/10.3390/machines12010040
Submission received: 14 November 2023 / Revised: 1 January 2024 / Accepted: 3 January 2024 / Published: 5 January 2024

Abstract

:
The deformation of press bolster plates under load can significantly impact the quality of manufactured workpieces. Consequently, press manufacturers are usually obliged to provide the metric proof of the permissible deformation values during the press commissioning process. Unfortunately, the existing measurement methods for determining bolster plate deformations present flaws in the measurement accuracy, the application flexibility, the metrological effort, and other aspects. These issues have been addressed through the development of a new measurement method using multiple inclination profiles on the surface of the measured object. Based on the difference in the inclination between the unloaded and loaded states, the method approximates the inclination surface and calculates the deformation of the measured object through integration. The measurement method was first used for commissioning tests of forming presses. A comparison with the results obtained with a measurement frame equipped with high-resolution measurement probes demonstrates an accuracy of the new method of less than 20 µm.

1. Introduction

The experimental characterization of machine tools plays an increasingly important role in quality assurance, process design, and predictive maintenance. This article focuses on the experimental determination of static deformations in machine tools using the example of forming presses. A novel measurement method is presented for determining deformations and deflections in machine tool assemblies based on locally measured inclination signals. In this paper, it is initially demonstrated that this method achieves a similar or even higher measurement accuracy compared to previous methods, with the potential for increased application flexibility, reduced metrological effort, and other positive effects.
In the case of deformation measurements, particularly in forming presses, the determination of bolster plate deformations under load is usually of primary interest. Figure 1 depicts a schematic representation of a press working area and a loading device consisting of multiple load cylinders. In Figure 1a, the press is shown in an unloaded state. Figure 1b illustrates the ram in the bottom dead center (BDC), with both the bolster plate and the ram plate subjected to a loading force applied by the load cylinders. Both plates deform due to this loading force.
One simple measurement method to capture these deformations involves placing displacement sensors (e.g., dial gauges) on freestanding measurement stands within the press working space, as described in [1,2]—see Figure 2a. However, this approach has several disadvantages. Firstly, it only allows for the measurement of overall deformations of the table and ram bolster plates without the ability to assign deformation values to one of the two bolster plates. Secondly, the method introduces measurement errors caused by the inclination of the freestanding sensors due to the deflection of the table and the ram bolster plates, resulting in angular errors.
These problems have been addressed by using measuring frames [3,4,5,6,7] or measuring bars [8,9,10] equipped with displacement sensors. However, the measurement frames (Figure 2b) and bars (Figure 2c) have disadvantages such as low flexibility, a high setup effort, and their mounting points do not align with the corners of the press table in most cases, even in modular systems. As a result, the setups experience displacement in the z direction due to a bolster plate deformation, which distorts the measurement. Tehel addresses the issue of support point displacement during bolster plate deformations by employing an additional laser tracker measurement at the support locations of a measurement bar [8]—see Figure 2e. The method appears labor-intensive since the laser tracker can only measure the displacement of a single target at a time. The accuracy may be compromised due to a lack of synchronization between the measurement techniques (i.e., the measuring bars and laser tracker). Moreover, support structures like measurement frames and bars have a tendency toward oscillation during the dynamic load introduction, making reliable and accurate data analysis challenging—see, for example, the measurement results in [4,11].
Struck also uses measuring bars, which are mounted in the T-slots of the bolster plate and which use eddy current sensors to measure the change in distance of the measuring bar from the T-slot base at various points in the T-slots [6]. Struck also performs a second measurement to determine the self-displacement of the measuring bars as the table deforms. To do this, he uses additional measuring bars at 90° to the T-slots, located in the corners of the bolster plate (Figure 2d). Based on this arrangement, the displacements of the T-slot bars are measured at their outer edges using precision probes. This method seems labor-intensive to implement. The self-displacement of the additional measurement bars cannot be securely ruled out, as their support points may not necessarily be in the table corners when the table dimensions vary. Another disadvantage is the considerable effort required for the material-specific calibration of each eddy current sensor to the corresponding measurement object (i.e., the bolster plate).
Optical measurement methods with external references, based on laser trackers [12,13,14,15] (Figure 2f), laser–PSD combinations [16] (Figure 2g), or stereo camera systems [9,11,17,18,19,20,21,22,23,24] (Figure 2h), have also been used for the determination of bolster plate deformations.
Laser trackers capture the movements of measurement targets mounted on the press clamping plate. By design, these systems only capture the motion of a single target per measurement. In deformation measurements with many targets, a larger number of individual measurements must be conducted, requiring a separate ram stroke with the machine for each. Laser PSD (Position Sensitive Detector) applications also rely on a laser positioned in front of the machine, but the displacement measurement of the individual measurement points is carried out by PSD sensors positioned inside the machine (alternatively, CCD sensors or similar can be used). Again, multiple unsynchronized individual measurements must be performed in this case as well.
For the evaluation of stereo camera recordings, various methods are employed, including stereoscopy [11,18,19,22,23,24] and the Digital Image Correlation (DIC) method [9,20,21]. The DIC method is becoming an increasingly important measurement method for deformation measurements. A comprehensive overview of DIC methods for capturing surface deformations up to 2018 is provided in [25]. Some recent contributions can be found in [23,24,25,26,27,28,29,30,31]. Due to the restricted visibility of the press working area, identifying the deformation measurement directly on the clamping plates’ surface is not feasible. Therefore, reflective markers must be used in both methods, distributed across the clamping plate. The displacement measurement of the markers, unlike with the laser tracker and laser PSD applications, is synchronized for all markers. However, Pilthammar indicates that, for a sufficiently accurate image evaluation using the DIC method, several individual measurements have to be performed, with each measurement capturing the deformation of a quarter of the clamping plate [9]. A resolution of the deformation measurement of only 0.1 mm was achieved. Müller utilized classical stereoscopy for image evaluation and reported similarly low resolutions for the deformation measurement using a single stereo camera system (0.2 mm) [18]. Further improvement in accuracy was achieved through the use of two synchronized stereo cameras. Salfeld specifies a measurement accuracy of 25 µm for this setup [32]. However, these approaches have the disadvantages of a high setup effort and high acquisition costs, with the base version of a suitable stereo camera system costing around EUR 70,000 and a suitable laser tracker costing at least EUR 100,000. Overall, optical measurement methods with external references are not optimal for determining bolster plate deformations on forming presses.
Another optical measurement method is based on optical fiber sensors integrated into specially designed measurement beams [9,33]—see Figure 2j. The beams are securely connected to the clamping plate through specially designed clamping elements, allowing them to follow its deformation under load. While Pilthammar provides good correlation coefficients for a comparison with the stereo camera measurements (based on the DIC method) in his latest publication, the resolution of the DIC approach is only stated as 0.1 mm. Therefore, the measurement accuracy of the new method is not yet precisely known and must be assumed to be 0.1 mm.
Another indirect measurement method is based on strain measurements and the calculation of deformations using an analytical deformation model. The strain measurements can be performed either directly on the measurement object (Figure 2i) [18] or on a measurement beam firmly connected to the clamping plate [9]—see Figure 2j. The method only provides coarse measurement results in the range of 0.15 mm [9]. Furthermore, it is unclear how the decision is made regarding which polynomial degree is assigned to the underlying polynomial model to represent the real deformation. From conversations with press manufacturers, another basic method is known, which involves placing compression specimens within the working area (Figure 2l). Upon plastic deformation of the specimens by the machine, they are individually measured, and the height changes are used to calculate the overall deformation. Disadvantages include the limitation of only measuring overall deformations, a high inaccuracy due to the elastic springback of the compression specimens and their support structure, and a significant time expenditure.
Other approaches for the in-process measurement of bolster plate deformations are based on strain gauge- and piezo-based sensors for the measurement of width changes of T-slots under load [12,34,35] (Figure 2k), as well as novel clamping systems for forming tools [36,37] where the deformation of the clamping devices themselves is used to infer the bolster plate deformation. However, the calculation of absolute deformation values from the measurement data of both systems can currently only be achieved through prior calibration measurements using established measurement methods.
The main disadvantages of previous measurement methods for capturing clamping plate deformations in forming presses can be summarized as follows:
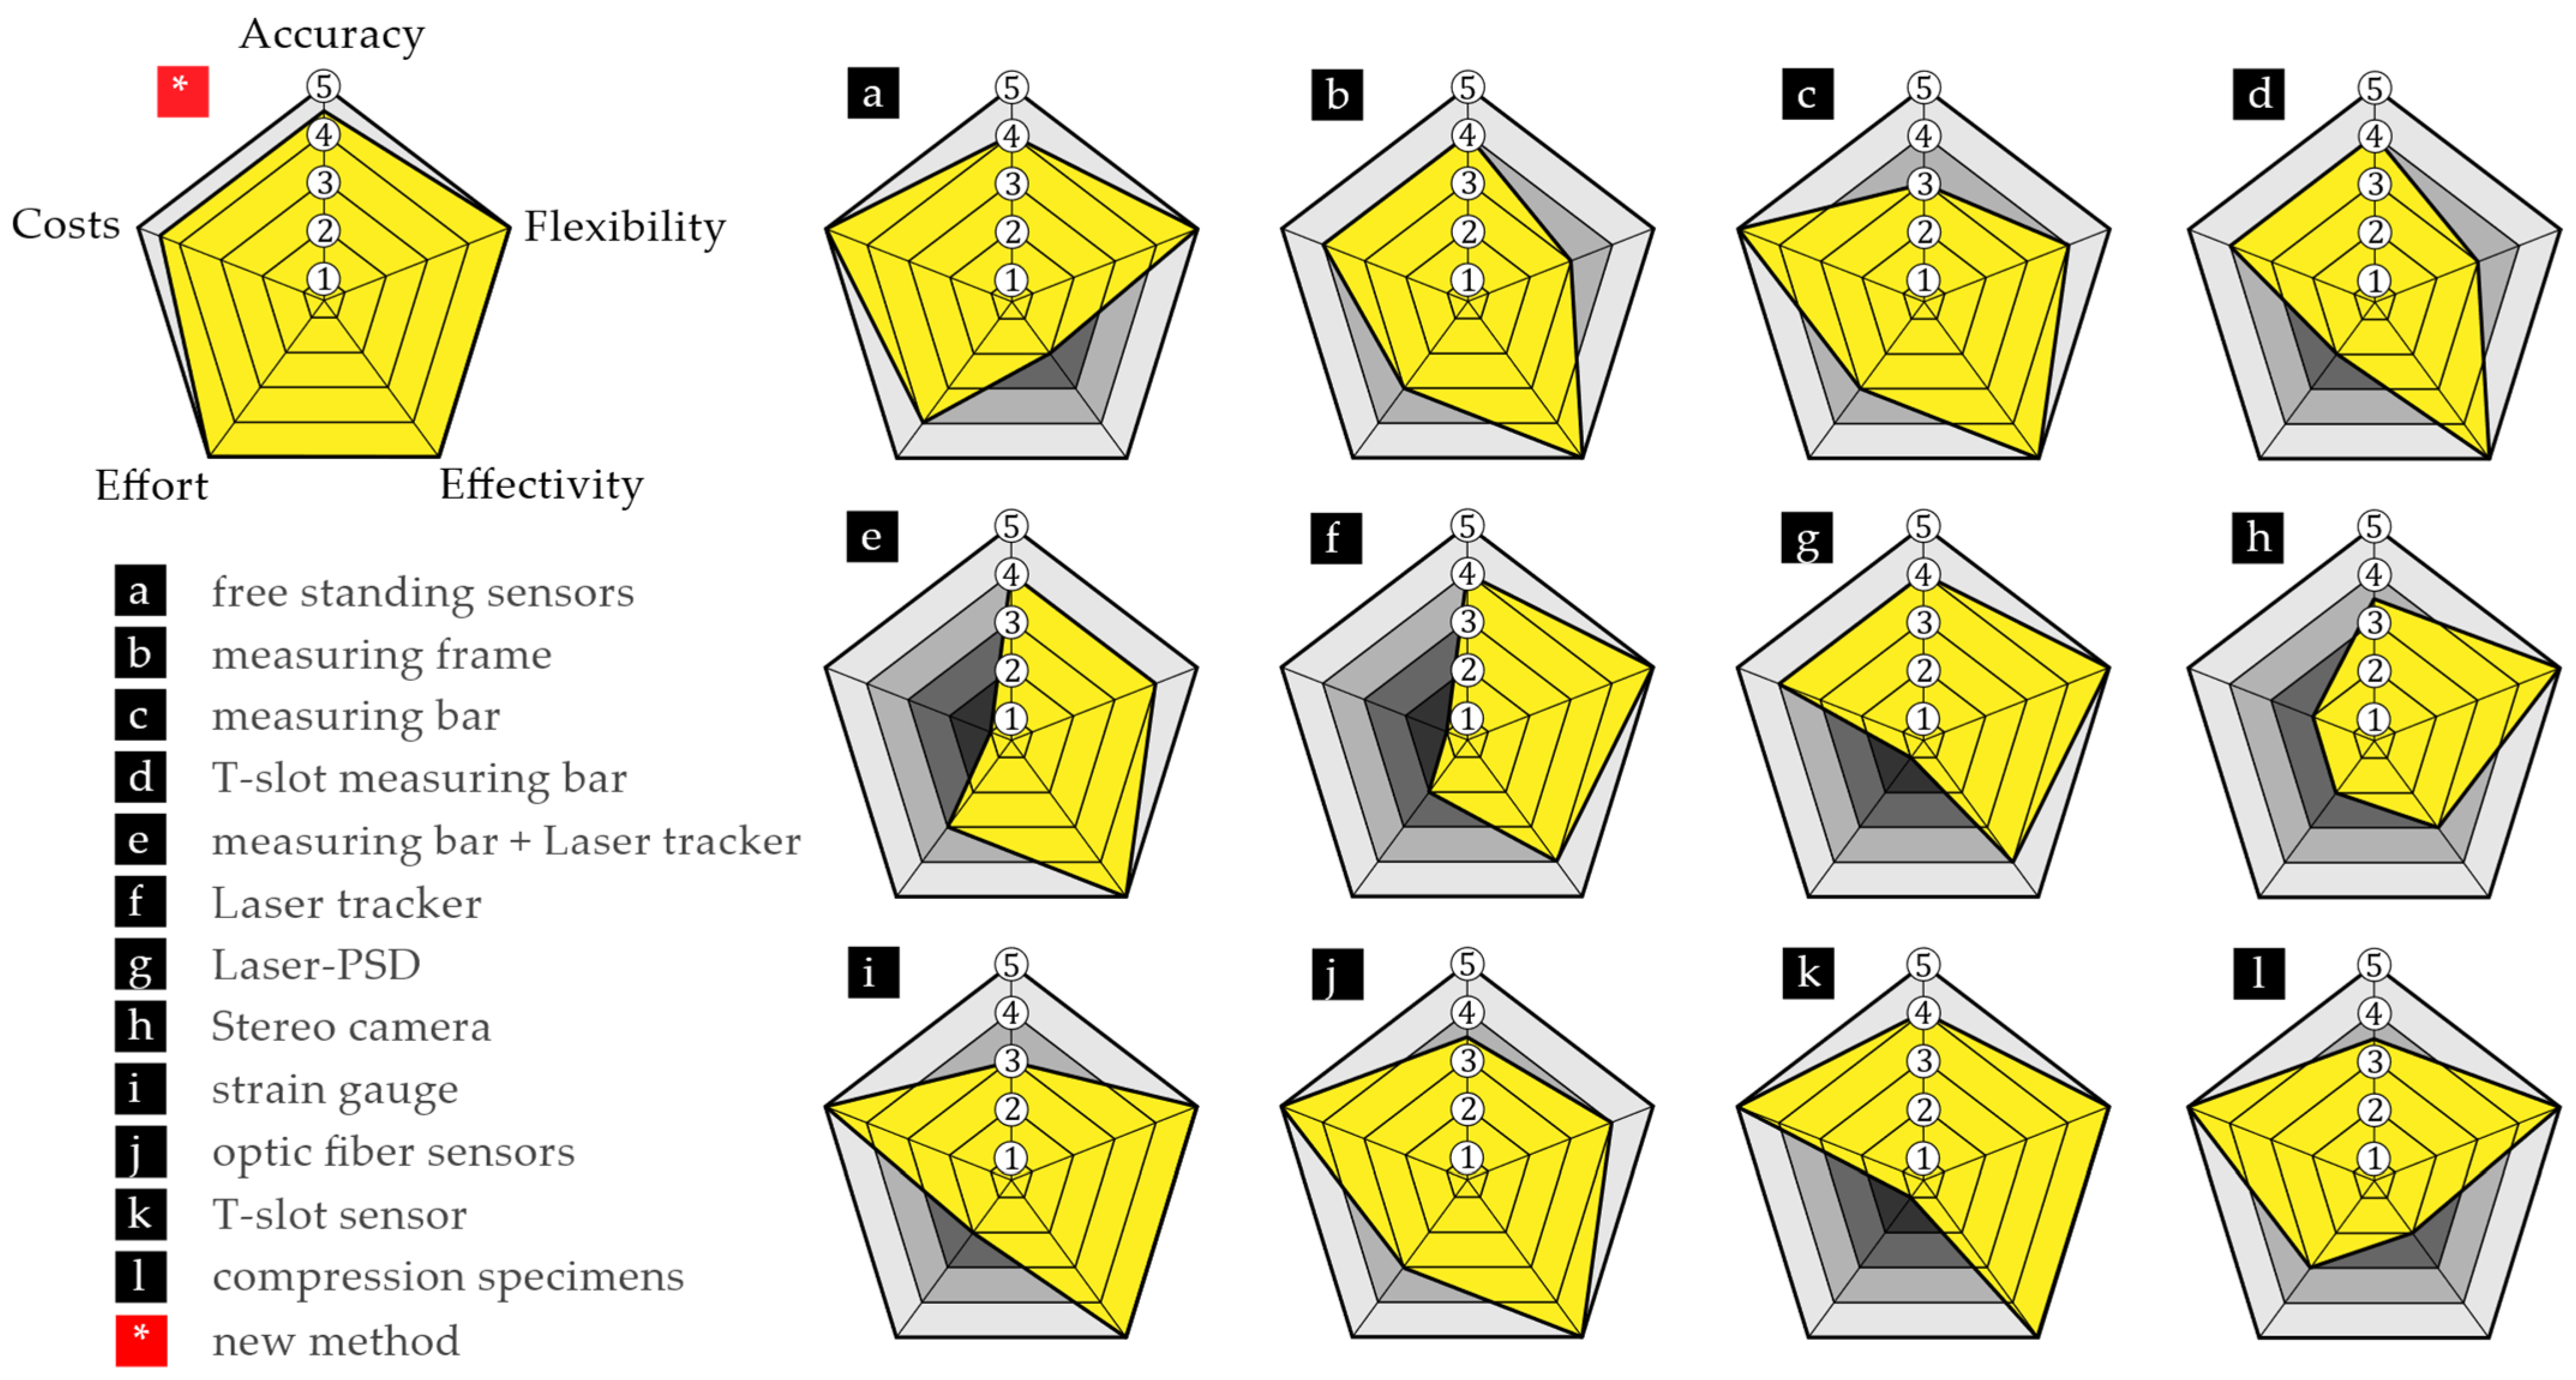
  • Accuracy: low resolution/coarse results;
  • Flexibility: inflexibility for varying machine dimensions;
  • Effectivity: only overall deformations; limited visibility of the clamping plate;
  • Effort: time-consuming setup, many measurements, and calibration measurement;
  • Costs: expensive equipment; execution only by highly qualified staff.
Figure 3 shows an evaluation of the previously used measurement methods based on the criteria mentioned above. The evaluation is based on our own professional judgment and is to be understood qualitatively. It becomes evident that existing measurement methods are not suitable in all aspects for the specific requirements in capturing clamping plate deformations in forming presses. This article addresses these limitations by introducing a new measurement approach based on local inclination measurements. As Figure 3 illustrates, the authors succeed in improving the experimental measurement of clamping plate deformations in all aspects. In comparison to previous measurement techniques, the new measurement method combines high accuracy with high efficiency in capturing separate deformations on the bolster and ram plate, as well as maximum flexibility for various workspace dimensions. The method offers straightforward handling, and the required metrological equipment is comparatively affordable. Potential users include press manufacturers, forming tool manufacturers, and press operators.
Most existing contributions on inclination-based deformation measurements primarily deal with the analysis and monitoring of structures such as buildings or geotechnical systems and do not specifically address the experimental analysis of machine tools. Furthermore, none of the previous studies anticipate the results presented here from a methodological perspective. Some representative contributions can be found in [38,39,40,41,42].

2. Development and Testing of an Inclination-Based Deformation Measuring Method

The following work is organized in two parts: a theoretical investigation followed by an experimental validation. Initially, a method to determine two-dimensional deformations on a 2D bending beam is considered, examining the effects of the measurement point number and positioning. Subsequently, the method was expanded to measure three-dimensional deformations and to conduct theoretical functional testing. To experimentally validate the three-dimensional measurement method, measurements are first performed on a test object in a laboratory setting. Subsequently, comparative measurements are conducted using a measurement framework and precision probes to authenticate the results. In the second stage of validation, the deformation of the bolster plate is recorded on an industrial machine during press commissioning at a press manufacturer. Again, comparative measurements are conducted using a measurement frame equipped with several precision probes.

2.1. Development and Theoretical Testing

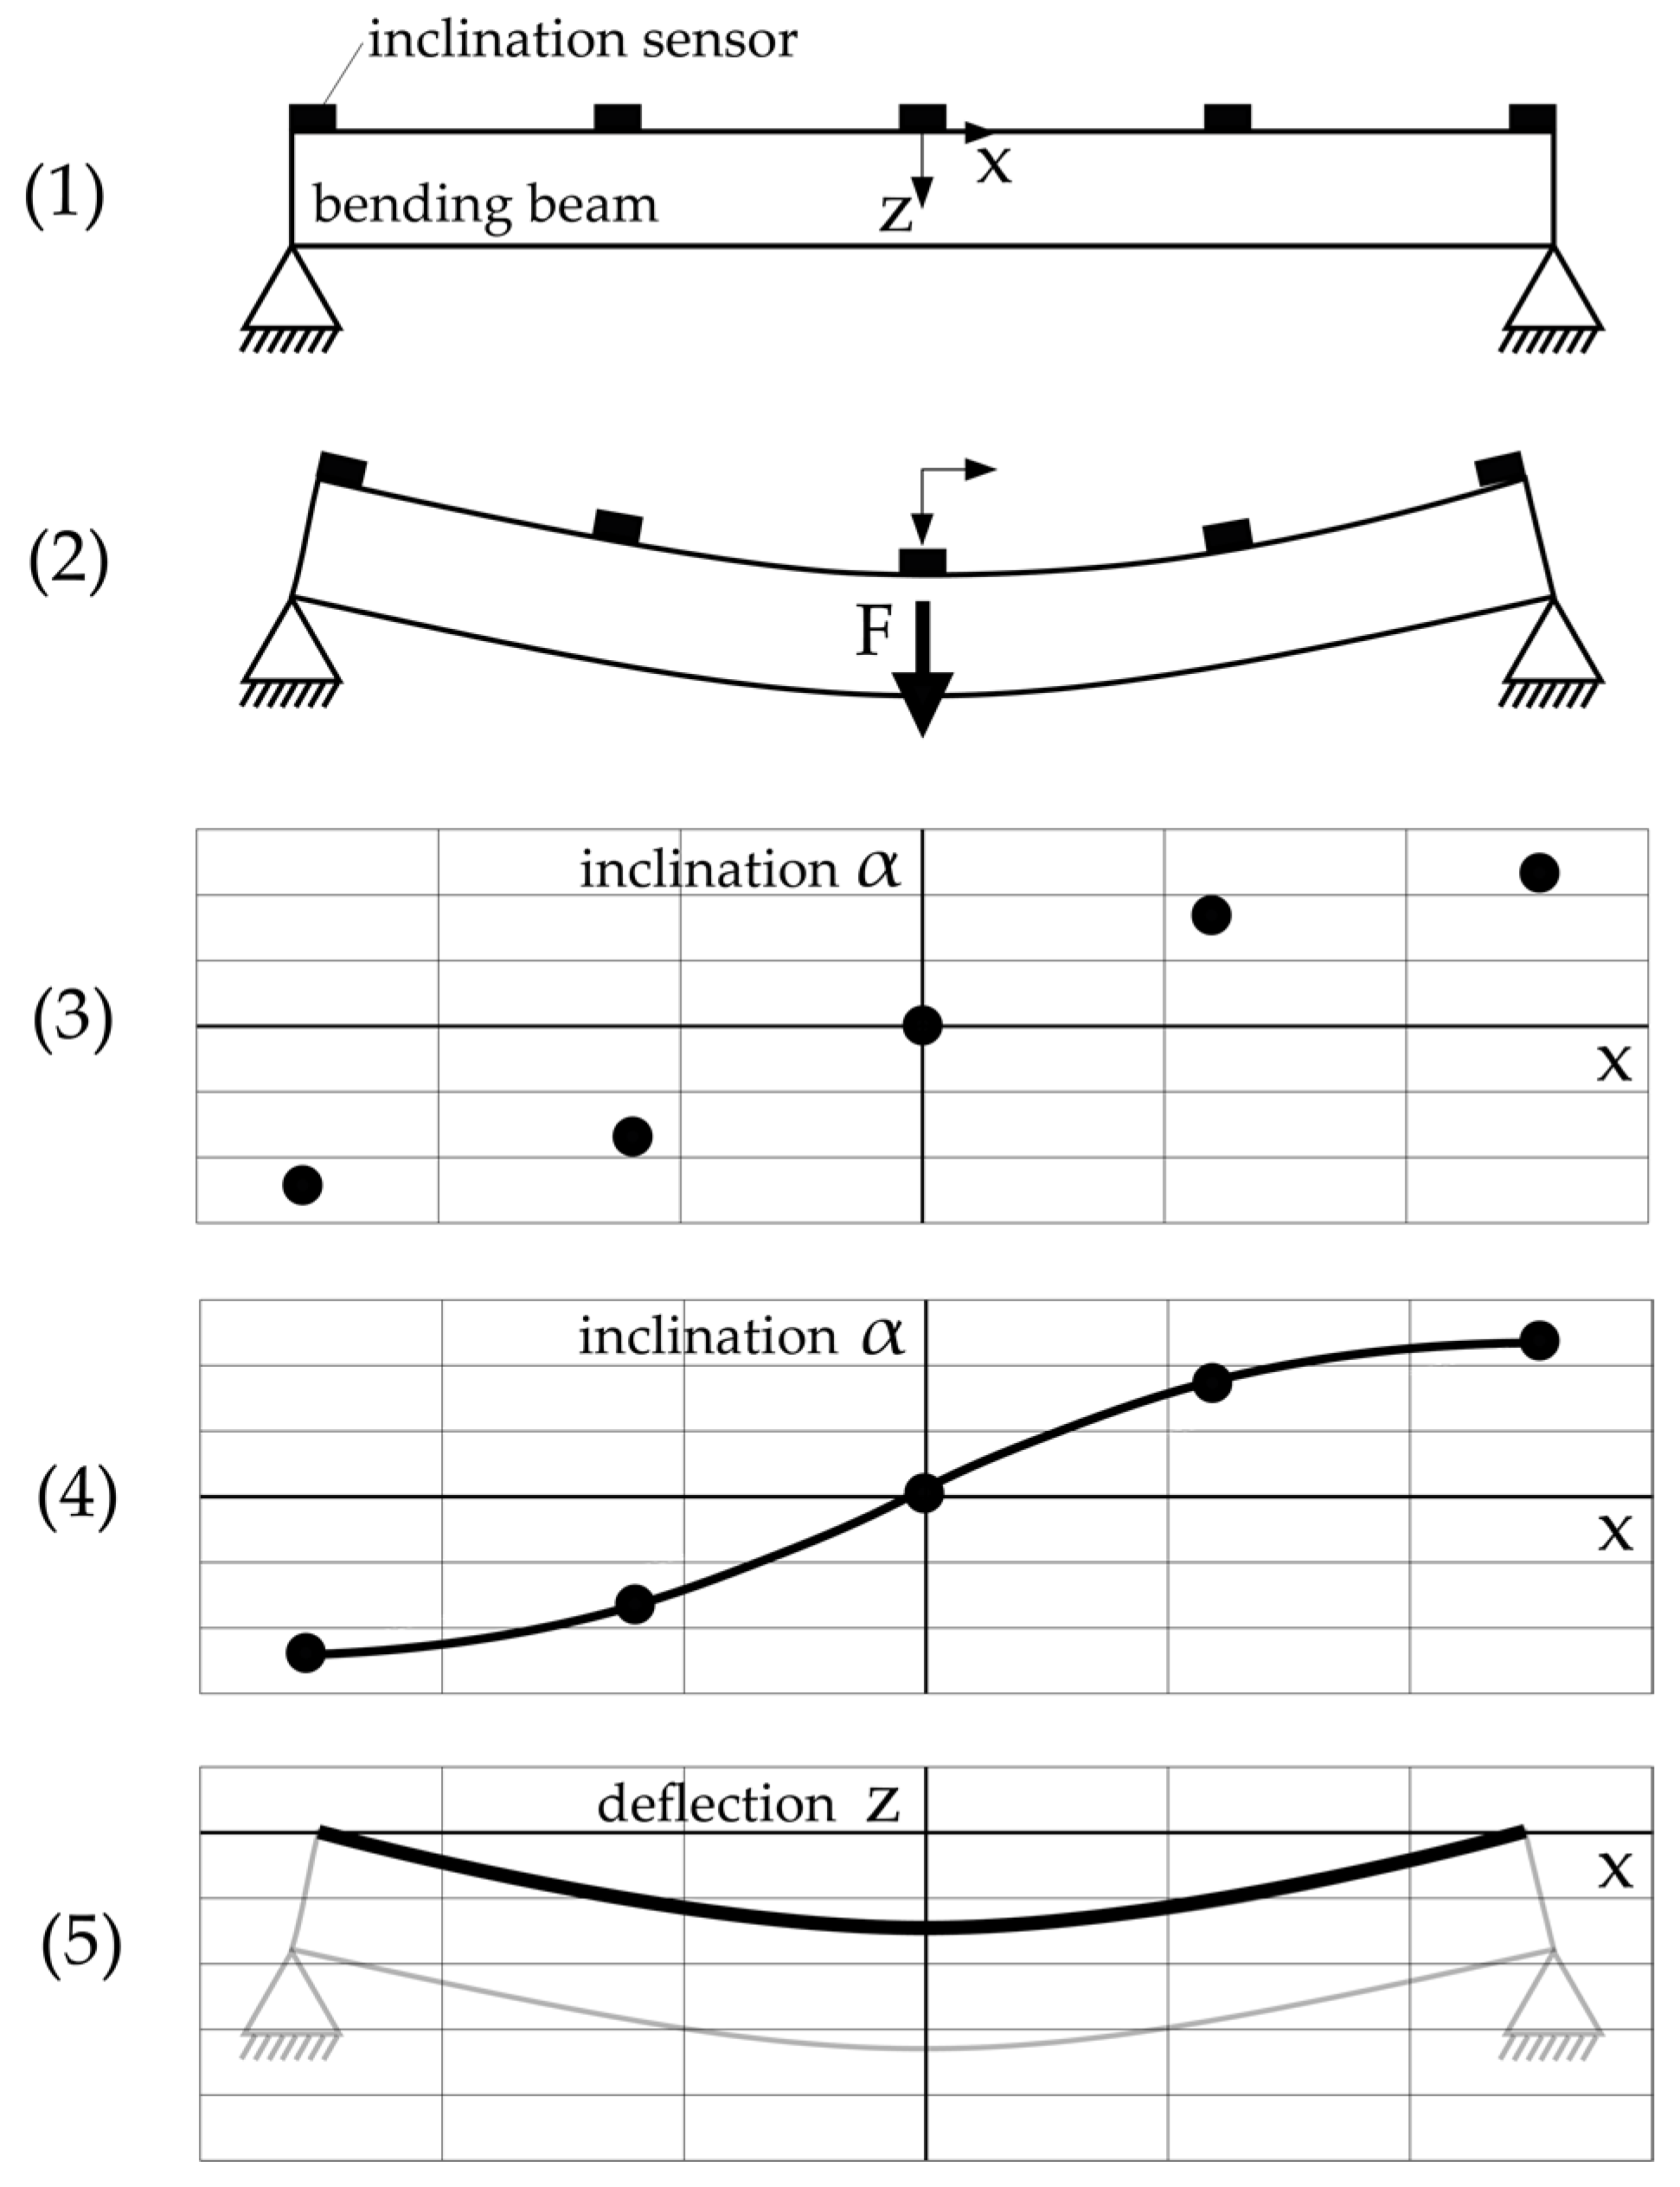
2.1.1. Approach for Two-Dimensional Measurements

This measurement method is based on inclination sensors arranged on a measurement object—see Figure 4. The approach uses two inclination values at each x position of the measurement object, in both its unloaded (1) and loaded state (2)—see Equation (1). The difference in inclination between the unloaded state α u n l o a d ( x ) and the loaded state α l o a d ( x ) of the measurement object is then calculated to α ( x ) and plotted against x (3). A Matlab® internal spline fitting function is then used to approximate the overall trend of the inclination differences (4).
α ( x ) = α u n l o a d ( x ) α l o a d ( x )
z ( x ) =   α A p p r o x ( x )   d x
Finally, the numerical integration of the approximation function α A p p r o x ( x ) along the length of the measurement object results in the deformation curve of the measurement object under load z ( x ) (5)—see Equation (2).

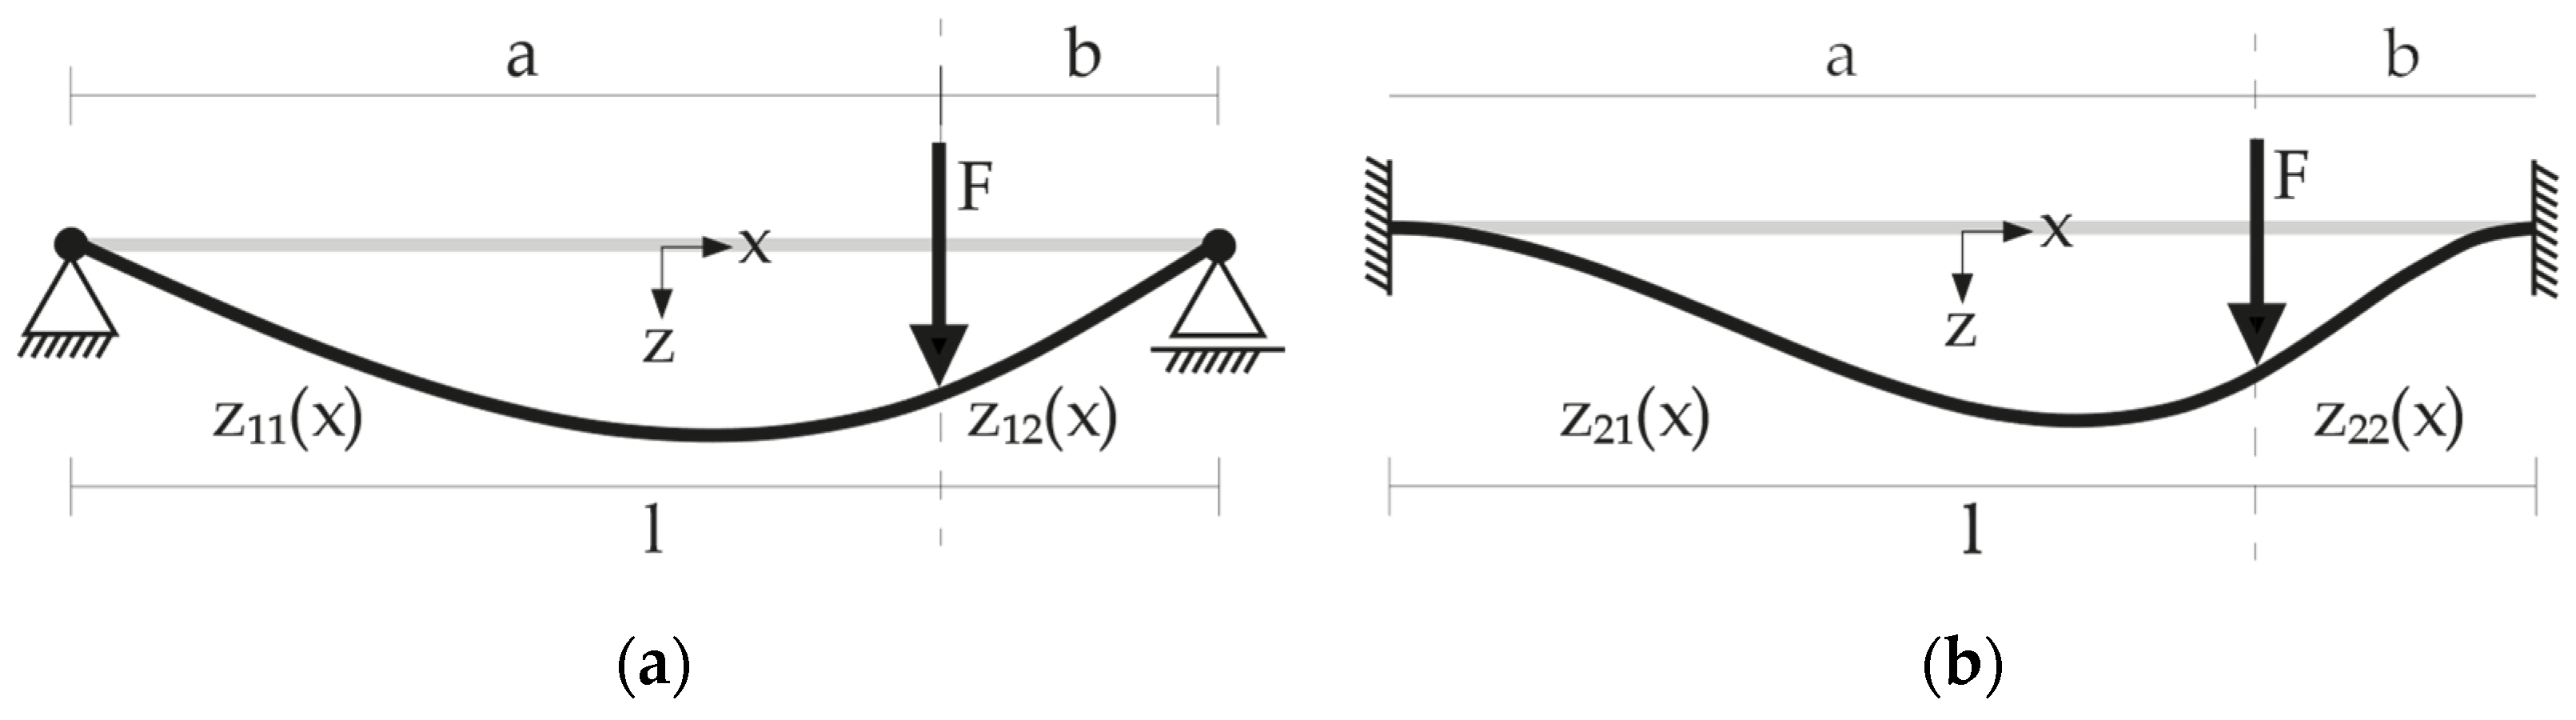
2.1.2. Theoretical Analysis of the Example of a Two-Dimensional Bending Beam

The measurement method was first subjected to a basic theoretical functional test on the 2D bending beam. The aim of this first investigation was, on the one hand, to provide a simple theoretical proof of function for the inclination-based measurement method. On the other hand, the sensitivity of the measurement result to the number of measurement points and the positioning of the measurement points should be fundamentally analyzed. Figure 5 shows the boundary conditions used in this analysis.
Two bending curve approaches were considered: a bending curve with support on both sides with loose bearings (beam (a), Equations (3) and (4)), and a bending curve with support on both sides with fixed clamping (beam (b), Equations (5) and (6)). z 11 ( x ) and z 21 ( x ) represent the deformations of the bending beams from their left end to the position of the applied load force, while z 12 ( x ) and z 22 ( x ) represent the deformations from the load position to the right end of the beam.
Here, l is the length of the bending beam, a is the distance of the applied load force from the left end of the beam, and b is the difference between the beam length l and the distance a .
z 11 ( x ) = b 6 · l · ( l 2 · x b 2 · x x 3 ) , l 2 x < 0
z 12 ( x ) = b 6 · l · ( l b · ( x a ) 3 + ( l 2 b 2 ) · x x 3 ) ,   0 x l 2
z 21 ( x ) = b 2 6 · ( a + b ) 3 · ( 3 · a · ( a + b ) x · ( 3 · a + b ) ) · x 2 , l 2 x < 0
z 22 ( x ) = a 2 6 · ( a + b ) 3 ( a · ( a + b ) x · ( 3 · b + a ) ) · ( a + b x ) 2 ,   0 x l 2
The results of the theoretical preliminary investigations in the 2D space are shown in Figure 5 and Figure 6. Starting from the theoretical Equations (1)–(4), the bending curve profiles were first calculated for both support situations. The accuracy of the measurement methods presented is theoretically independent of the length and the maximum deflection of the bending beam. Therefore, the values for load force F, elasticity modulus E, and moment of inertia Iy were set to 1, and the bending curve profiles were normalized for this initial qualitative investigation. The derivation of the equations yields the inclination curves over the bending curve length—see Equation (7).
α i j ( x ) = d d x z i j ( x )
Now, the task was to reconstruct the original bending curve out of just a few local inclination values at different x positions. The theoretical inclination measurements can be calculated from the derivative equations at predefined x values (the theoretical measurement positions)—see Figure 6. Then the inclination curves were approximated from these local inclination values and their associated positions using a MATLAB® internal spline interpolation function. Finally, the calculation of the bending line curve was achieved through a numerical integration of the resulting inclination approximation. The legends in Figure 6a and Figure 7a are to be applied to Figure 6b–f and Figure 7b–f, and they represent the steps from Figure 4.
It turns out that for a simple 2D bending line with both sides loosely supported, the original deformation profile of the bending beam can already be reconstructed based on just four inclination values evenly distributed over the length of the beam—see Figure 6a. The maximum error is already below 3% with only four theoretical measurement points in relation to the maximum deformation—see Figure 6g. For the slightly more complex deformation profile of the beam with both sides firmly clamped, significantly larger errors arise with such a small number of measurement points—see Figure 6b,h. However, a simple manual optimization of the theoretical measurement positions already shows a significant improvement of the theoretical measurement result—see Figure 6d,h.
The manual optimization involved a systematic trial of various theoretical measurement positions. Alternatively, the number of measurement points can be increased to enhance the measurement accuracy—see Figure 6e–h. Figure 7 shows, following the same approach as described above, the results of an investigation of an off-centric load application on the 2D bending beam.
Here too, a manual optimization of the theoretical measurement positions leads to a significant improvement in the theoretical measurement results, compared to an even distribution of the measurement points—Figure 7c,d,g,h. With loose support on both sides (beam a), an increase in accuracy can be achieved by optimizing the measuring points, even by reducing the number of measuring points from four to three. A bending beam with loose support on both sides can be represented with a measurement error of less than 5% using three theoretical inclination measurements. For a bending beam with fixed support on both sides, a measurement error of about 10% is obtained with five manually optimized measurement positions. The theoretical measurement error generally decreases with an increasing number of measurement points—Figure 7e–h. For the even distribution of measurement points, Equation (8) was applied. Here, l represents the length of the bending beam, n is the number of measurement points, and x p o s ( i ) denotes the calculated theoretical measurement positions.
x p o s ( i ) = l ( n 1 ) · ( i 1 ) l 2 ,   1 i n
The investigation shows the theoretical functionality of determining deformations based on local inclinations and reveals the dependence of the measurement result on the number and positioning of individual measurement points. This will be further examined later in this work.

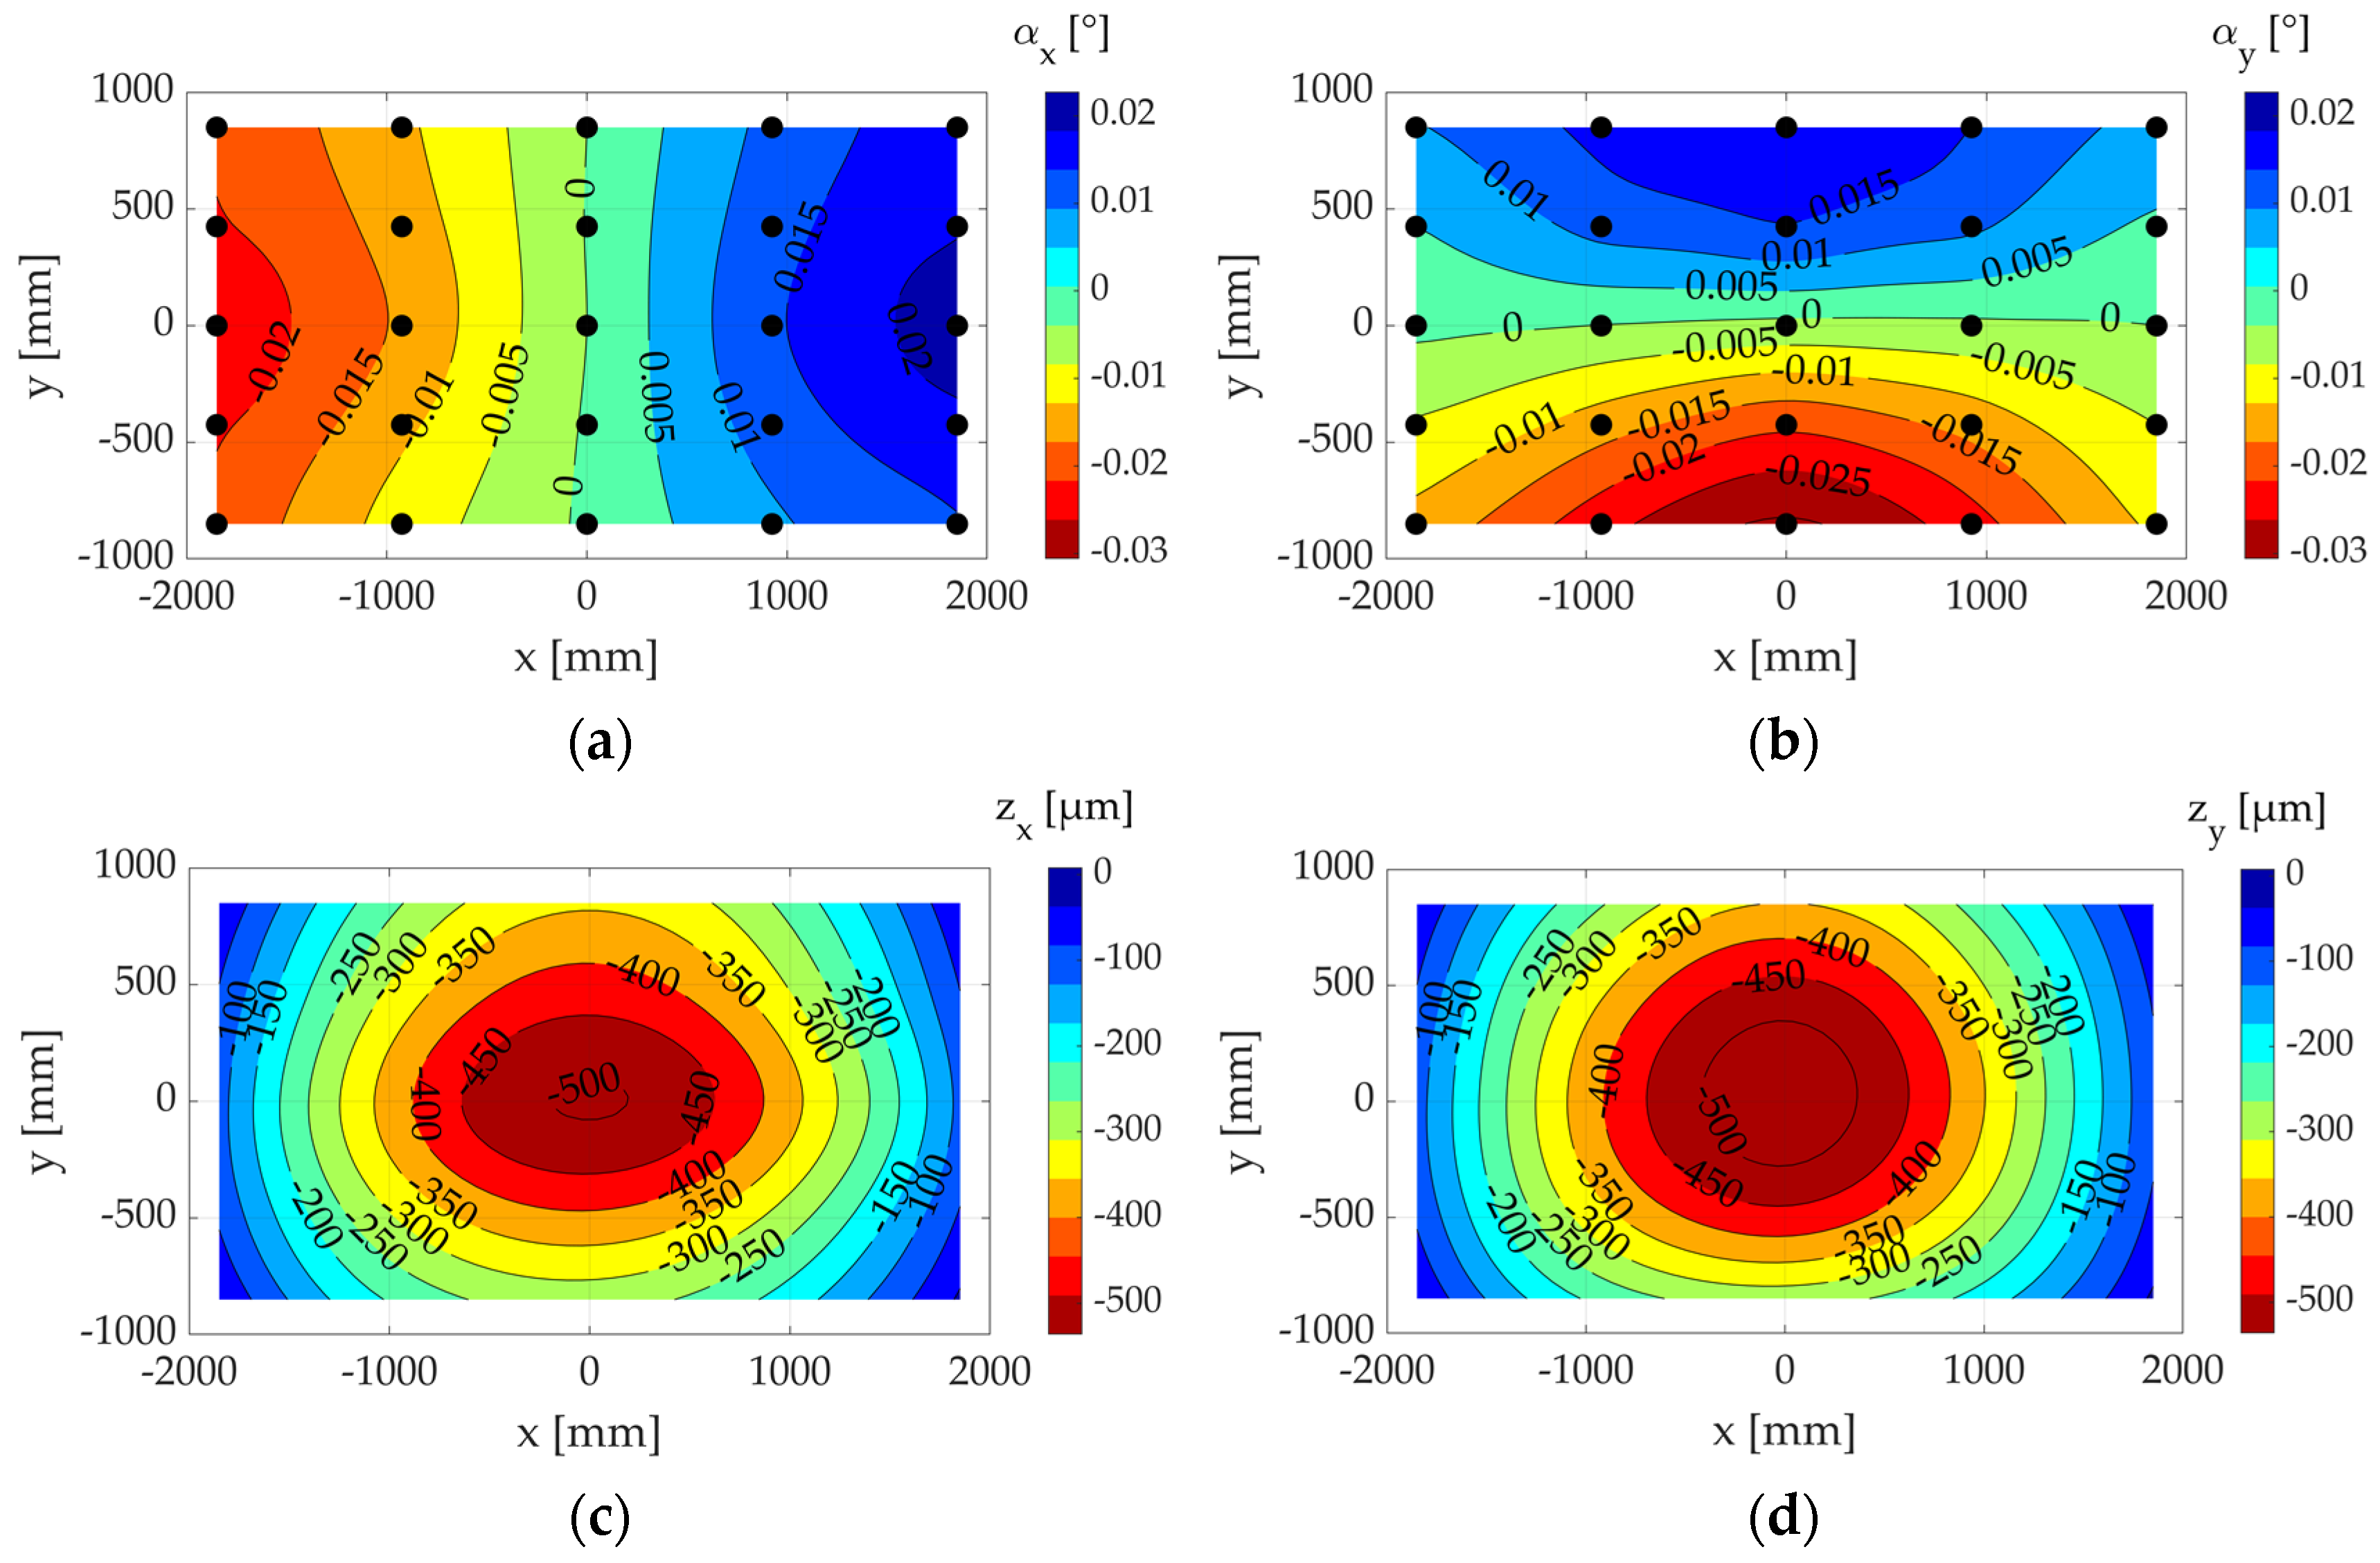
2.1.3. Approach for Three-Dimensional Measurements

The basic approach described above needs to be extended from a two-dimensional deformation measurement to a 3D space, which is the basis for deformation measurements of clamping plates of machine tools.
Figure 8 shows the basic approach. The load-induced local inclinations are determined at several measurement positions distributed on the measurement object (the bending plate), with inclinations being recorded in both the x and y directions (1). The inclination differences between the unloaded and loaded states are calculated following Equation (1). From the calculated inclination differences (2), two inclination surfaces are calculated, representing all measured inclinations in the x direction and the y direction, respectively (3). For this purpose, a MATLAB® internal interpolation function is used (the thin plate spline interpolation—TPS).
The two approximated inclination surfaces (3) are numerically integrated separately. This results in an integration surface from the inclination approximation in the x direction z i n t e g x * ( x i , y i ) and an integration surface from the inclination approximation in the y direction z i n t e g y * ( x i , y i ) (Figure 8; (4) above and below, respectively)—see Equations (9) and (10). Therefore, a l p h a x ( x i , y i ) represents the approximated inclination surface in the x direction and a l p h a y ( x i , y i ) the inclination surface in the y direction.
z i n t e g x * ( x i , y i ) =   a l p h a x ( x i , y i )   d x
z i n t e g y * ( x i , y i ) =   a l p h a y ( x i , y i )   d y
Based on these two integration surfaces, the final deformation surface (5) of the measurement object is calculated. Therefore, the initial displacements of the x-integration surface z i n t e g x * ( x i , y i ) at the minimum y-value and the initial displacements of the y-integration surface z i n t e g y * ( x i , y i ) at the minimum x-value are extracted. The x-initial displacements are then subtracted from the y-integration surface, and the y-initial displacements are subtracted from the x-integration surface over the full range of values—see Equations (11) and (12). Therefore, z i n t e g x ( x i , y i ) and z i n t e g y ( x i , y i ) represent the two integration surfaces in the x and y directions, corrected for edge deformations.
z i n t e g x ( x i , y i ) = z i n t e g x * ( x i , y i ) z i n t e g y * ( x m i n , y i )
z i n t e g y ( x i , y i ) = z i n t e g y * ( x i , y i ) z i n t e g x * ( x i , y m i n )
The background for this procedure is that there is no information available about the initial displacement of the inclination sensors at the edge of the bending plate at the minimum y-value for the inclination measurements in the x direction. The same applies to the inclination measurements in the y direction at the press table edge at the minimum x-value. The initial deformations of the two integration surfaces at the press table edges are integrated into the calculation of the deformation profile by the method described above. The final deformation surface z m e a s ( x i , y i ) is ultimately calculated as the arithmetic mean of the two resulting integration surfaces according to Equation (13)—Figure 8 (5).
z m e a s ( x i , y i ) = z i n t e g x ( x i , y i ) + z i n t e g y ( x i , y i ) 2

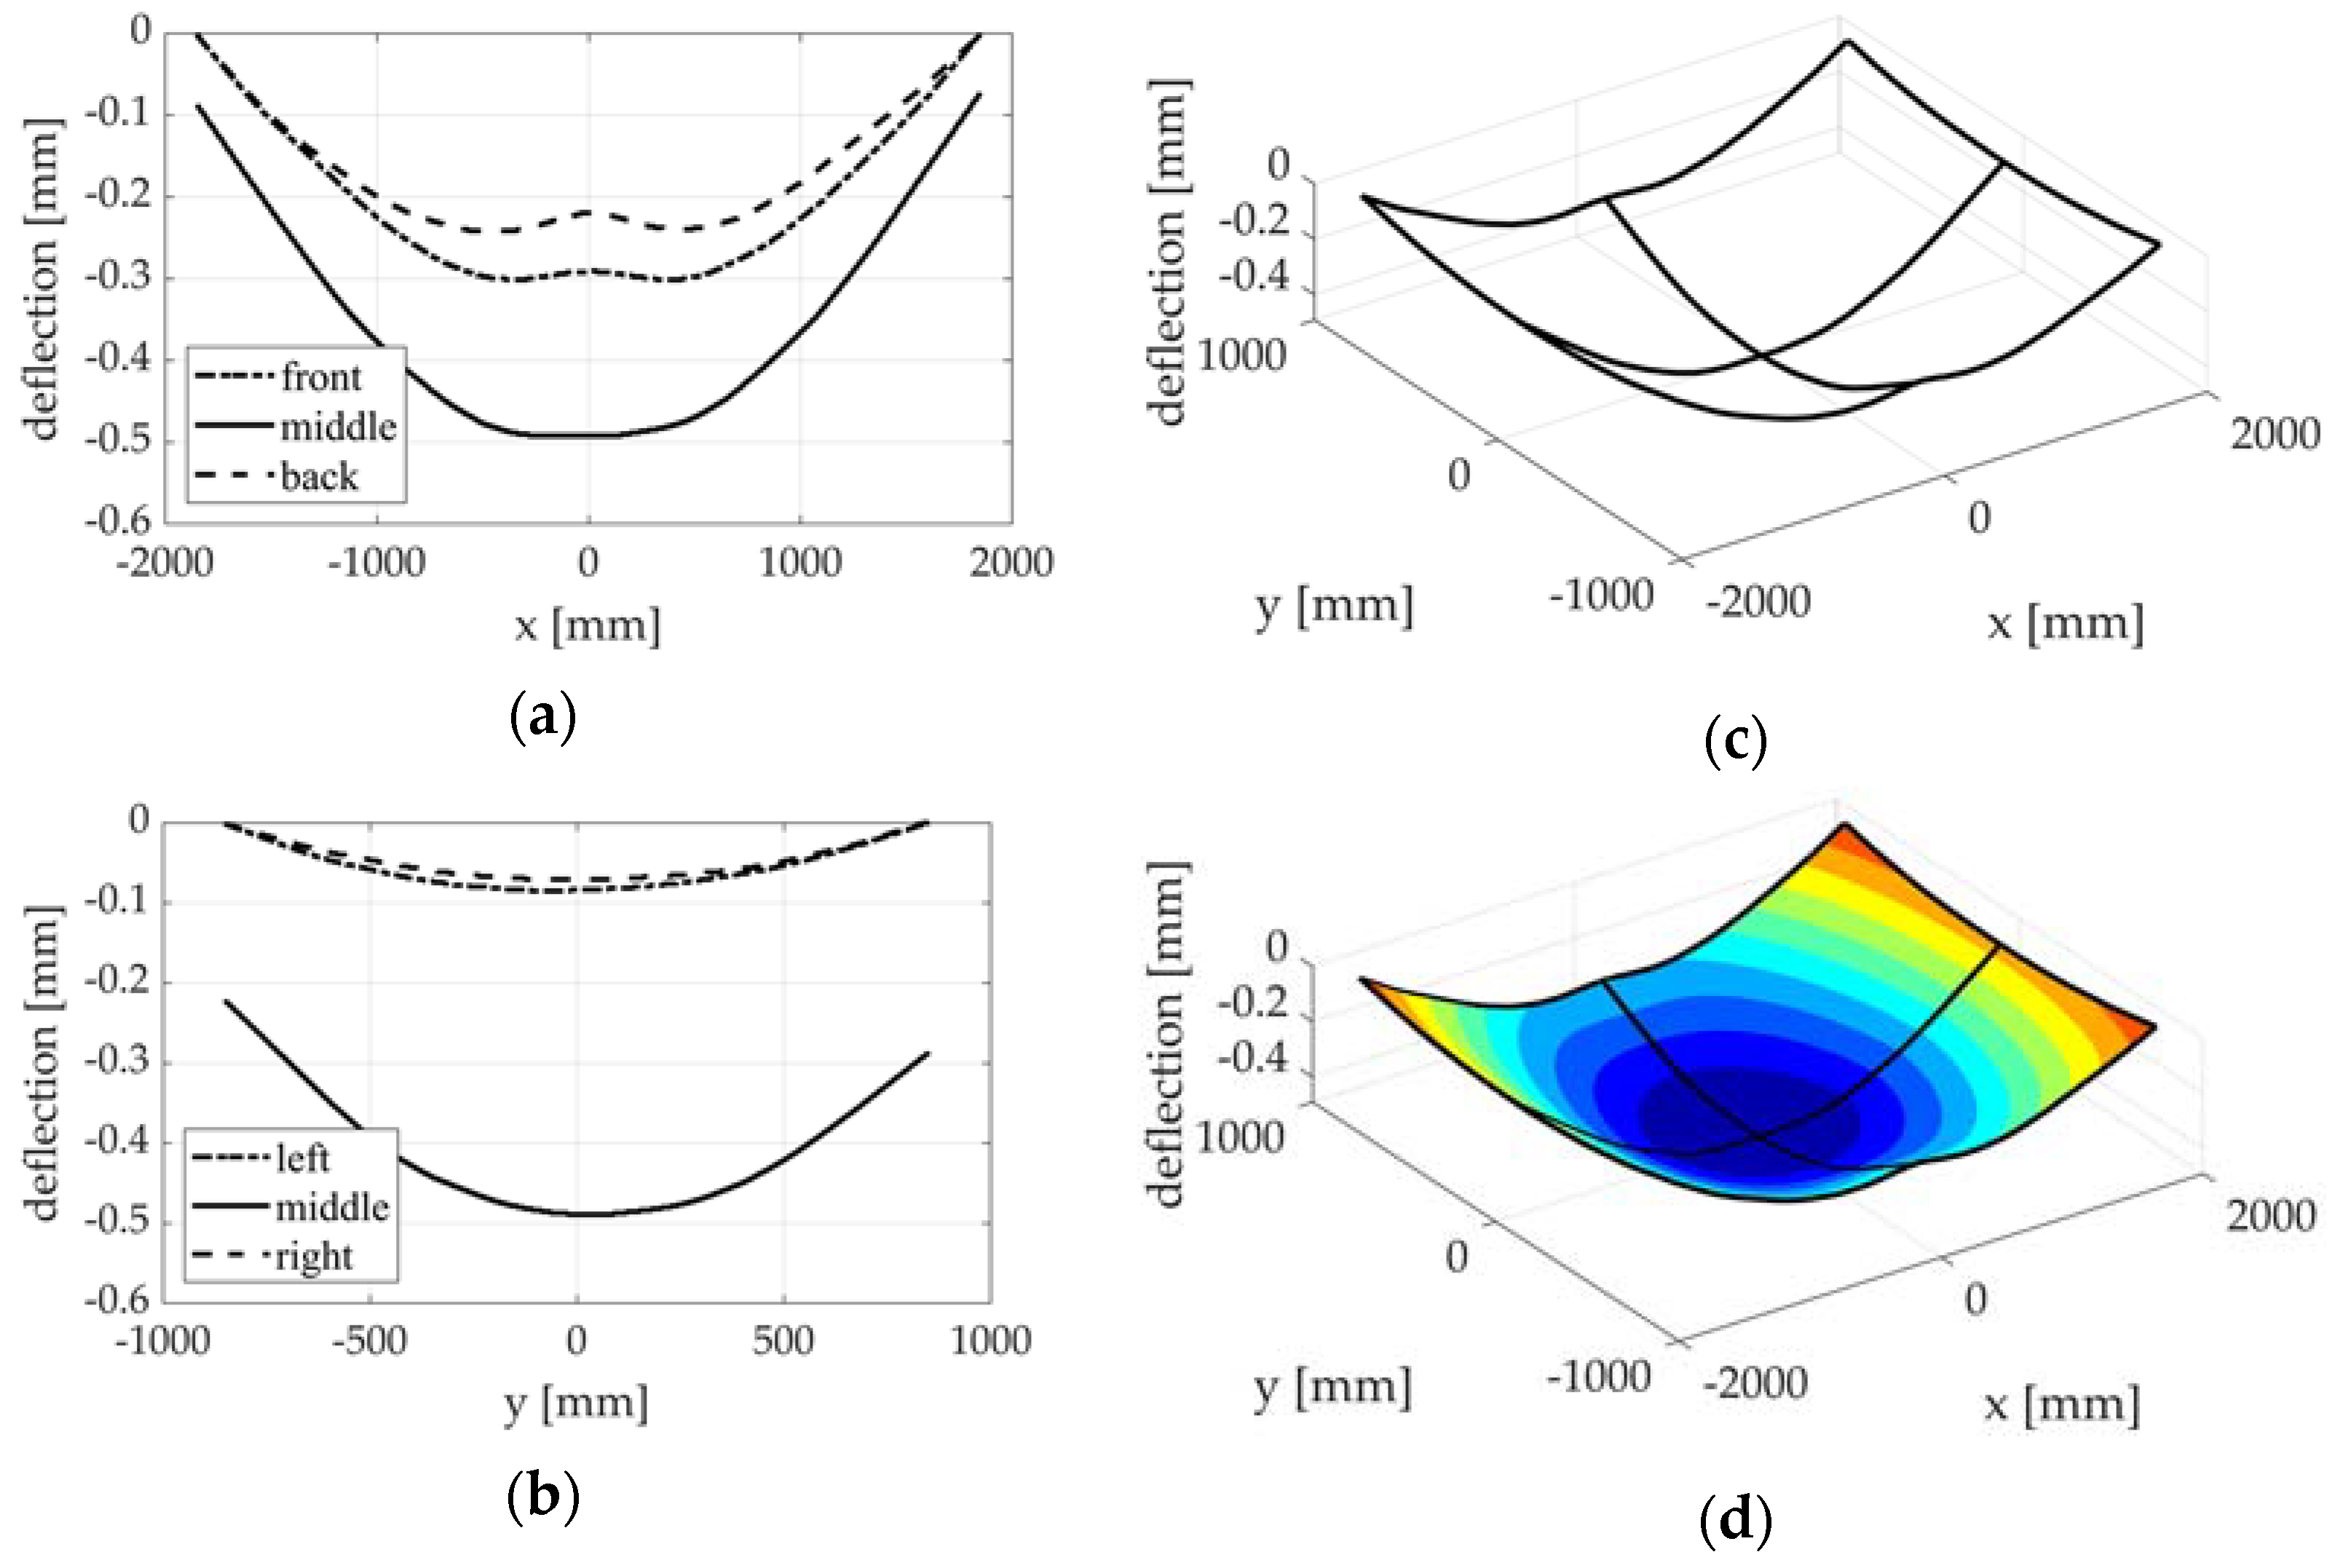
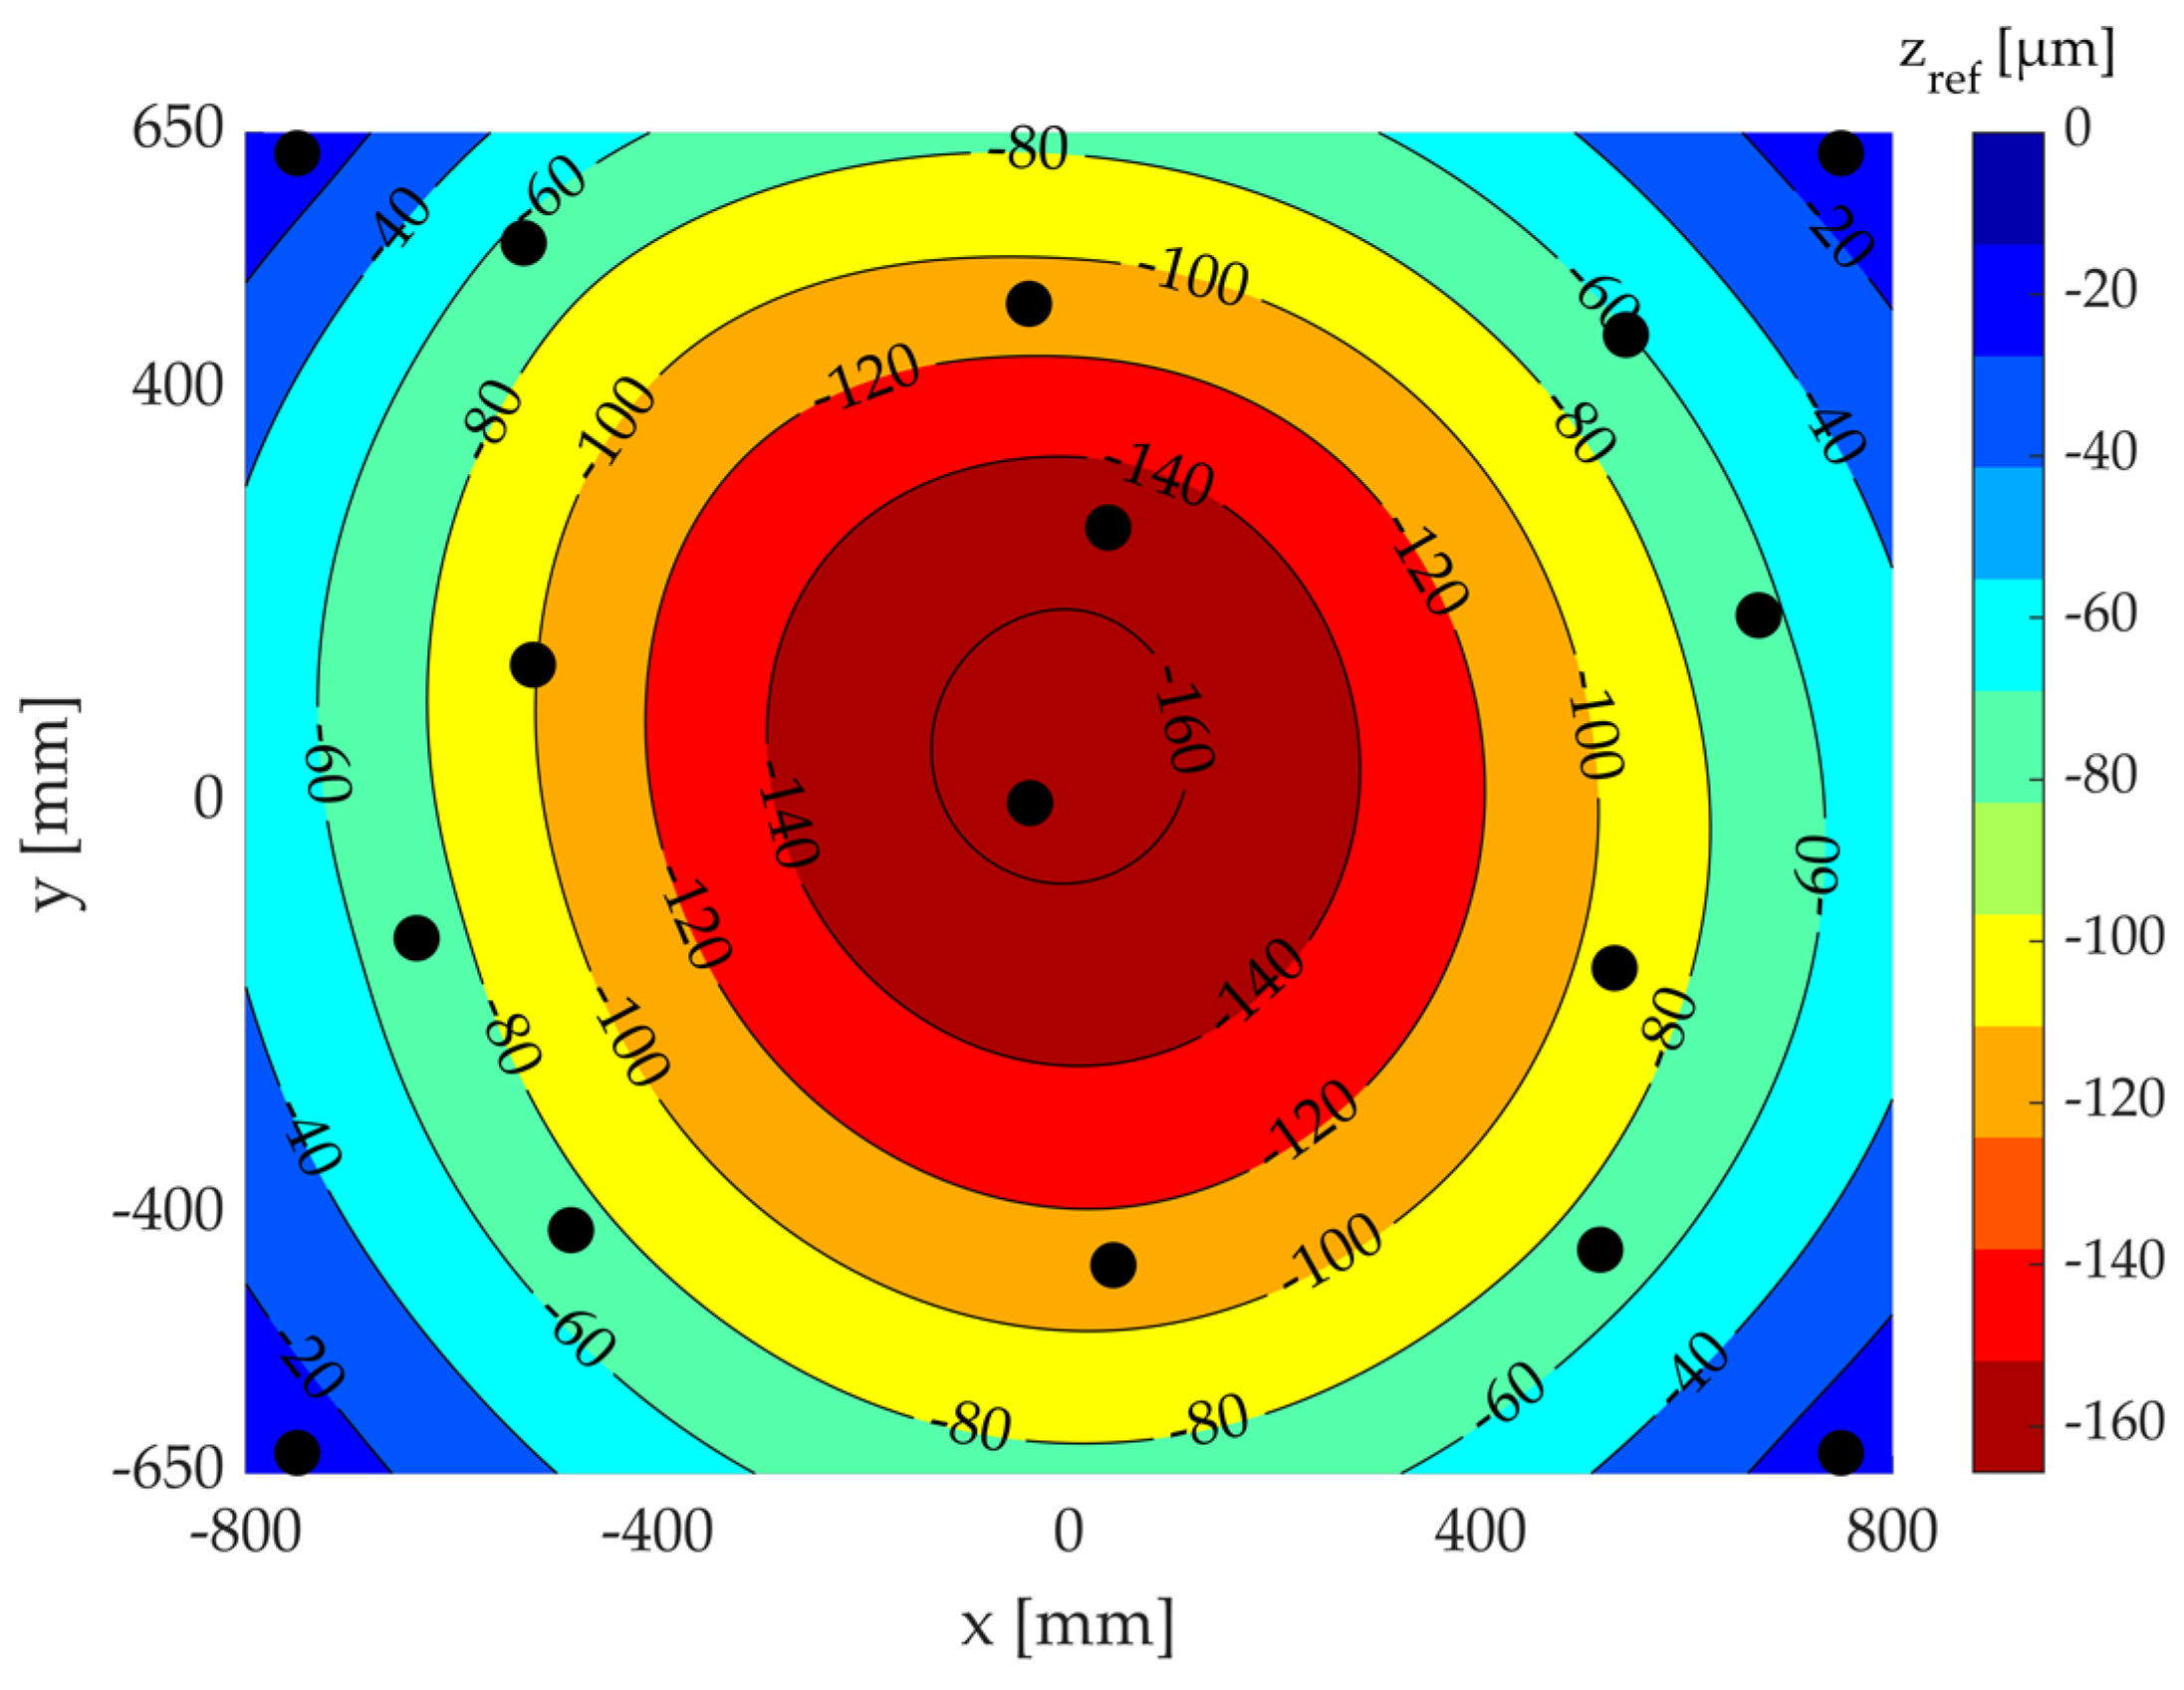
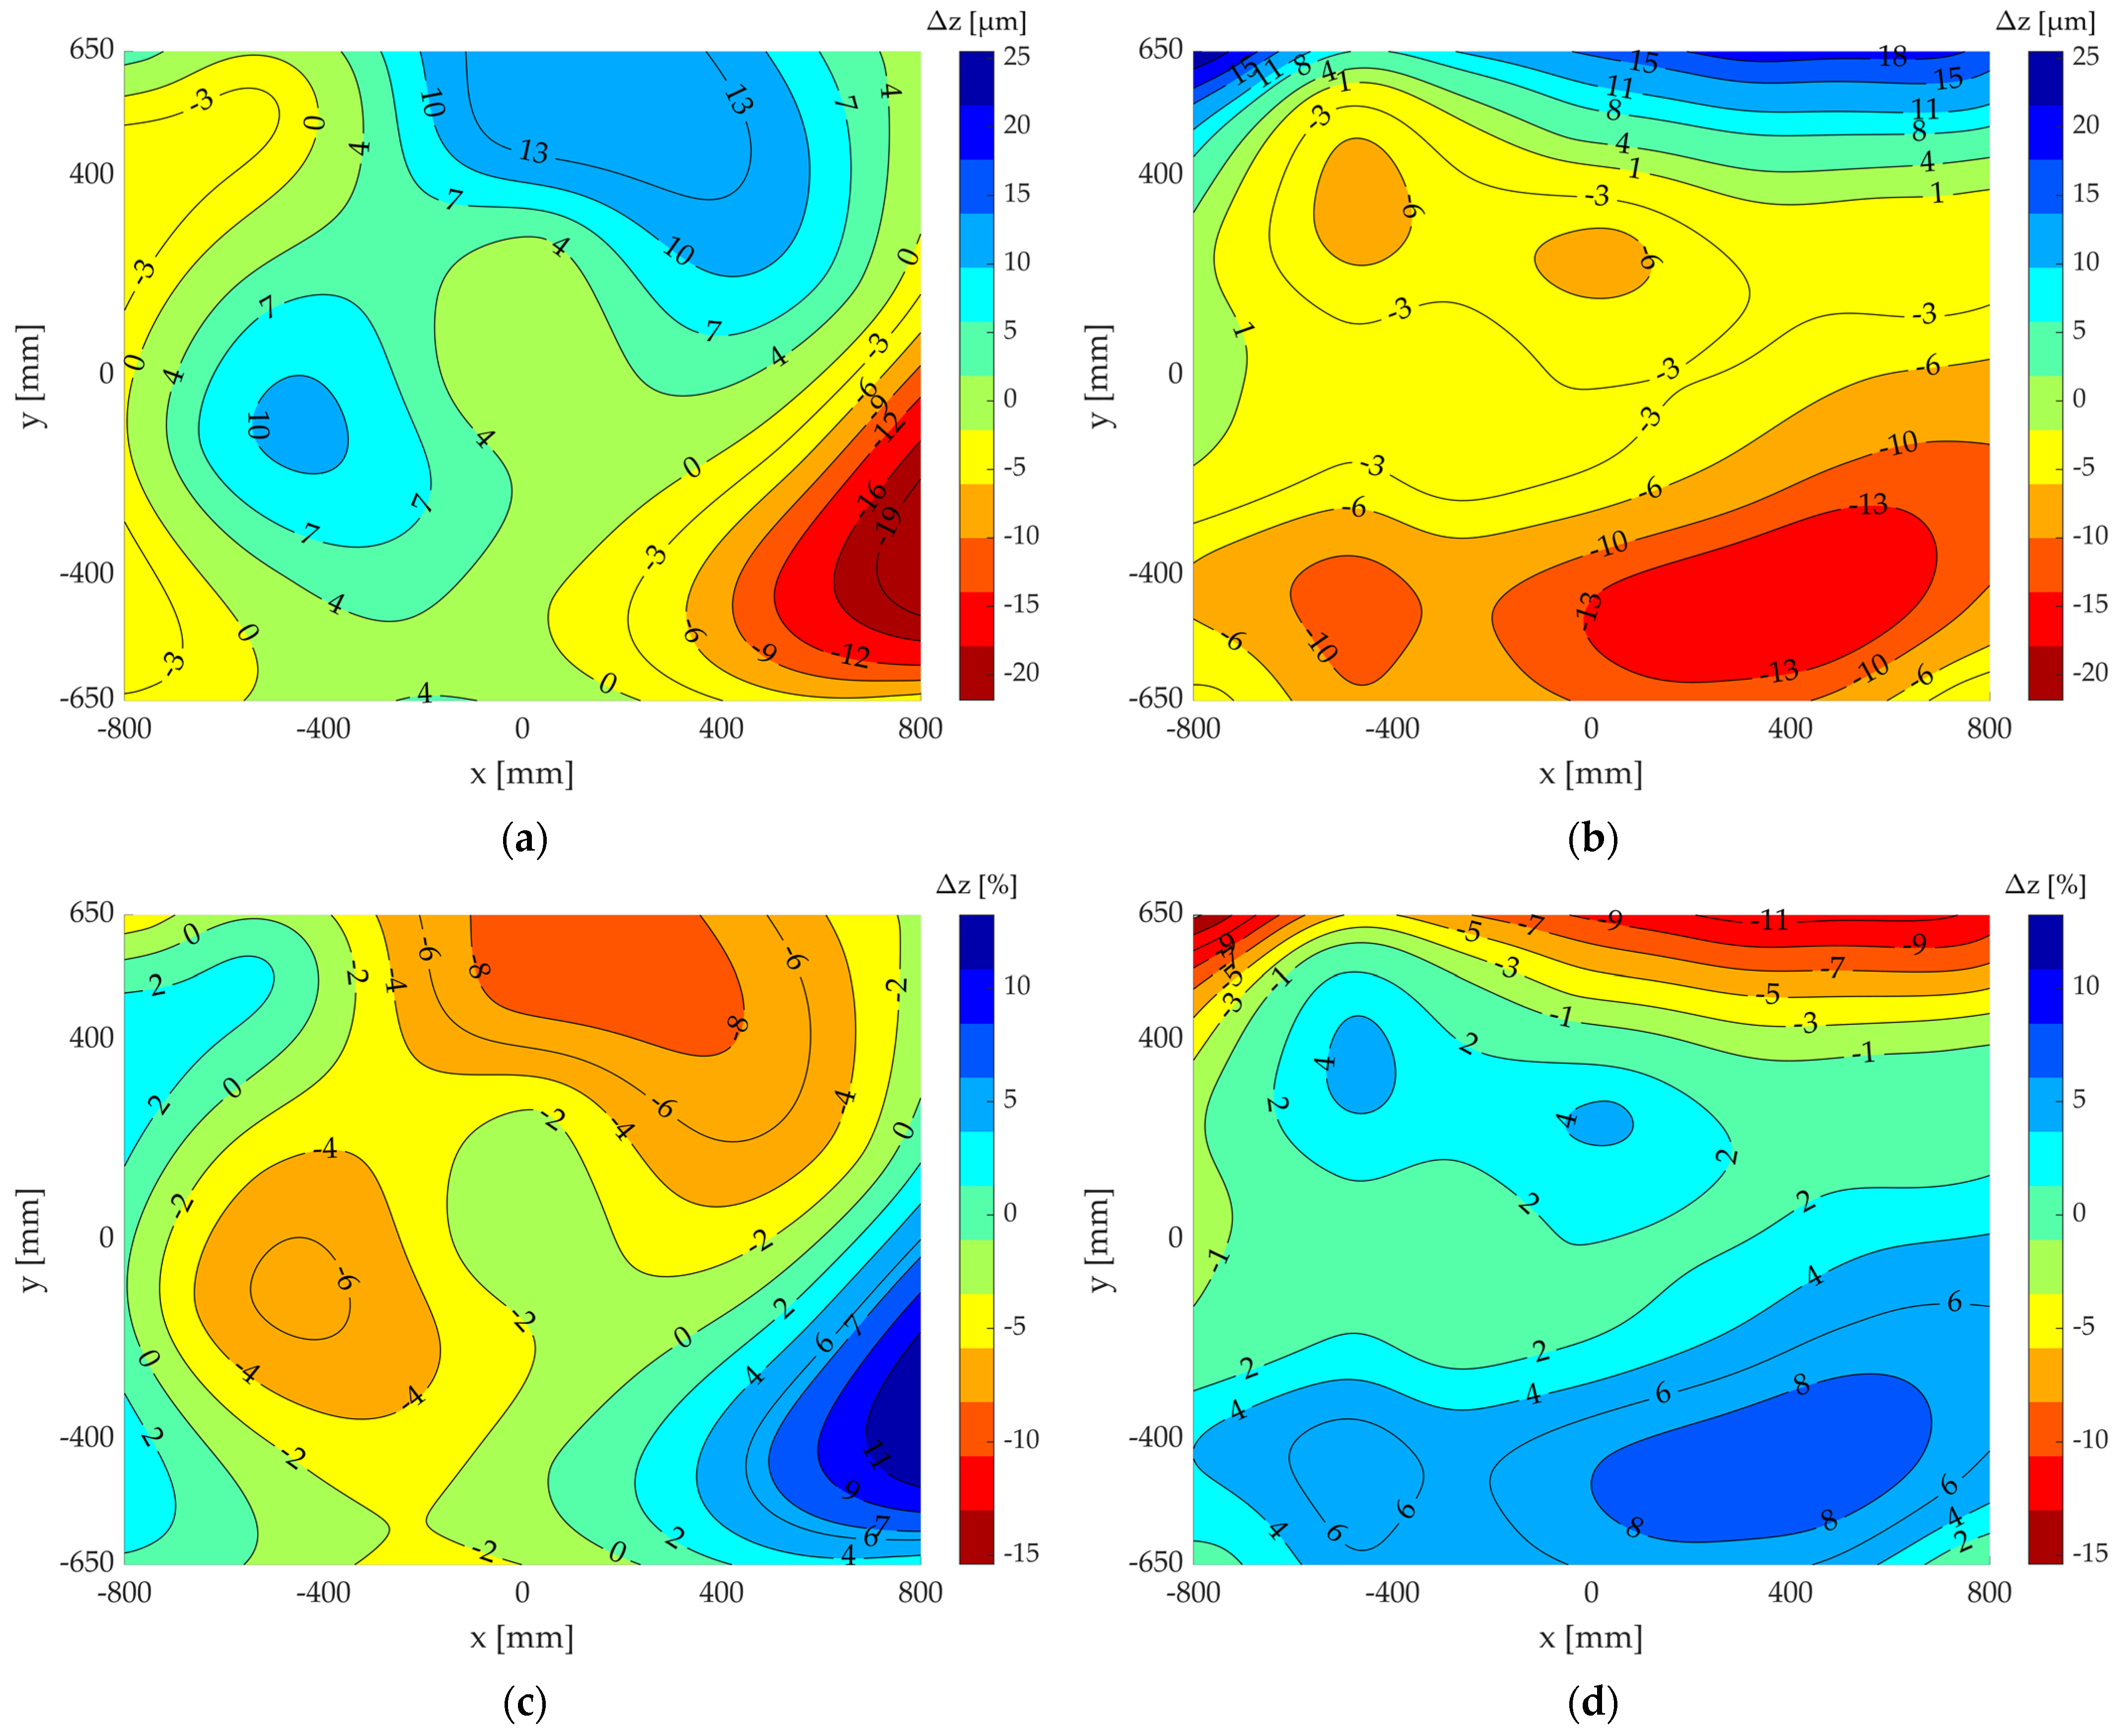
2.1.4. Theoretical Analysis of the Example of Three-Dimensional Deformation Data

The previous methods were subsequently extended to a 3D space. The aim of this second investigation is, again, to provide a theoretical proof of function for the extended measurement method for 3D deformations. The functionality was initially tested on the existing published measurement results from the dissertation by Roth [4]—see Figure 9.
The measurement data from Roth [4] contain the measured deformation profiles of press bolster plates of large-scale car body presses. For this purpose, the given measurement profiles were digitized using a self-developed MATLAB® image analysis function. The procedure applied is shown in Figure 8. Two measurement data diagrams belonging to one test machine (Figure 9a,b) were digitized and then transferred to the 3D space (Figure 9c). The generated 3D grid was then used to approximate a theoretical deformation surface of the bolster plate (Figure 9d).
To investigate the developed measurement method on the previously generated 3D fit of the bolster plate deformations from [4], the inclination values of the deformation surface at previously defined theoretical measurement positions must be extracted. The inclinations at the respective measurement points are calculated from the slope of a linear function, which intersects the virtual deformation surface just before and just after the respective measurement position in the x or the y direction (secant). With this approach, the inclination of the deformation surface in the x and the y directions is calculated at each defined theoretical measurement point—see Equations (14) and (15). The two inclination values calculated from the 3D fit are to be understood as virtual inclination measurements α x ( x p o s , y p o s ) and α y ( x p o s , y p o s ) at the virtual measuring positions given by x p o s and y p o s . x c o n t a c t represents the distance from the specified measurement position in both positive and negative directions where the secant intersects the virtual deformation surface. From the two z-coordinates of the virtual deformation surface and the distance of the intersection points determined in this way, the inclinations in the x and y directions at the specified measurement positions can be approximated.
α x ( x p o s , y p o s ) = z a p p r o x ( x p o s + x c o n t a c t , y p o s ) z a p p r o x ( x p o s x c o n t a c t , y p o s ) ( x p o s + x c o n t a c t ) ( x p o s x c o n t a c t )
α y ( x p o s , y p o s ) = z a p p r o x ( x p o s , y p o s + y c o n t a c t ) z a p p r o x ( x p o s , y p o s + y c o n t a c t ) ( y p o s + y c o n t a c t ) ( y p o s y c o n t a c t )
From the inclination values of the different measuring positions, the procedure in Section 2.1.3 is applied to calculate the two inclination surfaces (Figure 10a,b) and the two integration surfaces (Figure 10c,d).
Figure 11b shows the theoretical measurement result for 25 evenly distributed theoretical inclination measurement positions on the 3D fit of the bolster plate (the digitized table deformation surface of test machine A in [4]). Figure 11a, in comparison, shows the original deformation surface calculated from the measurement data of [4]. Figure 11c shows the absolute and Figure 11d the relative error image of these two surfaces.
d z r e l ( x i , y i ) = z a p p r o x ( x i , y i ) z m e a s ( x i , y i ) max ( a b s ( z a p p r o x ) ) · 100
The calculation of the relative error image d z r e l ( x i , y i ) refers to the maximum value of the virtual deformation z a p p r o x ( x i , y i ) in its center and is calculated according to Equation (16). z m e a s ( x i , y i ) is the virtual measurement result according to Equation (13). With the use of 25 evenly distributed measurement positions, errors below 4% could be achieved in large areas of the measurement object using the developed measurement method. Slightly larger errors of up to 10% result in small areas at the upper and lower edge.
For the even distribution of the measurement points on a given surface, various rectangular and triangular grids are calculated. The calculation of rectangular grids is based on a consideration of the given number of measurement points as the least common multiple of the number of measurement points in the x direction and the number of measurement points in the y direction. Different combinations of values are computed, and, from the valid pairs of values for the specified number of measurement points, the one with the smallest difference in spacing between the measurement points in the x direction and the measurement points in the y direction is selected. If no meaningful value pair can be found by calculating a uniform rectangular grid, the calculation proceeds to generate a triangular grid. The calculation is initially based on generating different rectangular grids. The triangular grid is created by defining an additional measurement point in the center of each rectangle. A valid triangular grid is achieved when the specified number of measurement points can be completely divided among the specific triangular grids. The calculation is carried out iteratively.

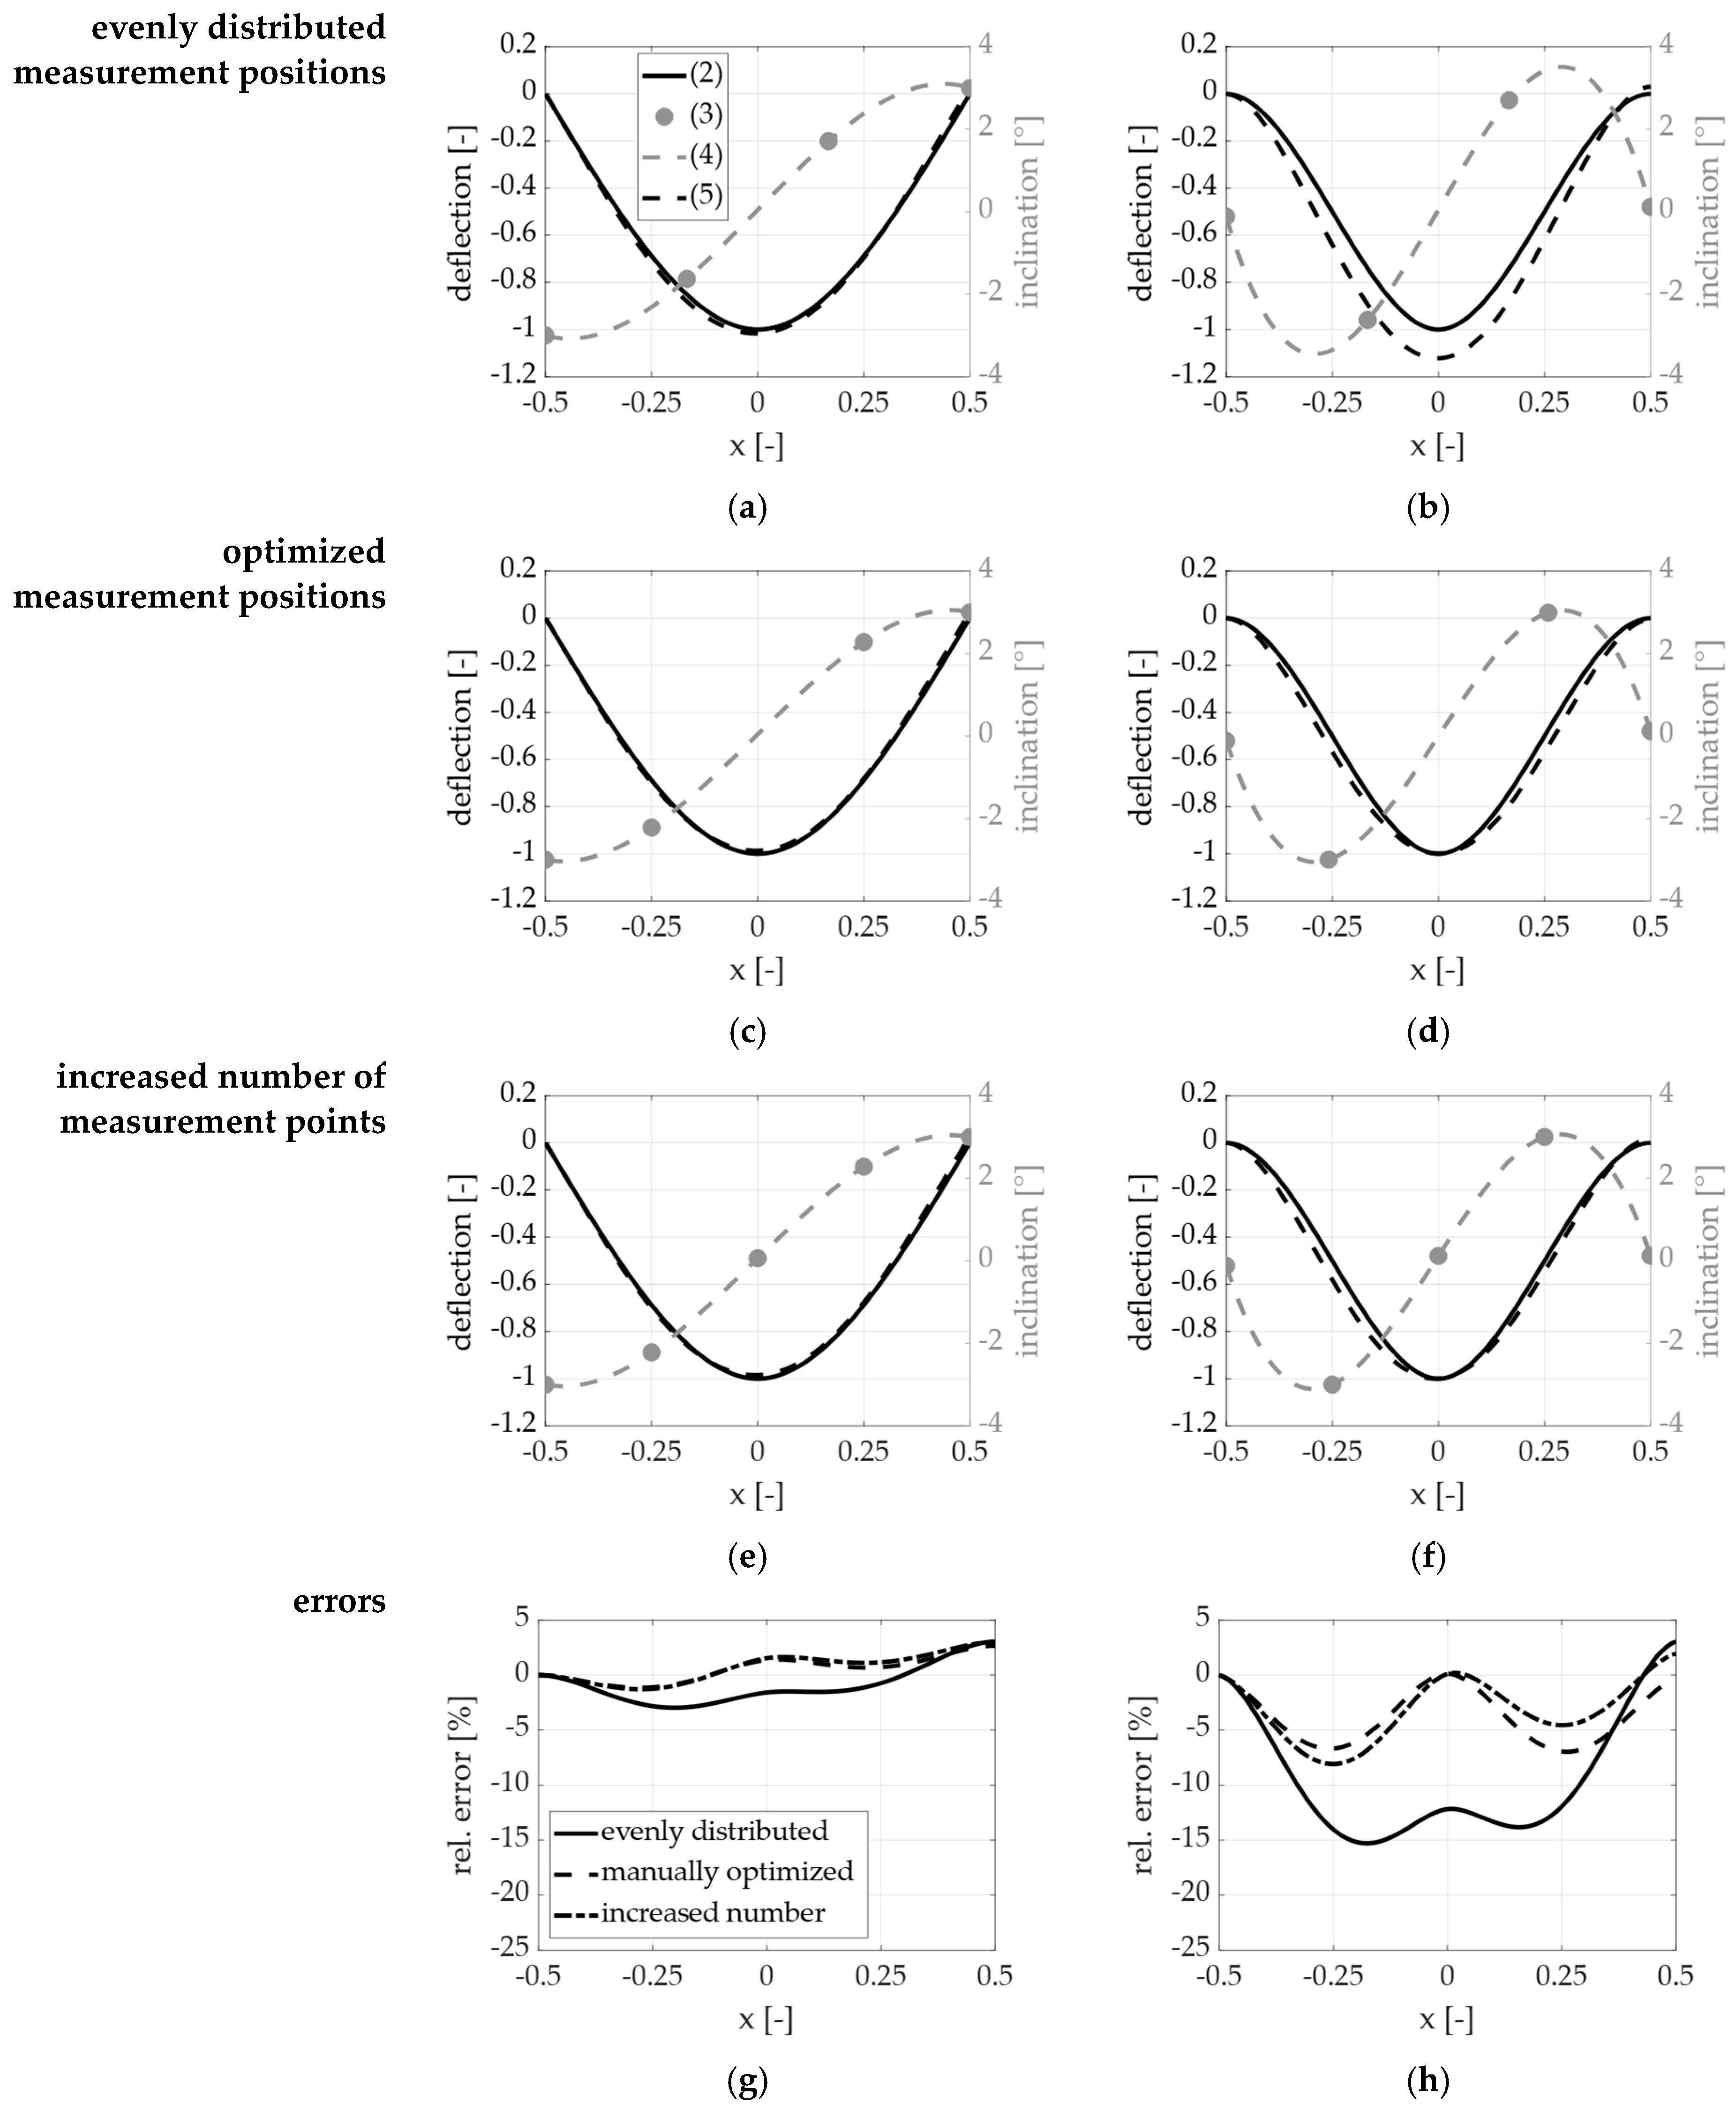
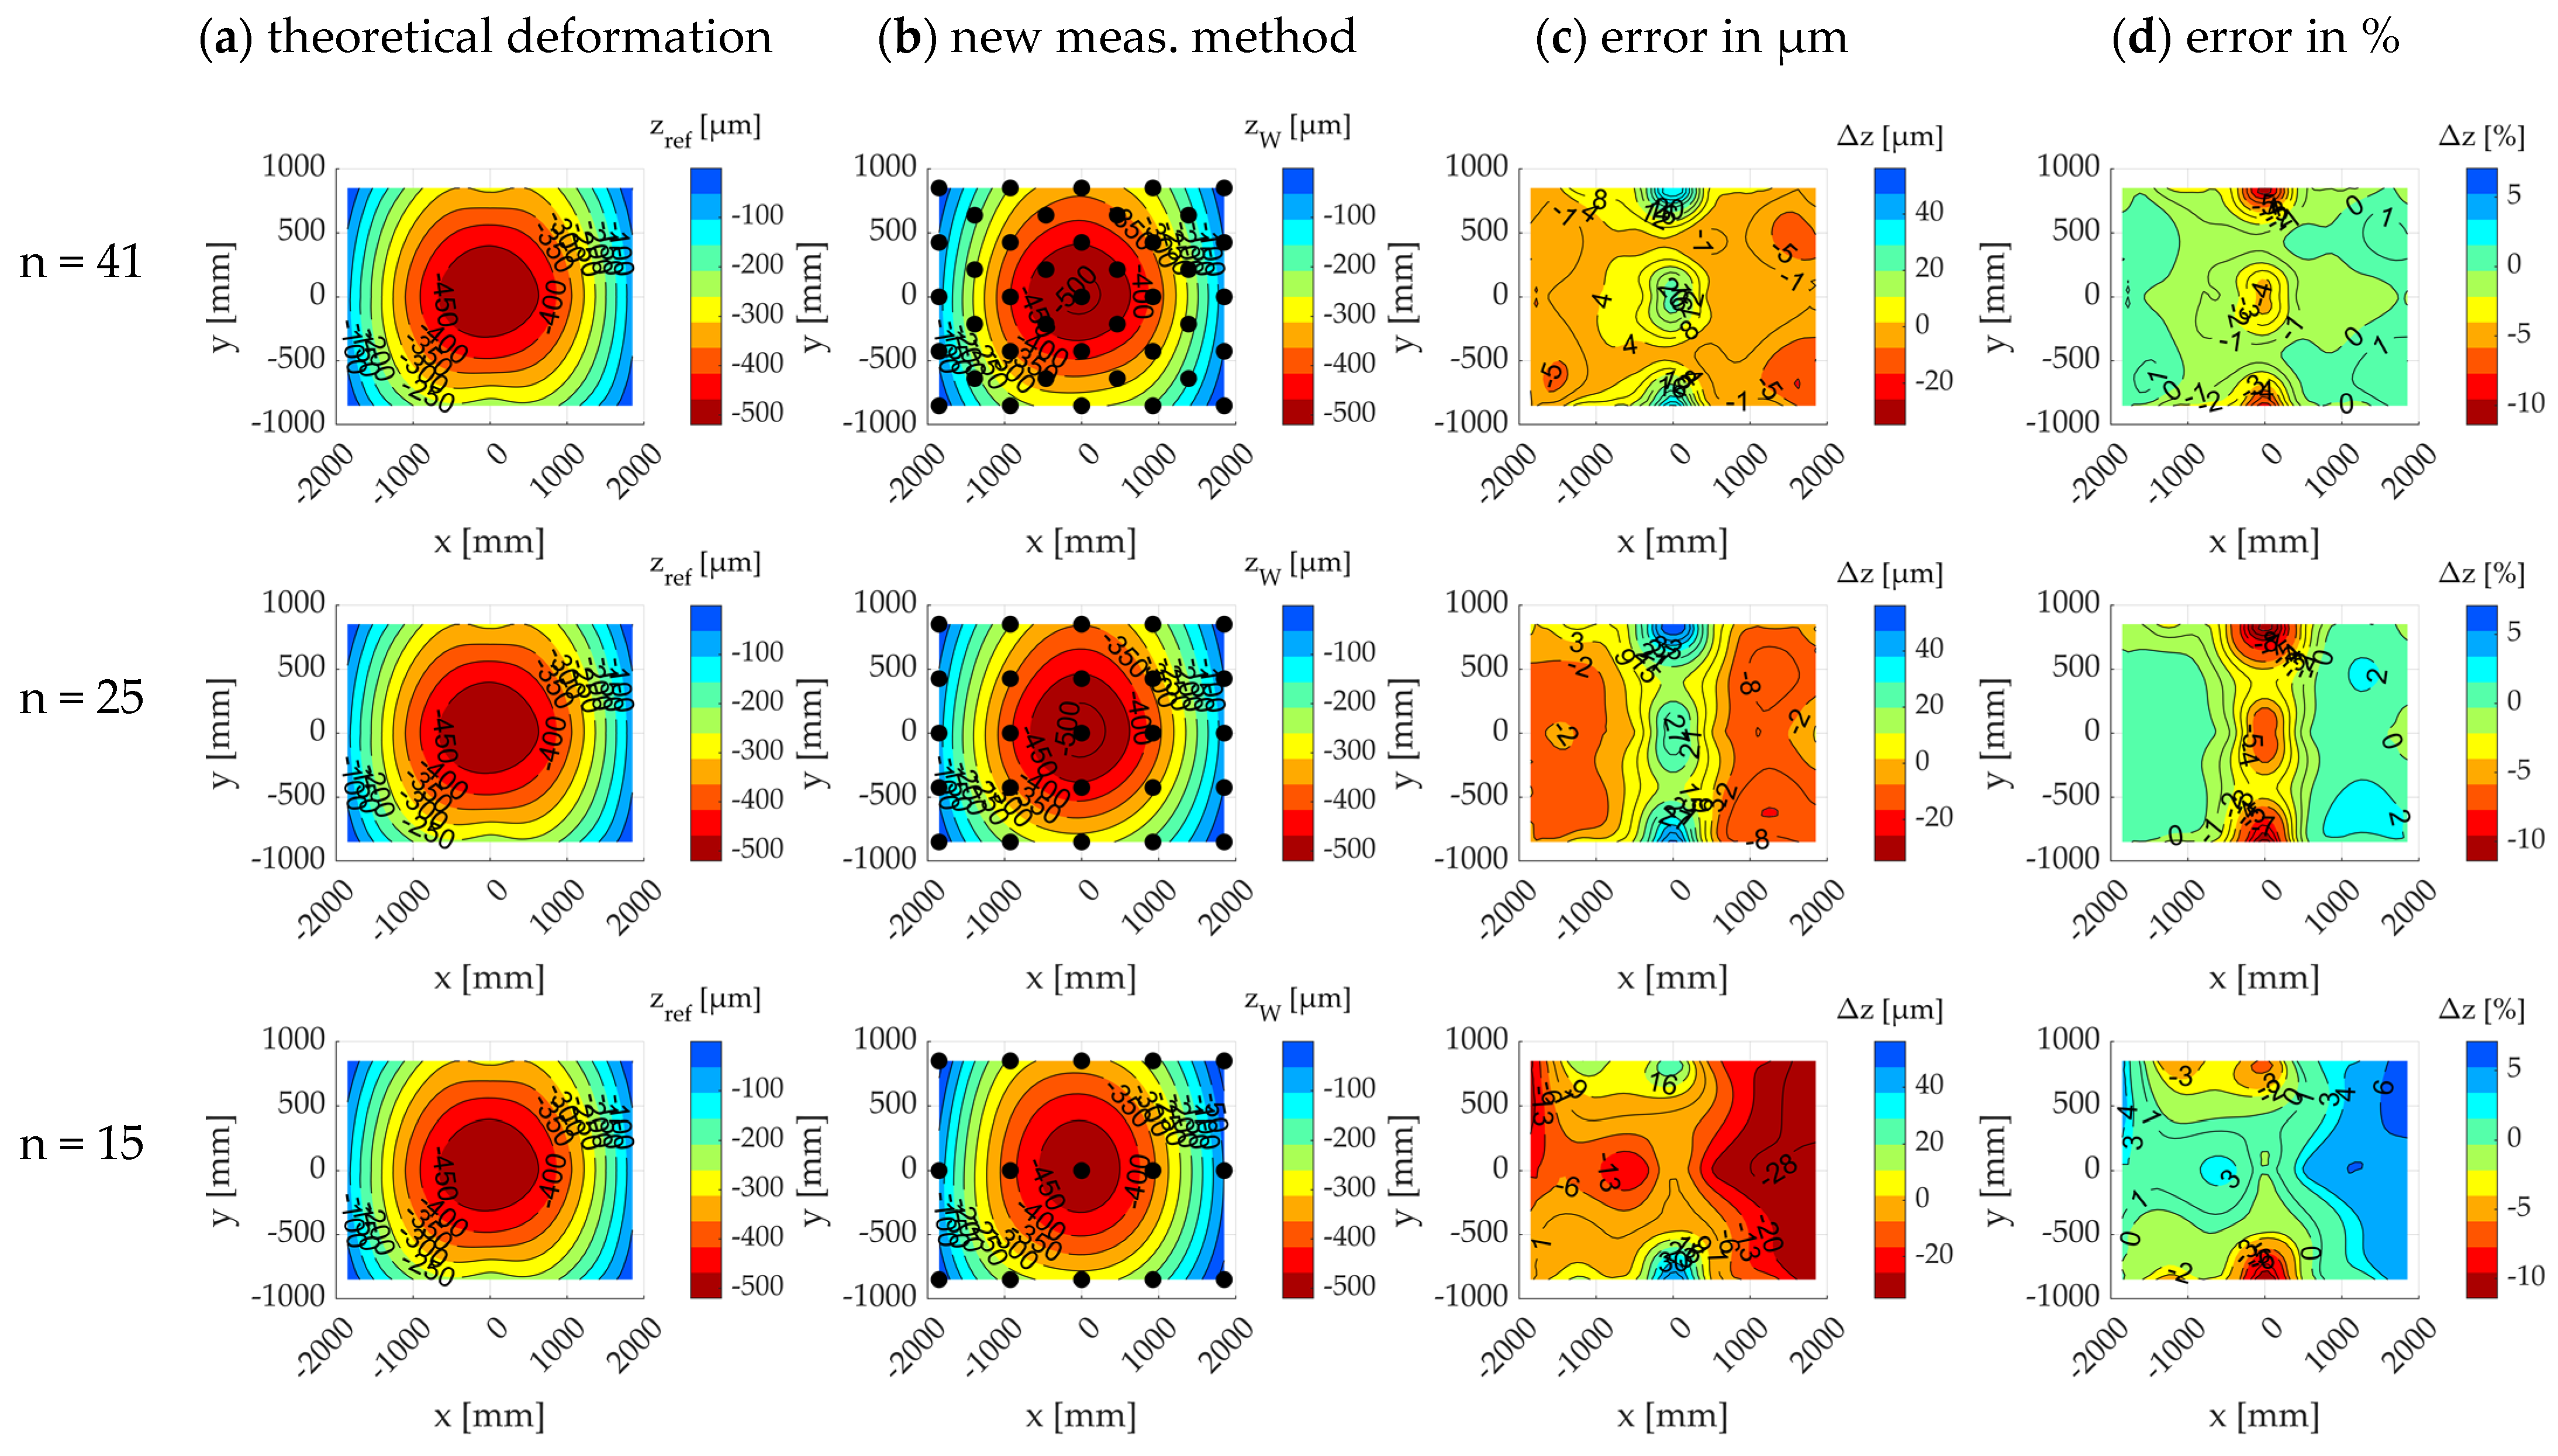
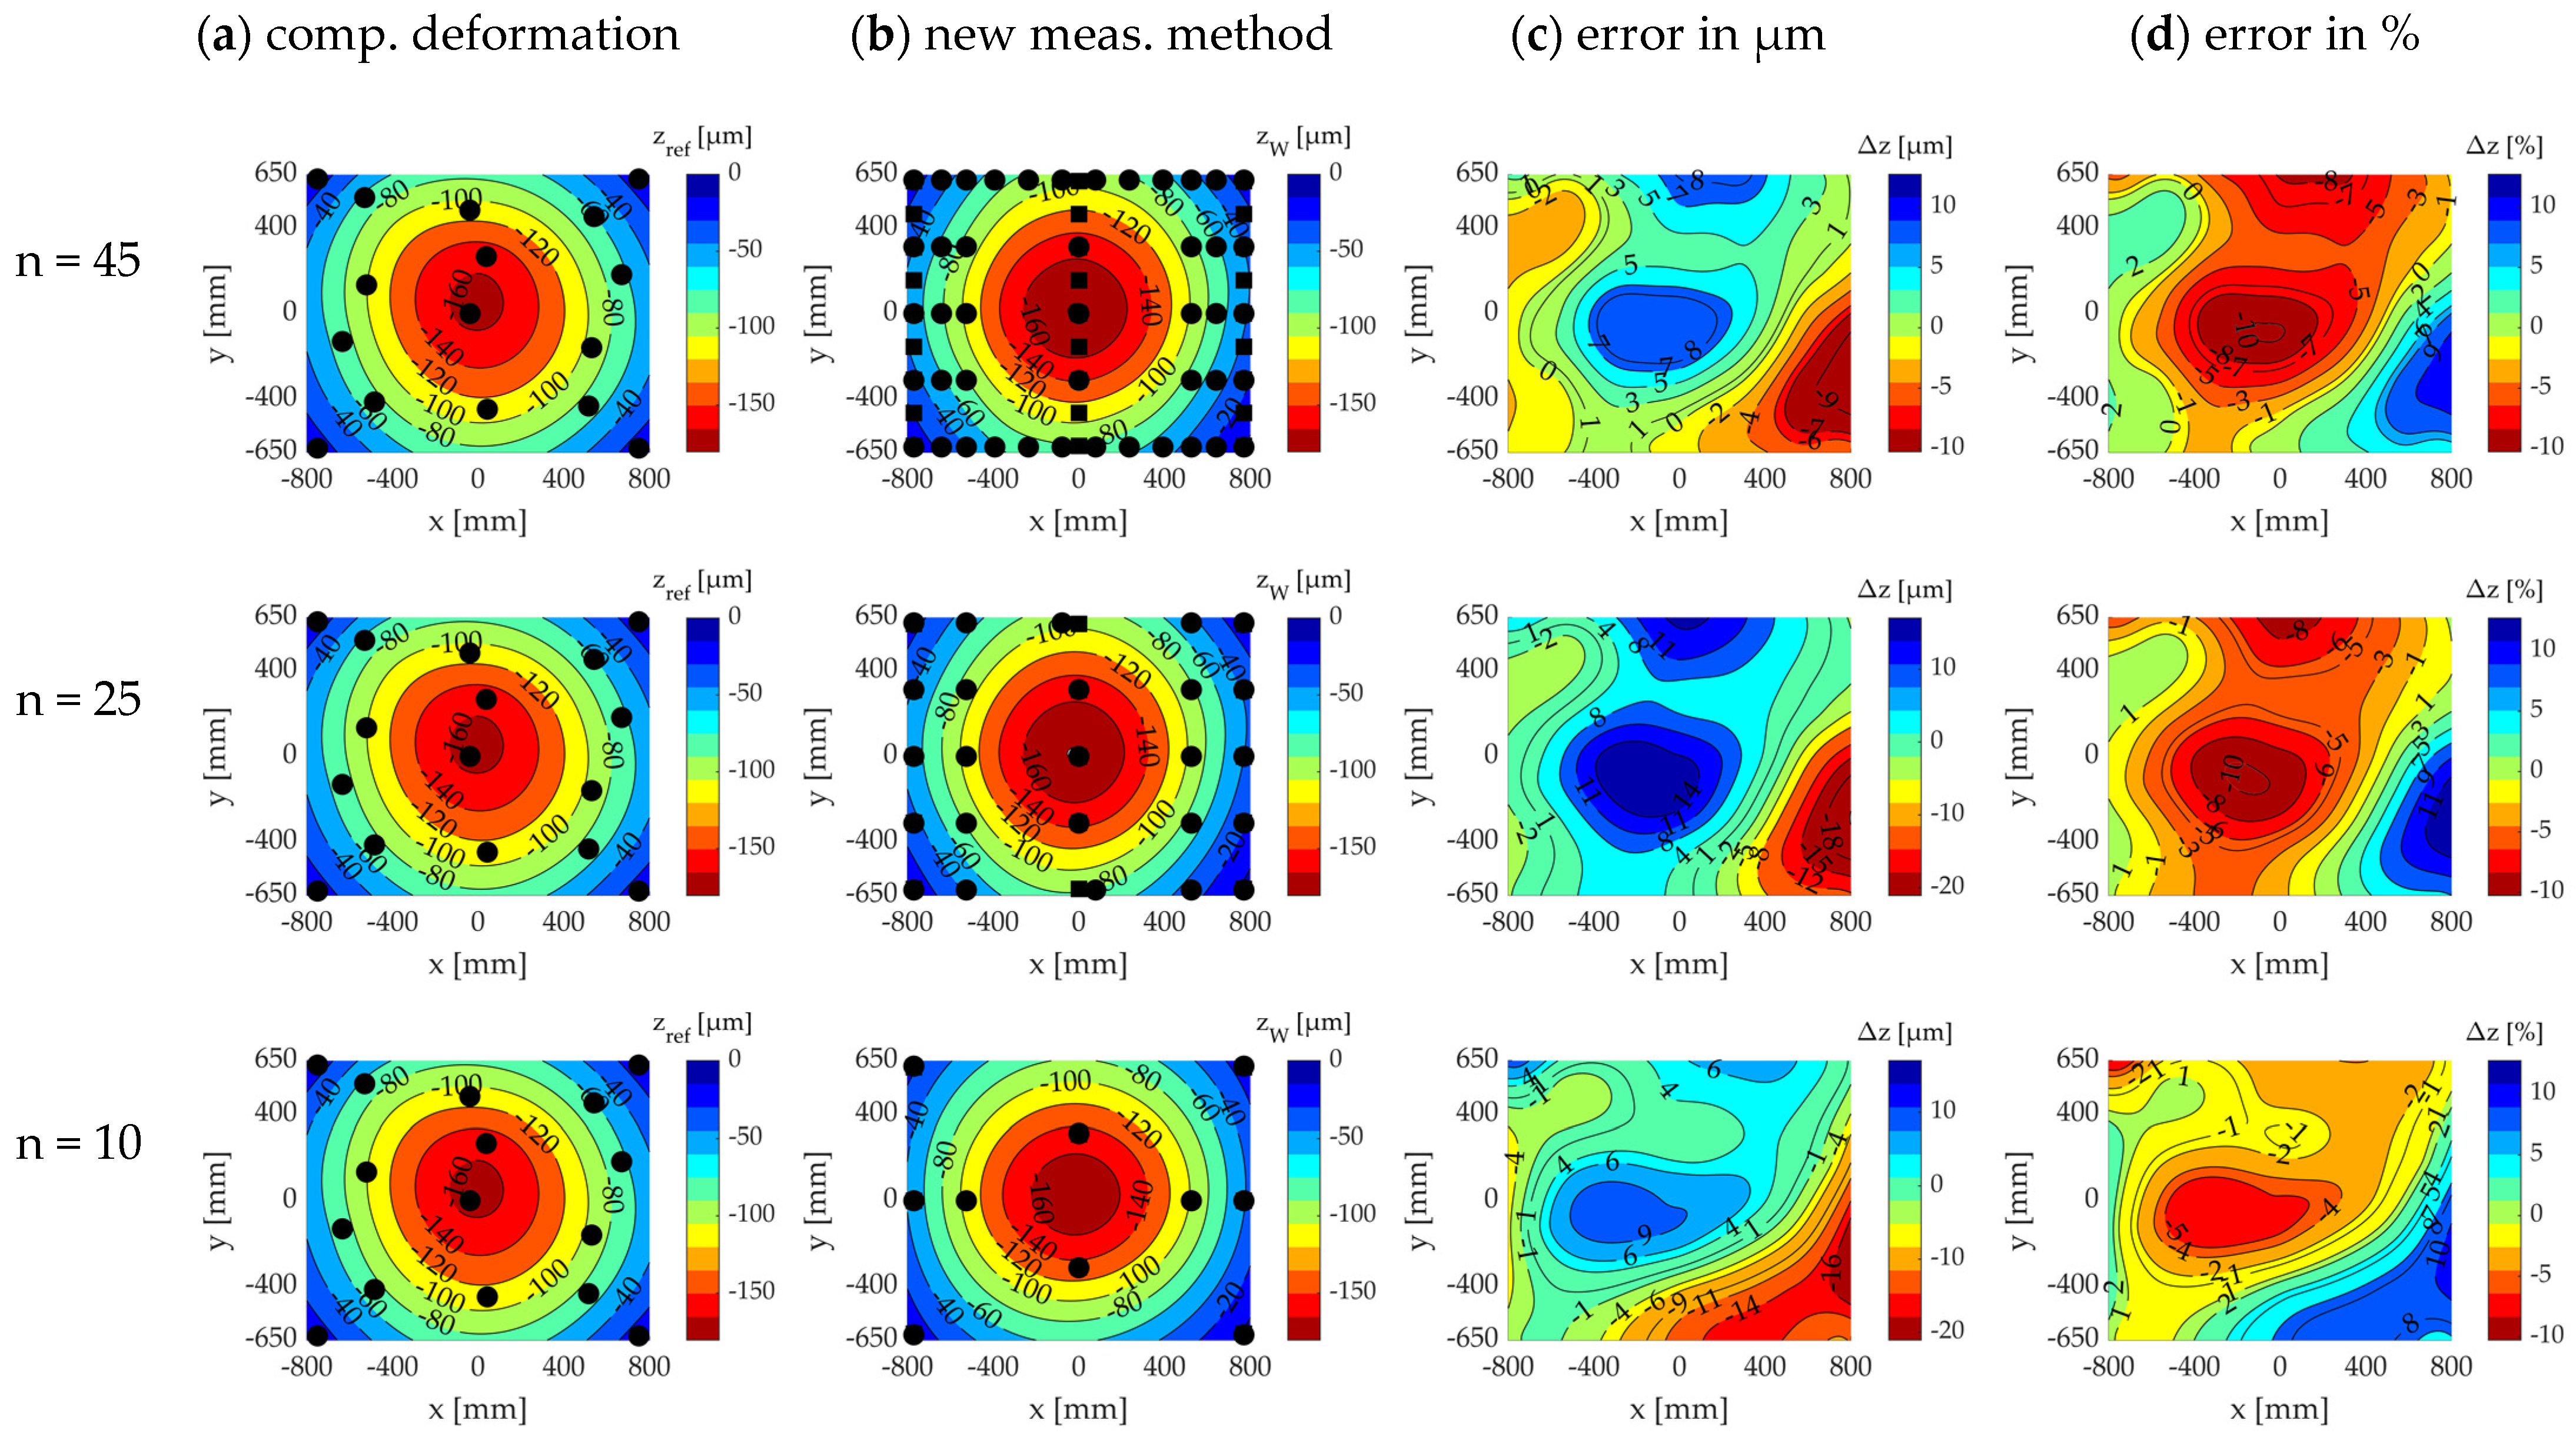
2.1.5. Sensitivity Analysis of the Theoretical Measurement Point Quantity and Position

Analogous to the investigations on the 2D bending beam, the sensitivity of the measurement result to the number of measurement points and their positioning was analyzed. The aim was to answer the following two questions:
  • How many evenly distributed measurement points are theoretically necessary for measurement errors ≤ 10% of the maximum deformation? See Figure 12.
  • Can a theoretical improvement in the measurement results be achieved by manually optimizing the measurement positions? See Figure 13.
Figure 12 shows a sensitivity analysis of the number of measurement points on the theoretical measurement object explained in Section 2.1.3. The measurement positions are evenly distributed. As anticipated and identical to the results on the 2D bending beam, the measurement error magnifies as the number of measurement points decreases.
The theoretical outcomes reveal that the measurement error stays under 7% over vast regions, even when the number of measurement points is cut to 15. It is only in small peripheral areas that the measurement error reaches a maximum of 10%.
Figure 13 shows the results for an even distribution of the measuring points and two freely chosen modifications of the measuring point positions for 15 measurement points. The theoretical measurement error increases when compared to an even distribution. In contrast to choosing the optimal measurement point positions on the 2D bending beam, there are significantly more degrees of freedom available in a 3D space. Improving the theoretical measurement accuracy by manually optimizing the measurement point positions is no longer straightforward in the 3D space.

2.2. Experimental Verification of Deformation Measurement of Press Bolster Plates

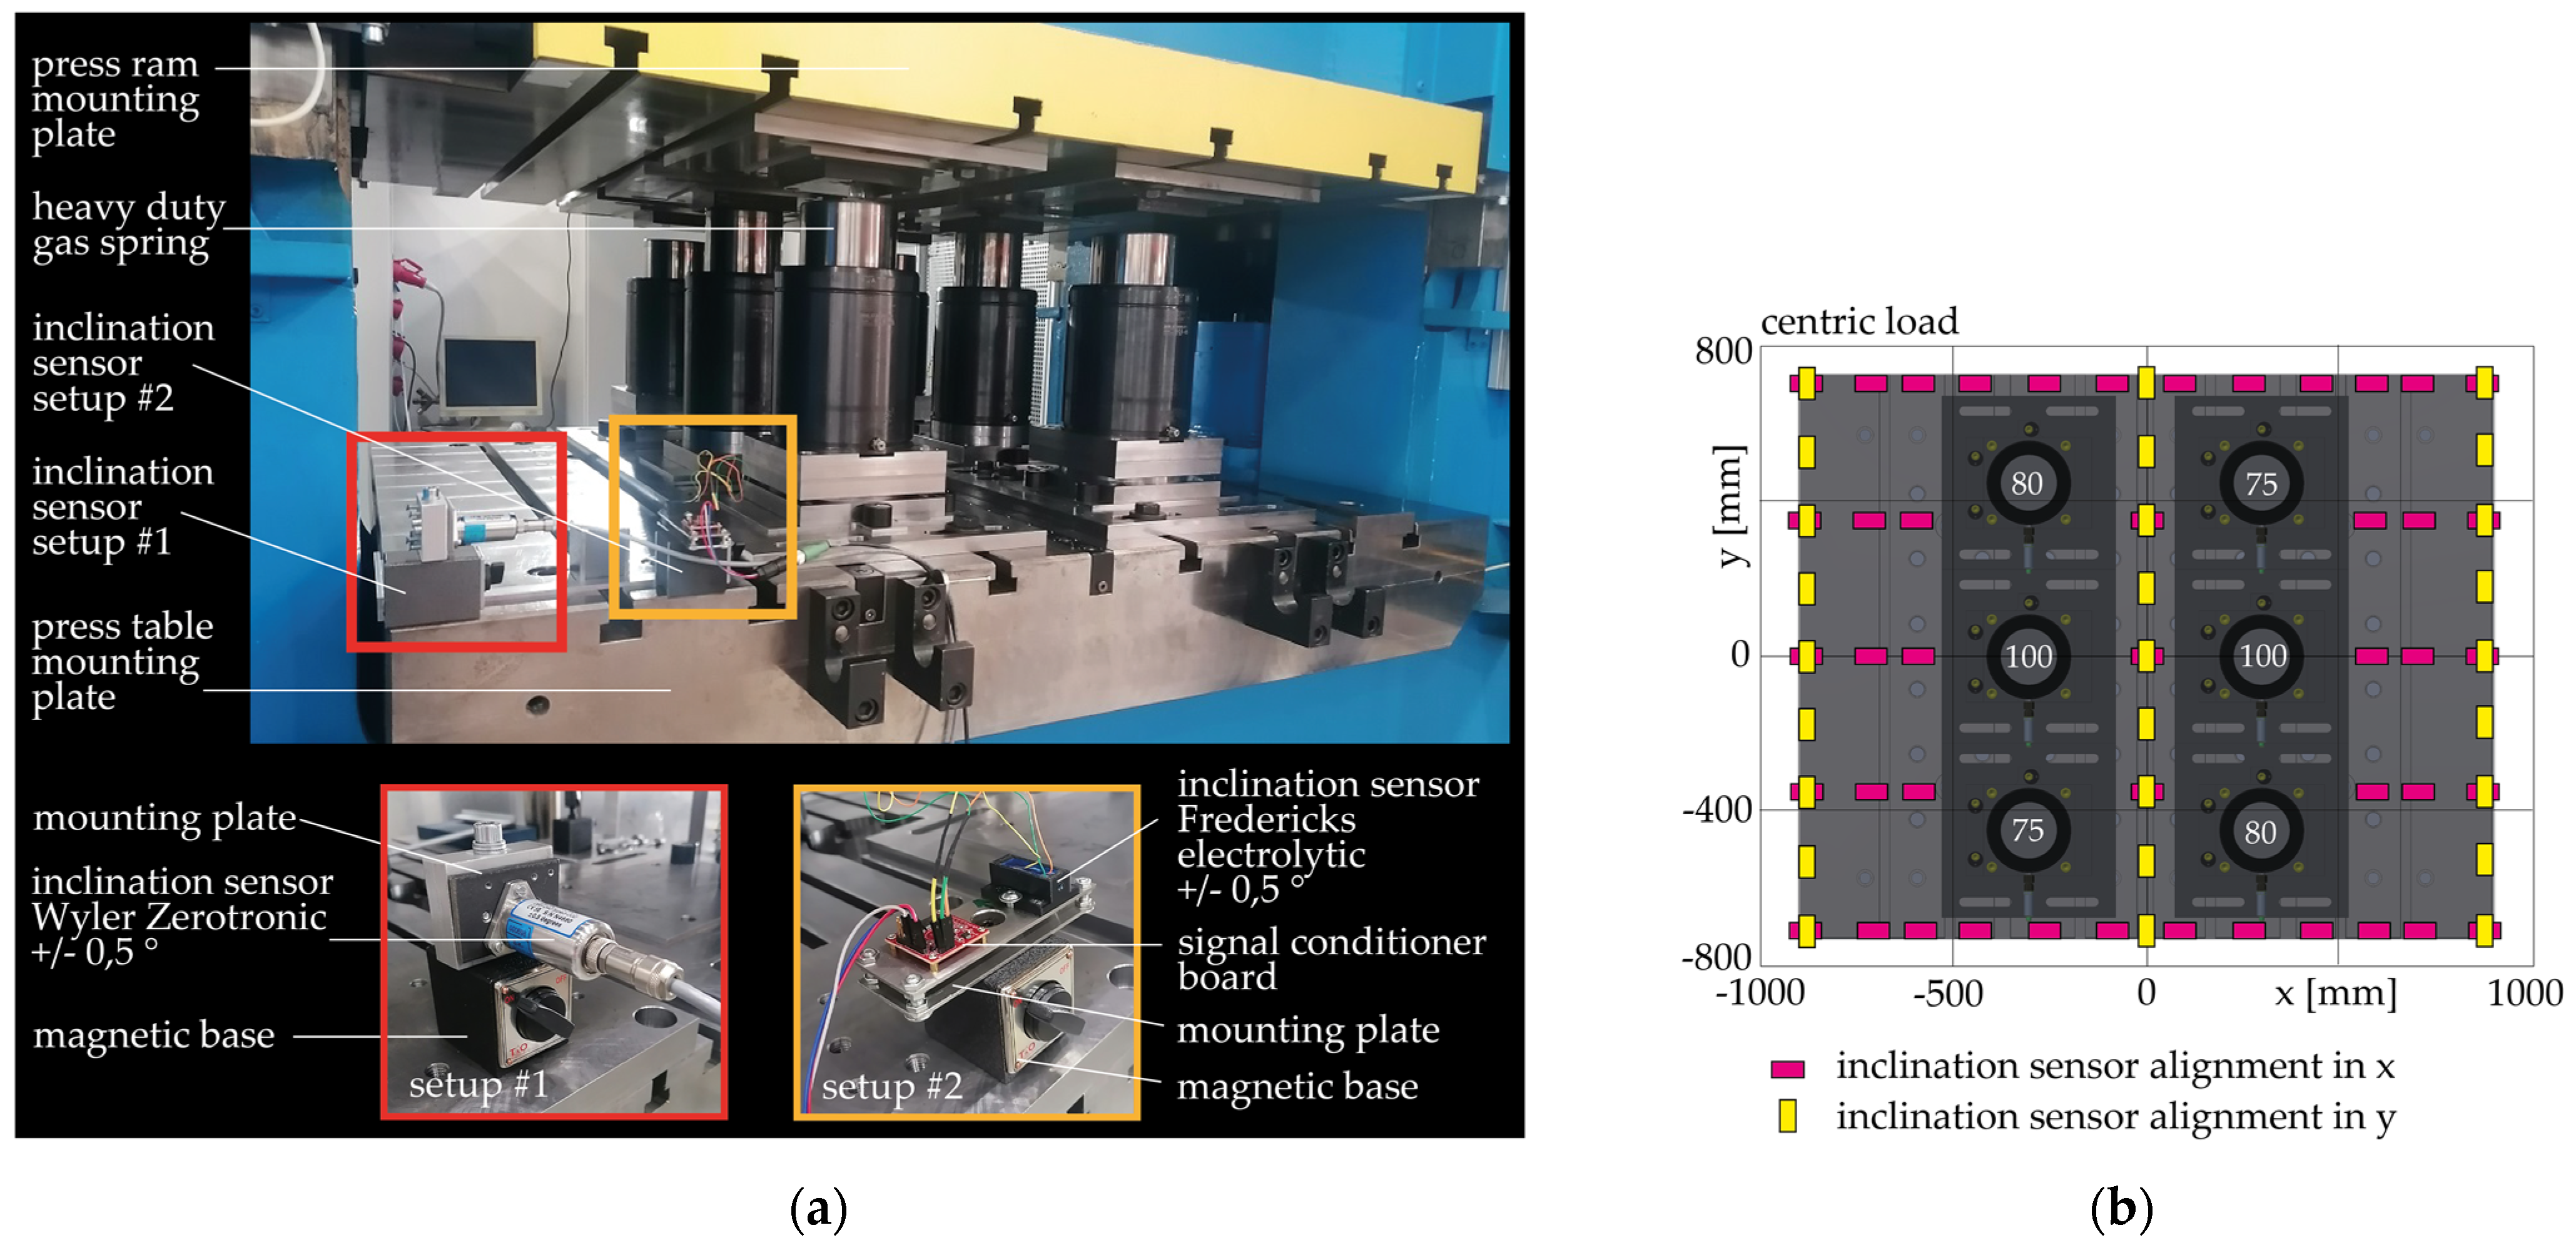
2.2.1. Basic Experimental Testing under Laboratory Conditions

As part of the experimental tests, the basic functionality of the presented measurement method was first tested. Figure 14 shows the test setup on a test object at TU Dresden. The load was introduced via a gas spring assembly consisting of six staggered heavy-duty gas springs (Figure 14a). The testing was initially carried out with a manual selection of evenly distributed inclination measurement points in the x and y directions (Figure 14b).
The inclination measurements were carried out in duplicate for each measurement point with each inclination sensor setup: using an expensive capacitive sensor (Wyler Zerotronic) and a comparatively cheap electrolytic sensor (Fredericks). The necessary angular resolution of the sensors depended on the dimensions of the bolster plate and the amount of deformation. Through an examination of the measurement data presented in the literature concerning deformations of bolster plates (see [1,4,6,7,11,43]), the theoretically necessary angular resolutions could be computed by employing a basic bending beam model. These resolutions fell within the range of 0.0003 to 0.0005 degrees, aligning closely with the specifications of the two sensors utilized.
At each measurement point, the inclination curves were recorded in the x and the y directions (see Figure 14b). The measurement started with an unloaded machine and therefore an un-deformed bolster plate. Subsequently, the press ram was moved down to the bottom dead center (BDC) during the measurement, compressing the gas pressure springs to their maximum force. After a short hold of the ram in the BDC, the return stroke and the unloading of the machine took place, followed by the end of the inclination measurement. The described procedure was carried out for 45 measurement points evenly distributed on the press table. Figure 15 illustrates the procedure for processing the measurement data. The raw data for each measurement point (Figure 15a) were first smoothed using a moving average filter and converted into an inclination angle value using the calibration curve of the sensor. The minimum value (the unloaded measurement object; red points) and the maximum value (the fully loaded measurement object; blue points) were then extracted from each smoothed data curve and assigned to the respective measurement position (Figure 15b).
The inclination differences were then calculated (Figure 15c), from which the two inclination approximations in the x and y directions were calculated (Figure 15d) using the equations given in Section 2.1.3. This yielded the final deformation image of the measurement object (Figure 15e). Figure 16 shows the two measurement results:
Figure 16a shows the two measurement results for a centrally loaded machine and evenly distributed measurement points, using the Wyler Zerotronic 3 sensor and the Fredericks electrolyte sensor (Figure 16b). It is evident that using significantly cheaper electrolyte sensors can yield nearly the same measurement results.
To validate the developed measurement method, a comparison measurement was carried out using a proven measurement procedure (see Figure 17). The measurement of the bolster plate deformation was carried out using 12 high-resolution measurement probes, which were mounted on a carbon fiber measurement frame using measurement stands. The four support points of the measurement frame were placed in the corner areas of the bolster plate to ensure a minimal measurement error due to external table deformations.
The measurement data analysis was initially carried out analogously to Figure 15a. The deformation at the respective measurement points was directly calculated from the extracted minimum and maximum values as well as the respective sensor positions (Figure 17b). In addition, four further virtual measurement points were added to the support points of the measurement frame and integrated into the analysis with a deformation of 0 µm. A continuous deformation image (Figure 18) was then calculated from the resulting 16 measurement points using the MATLAB® internal TPS function.
By extrapolating the deformation image beyond the support points of the measurement frame, the table deformation in the outer regions of the bolster plate (outside the measurement frame) could ultimately also be taken into account. For the extrapolation, the support points of the measuring frame were added as virtual measurement points, and their displacement was set to z = 0 µm. Subsequently, a surface approximation was calculated from the totality of all measurement points. For this purpose, a Matlab® internal fitting function (thin plate smoothing spline—TPS) was used, allowing an extrapolation beyond the originally contained range of values in the measurements. Figure 19 shows the measurement results for the central load introduction. The support points of the measuring frame are located in the corners of the bolster plate in Figure 18 (see also Figure 17b). Figure 19 depicts the calculated absolute and relative error maps of the measurement results on the test object.
The absolute error maps represent the difference between the inclination sensor-based deformation measurement and the performed direct comparative measurement. In order to provide a better assessment of the accuracy of the developed measurement method, relative error images were also calculated. A direct consideration of the relative deviations, where the percentage deviations between the two measurements are calculated with the spatial resolution, is not appropriate here. The reason is that the relative error increases disproportionately at very small deformation values in the peripheral areas of the bolster plate. This would not provide a sensibly evaluable error pattern. Therefore, the relative error images were calculated from the absolute error images in such a way that the relative values refer to the maximum deformation of the reference measurement in the center of the bolster plate. A comparison of the measurement accuracies generated by the two different types of inclination sensors reveals that both sensors provide deformation results within the same range of accuracy. When using the Wyler Zerotronic 3 sensor, the absolute errors range from −19 to +13 µm, corresponding to a relative accuracy of −8 to +11%. When using the Fredericks electrolytic sensor, the absolute errors range from −13 to +18 µm, which corresponds to relative errors of −11 to +8%.

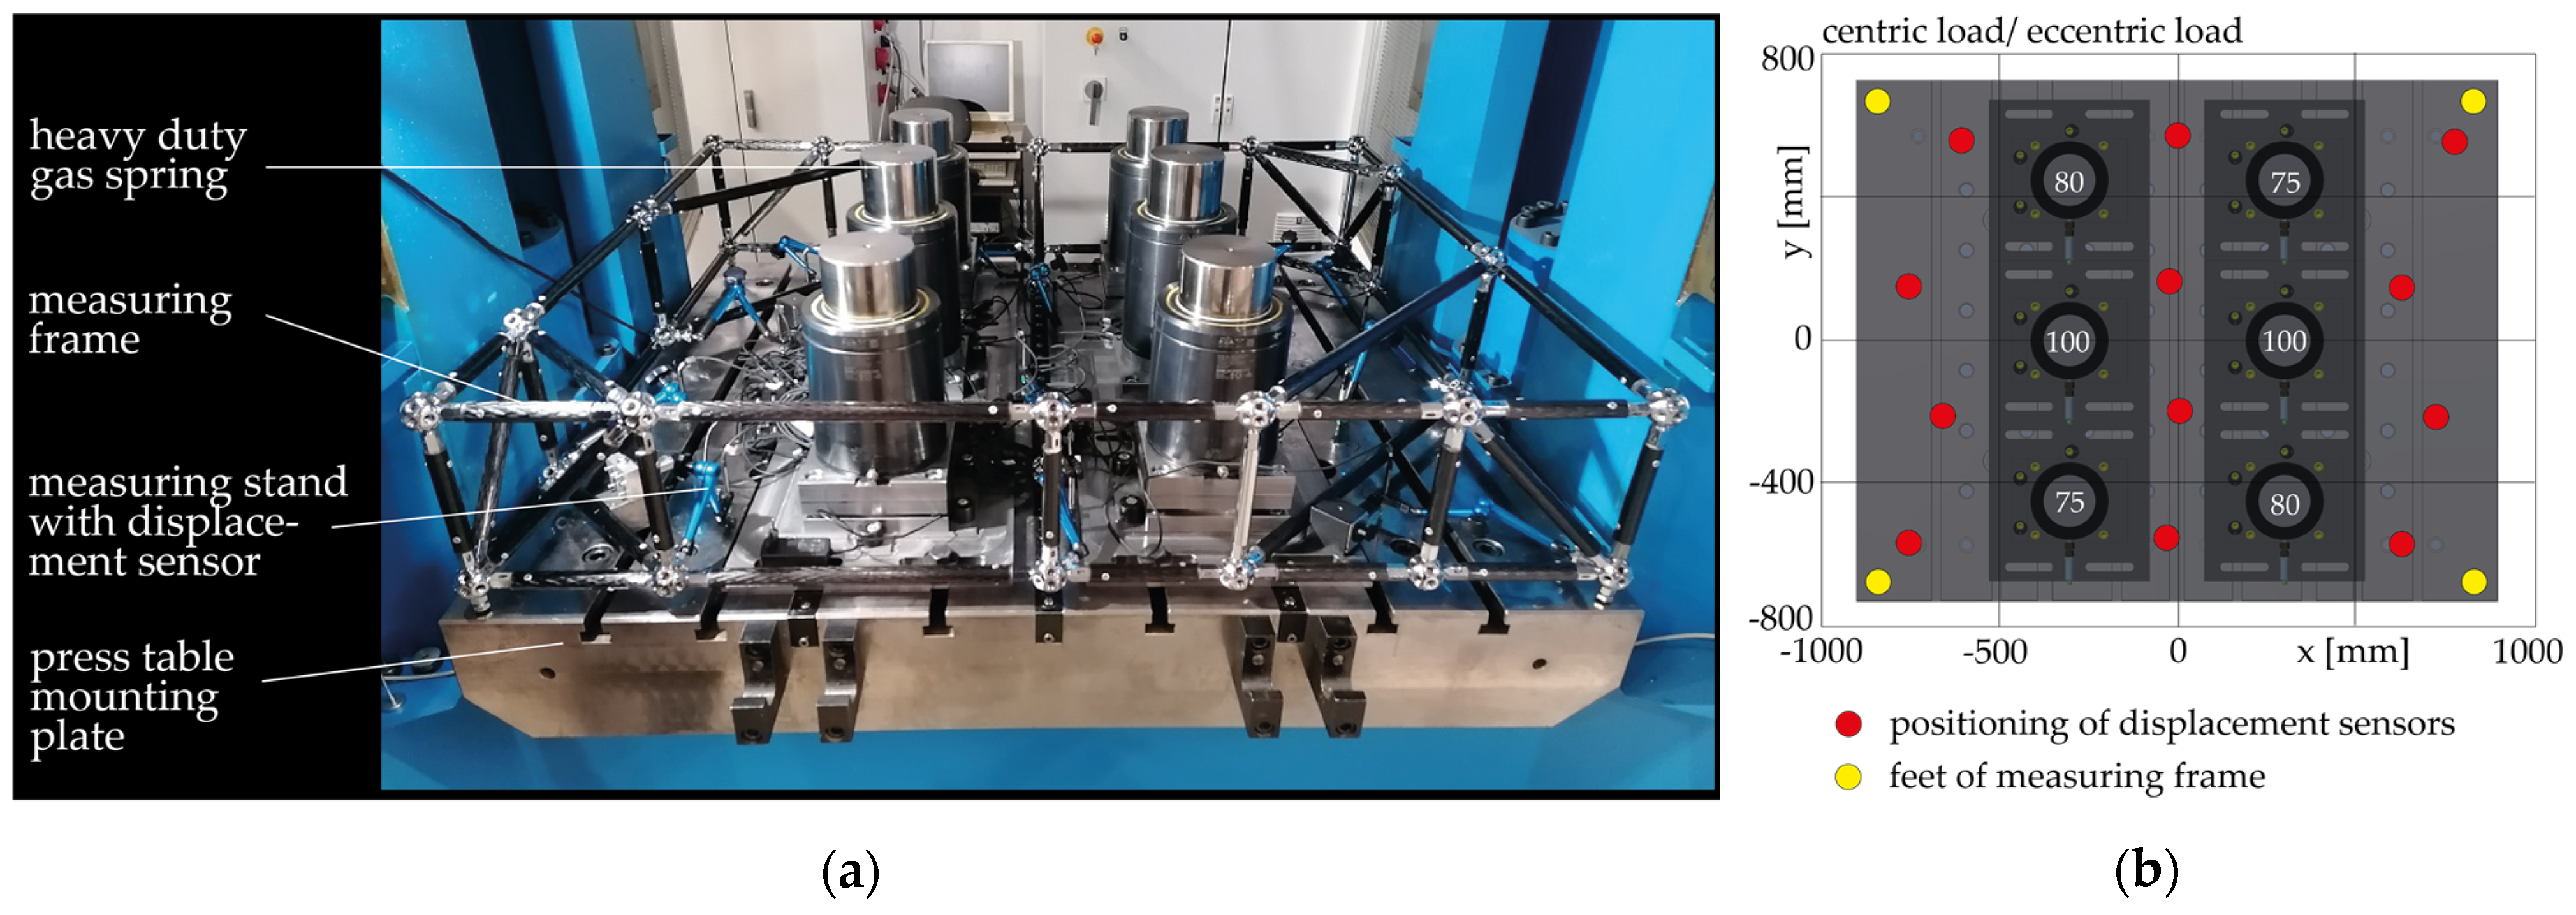
2.2.2. Testing as Part of a Press Commissioning at a Press Manufacturer

This section extends the basic testing of the newly developed inclination-based method using measurements under real conditions and a comparison with the proven displacement-based method on the same machine. For this purpose, the commissioning of a particularly precise servo spindle press at a press manufacturer was used—this is the test machine in the following. Figure 20 shows the applied test setups. The load was applied to the machine using a two-stage gas spring arrangement consisting of four gas springs of up to 1200 kN nominal force. The crosswise arrangement of springs with the same stroke length created a central load.
Good results were achieved in the laboratory test (Section 2.2.1) with the significantly cheaper electrolytic inclination sensor, so that only the electrolytic inclination sensor setup was used in the tests carried out here. According to the method described above, several inclination measurements in the x and y directions were carried out distributed on the bolster plate. Since only one prototypical inclination sensor setup was available, a separate load stroke was carried out with the machine for each measurement and an inclination profile was recorded from the unloaded to the fully loaded bolster plate.
In addition to the developed measurement method (Figure 20a), a second measurement using a measurement frame with 12 high-resolution measurement probes was applied, as described in Section 2.2.1 (Figure 20b). Due to the slightly inwardly shifted support points, the measurement frame shifts downward during load application. This measurement error is approximately compensated for by extrapolating the deformation surface generated from the measurement points to the edges of the bolster plate. Figure 21a,b show the measurement results obtained from the two applied measurement methods.
Figure 21c,d illustrate the measurement accuracies of the measurements conducted on the high-precision servo press. The measurements were performed using a cost-effective electrolytic inclination sensor. The achieved measurement accuracies range from −8 to +8 µm, corresponding to relative measurement accuracies of −11 to +6% relative to the maximum bolster plate deformation. The new measurement method yields comparable results to the established method in real conditions, indicating its effectiveness.

3. Discussion

Based on the findings from the theoretical investigations from Section 2.1.2 and Section 2.1.5, the sensitivity of the measurement results to the number of measurement points and the position of the individual measurements was investigated.

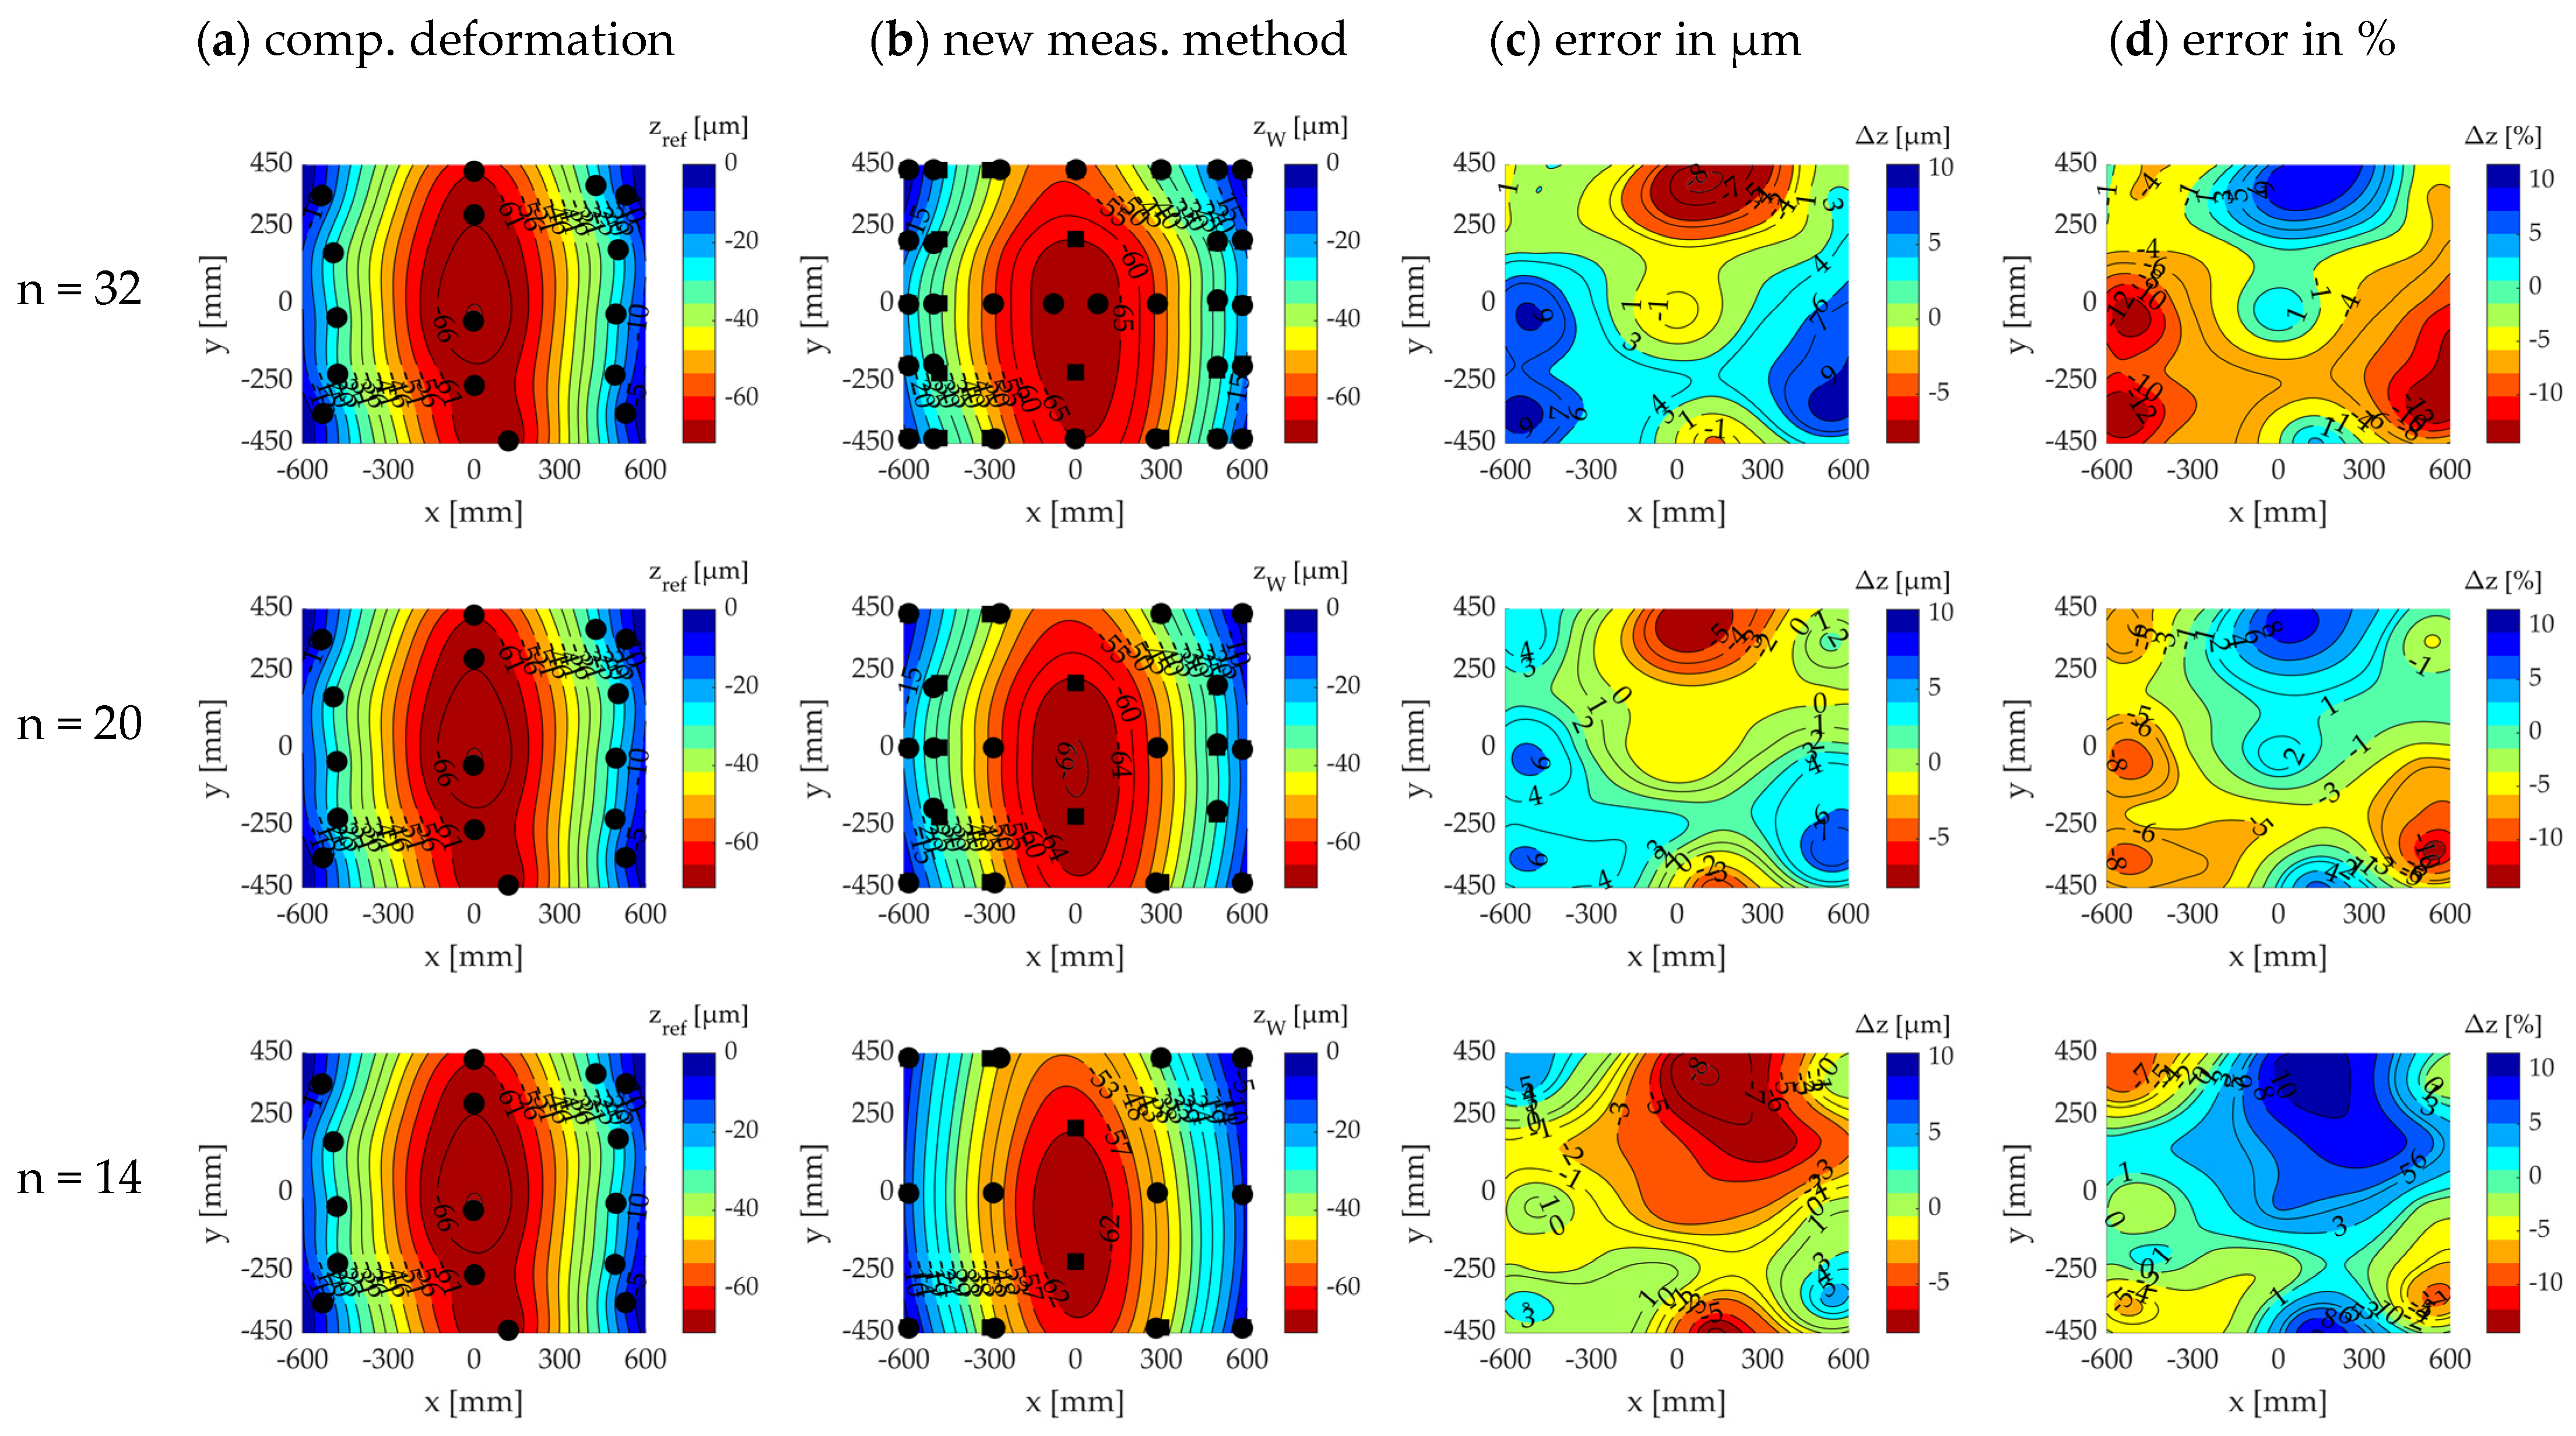
3.1. Sensitivity Analysis of Measurement Point Quantity

For this purpose, the individual measurement point readings were excluded from the calculation of the deformation images. Figure 22 shows the results of the developed measurement method for the evaluation of 45, 25, and 10 of the originally recorded measurement points on the test object, as well as the respective deviations from the comparison measurement. Figure 23, in analogy, presents the evaluation of 32, 20 and 14 of the measurement points recorded on the investigated test machine.
The calculated error images between the comparison measurement and the novel measurement method show that there is only a slight dependency of the measurement result on the number of measurement points. Even when evaluating only 10 measurement points (on the test object), the deviations compared to the comparison measurements are only slightly larger than when evaluating all recorded measurement points. For the test object the maximum errors range between 18 µm and 21 µm (11–14.5%). However, the deciding factor for this is the position of the measurement points on the object being measured. While there is a nearly even distribution of measurement points with 45 or 25 points on the test object (Figure 22), with 10 measurement points there is already a large degree of discretion in choosing the positions for the local inclination measurements on the test object.
Similarly, for the test machine, a reduction in the measurement points leads to only a slight increase in measurement inaccuracy—see Figure 23. For the test machine the maximum errors range between 8 µm and 10 µm (11–13%). Here too, however, the influence of the individual measurement positions on the calculated measurement result increases as the number of measurement points decreases. If an even distribution of a sufficient number of measurement points is not possible, it is especially important to capture the local inclinations where, as expected, high inclination values occur during deformation. In the example measurements of the bolster plate deformations with a centric load, the measurement points shown here are primarily located on the coordinate axes of the press coordinate system and in the bolster plate corners.

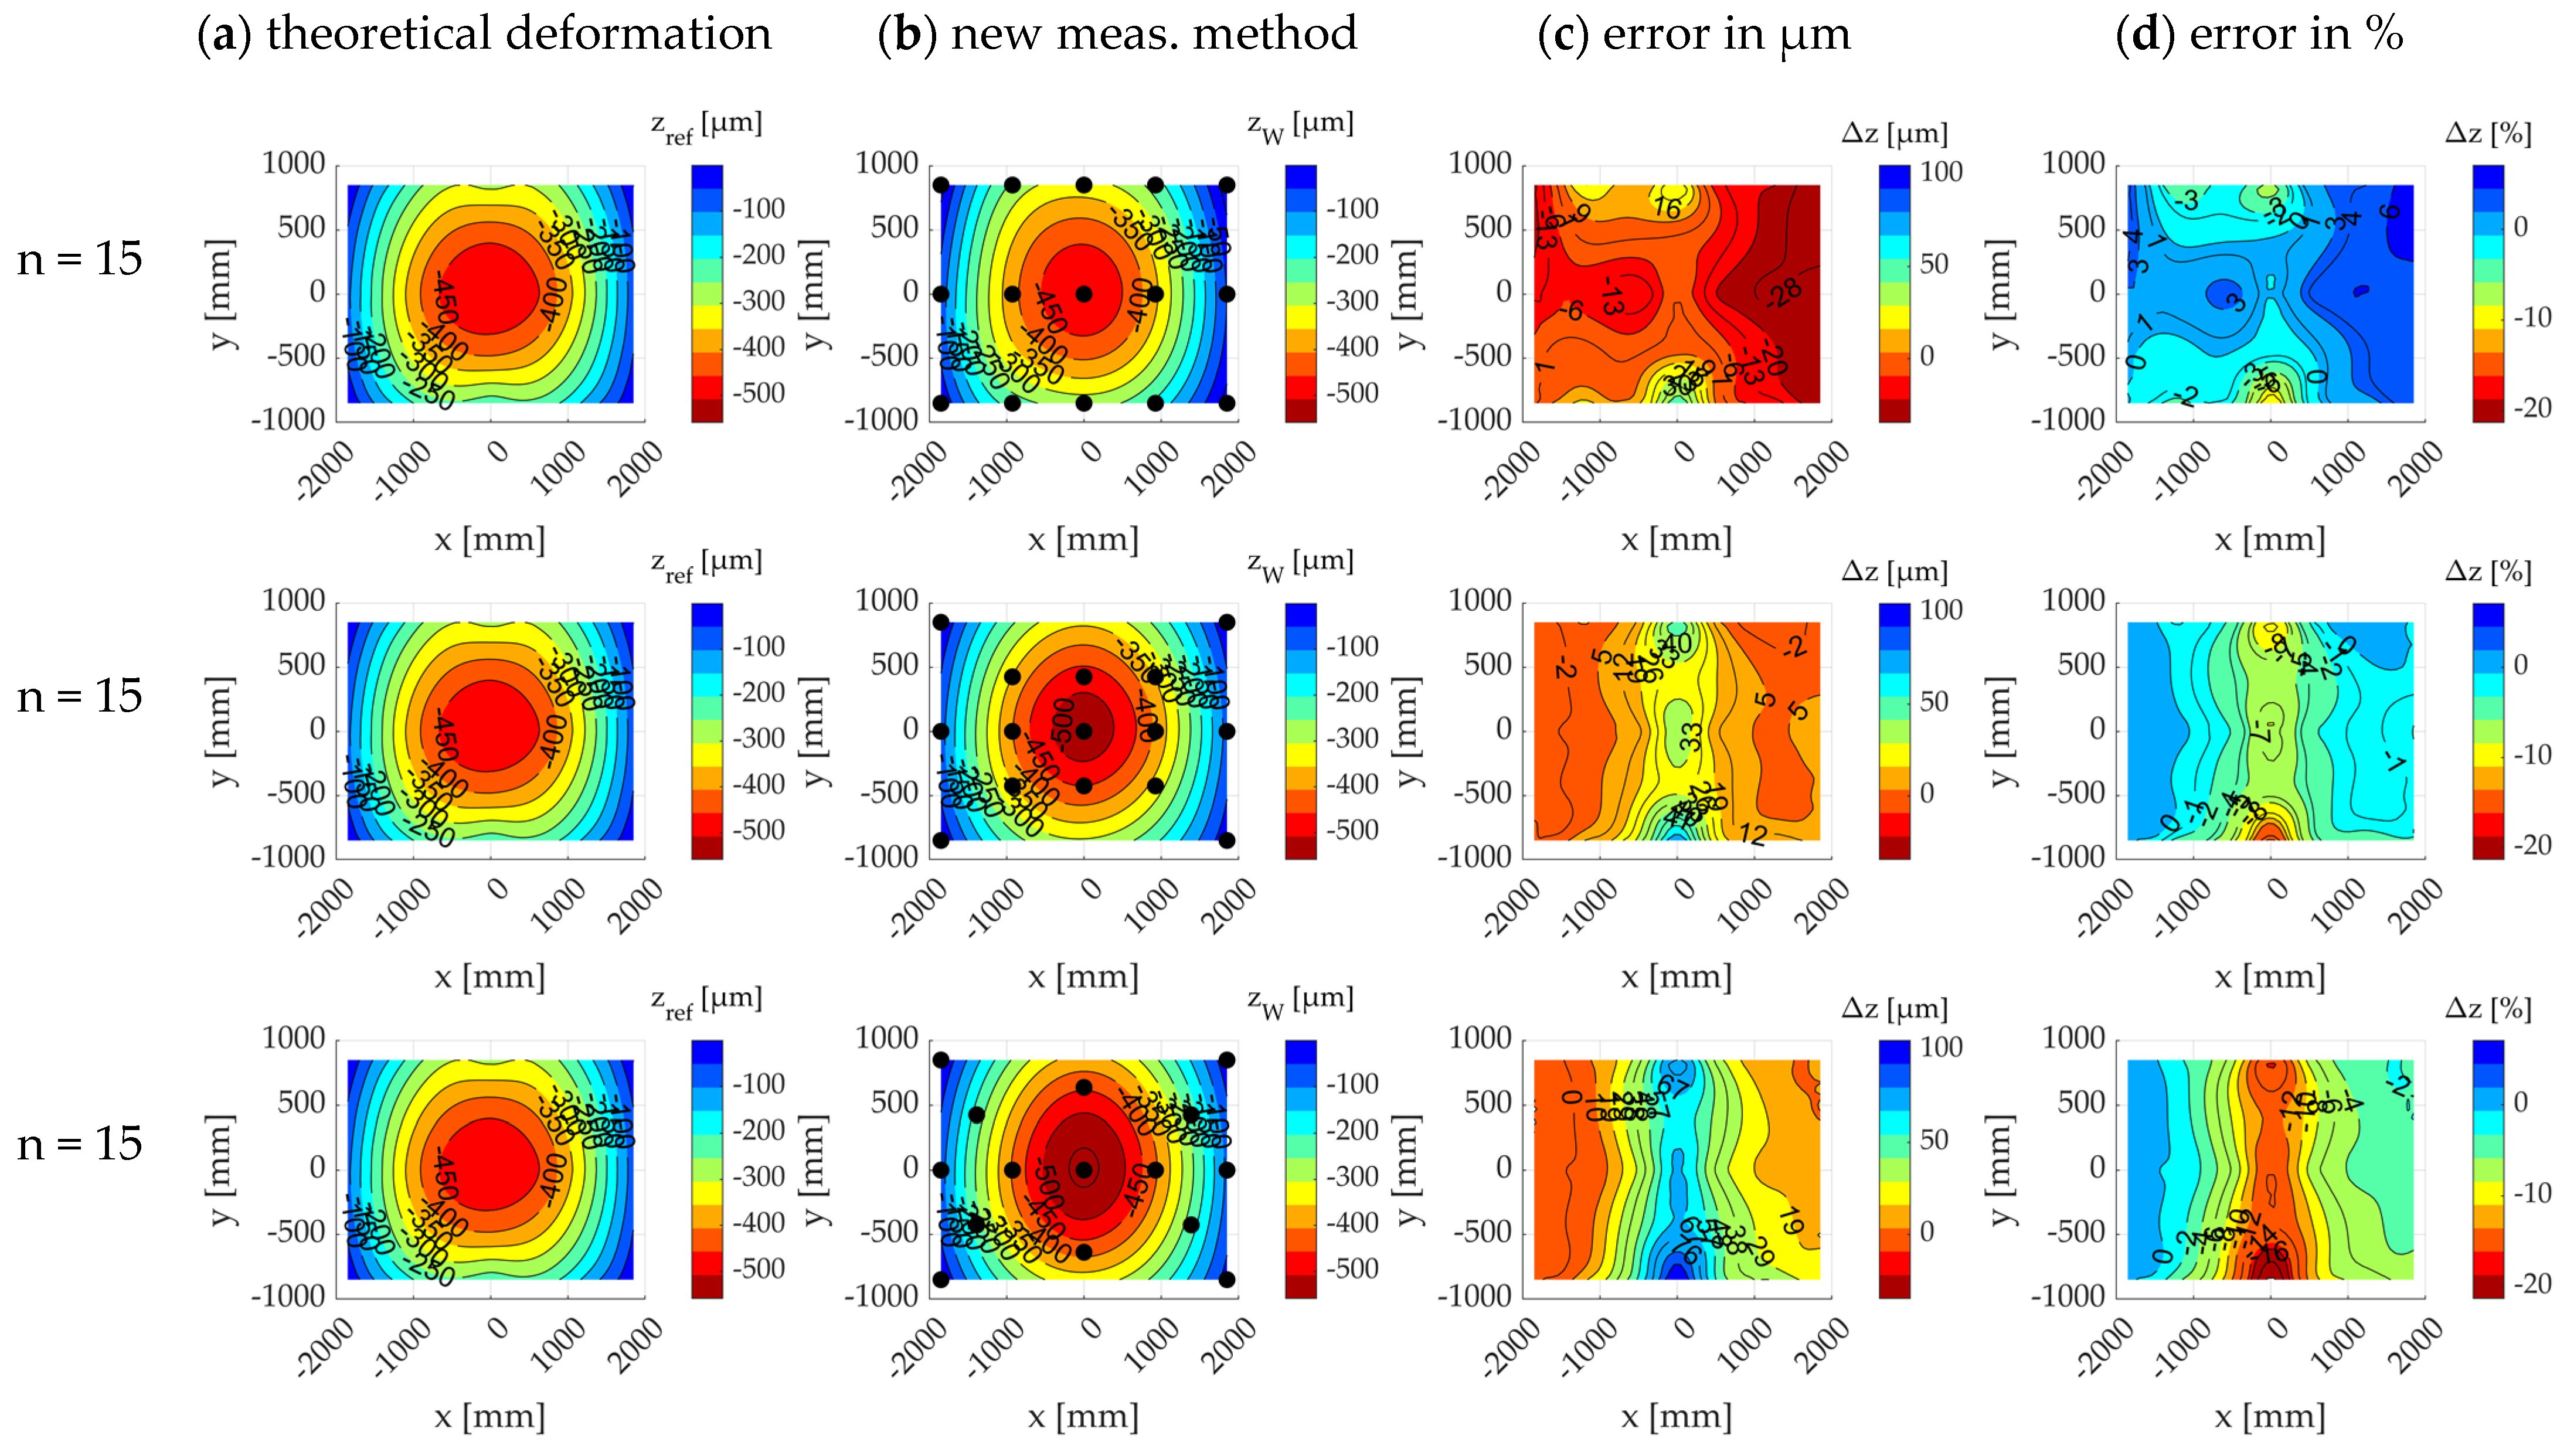
3.2. Sensitivity Analysis of Measurement Point Position

Figure 24 shows that for a small number of measuring points there can be a high sensitivity of the measuring accuracy at the individual measurement positions. The maximum absolute and relative errors on the test object vary between 19 and 46 µm (11.5–27.5%) when using nine measuring points. In the case of the test machine with 10 measuring points, a variation in the maximum measurement error of just 21–24 µm (29–33%) is observed, which suggests a much lower sensitivity. The different positioning variants of the measuring points in Figure 24 and Figure 25 were freely chosen from the available measurement data.

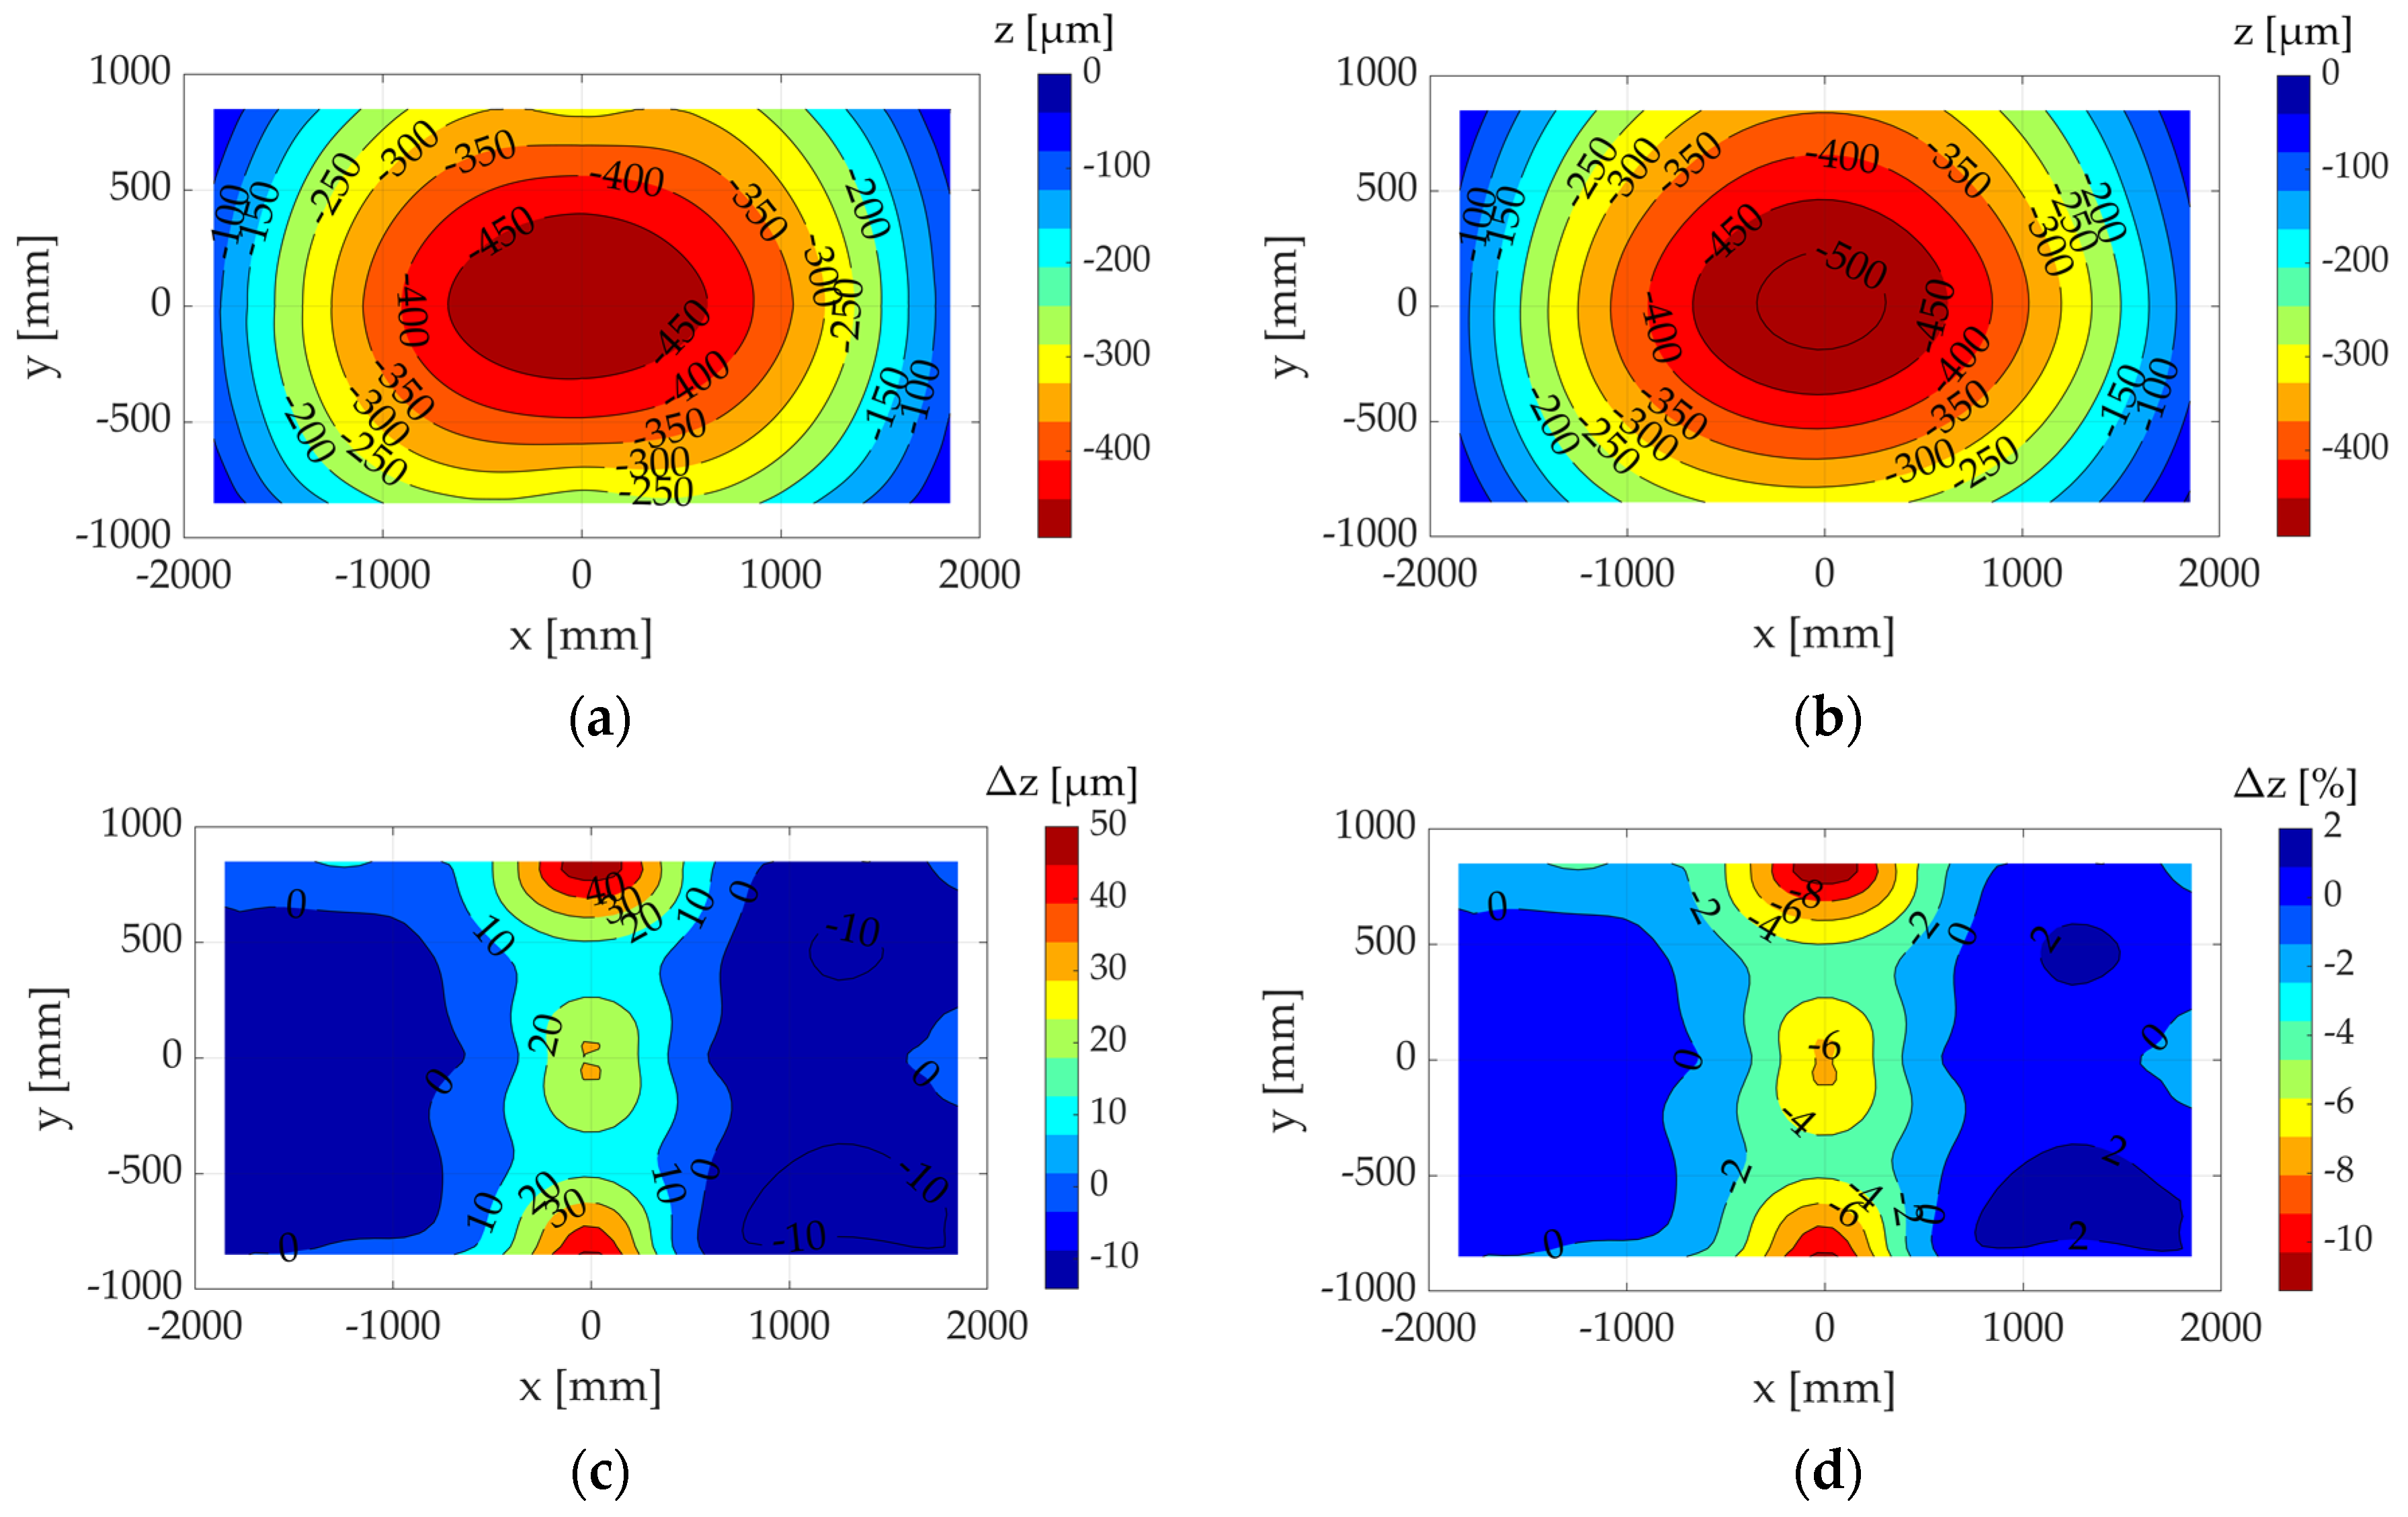
3.3. Error Considerations of the Conducted Measurements

The presented measurement results were obtained under the influence of several potential sources of error, which are briefly addressed below. Simplified inclination sensor setups were used in the studies to capture the inclination signals on the bolster plates under investigation. Only one sensor per sensor type was available for the fundamental studies performed, requiring a large number of individual measurements that were not synchronized in time for each series of measurements. The inclination measurements and the probe measurements of the comparative measurement were conducted on separate days for both machines. In summary, the following potential sources of error can be identified:
  • Deviations in the load application between the inclination-based deformation measurement and the comparative measurement due to temperature differences in the gas pressure springs and minimal leakage at the spring valves;
  • Deviations in the load application due to control deviations in the force or stroke controls of the test object and the machine;
  • Inaccuracies in the manual evaluation of the non-synchronized raw measurement data of the individual inclination measurements;
  • Inaccuracies in the manual alignment of the sensor setups on the bolster plates;
  • Angular errors due to deviations from perpendicularity during the setup of the sensors on the simplified sensor setups;
  • Angular errors due to deviations from perpendicularity during the alignment of the sensor setups on the bolster plates of the test machines;
  • Temperature drifts of the inclination sensors during the recording of a measurement series (lasting several hours);
  • Minimal adjustment of the sensor alignment on the recording plates of the simplified sensor setups;
  • Insufficient holding time at maximum load at BDC.
It can be assumed that by reducing the potential sources of errors, the measurement results would be even more precise. One essential measure for this is the synchronized measurement of all measurement points involved in a deformation measurement, as well as the precise and stable installation of the sensors in the measurement modules.

4. Conclusions

This paper presents a novel measurement method for the 3D deformation measurement on machine tools based on local inclination measurements. Its functionality was demonstrated for the deformation measurements on press bolster plates within an accuracy range of <20 µm. For the measurement of static bolster plate deformations, the presented method offers significant advantages over existing methods. These include a high application efficiency, a high level of application flexibility, and comparatively low acquisition costs compared to laser trackers or stereo camera systems, as well as measurement frames with high-precision measurement probes. In addition to pure deformation measurements, the presented method and the corresponding measurement system also allow displacement measurements, e.g., to determine ram tilting due to eccentric load application. Further investigations will be carried out.
It was experimentally proven that, starting from 20 local inclination measurement points, central bolster plate deformations can be reliably detected. As the number of measurement points decreases, the influence of the measurement positions on the measurement result increases. Future work will therefore focus on methods for a model-based optimization of the measurement positions.
It is also expected that a further improvement in the measurement accuracy can be achieved by using time-synchronized measurement modules. The development of such a measurement system is currently in progress at ICM e.V. The measurement system will consist of 25 measurement modules and is intended to enable a simple and time-saving yet precise determination of the deformations and deflections in forming presses under load. A patent application for the presented measurement method and the developed measurement system has already been filed by ICM.
At present, it is not possible to carry out dynamic measurements during continuous cycling of the press or to introduce dynamic loads at this stage of the system development. Nonetheless, it is feasible to extend the fundamental approach to dynamic measurements with the aid of appropriate sensors. This is also planned for future research.

5. Patents

Patent application under the patent number 10 2023 115 430.3.

Author Contributions

Conceptualization; software; validation; formal analysis; data curation; writing—original draft preparation; visualization; project administration; and funding acquisition, G.I.; methodology, G.I. and T.B.; investigation, G.I.; writing—review and editing, L.P. and S.I.; supervision, G.I. and L.P.; All authors have read and agreed to the published version of the manuscript.

Funding

This research was funded by the Federal Ministry for Economic Affairs and Climate Action (BMWi), grant number 49MF200106, and the APC was funded by ICM—Institute for Mechanical and Plant Engineering Chemnitz e.V.

Data Availability Statement

The data presented in this study are available on request from the corresponding author. The data are not publicly available due to agreements between the machine owners and ICM—Institute for Mechanical and Plant Engineering Chemnitz e.V.

Acknowledgments

Special thanks go to the Chair of Machine Tool Development and Adaptive Control at TU Dresden and H&T ProduktionsTechnologie GmbH.

Conflicts of Interest

The authors declare no conflict of interest.

Abbreviations/Nomenclature

TermExplanation
bolster plateclamping plate for tool fixture in forming presses
press commissioningsetup and initiation process, including testing and making the press operational
press rammovable part of a press that applies pressure to the material being processed
press tableflat surface or platform on a press where the material or workpiece is positioned and processed
press working space/areaarea between the table and the ram of a forming press
T-slotgroove in press table or ram for tool fixation
BDCBottom Dead Center
DICDigital Image Correlation
ICMICM—Institut Chemnitzer Maschinen- und Anlagenbau e.V.
PSDPosition Sensitive Detector
TPSThin plate smoothing spline
2DTwo dimensional
3DThree dimensional

References

  1. Behrens, B.-A.; Werbs, M.; Brecher, C.; Hork, M. Entwicklung und Erweiterung Standardisierter Messverfahren zur Statischen und Dynamischen Pressenvermessung; EFB-Forschungsbericht: Hanover, Germany, 2006; p. 250. [Google Scholar]
  2. Behrens, B.-A.; Brecher, C.; Hork, M.; Werbs, M. New standardized procedure for the measurement of the static and dynamic properties of forming machines. Prod. Eng. Res. Dev. 2007, 1, 31–36. [Google Scholar] [CrossRef]
  3. Abbasi, F.; Sarasua, A.; Trinidad, J.; Otegi, N.; Saenz de Argandoña, E.; Galdos, L. Substitutive Press-Bolster and Press-Ram Models for the Virtual Estimation of Stamping-Tool Cambering. Materials 2022, 15, 279. [Google Scholar] [CrossRef]
  4. Roth, T. Ermittlung von Kennwerten von Einfachwirkenden Umformmaschinen für die Zustandsorientierte Instandhaltung und die Qualifizierung des Werkzeugentstehungsprozesses. Ph.D. Thesis, Chemnitz University of Technology, Chemnitz, Germany, 2015. [Google Scholar]
  5. Struck, R. Berücksichtigung von Werkzeug- und Pressenelastizitäten in der Umformsimulation zur verbesserten Vorhersage des Pressenkraftbedarfes. VDI-Berichte 2008, 2031, 185–199. [Google Scholar]
  6. Struck, R. Bestimmung der Minimal Notwendigen Pressenkraft zur Herstellung von Karosseriestrukturbauteilen im Automobilbau. Ph.D. Thesis, Leibniz University Hannover, Hannover, Germany, 2010. [Google Scholar]
  7. Wagener, H.-W.; Weikert, J. Messung der Tisch- und Stößeldurchbiegung an Torgestellpressen. Blech Rohre Profile 1997, 5, 46–52. [Google Scholar]
  8. Tehel, R.; Päßler, T.; Kurth, R.; Nagel, M.; Reichert, W.; Ihlenfeldt, S. Virtual Tryout: Case Study on Simulation-Based Design and Die Spotting of Forming Tools. Eng. Proc. 2022, 26, 9. [Google Scholar] [CrossRef]
  9. Pilthammar, J.; Skåre, T.; Galdos, L.; Fröjdh, K.; Ottosson, P.; Wiklund, D.; Carlholmer, J.; Sigvant, M.; Ohlsson, M.; Sáenz de Argandoña, E.; et al. New press deflection measuring methods for the creation of substitutive models for efficient die cambering. IOP Conf. Ser. Mater. Sci. Eng. 2021, 1157, 012076. [Google Scholar] [CrossRef]
  10. Wiedenmann, X. Dynamische Prozesse in Pressen erkennen—Der digitale Fingerabdruck. In Proceedings of the Conference Mehr Effizienz im Presswerk 2023, Würzburg, Germany, 15 June 2023. [Google Scholar]
  11. Zgoll, F. Methodik zur Maschinenoptimalen Werkzeugeinarbeitung Durch Virtuelle Kompensation der Werkzeug- und Pressendurchbiegung. Ph.D. Thesis, Technical University of Munich, Munich, Germany, 2021. [Google Scholar]
  12. Kurth, R.; Bergmann, M.; Tehel, R.; Dix, M.; Putz, M. Cognitive clamping geometries for monitoring elastic deformation in forming machines and processes. CIRP Ann. 2021, 70, 235–238. [Google Scholar] [CrossRef]
  13. Schapp, L.O. Gekoppelte Simulation von Maschine und Prozess in der Massivumformung. Ph.D. Thesis, RWTH Aachen University, Aachen, Germany, 2008. [Google Scholar]
  14. Tehel, R.; Päßler, T.; Mihm, M. Modeling elastic behavior of forming machine components to reduce tool manufacturing time. Procedia Manuf. 2019, 27, 177–184. [Google Scholar] [CrossRef]
  15. Tehel, R.; Päßler, T.; Bergmann, M. Effective FE models for simulating the elasto-mechanical characteristics of forming machines. Int. J. Adv. Manuf. Technol. 2020, 58, 9–12, 588. [Google Scholar] [CrossRef]
  16. Wagener, H.-W.; Wiedner, M. Analyse des statischen und dynamischen Genauigkeitsverhaltens einer 5000 kN-Vierpunkt-Exzenterpresse mit Hilfe der Lasermesstechnik. UTF Sci. 2001, 1, 9–14. [Google Scholar]
  17. GOM Gesellschaft für Optische Messtechnik. Application Note: 3D Motion Analysis—Optical Measuring Technology for Dynamic Analysis of Press Machines. Available online: https://mailassets.gom.com/user_upload/industries/forming_machine_EN.pdf (accessed on 30 December 2023).
  18. Müller, P. Analyse Elastischer Wechselwirkungen an Servo-Spindelpressen. Ph.D. Thesis, Chemnitz University of Technology, Chemnitz, Germany, 2018. [Google Scholar]
  19. Müller, P.; Kriechenbauer, S.; Drossel, W.-G. Experimental analysis of the elastic boundary conditions of press machines for modelling the deep-drawing process. Int. J. Adv. Manuf. Technol. 2019, 101, 579–592. [Google Scholar] [CrossRef]
  20. Pilthammar, J.; Sigvant, M.; Hansson, M.; Pálsson, E.; Rutgersson, W. Characterizing the Elastic Behaviour of a Press Table through Topology Optimization. J. Phys. Conf. Ser. 2017, 896, 12068. [Google Scholar] [CrossRef]
  21. Pilthammar, J. Elastic Press and Die Deformations in Sheet Metal Forming Simulations. Ph.D. Thesis, Blekinge Institute of Technology, Karlskrona, Germany, 2017. [Google Scholar]
  22. Zgoll, F.; Götze, T.; Volk, W. Building a substitute model of a bolster based on experimentally determined deflection. J. Phys. Conf. Ser. 2017, 896, 012044. [Google Scholar] [CrossRef]
  23. Zgoll, F.; Götze, T.; Volk, W. Influence of the elastic behaviour of a moving bolster on the active surface of a punch: A numerical investigation. In Proceedings of the Forming Technology Forum 2017, Enschede, The Netherlands, 12–13 October 2017. [Google Scholar]
  24. Zgoll, F.; Kuruva, S.; Götze1, T.; Volk, W. Virtual die spotting: Compensation of elastic behavior of forming presses. IOP Conf. Ser. Mater. Sci. Eng. 2019, 651, 012021. [Google Scholar] [CrossRef]
  25. Pan, B. Digital image correlation for surface deformation measurement: Historical developments, recent advances and future goals. Meas. Sci. Technol. 2018, 29, 082001. [Google Scholar] [CrossRef]
  26. Amirpour, M.; Bickerton, S.; Calius, E.; Das, R.; Mace, B. Numerical and experimental study on deformation of 3D-printed polymeric functionally graded plates: 3D-Digital Image Correlation approach. Compos. Struct. 2019, 211, 481–489. [Google Scholar] [CrossRef]
  27. Almazán-Lázaro, A.-J.; López-Alba, E.; Rubio-García, L.; Díaz-Garrido, F.-A. Indentation Measurement in Thin Plates under Bending Using 3D Digital Image Correlation. Appl. Sci. 2021, 11, 2706. [Google Scholar] [CrossRef]
  28. Pupurs, A.; Loukil, M.; Varna, J. Digital Image Correlation (DIC) Validation of Engineering Approaches for Bending Stiffness Determination of Damaged Laminates. Appl. Compos. Mater. 2022, 29, 1937–1958. [Google Scholar] [CrossRef]
  29. Xu, W.; Li, J.; Zhang, B.; Yang, L. A new approach to reduce springback in sheet metal bending using digital image correlation. Int. J. Mater. Res. 2019, 110, 726–733. [Google Scholar] [CrossRef]
  30. Gothivarekar, S.; Coppieters, S.; Van de Velde, A.; Debruyne, D. Advanced FE model validation of cold-forming process using DIC: Air bending of high strength steel. Int. J. Mater. Form. 2020, 13, 409–421. [Google Scholar] [CrossRef]
  31. Sun, W.; Xu, Z.; Li, X.; Chen, Z.; Tang, X. Three-Dimensional Shape and Deformation Measurements Based on Fringe Projection Profilometry and Fluorescent Digital Image Correlation via a 3 Charge Coupled Device Camera. Sensors 2023, 23, 6663. [Google Scholar] [CrossRef] [PubMed]
  32. Salfeld, V. Experimentelle und numerische Untersuchungen zur Verlagerung des Pressenstößels infolge einer Horizontalkraft. Ph.D. Thesis, Leibniz University Hannover, Hannover, Germany, 2015. [Google Scholar]
  33. Ottosson, P.; Pilthammar, J.; Wiklund, D.; Skåre, T.; Sigvant, M. Substitutive models of press deflections for efficient numerical die cambering. IOP Conf. Ser. Mater. Sci. Eng. 2023, 1284, 012060. [Google Scholar] [CrossRef]
  34. Kurth, R.; Alaluss, M.; Wagner, M.; Tehel, R.; Riemer, M.; Ihlenfeldt, S. Process Monitoring using Digital Twin-Based Sensors integrated in Tool Clamping Surfaces. IOP Conf. Ser. Mater. Sci. Eng. 2023, 1284, 012016. [Google Scholar] [CrossRef]
  35. Alaluss, M.; Kurth, R.; Tehel, R.; Wagner, M.; Wagner, N.; Ihlenfeldt, S. Potential of Tool Clamping Surfaces in Forming Machines for Cognitive Production. J. Mach. Eng. 2022, 22, 116–131. [Google Scholar] [CrossRef]
  36. Kurth, R.; Tehel, R.; Päßler, T.; Putz, M.; Wehmeyer, K.; Kraft, C.; Schwarze, H. Forming 4.0: Smart machine components applied as a hybrid plain bearing and a tool clamping system. Procedia Manuf. 2019, 27, 65–71. [Google Scholar] [CrossRef]
  37. Tehel, R. Smart Machine Components. Fundamental Part of Cognitive Forming Machines. 21; Werkzeugmasch.-Fachsemin: Dresden, Germany, 2019. [Google Scholar] [CrossRef]
  38. Gao, N.H.; Zhao, M.; Li, S.Z. Displacement Monitoring Method Based on Inclination Measurement. Adv. Mater. Res. 2011, 368–373, 2280–2285. [Google Scholar]
  39. Guidi, V.; Mazzolari, A.; Salvador, D.; Carnera, A. Silicon crystal for channelling of negatively charged particles. J. Phys. D Appl. Phys. 2009, 42, 182005. [Google Scholar] [CrossRef]
  40. Hou, X.; Yang, X.; Huang, Q. Using Inclinometers to Measure Bridge Deflection. J. Bridge Eng. 2005, 10, 564–569. [Google Scholar] [CrossRef]
  41. Sousa, H.; Cavadas, F.; Henriques, A.; Bento, J.; Figueiras, J. Bridge deflection evaluation using strain and rotation measurements. Smart Struct. Syst. 2013, 11, 365–386. [Google Scholar] [CrossRef]
  42. Yu, H.; Chen, X.; Ren, M.; Yin, L.; Wu, Q.; Zhan, J.; Liu, Q. A coupled bend-twist deformation monitoring method based on inclination measurement and rational cubic spline fitting. Mech. Syst. Signal Process. 2021, 147, 107084. [Google Scholar] [CrossRef]
  43. Roskam, R. In-Prozess-Überwachung von Pressen der Blechverarbeitung. Ph.D. Thesis, Leibniz University Hannover, Hannover, Germany, 1999. [Google Scholar]
Figure 1. Press workspace with load device: (a) press workspace without load and press ram in upper position; and (b) press under load with ram in bottom dead center (BDC) and deformed bolster plates.
Machines 12 00040 g001
Figure 2. State of the art measuring methods for detecting clamping plate deformation in presses (red arrows represent load force). (a) Freestanding sensors; (b) measuring frame with displacement sensors; (c) measuring bar with displacement sensors; (d) T-slot measuring bar with eddy current sensors and additional measuring bar; (e) measuring bar with displacement sensors and additional laser tracker measurement; (f) laser tracker with targets; (g) laser—PSD combination; (h) stereo camera with markers; (i) strain gauges on clamping plate; (j) measuring bar with strain gauges or optic fiber sensor; (k) T-slot sensors; (l) compression specimens.
Machines 12 00040 g002
Figure 3. Evaluation of previous measurement methods for capturing clamping plate deformations. Rating legend: 1—insufficient, 2—sufficient, 3—satisfactory, 4—good, 5—very good.
Machines 12 00040 g003
Figure 4. Approach for two-dimensional inclination-based deformation measurement: (1) unloaded object; (2) fully loaded object; (3) inclination differences between unloaded and loaded states; (4) approximation of inclination values; (5) numerical integration of inclination approximation.
Machines 12 00040 g004
Figure 5. Parameters and boundary conditions on the 2D bending beam for different support conditions (a and b represent the distances from the bearing points to the point of force application) (a) both sides with loose bearings; and (b) both sides with fixed clamping.
Machines 12 00040 g005
Figure 6. Results of theoretical investigations on the 2D bending beam under central loading: (a) evenly distributed measurement positions—beam a; (b) evenly distributed measurement positions—beam b; (c) manually optimized measurement positions—beam a; (d) manually optimized measurement positions—beam b; (e) increased number of measurement points—beam a; (f) increased number of measurement points—beam b; (g) relative error curves—beam a; and (h) relative error curves—beam b.
Machines 12 00040 g006
Figure 7. Results of theoretical investigations on the 2D bending beam with 90% off-centric loading: (a) evenly distributed measurement positions—beam a; (b) evenly distributed measurement positions—beam b; (c) manually optimized measurement positions—beam a; (d) manually optimized measurement positions—beam b; (e) increased number of measurement points—beam a; (f) increased number of measurement points—beam b; (g) relative error curves—beam a; and (h) relative error curves—beam b.
Machines 12 00040 g007
Figure 8. Approach for the three-dimensional inclination-based deformation measurement: (1) measurements on loaded object; (2) inclination differences in the x and y directions; (3) approximation of inclination values; (4) numerical integration; (5) calculation of measurement result.
Machines 12 00040 g008
Figure 9. Digitization of measurement value curves of press bolster plate deformations from [4], test machine A: (a) measurement values of the bolster plate deformation parallel to the x axis; (b) measurement values of the bolster plate deformation parallel to the y axis; (c) digitization of the measurement values and transfer into the 3D space; (d) and approximation to a 3D surface.
Machines 12 00040 g009
Figure 10. Results of the theoretical investigations on measurements from [4]: (a) inclination approximation in the x direction; (b) inclination approximation in the y direction; (c) integration surface of the inclination approximation in the x direction after subtracting the initial y-deformations; and (d) integration surface of the inclination approximation in the y direction after subtracting the initial x-deformations.
Machines 12 00040 g010
Figure 11. Theoretical investigation results of measurements from [4]: (a) 3D deformation surface of test machine A based on measurement results; (b) theoretical measurement result of virtual inclination-based deformation measurement; (c) theoretical measurement error in µm; and (d) theoretical measurement error in %.
Machines 12 00040 g011
Figure 12. Sensitivity analysis of the number of evenly distributed measurement points for the calculated theoretical deformation of the bolster plate of test machine A in [4].
Machines 12 00040 g012
Figure 13. Sensitivity analysis of the measurement positions for the calculated theoretical deformation of the bolster plate of test machine A in [4].
Machines 12 00040 g013
Figure 14. Measurement setup for inclination-based deformation measurements on the bolster plate of the test object: (a) gas spring loading setup and used inclination sensor setups; and (b) applied measurement positions for inclination measurements in the x and y directions.
Machines 12 00040 g014
Figure 15. Approach for the measurement data analysis: (a) raw measurement data and moving average filter (red—unloaded state, blue—loaded state); (b) extracted minimum and maximum inclination values (red—unloaded state, blue—loaded state); (c) calculated inclination differences between loaded and unloaded states (red—y direction, blue —x direction); (d) calculated inclination approximations in x and y directions (dots represent measurement points); and (e) final deformation image of the measured object (the measurement result).
Machines 12 00040 g015
Figure 16. Measurement results of the developed measurement method under central load application on the test object: (a) Wyler Zerotronic inclination sensor, evenly distributed measurement points that were manually selected; and (b) Fredericks electrolyte sensor, evenly distributed measurement points that were manually selected.
Machines 12 00040 g016
Figure 17. Measurement setup for conducting a comparative measurement on the bolster plate of the test object: (a) gas spring setup and measurement frame equipped with high-resolution measurement probes; and (b) positions of the measurement probes and support points (numbers 75, 80, 100 represent the stroke lengths of the gas springs).
Machines 12 00040 g017
Figure 18. Measurement result of the comparison measurement of the bolster plate deformation of the test object under central load application.
Machines 12 00040 g018
Figure 19. Comparison of the measurement results using the novel measurement method, with the results of the comparative measurement on the test object: (a) error in µm with the Wyler Zerotronic 3 sensor; (b) error in µm with the electrolytic sensor; (c) error in % with the Wyler Zerotronic 3 sensor; and (d) error in % with the electrolytic sensor.
Machines 12 00040 g019
Figure 20. Experimental setups for the determination of bolster plate deformations during a press commissioning test on the test machine (numbers 80, 100 represent the stroke lengths of the gas springs): (a) gas spring loading setup for central load force introduction and simplified inclination sensor setup; measurement points for inclination-based deformation measurement at evenly distributed positions; and (b) gas spring setup and measurement frame with 12 measurement probes for comparative measurement; measurement probe positions and support points for comparative measurement.
Machines 12 00040 g020
Figure 21. Measurement results of the deformation measurements conducted on the test machine and a comparison with the results of the comparative measurement: (a) measurement results obtained using the developed measurement method with evenly distributed manual measurement positions; (b) measurement results of the comparative measurement; (c) error in µm with the Fredericks electrolytic sensor; and (d) error in % with the Fredericks electrolytic sensor.
Machines 12 00040 g021
Figure 22. Sensitivity analysis of the number of measurement points for the bolster plate deformation measurement on the test object.
Machines 12 00040 g022
Figure 23. Sensitivity analysis of the number of measurement points for the bolster plate deformation measurement on the test machine.
Machines 12 00040 g023
Figure 24. Sensitivity analysis of the positions of measurement points for the bolster plate deformation measurement on the test object.
Machines 12 00040 g024
Figure 25. Sensitivity analysis of the positions of measurement points for the bolster plate deformation measurement on the test machine.
Machines 12 00040 g025
Disclaimer/Publisher’s Note: The statements, opinions and data contained in all publications are solely those of the individual author(s) and contributor(s) and not of MDPI and/or the editor(s). MDPI and/or the editor(s) disclaim responsibility for any injury to people or property resulting from any ideas, methods, instructions or products referred to in the content.

