1. Introduction
As ADAS (advanced driving-assisted system) and autonomous driving-related technologies improve, projects and research on their demonstration are continuously being developed. In Europe, co-operative autonomous technology demonstrations such as Adaptive (2014–2017) [
1] and DriveMe (2014–2017) [
2], which provide guidelines and technology demonstrations, and in which 100 vehicles have participated, are promoted as the most advanced projects. In addition, the FESTA handbook [
3] presents a methodology consisting of a V-cycle divided into FOT preparation, data acquisition, and analysis.
The major European FOT cases for autonomous driving-related demonstration are euroFOT (2008–2012) [
4], FOTsis (2011–2014) [
5], DriveC2X (2011–2014) [
6], TeleFOT (2008–2012) [
7], and the Pegasus Project (2016~2019) [
8], etc. In the case of the United States, there is the PATH project (2000~2012) [
9], Safety Pilot (2011~2013) [
10], IVBSS (2005~2011) [
11], M-city (2015) [
12], etc. In Japan, there is the Woven City (2021-present) project [
13]. In South Korea, there are various demonstration environments and service demonstration cases, such as K-city (2015~2017), 5G infrastructure construction projects (2020~present), and the establishment of a future car digital convergence industry demonstration platform (2021~present). In addition to self-driving-related demonstrations, research on scenarios and ODD (operational design domain) is constantly being carried out.
Regarding autonomous driving-related research, various studies are being conducted based on levels 0–5 proposed by SAE [
14]. As studies on self-driving cars on SAE levels 0~2 continue, the mass production of autonomous vehicles designed to function in environments without traffic lights, such as on more remote highways, is gradually emerging.
As self-driving demonstrations and studies increase, it is necessary to study the systematic process of these research methods and, based on this, to develop an analysis method for the experimental results. In particular, autonomous driving-related accidents have continuously occurred since the operation of autonomous vehicles, and according to statistics released for California, USA, as of June 2022, 483 self-driving vehicle crashes have been reported [
15]. To improve the safety of autonomous vehicles, it is necessary to improve the autonomous driving function through demonstrations in various environments.
Throughout this study, various scenario types were classified and defined using the FOT procedure and FOT scenarios. These scenarios were evaluated through simulations and vehicle test results from studies conducted during real road driving. Finally, improvements in data analysis methods were derived. A detailed data analysis allowed us to identify cases where driver intervention occurred the most, such as due to cut-ins in front of the vehicle.
2. FOT Procedure for Autonomous Vehicles
The FOT procedure is defined as establishing the data collection environment, collecting the data while driving on the road, analyzing these data, and selecting research topics [
16,
17,
18] for operation. We considered existing FOT procedures and the FOT procedure for autonomous vehicles, as shown in
Table 1.
3. FOT Scenarios for Autonomous Vehicles
FOT scenarios for autonomous vehicles were constructed based on the FOT procedure described above. In total, 38 initial scenarios were defined based on a literature review, and then 84 scenarios were defined for this study, including 46 newly identified scenarios, considering the definitions of the functions and systems of test vehicles, derivation of use cases, establishment of hypotheses and research problems, and running tests. The scenarios of the driving routes were defined, and the situations of the autonomous vehicle on the road were illustrated.
The defined scenarios can be referenced to identify various events in driving situations, and some of the improved scenarios can also be used for proving the ground-based or simulation-based assessments of autonomous vehicles.
3.1. Scenario Classification
3.1.1. Criteria of Scenario Classification
Scenario classification is necessary to produce FOT scenarios. For reasonable scenarios, the objects from the driving situations (vehicle, driver) and autonomous technology (environment, road, function, level) are selected as criteria for scenario classification. The chapters below describe each criterion.
3.1.2. Scenario Classification—Vehicle
Vehicles are the principal objects found on the road and are subject to test scenarios for autonomous vehicles. Therefore, vehicles are defined as criteria for the scenario classification. A vehicle can be categorized according to two parameters: type and maneuvers.
Table 2 shows the scenario classification according to the vehicle.
3.1.3. Scenario Classification—Driver
A driver is also one of the most important research objects in this scenario. The driver of an autonomous vehicle has a significant effect on the results of its function and movement. Therefore, the driver is defined as one of the criteria for scenario classification.
Table 3 shows the scenario classification focusing on the driver.
3.1.4. Scenario Classification—Environment
The environment is an important test object since the environment can affect a vehicle’s maneuvers. The environment is characterized by three parameters, including traffic, road, and visibility.
Table 4 shows the scenario classification according to the environment.
3.1.5. Scenario Classification—Road
Roads are an impact factor for vehicle tests. Roads affect vehicle motion through their various conditions. Roads in South Korea can be categorized into seven types: highway, urban road, interchange, construction zone, rural road, and parking area. Each road type has different conditions across two categories of infrastructure and non-infrastructure. With these two categories,
Table 5 and
Table 6 show the scenario classification focusing on the road.
3.1.6. Scenario Classification—Function
Function refers to autonomous vehicle techniques using an advanced driving-assisted system (ADAS). Functions can be defined according to an autonomous level from 1 to 5 (SAE standard). The functions have different actions or stop conditions, and the categories are separated by six conditions, such as road, distance, speed, trigger, driver location, and vehicle.
Table 7 shows the organization of these functions.
3.1.7. Scenario Classification—Level
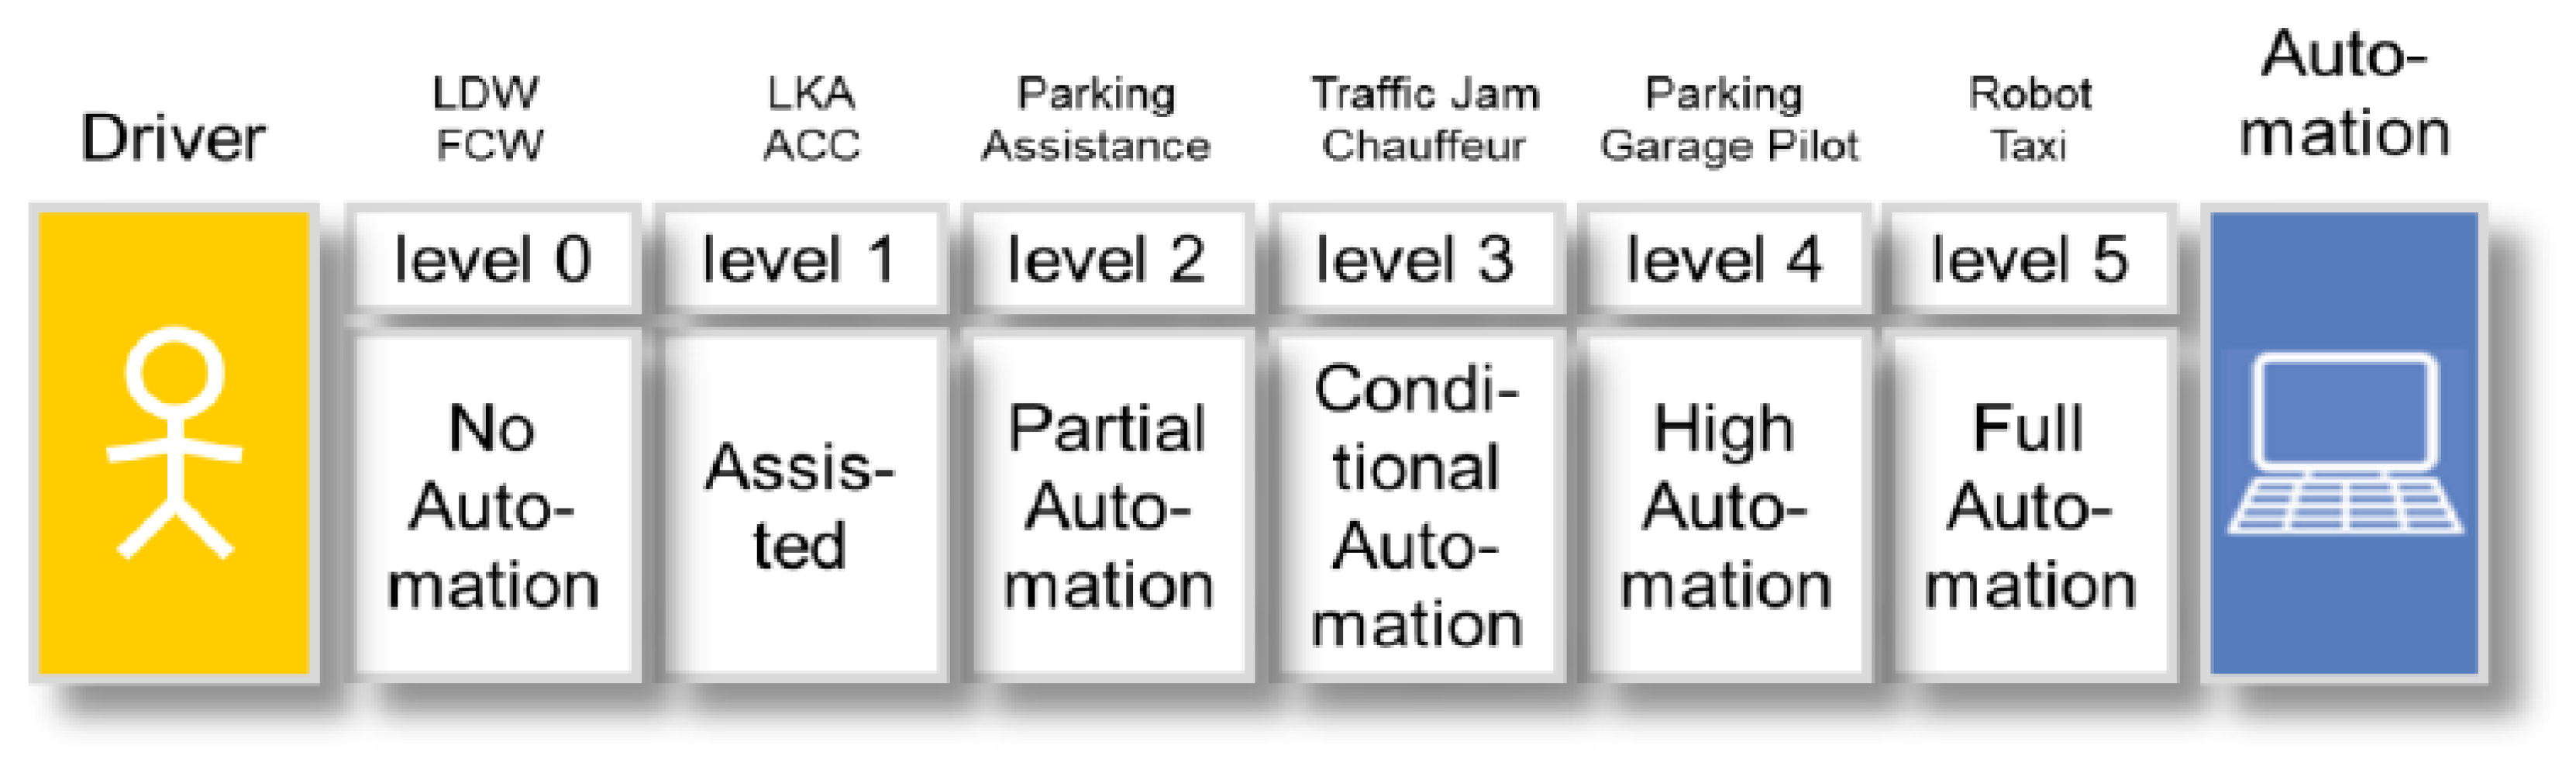
Currently, SAE J3016 is considered the standard for studying autonomous driving levels.
Figure 1 illustrates the concept of SAE autonomy levels.
The level can be separated into several categories, including level grade (1–5), speed (low, middle, high), road (parking area, rural road, etc.), and function (ACC, LKA, etc.).
Table 8 shows the organization of each level.
3.2. Scenario Selection
3.2.1. Criteria for Scenario Selection
The FOT scenarios are defined and constructed following scenario classification. Regarding safety, the road is an important condition for selecting the corresponding scenario. Therefore, three criteria were selected: straight, curve, and tunnel. The chapters below describe the three criteria in greater detail regarding the scenario selection.
3.2.2. Scenario Selection—Straight
For a straight road, there are many scenarios that take into account various situations and objects that can be detected. A total of twenty-four cases are introduced for a straight road. To organize these cases, five categories are used: keeping distance, detection, alarm, manage, and lane change. Keeping distance has one case: vehicle-to-vehicle. Detection has eleven cases: danger factor, traffic light, lane mark, slow lane mark, bus lane mark, non-stop tollgate entrance, highway entrance, shoulder lane, road bump, changeable road, and traffic sign. For alarm, there are two cases: emergency situation and unmovable situation. For manage, there is one case: harsh weather conditions (blizzard, heavy fog, etc.). For lane change, there are nine cases: front vehicle moving into object lane, front vehicle moving into a different lane, existing front vehicle in the object lane, existing front vehicle and oncoming side vehicle, rear vehicle moving into object lane, side vehicle moving into current lane, other lane vehicle moving into object lane, and traffic jam.
Table 9 organizes each of the cases for a straight road.
3.2.3. Scenario Selection—Curve
On a curved road, there are many scenarios when considering numerous situations and object detection. For a curved road situation, a lane change is not possible. Except for the lane change situation, there are a total of seven cases for a curved road. Four categories are used to organize these cases: keeping distance, detection, alarm, and manage. For keeping distance, there is one case: vehicle-to-vehicle. For detection, there are two cases: dangerous factors and lane marks. For the alarm, there are three cases: emergency stop situation, danger factor, and unmovable situation. For manage, there is one case: harsh weather conditions (blizzard, heavy fog, etc.).
Table 10 organizes each of the cases for the curved road.
3.2.4. Scenario Selection—Tunnel
For a tunnel road, there are many scenarios considering various situations and objects. Since lane change and communication are impossible on a tunnel road, there are a total of seven cases. Three categories are used to separate these cases: keeping distance, detection, and alarm. For keeping distance, there is one case: vehicle-to-vehicle. In detection, there are three cases: danger factor, lane mark, and shoulder lane. For alarm, there are three cases: emergency stop situation, danger factor, and unmovable situation.
Table 11 presents each case for a tunnel.
4. Selection of Performance Indicators (PIs)
Performance indicators are quantitative or qualitative indicators derived from one or several measures that are agreed upon beforehand, and these are expressed as a percentage, index, rate, or another value, monitored at regular or irregular intervals, and which can be compared to one or more criterion. For this study, several PIs related to vehicle safety were selected for the pilot FOT, as shown in
Table 12, including information on the distance from the preceding vehicle and the brake and steering wheel operation information, to confirm whether the driver is involved in the automatic operation.
5. Implementation of Data Acquisition Environment
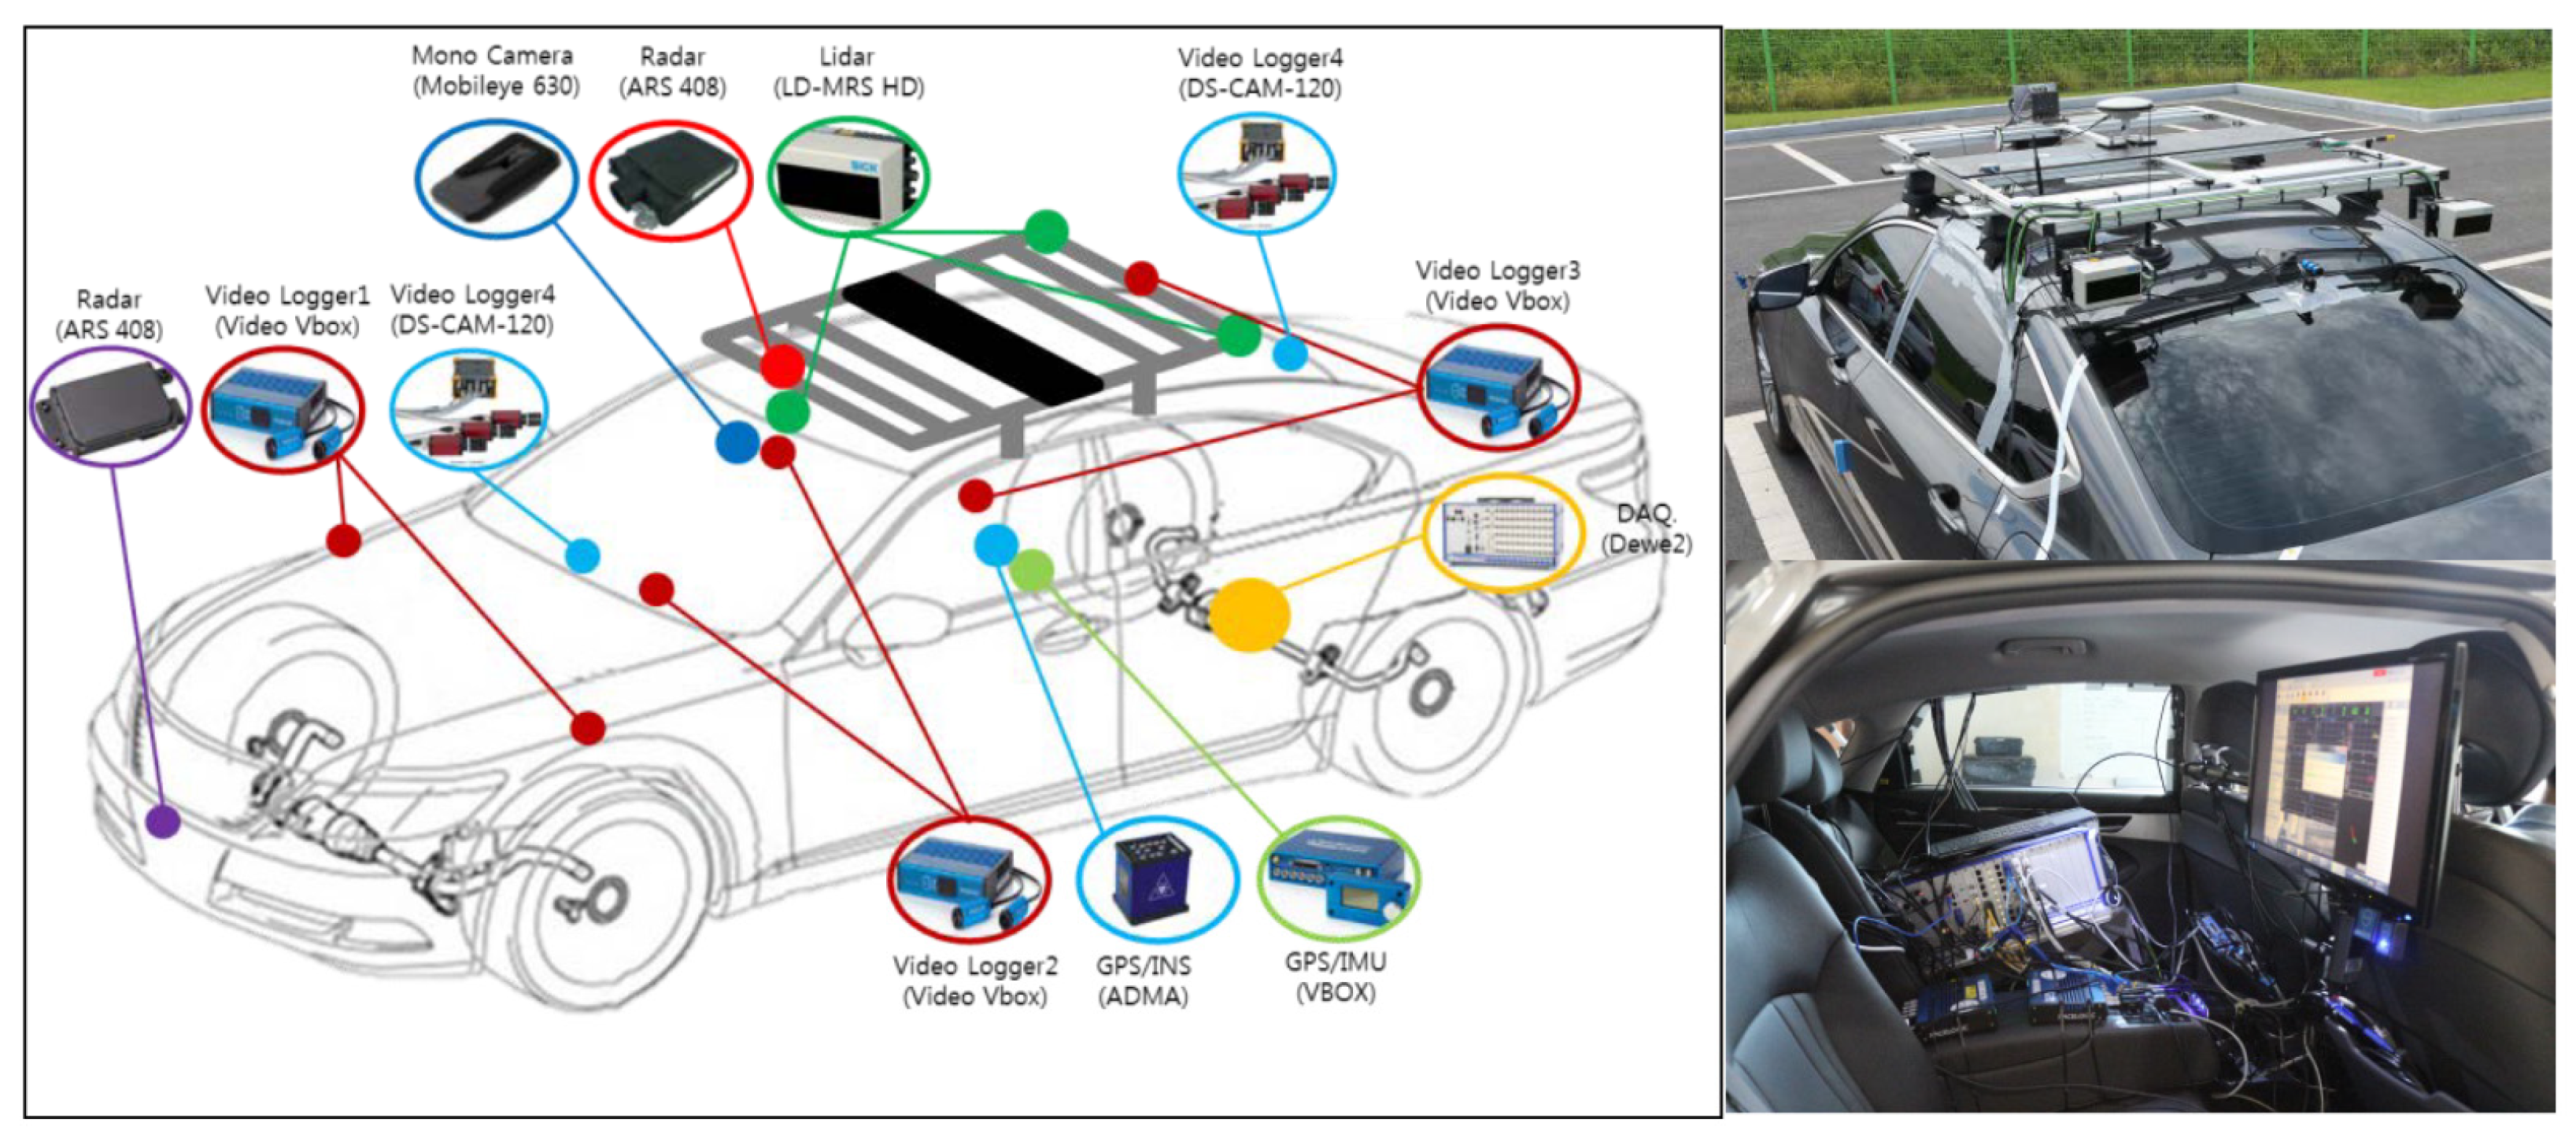
To obtain autonomous driving FOT data, a vehicle that had level 2 autonomous functions such as ACC, LKAS, and HDA (highway driving assistance) was used. Additionally, the vehicle had a license for Korea autonomous driving level 2. The functions of autonomous driving are manufactured by OEM. We implemented a data acquisition environment on the test vehicle to collect vehicle behavior information including PIs during the pilot FOT and environmental data both inside and outside the vehicle. Therefore, we applied a multi-sensor environment to the vehicle, including Mobileye, radar, laser scanner, GPS/GNSS receiver, multi-channel video cameras, and DAS (Data Acquisition System) [
19]. The sensors were only used for gathering data, not autonomous functions.
Figure 2 shows the data acquisition environment of the autonomous vehicle for FOT.
6. Selection of the Driving Routes
We selected the routes for data acquisition, which included Korea’s national highways, expressways, and city roads. In selecting these routes, we considered the area covered by the digital maps provided by the National Geographic Information Institute (NGII) of Korea. The traffic accident points of the past two years were also included in the driving routes referring to Traffic Accident Analysis System (TAAS) data in Korea. This was carried out to simulate various driving situations at points where fatal traffic accidents occurred before testing the vehicles on actual roads to predict how the autonomous driving functions would work at such points.
Figure 3 shows a sample set of the driving route-making factors and simulation results. The driving route considers the map information, simulation environment, scenario, and previous simulation results. By using Prescan, which is a tool for autonomous driving simulation, the driving route was developed and simulated. By using the result of simulating driving situations, the area of autonomous driving was created.
7. Test
7.1. Test Purpose
The main purpose of this test is to examine the entire process for data acquisition through the pilot FOT and figure out what is needed to develop autonomous driving technology. We can also automate parts of the data analysis process to prepare for a larger data collection in a full-scale FOT. It is also possible to analyze the data acquired at the pilot FOT stage to predict the outcome of a full-scale FOT at a relatively lower cost in a shorter time frame. Therefore, we prepared
Section 5 (implementation of data acquisition environment) and
Section 6 (selection of the driving routes) to test the pilot FOT.
Approximately 3000 km of driving data of domestic highways, expressways, and city roads were collected for autonomous driving modes, such as ACC, LKAS, and HDA. Among these data, 701 events were classified, and the elements classified in
Section 3 were used to analyze the classification. In the 701 events, only 32 anomalous events occurred regarding situations of misuse, such as tailgating the vehicle in front and driving in the wrong lane.
Table 13 shows the number and types of events where the driver intervened during the autonomous driving operation [
20,
21].
7.2. Identification of Events
Among the identified events, there were 32 driver interventions (brake or steering by the driver). The number of driver interventions for front-vehicle-recognition-related situations was 28, accounting for 87.5% of driver interventions. The number of steering interventions from drivers due to unstable lane keeping maneuvers was 4 and accounted for 12.5% of driver interventions.
To identify safety-related events of the pilot FOT phase, we conducted a preliminary data analysis by comparing the collected data of the DAS, including video data and scenarios. We even referred to the notes written by a passenger on a laptop computer while driving. An important criterion for identifying risk and incidents in a preliminary data analysis is whether the driver engaged the brake or steering wheel during autonomous driving.
Table 14 shows typical cases among events involving the driver during an autonomous driving operation. Cases 1 through 4 are related to the front vehicle detection performance, and cases 5 and 6 are related to the lane detection performance.
8. Result and Analysis
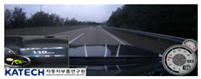
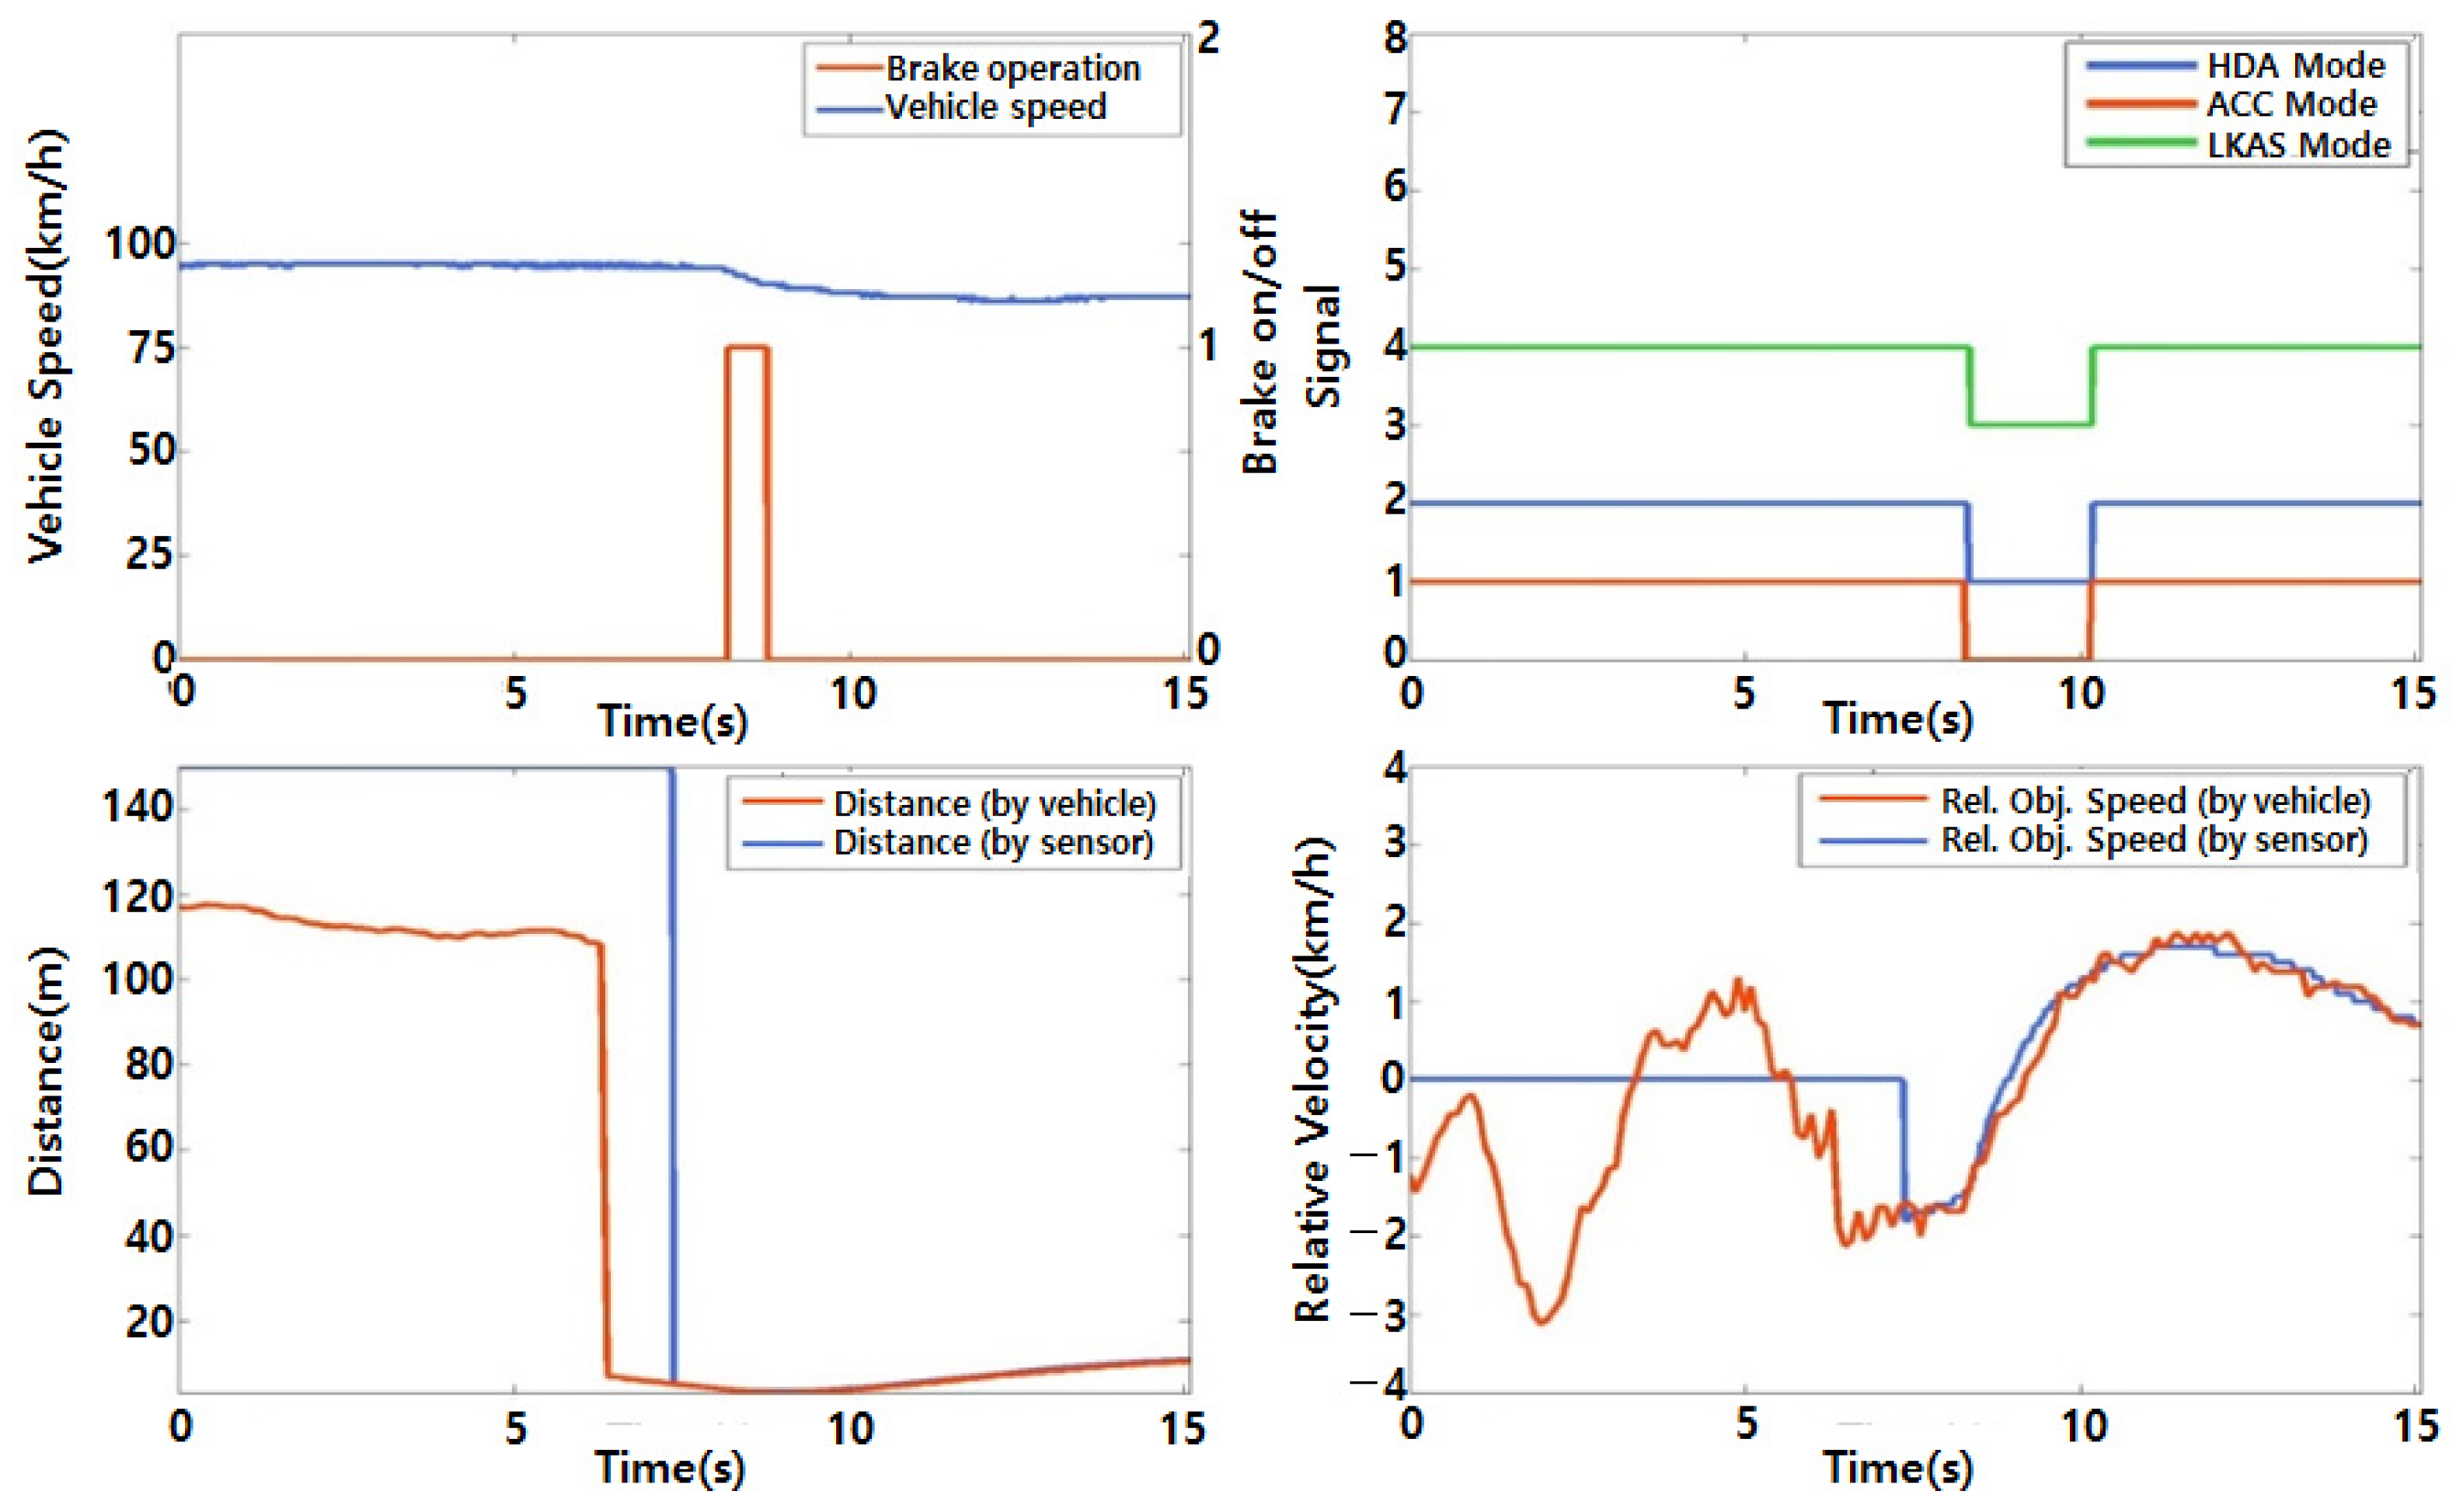
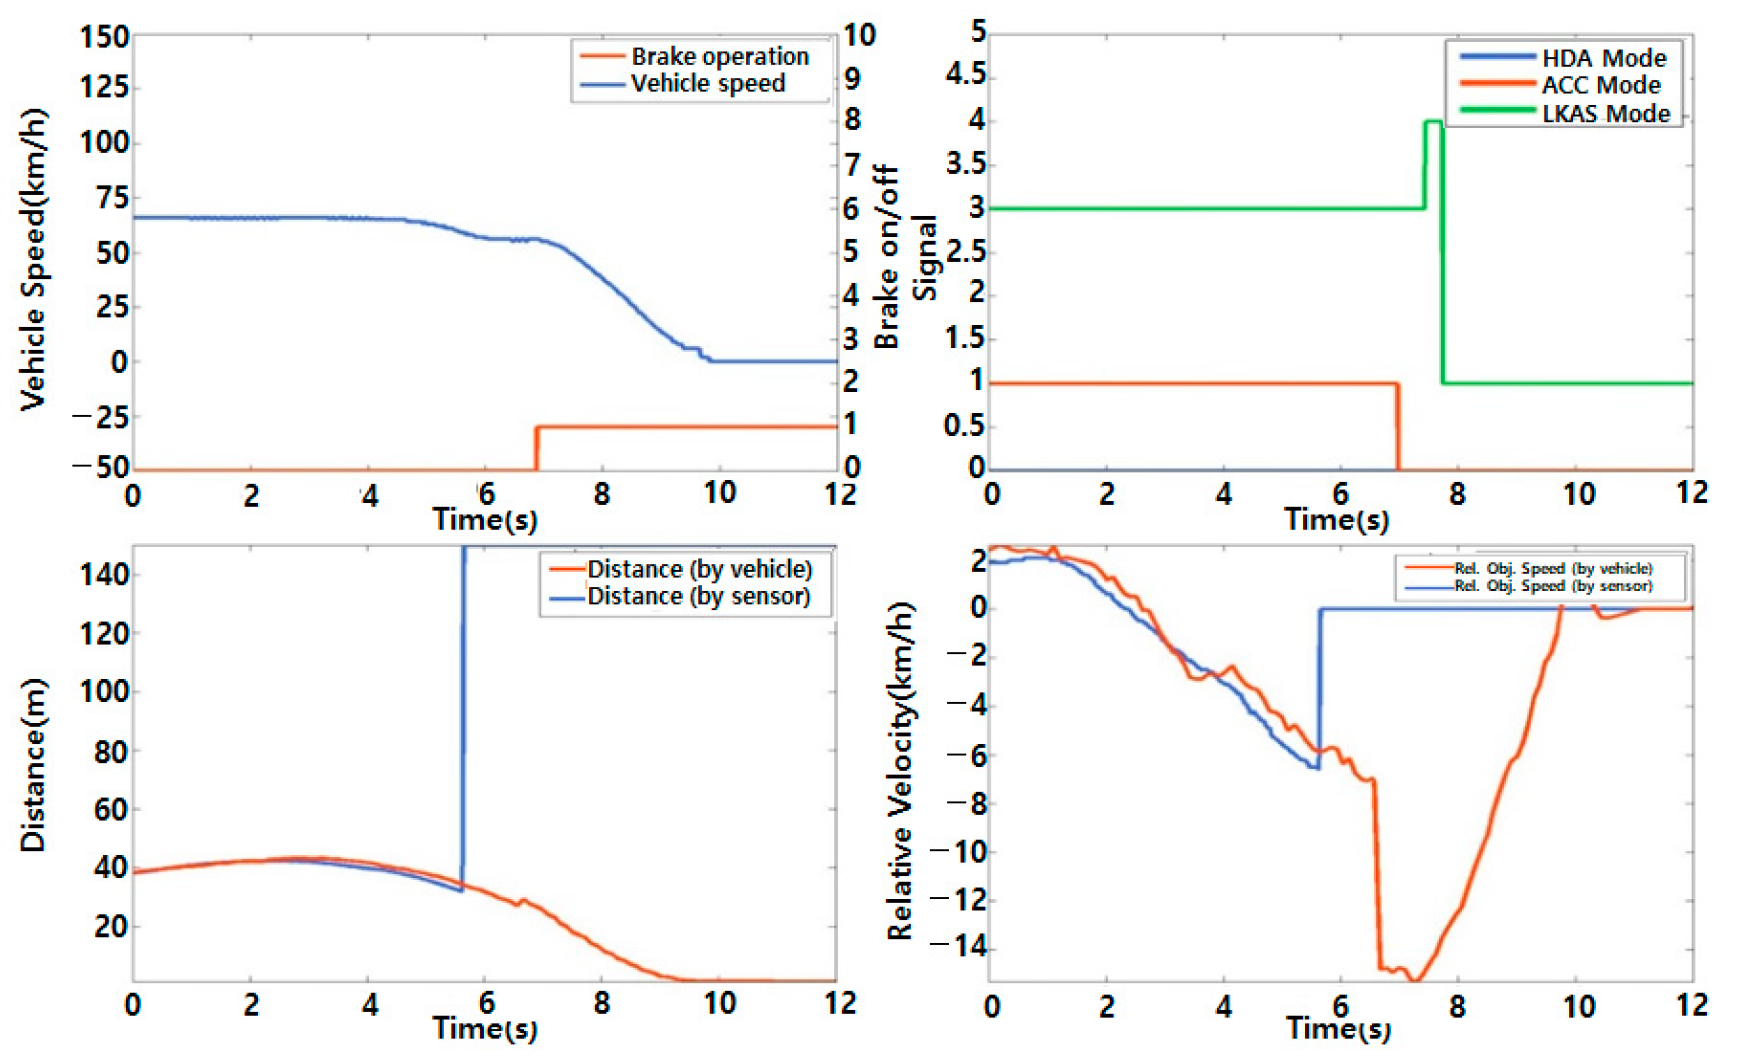
Case 1 is the delayed recognition of a front cut-in vehicle with a straight highway road, and the ego vehicle’s condition is ACC, LKAS, and HDA being on. In other words, case 1 shows that when a forward vehicle cuts in, particularly when only a part of the forward vehicle enters the lane of the test vehicle (ego vehicle), the ego vehicle is late in detecting the preceding vehicle. As shown in
Figure 4, even if the ego vehicle senses the front vehicle, the driver senses the danger first and activates the brake. In addition, the additional sensor (Mobileye) attached for this test detects the front vehicle earlier than the original radar sensor equipped by the vehicle manufacturer.
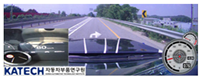
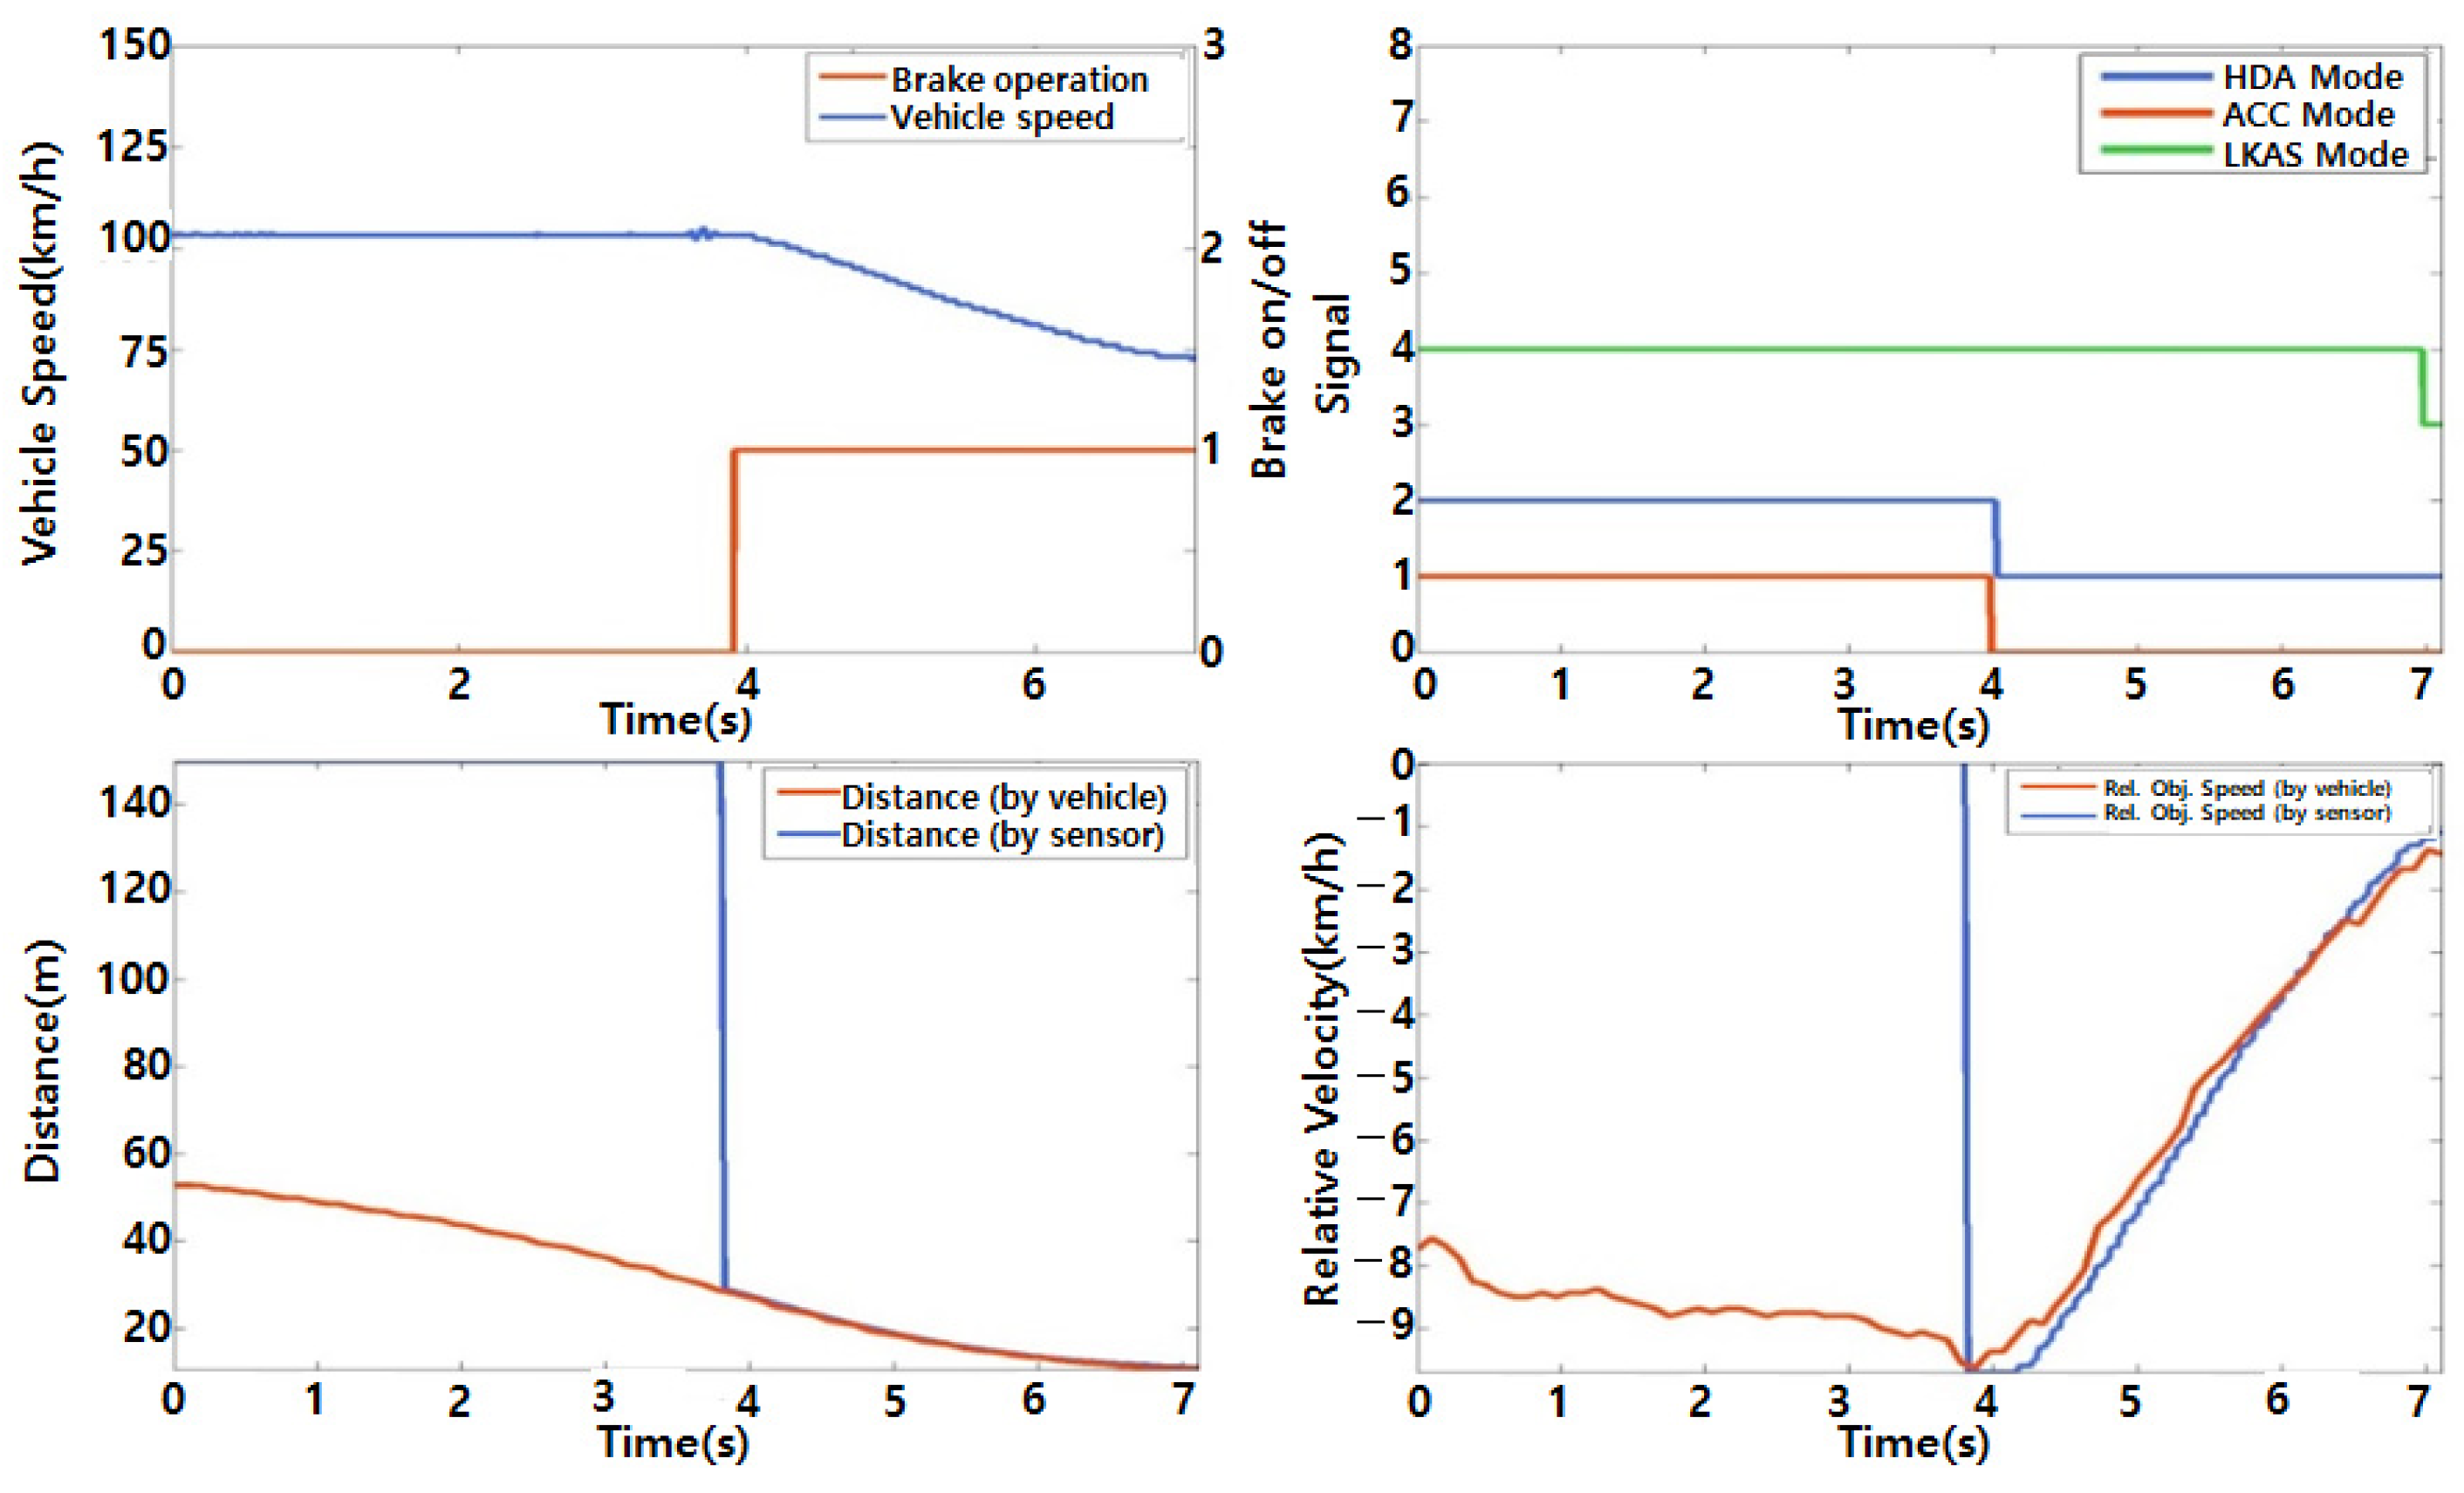
Case 2 is the delayed recognition of a front vehicle on a curved highway road, and the ego vehicle’s condition is ACC, LKAS, and HDA being on. In other words, case 2 shows that when a forward vehicle is far away in the same lane, the ego vehicle recognizes the front vehicle late. The reason for this was that the curvature of the road was very high. Therefore, it was difficult to determine if the front vehicle was in the same lane. The data of the ego vehicle’s operation and its delayed detection of the front vehicle are shown in
Figure 5.
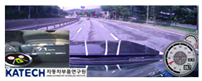
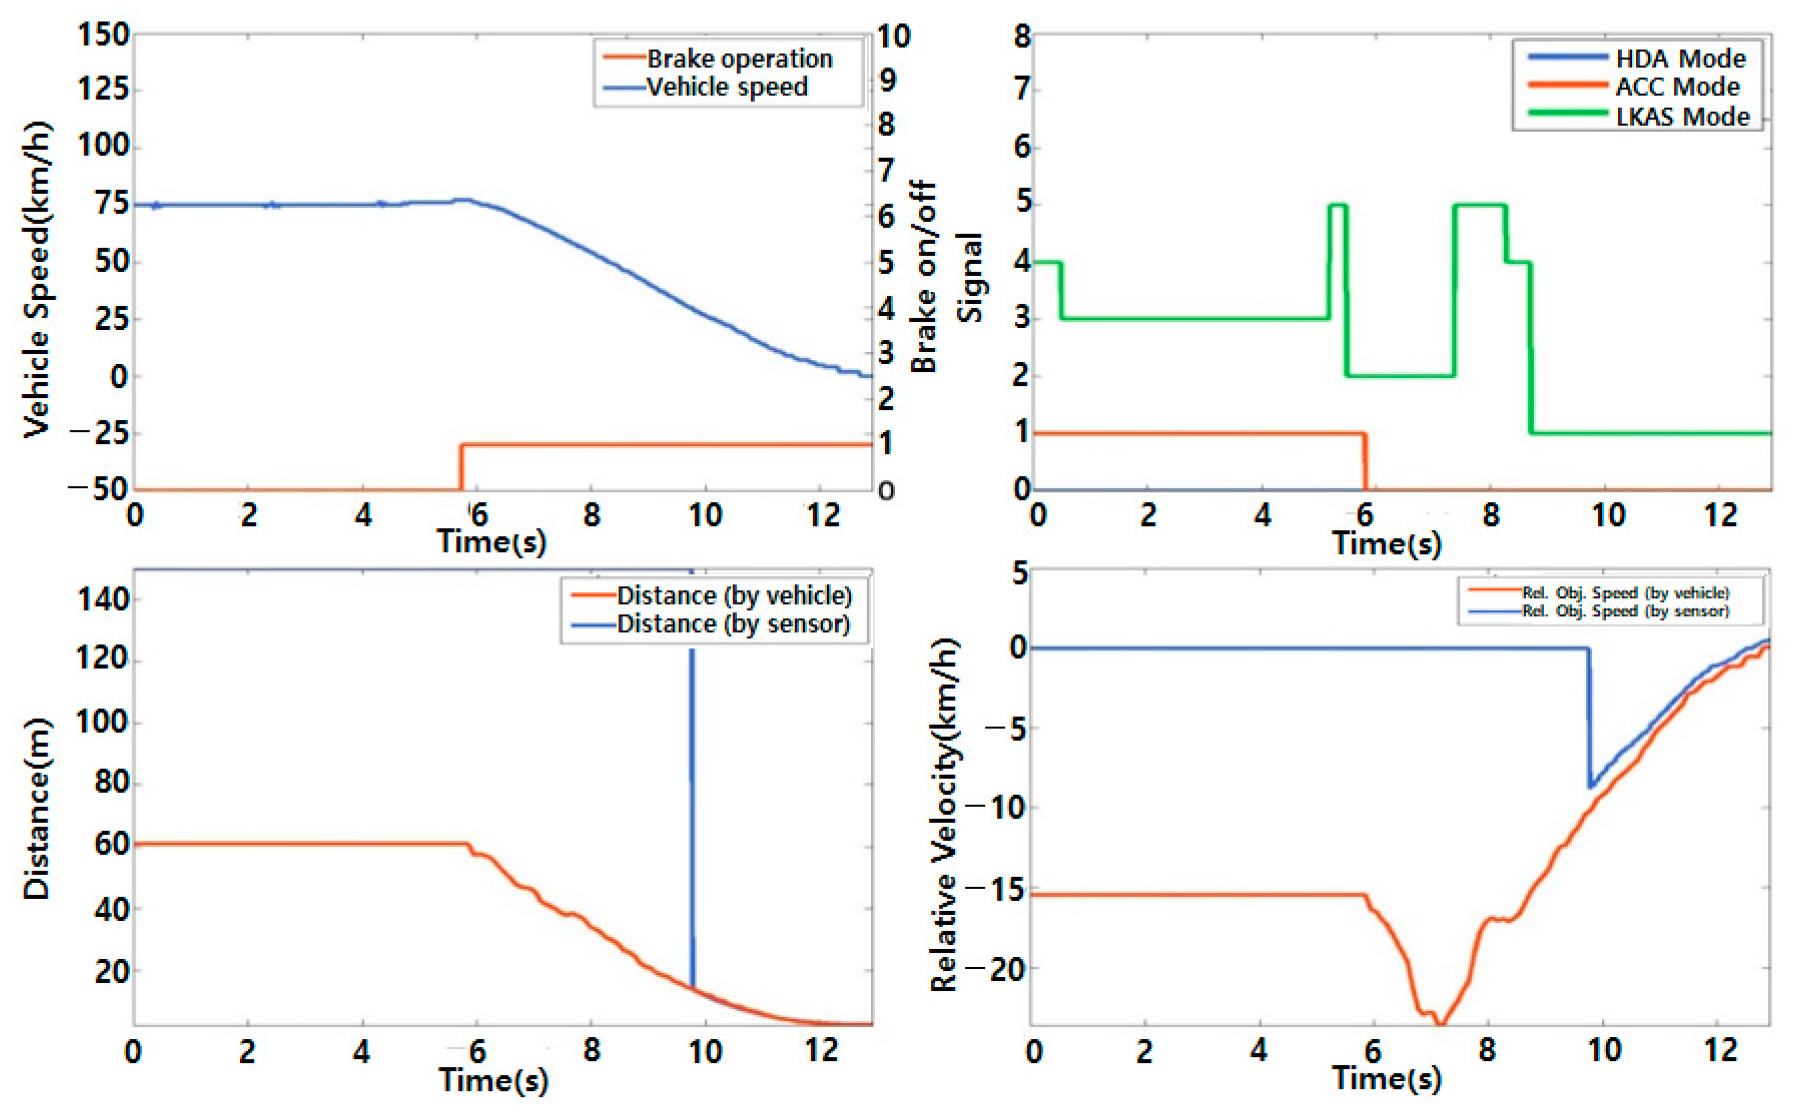
Case 3 is the delayed recognition of the forward vehicle stopping while traveling downhill after traveling on an uphill road, and the ego vehicle’s condition is ACC and LKAS being on. In other words, case 3 shows that when the ego vehicle was moving uphill or downhill on a slope with a steep gradient, the angle and range of the sensors in the ego vehicle were limited. Therefore, the front vehicle in the same lane was detected late and the driver applied the brakes to safely stop the vehicle. The data of the ego vehicle’s operation and delayed detection of the front vehicle are shown in
Figure 6.
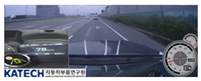
Case 4 is the failed recognition of another forward vehicle stopping after it cuts out on a curved road while traveling downhill, and the ego vehicle’s condition is ACC and LKAS being on. In other words, case 4 shows that when the ego vehicle was moving downhill along a very curved road, the front vehicle moved adjacent to the ego vehicle, in front of which was another vehicle. However, because of the driving situation (high curve and steep downhill slope), the indication performance of the ego vehicle was lower than the normal situation. Therefore, the ego vehicle could not detect another front vehicle and the driver controlled the vehicle movement. The data of the ego vehicle’s operation and inability to detect the front vehicle are shown in
Figure 7.
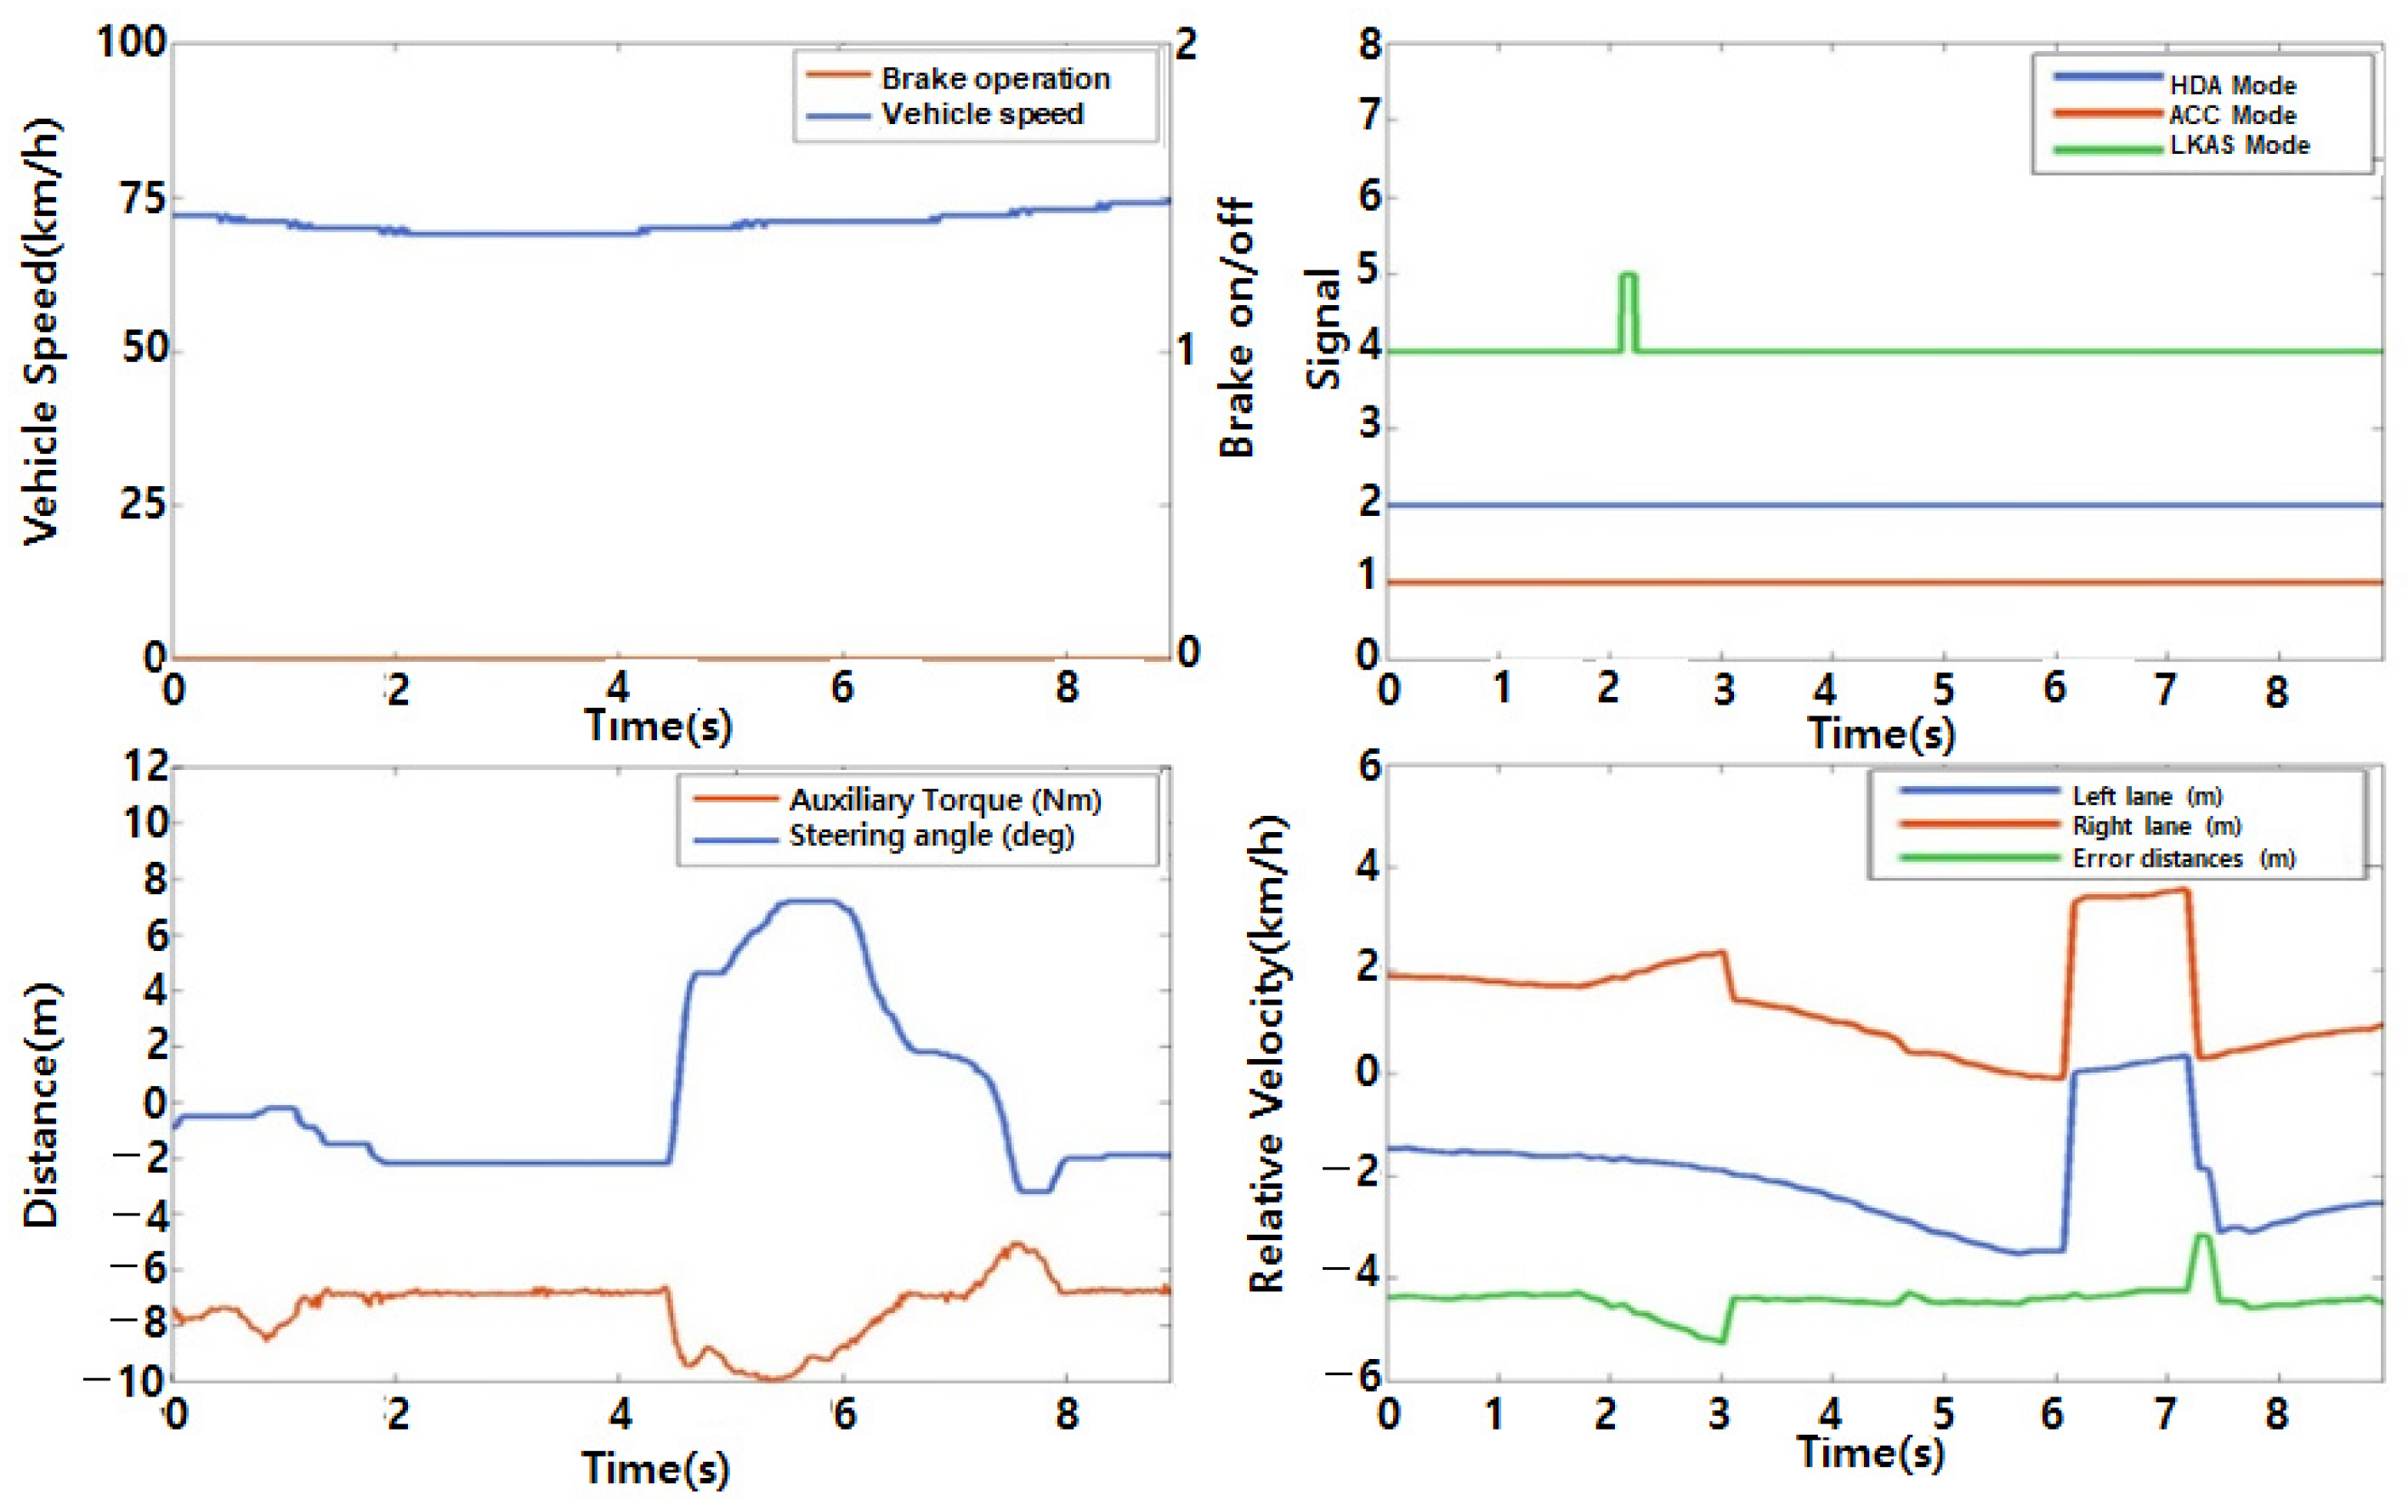
Case 5 is the lane recognition error in the branch path, and the ego vehicle’s condition is ACC, LKAS, and HDA being on. In other words, case 5 occurs when the ego vehicle is moving through a junction on the road where one branch lane is created as an alternative route, and the lane of the ego vehicle misunderstands the line of the branch lane as the driving lane. Therefore, the ego vehicle travels on the line between the two lanes. The data of the ego vehicle’s operation and its unusual movements are shown in
Figure 8.
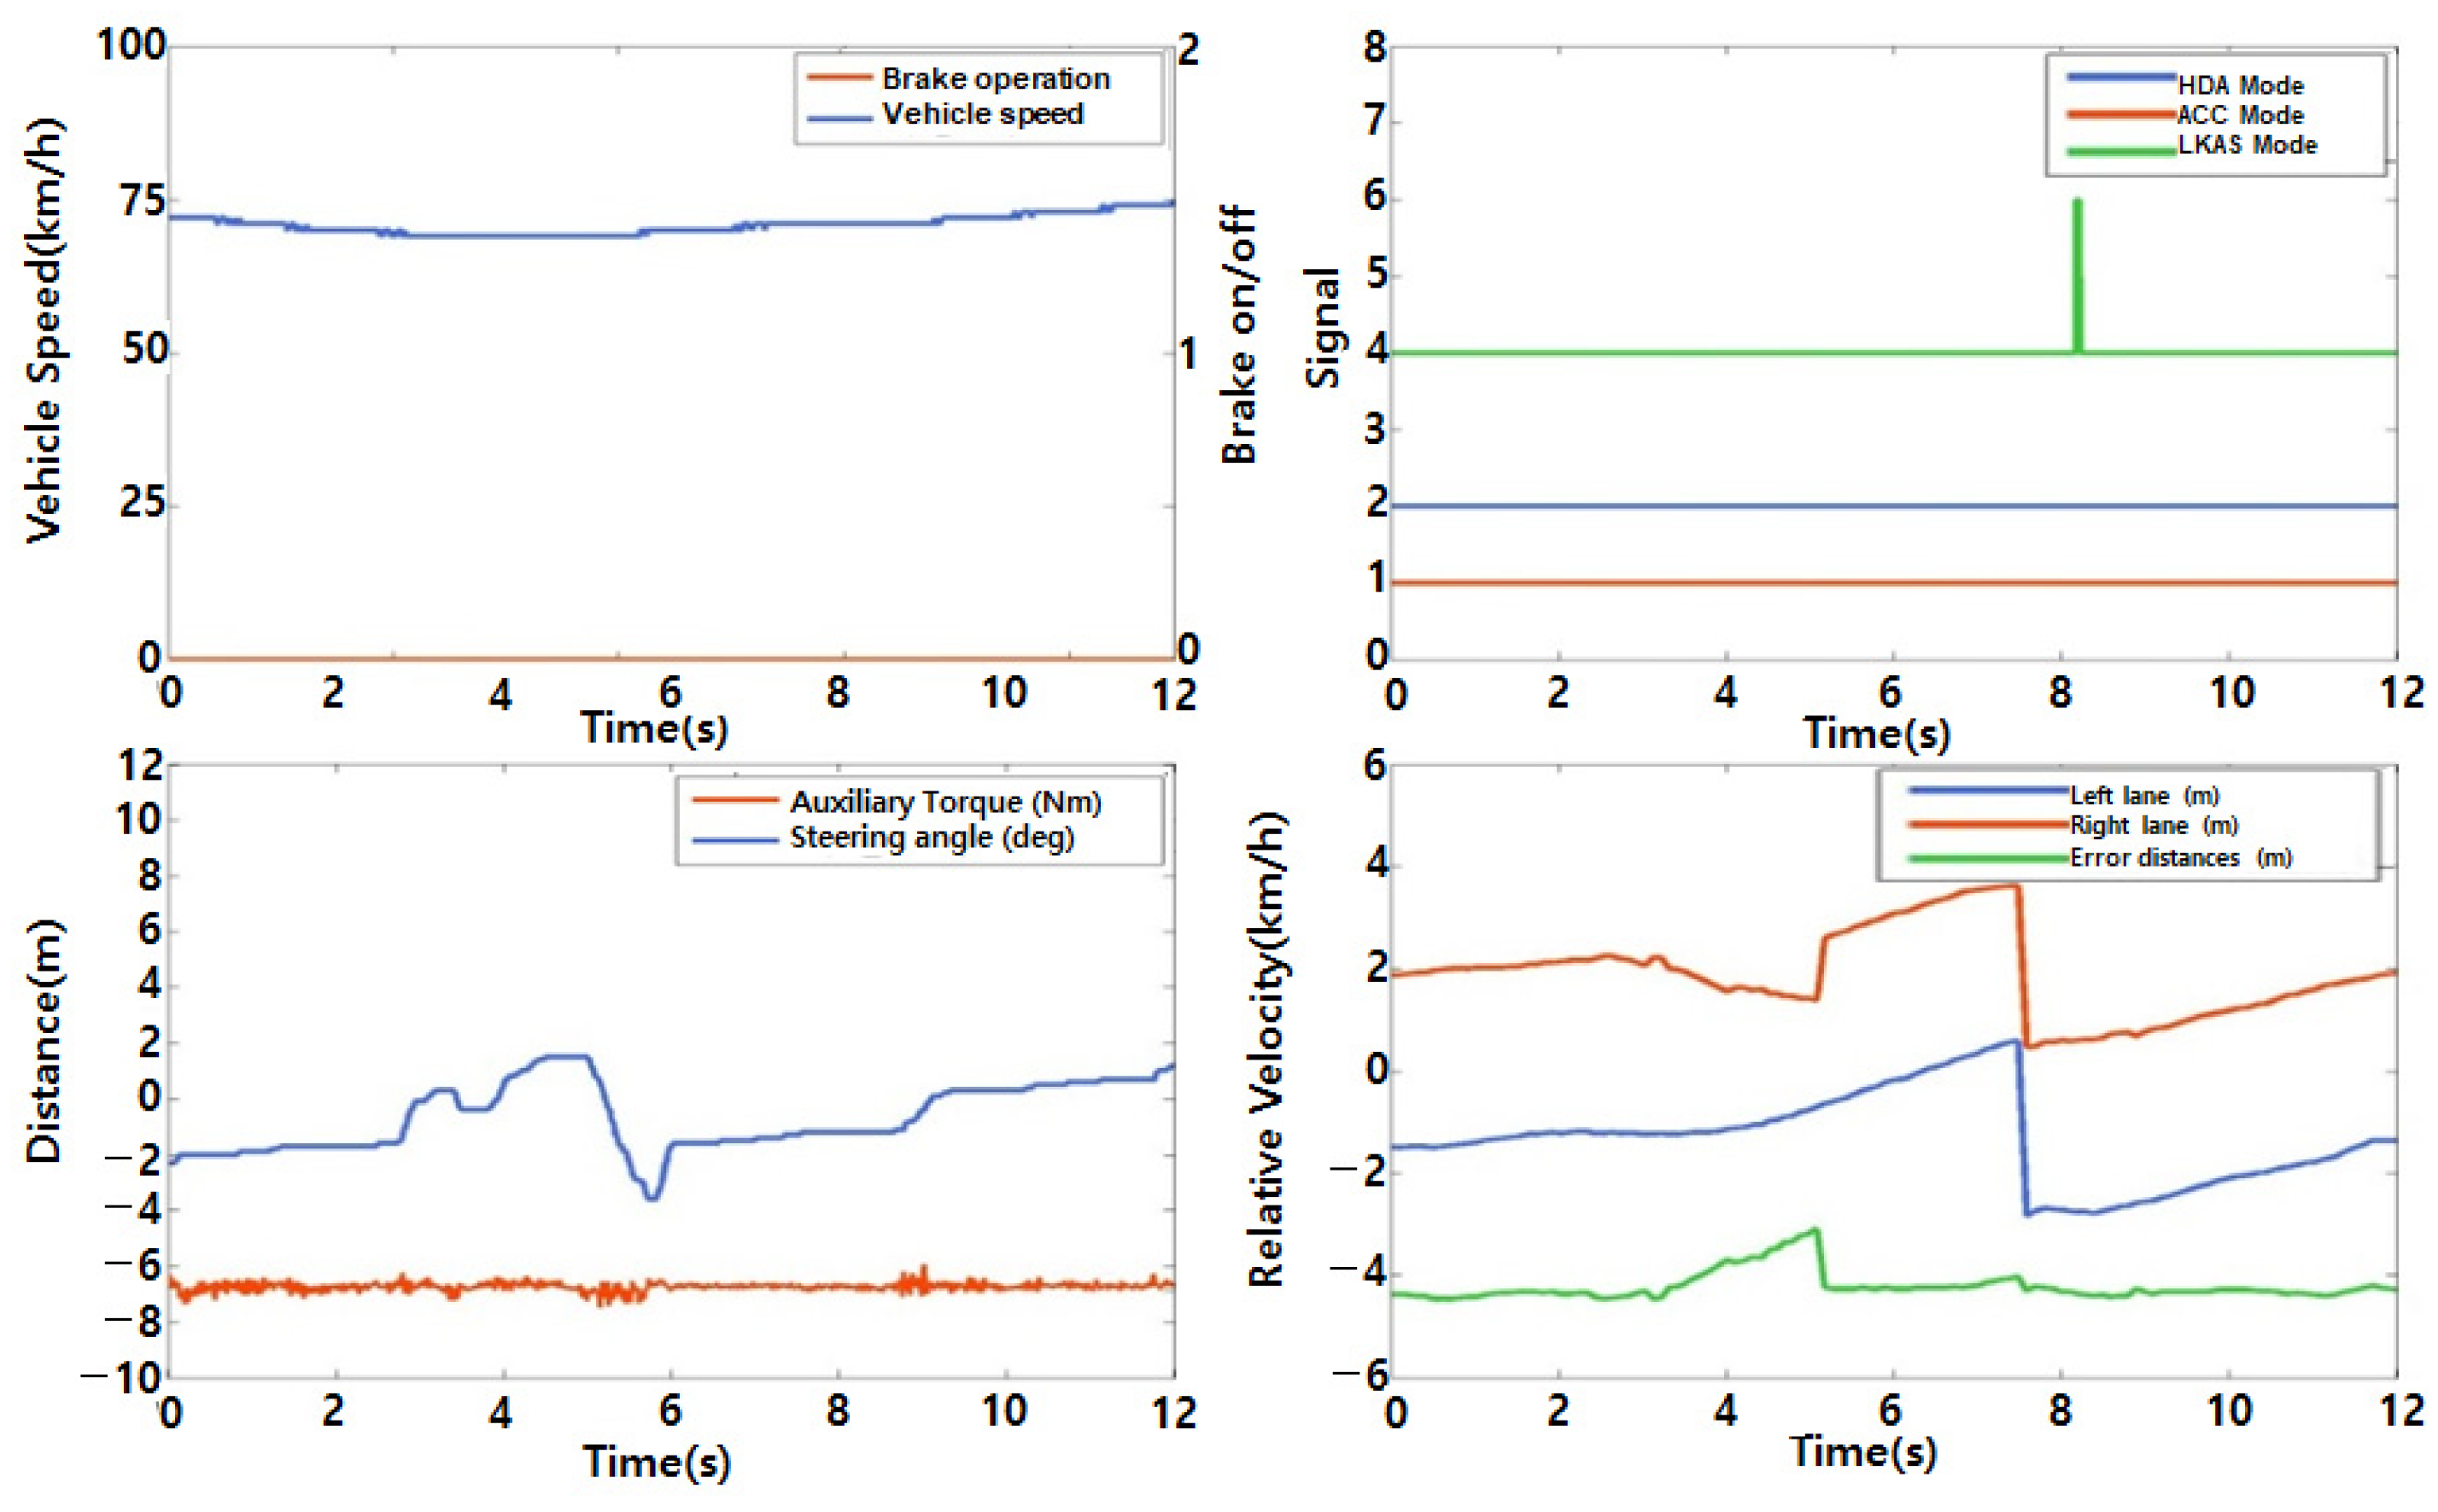
Case 6 is the lane recognition error when traveling through a construction site, and the ego vehicle’s condition is ACC, LKAS, and HDA being on. In other words, case 6 shows that when the ego vehicle is moving through a construction section of the road, the ego vehicle misunderstood the road lane because the white color of the road on the construction site is similar to the color of cement. Therefore, the ego vehicle changed lanes between the normal road and construction site road. The data of the ego vehicle’s operation and its unusual movements are shown in
Figure 9.
The results of the analysis for the events in cases 1 to 6 confirmed that the autonomous vehicle’s object and lane recognition accuracy was slower or more inaccurate than a driver’s recognition accuracy depending on the slope inclination. In order to improve the recognition accuracy, information on the driving route can be obtained in advance through V2X with the corresponding infrastructure installed on the road. Additionally, an autonomous vehicle can recognize a slope through a slope value obtained from a map that includes precise information on the slope of roads. It was deemed necessary to check the possible distance and configure the controller for the autonomous vehicle so that the autonomous vehicle could safely operate.
9. Discussion and Conclusions
With the results of event situations that occurred in the FOT of the autonomous vehicle (with autonomous level 2) to classify and define various scenario types through simulations and actual vehicle tests, the FOT procedure for autonomous vehicles is shown below:
- (1)
FOT scenarios for autonomous vehicles;
- (2)
Selection of PIs;
- (3)
Implementation of data acquisition environment;
- (4)
Selection of the driving routes;
- (5)
Test;
- (6)
Result and analysis.
From the result and analysis, autonomous functions did not operate well in some events. In this study, it is proposed that some additional parameters be added to the existing control input parameters to ensure the safe operation of autonomous vehicles.
where
y is the result of the autonomous vehicle control; x is the ordinary control parameters, such as object information (e.g., speed, velocity, classification, etc.) of sensor detection, local information from a GPS, vehicle information (e.g., speed, steering angle, etc.); is the acceleration of the z-axis, which is used to accelerate the autonomous vehicle on a slope. Map is domestic high-definition map information, including lane information, cross-road information, etc. As Map is included as a variable in the formula, it is possible to reduce the effect of malfunctions caused by vehicles in other lanes because the autonomous vehicle accurately recognizes information regarding its own lane.
By using as the control parameter, the autonomous vehicle can move more safely in case 3 (downhill after uphill situation) and 4 (curved downhill situation) events. Additionally, by using Map as the control parameter, the autonomous vehicle can detect the objects in front of it and different lanes on the roads, as demonstrated in case 2 (curved road situation), case 5 (branch road situation), and case 6 (construction section) events.
As a result of this procedure, control methods for autonomous vehicles encountering various events on a slope will be studied in the future. In addition, we plan to study the development of autonomous driving functions using V2X infrastructure information to support autonomous driving functions in dangerous and malfunctioning events.
Table 15 and
Table 16 show the V2X infrastructure list and scenario examples.
Author Contributions
Writing—original draft preparation, S.-S.S.; writing—review and editing, S.-S.S., H.-J.K. and S.-J.K.; visualization, S.-S.S.; supervision, S.-J.K.; project administration, S.-J.K.; funding acquisition, S.-J.K. All authors have read and agreed to the published version of the manuscript.
Funding
This research was funded by the Korea Institute for Advancement of Technology (KIAT) and funded by the Ministry of Trade, Industry and Energy (MOTIE) of the Korean Government (No. P0013840).
Conflicts of Interest
The authors declare no conflict of interest.
References
- Adaptive Project. Available online: https://www.adaptive-ip.eu (accessed on 28 June 2022).
- Hansson, L. Regulatory governance in emerging technologies: The case of autonomous vehicles in Sweden and Norway. Res. Transp. Econ. 2020, 83, 100967. [Google Scholar] [CrossRef]
- FESTA Handbook. Available online: http://fot-net.eu (accessed on 28 June 2022).
- EuroFOT. Available online: https://www.eurofot-ip.eu/ (accessed on 28 June 2022).
- FOTsis. Available online: https://wiki.fot-net.eu/index.php/FOTsis (accessed on 28 June 2022).
- DriveC2X. Available online: https://wiki.fot-net.eu/index.php/DRIVE_C2X (accessed on 28 June 2022).
- TeleFOT. Available online: https://wiki.fot-net.eu/index.php/TeleFOT (accessed on 28 June 2022).
- Pegasus Project. Available online: https://www.pegasusprojekt.de/en/home (accessed on 28 June 2022).
- PATH Project. Available online: https://path.berkeley.edu/ (accessed on 28 June 2022).
- U.S. Department of Transportation. Safety Pilot Model Deployment: Test Conductor Team Report; DOT HS 812 171; U.S. Department of Transportation: Washington, DC, USA, 2015.
- IVBSS. Available online: https://wiki.fot-net.eu/index.php/IVBSS (accessed on 28 June 2022).
- M-City. Available online: https://mcity.umich.edu/ (accessed on 28 June 2022).
- Woven City. Available online: https://www.woven-city.global/ (accessed on 28 June 2022).
- J3016_202104; Taxonomy and Definitions for Terms Related to Driving Automation Systems for On-Road Motor Vehicles. SAE: Warrendale, PA, USA, 2014.
- Autonomous Vehicle Collision Reports (State of California). Available online: https://www.dmv.ca.gov/portal/vehicle-industry-services/autonomous-vehicles/autonomous-vehicle-collision-reports/ (accessed on 28 June 2022).
- Yoshida, T.; Kuroda, H.; Nishigaito, T. Adaptive Driver-assistance Systems. Hitachi Rev. 2004, 53, 213. [Google Scholar]
- Kang, H.; Kwon, S. An Investigation on FOT Trends and a Suggestion of FOT Methodology for Autonomous Vehicle. In Proceedings of the KSAE Annual Conference (Spring), Daegu, Korea, 20 May 2016. [Google Scholar]
- Barnard, Y.; Innamaa, S.; Koskinen, S.; Gellerman, H.; Svanberg, E.; Chen, H. Methodology for Field Operational Tests of Autonomous Vehicles. Transp. Res. Procedia 2016, 14, 2188–2196. [Google Scholar] [CrossRef] [Green Version]
- Kang, H.; Kim, B.; Kwon, S. A Study on Methodology for Field Operational Tests of Autonomous Vehicles Applying FESTA Methodology. In Proceedings of the KSAE Annual Conference (Autumn), Daegu, Korea, 16–19 November 2016. [Google Scholar]
- Kang, H.; Shin, S.; Jang, K.; Kwon, S. A Study on Pilot FOTs for Safety Evaluation of Autonomous Vehicle. In Proceedings of the KSAE Annual Conference (Autumn), Yeosu, Korea, 9–11 February 2017. [Google Scholar]
- Shin, S.-S.; Kang, H.-J.; Kwon, S.-J.; Lee, B.-H. A Study on the FOT (Field Operational Test) Scenarios for Proving Safety of Autonomous Vehicles. In Proceedings of the JSAE Annual Congress (Spring), Yokohama, Japan, 24–26 May 2017. [Google Scholar]
Figure 1.
SAE autonomous level.
Figure 1.
SAE autonomous level.
Figure 2.
Implementation of data acquisition environment.
Figure 2.
Implementation of data acquisition environment.
Figure 3.
Selection of driving routes and simulating driving situations.
Figure 3.
Selection of driving routes and simulating driving situations.
Figure 4.
Preliminary data analysis for case 1.
Figure 4.
Preliminary data analysis for case 1.
Figure 5.
Preliminary data analysis for case 2.
Figure 5.
Preliminary data analysis for case 2.
Figure 6.
Preliminary data analysis for case 3.
Figure 6.
Preliminary data analysis for case 3.
Figure 7.
Preliminary data analysis for case 4.
Figure 7.
Preliminary data analysis for case 4.
Figure 8.
Preliminary data analysis for case 5.
Figure 8.
Preliminary data analysis for case 5.
Figure 9.
Preliminary data analysis for case 6.
Figure 9.
Preliminary data analysis for case 6.
Table 1.
Overall procedure of FOT for autonomous vehicles.
Table 1.
Overall procedure of FOT for autonomous vehicles.
| No. | Process | Description |
|---|
| 1 | Preparation | Research questions (RQ) and hypothesis establishment, activity definition, vehicle, performance indicators (PIs) selection, data acquisition plan, scenario definition, etc. |
| 2 | Baseline settings | Define baseline data, re-establish performance metric data, acquisition criteria (measurement type/scope, resolution, sampling rate…), etc. |
| 3 | Pilot FOT | Modeling, simulation analysis, data collection environment, small-scale FOT implementation and data collection, preliminary data analysis (event identification), searching for key research topics for the full-scale FOT, etc. |
| 4 | Full-scale FOT | Perform full-scale FOT, build data analysis center, collect data by multiple vehicles and drivers, build data base (DB), analyze data, etc. |
| 5 | Detailed FOT | Perform FOT for issues, re-run for completeness of data collection when necessary, etc. |
| 6 | Impact assessment | DB analysis, impact analysis (considering safety, efficiency, mobility, environment aspects), scale-up by statistical analysis, etc. |
Table 2.
Scenario classification—vehicle.
Table 2.
Scenario classification—vehicle.
| Name | Value |
|---|
| Vehicle type | Truck |
| Car |
Vehicle
maneuver
(with autonomous driving) | Collision time | Long |
| Short |
| Distance | Long |
| Short |
| Level (SAE J3016) | 0~5 |
| Velocity | High |
| Mid. |
| Low |
| Control | Strong |
| Normal |
| Weak |
| Headway time | Long |
| Mid. |
| Short |
| Trigger control | Auto |
| User accept |
| User input |
| Communication | Use |
| Unuse |
Table 3.
Scenario classification—driver.
Table 3.
Scenario classification—driver.
| Name | Value |
|---|
| Driver qualification | Non-professional |
| Professional |
| Driver location | Inner |
| Outer |
| Remote |
| Driver detection | Necessary |
| Unnecessary |
| Driver condition | Focused |
| Unfocused |
| Drowsy |
| Asleep |
| Driving possibility | No (unwell) |
| No (intoxicated) |
| No (disabled) |
| Yes |
Table 4.
Scenario classification—environment.
Table 4.
Scenario classification—environment.
| Name | Value |
|---|
| Traffic | Traffic jam | Yes |
| No |
| Participant | Non-vehicle |
| Low-speed vehicle |
| High-speed vehicle |
| Flow | Non-density |
| Low-density |
| Heavy-density |
| Road | Type | Highway |
| Urban road |
| Speed limit area |
| Parking area |
| Condition | Normal |
| Slip |
| Uneven |
| Geometry | Straight |
| Curve |
| Steep |
| Infra. | Tollgate |
| Lane |
| Guard rail |
| Emergency lane |
| Traffic sign |
| Traffic light |
| Visibility | Obstacles | Vehicle |
| Infra. |
| Weather | Fog |
| Rain |
| Snow |
Table 5.
Scenario classification—road (infrastructure).
Table 5.
Scenario classification—road (infrastructure).
| Road | Infrastructure |
|---|
| Traffic Light | Guardrail | Emergency Lane | Lane Mark |
|---|
| Highway | X | ○ | ○ | ○ |
| Urban road | ○ | X | △ | ○ |
| Interchange | X | ○ | △ | ○ |
| Intersection | ○ | X | X | ○ |
| Construction zone | △ | ○ | X | X |
| Rural road | X | X | X | △ |
| Parking area | X | X | X | X |
Table 6.
Scenario classification—road (non-infrastructure).
Table 6.
Scenario classification—road (non-infrastructure).
| Road | Non-Infrastructure |
|---|
| Speed | Curve | Pedestrians/
Obstacles | Mixed Traffic |
|---|
| Highway | High | Mid./Low | Low | ○ |
| Urban road | Mid. | Mid./Low | High | ○ |
| Interchange | High | High | Low | ○ |
| Intersection | Mid./Low | High | High | ○ |
| Construction zone | High/Mid./Low | High/Mid./Low | High | ○ |
| Rural road | Mid./Low | Mid./Low | Low | X |
| Parking area | Low | - | High | X |
Table 7.
Scenario classification—function.
Table 7.
Scenario classification—function.
| Function | Level | Road | Distance | Speed | Trigger | Driver
Location | Vehicle |
|---|
| Cruise Control | 1 | Highway,
Urban
Road | Long | High | User Input | Inner | Car, Truck |
Adaptive
Cruise
Control
(ACC) | 1 | Highway,
Urban Road | Long | High | User Input | Inner | Car, Truck |
Lane
Keeping
Assistance
(LKA) | 1 | Highway,
Urban Road | Long | High | User Input | Inner | Car, Truck |
Lane
Change
Assistance
(LCA) | 1 | Highway,
Urban Road | Short | High | User Input | Inner | Car, Truck |
Combined
ACC and
LKA | 2 | Highway,
Urban Road | Long | High | User Input | Inner | Car, Truck |
Narrowing
Assistance | 2 | Rural Road,
Parking Area | Long | Mid. | User Input | Inner | Car, Truck |
Highway
Assistance | 2 | Highway,
Urban Road | Long | High | User Input | Inner | Car, Truck |
Parking
Assistance
-Steering | 2 | Parking Area | Short | Low | User Input | Inner | Car |
Active
Traffic
Light
Assistance | 3 | Urban Road | Short | Mid. | User Input | Inner | Car, Truck |
Construction Site
Assistance | 3 | Construction Zone | Long | Mid. | User Input | Inner | Car, Truck |
Overtaking
Assistance | 3 | Highway,
Urban Road | Short | High | User Input | Inner | Car, Truck |
Traffic Jam
Assistance | 3 | Highway,
Urban Road | Long | Mid. | User Input | Inner | Car, Truck |
Parking
Assistance
-Steering and Pedal | 3 | Parking Area | Short | Low | User Input | Inner | Car |
| Platooning | 4 | Highway | Long | High | User Input | Outer | Car, Truck |
Remote
Parking | 4 | Parking Area | Short | Low | User Input | Remote | Car |
Highway
Autonomous Pilot | 4 | Highway | Long | High | User Input | Outer | Car, Truck |
Overtaking
Autonomous Pilot | 4 | Highway | Short | High | Auto | Outer | Car, Truck |
Traffic Jam
Autonomous Pilot | 4 | Highway | Long | Mid. | User Input | Outer | Car, Truck |
Autonomous
Parking | 5 | Parking Area | Long | Low | User Input | - | Car |
| Robot Taxi | 5 | Everywhere | Long | Mid. | Auto | - | Car |
Autonomous
Mining Vehicle | 5 | Everywhere | Long | Mid. | Auto | - | Truck |
Autonomous
Truck | 5 | Everywhere | Long | Low | Auto | - | Truck |
Table 8.
Scenario classification—level.
Table 8.
Scenario classification—level.
| Level | Low Speed | Mid. Speed | High Speed |
|---|
| Lv.1 | Road | - | - | Highway,
Urban Road |
| Function | - | - | ACC, LKA |
| Lv.2 | Road | Parking Area | Rural Road | Highway,
Urban Road |
| Function | Parking
Assistance
-Steering | Narrowing
Assistance | Combined
ACC and LKA,
Highway
Assistance |
| Lv.3 | Road | Parking Area | Urban Road | Highway,
Urban Road |
| Function | Parking Assistance
- Steering
and Pedal | Active Traffic
Light Assistance,
Construction Site
Assistance,
Active Traffic
Jam Driving | Active
Overtaking
Driving,
Active
Highway
Driving |
| Lv.4 | Road | Parking Area | Urban Road | Highway,
Urban Road |
| Function | Remote Parking | Traffic Jam,
Autonomous
Pilot | Overtaking
Autonomous
Pilot,
Highway
Autonomous
Pilot,
Platooning |
| Lv.5 | Road | Parking Area | Everywhere |
| Function | Autonomous
Parking | Robot Taxi,
Autonomous Mining Vehicle and Truck |
Table 9.
Scenario selection—straight.
Table 9.
Scenario selection—straight.
| Category | Case |
|---|
| Keeping distance | Vehicle-to-vehicle |
| Detection | Dangerous factor |
| Traffic light |
| Lane mark |
| Slow lane mark |
| Bus lane mark |
| Non-stop tollgate entrance |
| Highway entrance |
| Shoulder lane |
| Road bump |
| Changeable road |
| Traffic sign |
| Alarm | Emergency stop situation |
| Unmovable situation |
| Manage | Harsh weather conditions
(blizzard, heavy fog, etc.) |
The front vehicle
moving into object lane |
The front vehicle
moving into different lane |
Existing front vehicle
in object lane |
Existing front vehicle
and side vehicle |
Existing front vehicle
and oncoming side vehicle |
The rear vehicle
moving into object lane |
The side vehicle
moving into current lane |
The other lane vehicle
moving into object lane |
| Traffic jam |
Table 10.
Scenario selection—curve.
Table 10.
Scenario selection—curve.
| Category | Case |
|---|
| Keeping distance | Vehicle-to-vehicle |
| Detection | Dangerous factor |
| Lane mark |
| Alarm | Emergency stop situation |
| Dangerous factor |
| Unmovable situation |
| Manage | Harsh weather conditions
(blizzard, heavy fog, etc.) |
Table 11.
Scenario selection—tunnel.
Table 11.
Scenario selection—tunnel.
| Category | Case |
|---|
| Keeping distance | Vehicle-to-vehicle |
| Detection | Dangerous factor |
| Lane mark |
| Shoulder lane |
| Alarm | Emergency stop situation |
| Dangerous factor |
| Unmovable situation |
Table 12.
Parts of PIs for safety assessment of the pilot FOT.
Table 12.
Parts of PIs for safety assessment of the pilot FOT.
| PI | Unit | Description |
|---|
| Brake_Act | 0/1 | Brake operation by the driver |
| Steer_Ang | deg. | Steering angle |
| MDPS_Tq | Nm | MDPS torque |
| Vehicle_Spd | km/h | Vehicle speed |
| ACC_Obj_Dist | m | Front object longitudinal distance |
| ACC_Obj_Rel_Spd | km/h | Front object longitudinal relative speed |
| Obstacle_Pos_X | m | Front object longitudinal distance (Mobileye) |
| Obstacle_Rel_Vel_X | km/h | Front object longitudinal relative speed (Mobileye) |
Table 13.
Number of events—driver intervened during the autonomous driving functions operation.
Table 13.
Number of events—driver intervened during the autonomous driving functions operation.
| Event | Driver Intervention |
|---|
| Front vehicle not recognized | 23 |
| Front vehicle recognition delay | 5 |
| Unstable lane keeping | 4 |
| Total | 32 |
Table 14.
Key situations in which the driver intervened among the identified events.
Table 14.
Key situations in which the driver intervened among the identified events.
| Case | Description | Conditions | Driving Situation |
|---|
| 1 | Delayed recognition of front cut-in vehicle | ACC on,
LKAS on,
HDA on,
(straight road) | ![Machines 10 00784 i001]() |
| 2 | Delayed recognition of front vehicle | ACC on,
LKAS on,
HDA on,
(curved road) | ![Machines 10 00784 i002]() |
| 3 | Delayed recognition of forward stop vehicle | ACC on,
LKAS on,
HDA off,
(downhill after uphill) | ![Machines 10 00784 i003]() |
| 4 | Failed recognition of another forward stop vehicle after forward vehicle cut-out | ACC on,
LKAS on,
HDA off,
(curved downhill) | ![Machines 10 00784 i004]() |
| 5 | Lane recognition error in branch path | ACC on,
LKAS on,
HDA on,
(branch road) | ![Machines 10 00784 i005]() |
| 6 | Lane recognition error in construction section | ACC on,
LKAS on,
HDA on
(construction section) | ![Machines 10 00784 i006]() |
Table 15.
V2X infrastructure list.
Table 15.
V2X infrastructure list.
| No. | Name | Description |
|---|
| 1 | RSU | Road side unit |
| 2 | TSC | Traffic signal controller |
| 3 | AIDS | Automatic incident detection system |
| 4 | RWIS | Road weather information system |
| 5 | DGPS | Differential global positioning system |
| 6 | LIS | Lidar infrastructure system |
Table 16.
V2X scenario examples.
Table 16.
V2X scenario examples.
| Case | Description | Driving Situation |
|---|
| 1 | Cross road—right turn | ![Machines 10 00784 i007]() |
| 2 | Cross road—odd cyclical signal | ![Machines 10 00784 i008]() |
| Publisher’s Note: MDPI stays neutral with regard to jurisdictional claims in published maps and institutional affiliations. |
© 2022 by the authors. Licensee MDPI, Basel, Switzerland. This article is an open access article distributed under the terms and conditions of the Creative Commons Attribution (CC BY) license (https://creativecommons.org/licenses/by/4.0/).


