Abstract
In many empirical studies, researchers face challenges when addressing sensitive topics as respondents may be reluctant to provide truthful answers due to privacy concerns. Traditional direct survey methods often yield biased or unreliable estimates in such contexts. The randomized response technique offers a robust alternative by improving data validity while protecting respondent confidentiality. This paper proposes a novel quantitative three-stage randomized response model, introducing a new Horvitz–Thompson (HT)-type estimator for estimating the means of two sensitive variables under a general sampling design. Simulation studies indicate that the proposed estimator can achieve lower bias and mean squared error (MSE) compared to other existing estimators in the literature. Additionally, an empirical investigation was conducted using data from Shahid Chamran University of Ahvaz to estimate the average rates of exam cheating and cigarette consumption among students under a simple random sampling scheme, further demonstrating the practical utility of the proposed approach.
MSC:
62D05
1. Introduction
Collecting accurate and reliable data on sensitive topics such as alcohol consumption, abortion, academic dishonesty, or gambling presents a significant challenge in scientific research. In such contexts, respondents may feel uncomfortable disclosing truthful information due to fear of social judgment, legal consequences, or ethical concerns. As a result, direct questioning often leads to high rates of nonresponse, which can cause substantial underestimation or overestimation of true population parameters and ultimately compromise the validity of statistical inferences. To address this issue, the Randomized Response Technique (RRT), originally introduced by [1], offers a promising and widely accepted alternative. Unlike direct survey methods, RRT employs randomizing devices such as coins or dice to obscure individual responses while preserving aggregate-level information. By incorporating randomness into the response process, this technique effectively protects respondent privacy and reduces response bias. Consequently, RRT enables researchers to obtain more accurate and reliable estimates of sensitive characteristics while assuring participants that their identities and individual answers remain strictly confidential.
Since the inception of the RRT by [1], a substantial body of literature has developed to address the challenge of collecting accurate data on sensitive variables. The unrelated question model proposed by [2] and the forced response method developed by [3] were among the first innovations that significantly enhanced the privacy of respondents. Later developments in indirect questioning methods included innovative approaches such as the item count technique proposed by [4] and the crosswise model introduced by [5], both aiming to enhance respondent privacy and data accuracy.
Quantitative RRT models, initially introduced by [6] and subsequently refined by [7], facilitated the estimation of means and variances for sensitive numerical variables. These foundational models paved the way for later developments, including the generalizations proposed by [8,9], which extended the applicability of RRT to multi-category and continuous outcomes.
In recent decades, substantial attention has been devoted to enhancing estimator efficiency by incorporating auxiliary information and adopting stratified sampling designs. Ratio-type and regression-type estimators within RRT frameworks have been investigated by [10], and others, contributing to reductions in both bias and variance. However, most of these studies have concentrated on univariate estimation, thereby limiting their applicability in more complex analytical contexts.
Relatively few studies have attempted to integrate RRT models with classical design-based estimators such as [11] or [12], particularly in the context of multivariate estimation under general sampling designs. This highlights a significant gap in the literature, especially in light of the increasing demand for robust methodologies capable of simultaneously handling multiple sensitive variables while preserving desirable theoretical properties such as unbiasedness and design consistency.
Recent studies have focused on developing efficient estimation methods for sensitive survey variables under complex sampling designs. In the context of multivariate randomized response techniques, Narjis et al. (2022) [13] proposed a partial randomized response model for the simultaneous estimation of the means of two quantitative sensitive variables. Kumar et al. (2022) [14] introduced an improved randomized response model for the simultaneous estimation of means of two quantitative sensitive variables. Lee et al. (2025) [15] developed randomized response models for the simultaneous estimation of two sensitive variables under stratified random sampling.
In parallel, recent developments in design-based estimation have focused on Horvitz–Thompson-type estimators. Shahzad et al. (2025) [16] developed Horvitz–Thompson-type estimators under unequal probability sampling. Murtaza et al. (2025) [17] developed randomized response models using correlated scrambling variables for estimating sensitive variables under complex survey designs.
A recent trend in the literature involves the incorporation of auxiliary information and predictive variables into RRT models to enhance estimation precision. By exploiting the relationship between sensitive variables and relevant covariates, these approaches yield estimators with reduced bias and variance, thereby improving the overall reliability and efficiency of survey results. Despite these advancements, most existing studies remain primarily focused on the estimation of a single sensitive variable, limiting their usefulness in applications where multiple sensitive characteristics are of interest. Only a limited number of contributions have addressed multivariate estimation problems, particularly within classical and design-based frameworks such as the HT estimator.
Moreover, many RRT-based estimators are developed under specific and often restrictive sampling assumptions, which significantly constrains their applicability in real-world survey settings. In practice, survey designs frequently involve complex, unequal-probability, or non-standard sampling schemes that cannot be adequately handled by narrowly tailored estimators. This limitation highlights the need for flexible and general estimation approaches that are capable of accommodating a broad class of sampling designs while simultaneously ensuring privacy protection and estimation efficiency for multiple sensitive variables.
Accurate estimation of sensitive behaviors is essential in fields such as public health, behavioral sciences, and policy-making, where critical decisions frequently depend on reliable data obtained from populations that may be hesitant to disclose personal information. In these domains, biased or imprecise estimates can lead to ineffective interventions, misguided policies, and misallocation of resources. The ability to estimate the means of multiple sensitive variables simultaneously under various sampling designs can substantially enhance the precision, robustness, and practical utility of the collected data. Such comprehensive estimation not only provides a more complete understanding of complex human behaviors but also supports the development of informed strategies aimed at improving population well-being and policy effectiveness.
Nevertheless, a substantial gap remains in the existing literature regarding methodologies that support the joint estimation of multiple sensitive variables using generalized and unbiased approaches such as the HT estimator. While previous studies have made notable progress in estimating individual sensitive characteristics, few have addressed the challenges associated with multivariate estimation in complex survey designs. This limitation underscores the need for flexible, robust, and efficient estimation techniques capable of handling multiple sensitive variables simultaneously while preserving respondent confidentiality and minimizing bias. Addressing this gap forms the central motivation for the present study, which proposes a novel approach that integrates auxiliary information within a generalized HT framework to enhance estimation accuracy across a broad range of sampling designs.
Salemian et al. (2024) [18] proposed a novel quantitative three-stage randomized response technique that utilizes auxiliary information to improve the efficiency of estimators. More recently, Salemian et al. (2025) [19] further extended this line of work by developing exponential estimators within the randomized response framework. Building on these contributions, the present study proposes a generalized HT estimator capable of efficiently estimating multiple sensitive means under a broad class of sampling designs.
Although several randomized response techniques have been developed to estimate sensitive means, most existing models are either limited to a single sensitive variable or constrained by specific sampling designs. Moreover, only a few studies have explored the application of classical design-based estimators, such as the HT estimator, in the context of sensitive data, particularly for multivariate settings. The novelty of the present study lies in its integration of a novel three-stage quantitative randomized response model with a generalized HT estimator, capable of simultaneously estimating multiple sensitive means under arbitrary sampling designs. By incorporating predictive variables, this approach not only enhances estimator efficiency but also increases its flexibility and practical applicability in diverse real world survey conditions. Furthermore, the proposed method provides a theoretically sound framework that can accommodate complex survey structures, handle multivariate sensitivity, and maintain respondent confidentiality. As such, this methodology addresses significant gaps in the literature and offers researchers a robust and practical tool for analyzing sensitive quantitative information across various domains, including education, public health, and behavioral research.
To address these gaps, the present study introduces a novel three-outcome quantitative randomized response model, accompanied by a new HT type estimator designed to jointly estimate the means of two sensitive variables under any arbitrary sampling design. A key innovation of the proposed estimator lies in its construction using predictive variables, which enhances both its theoretical appeal and practical applicability. To the best of our knowledge, this represents the first attempt to extend HT estimation to a multivariate setting within the randomized response framework.
The remainder of the paper is organized as follows: Section 2 defines the symbols and notation used throughout the study. Section 3 introduces the proposed randomized response model, followed by the development of the new HT estimator and the derivation of its statistical properties. Section 4 presents and interprets the outcomes derived from the simulation experiments. Section 5 offers an empirical analysis based on real-world data. Finally, Section 6 offers concluding remarks by highlighting the main results and reflecting on their practical significance.
2. Symbols
Suppose is a finite population of size , where each unit is labeled from to . A sample is selected according to an arbitrary sampling design , with the following conditions
The first-order and second-order inclusion probabilities under the sampling design are defined as
where is the probability that unit is included in the sample, and is the probability that both units and are included in the same sample.
3. Introducing the Proposed Estimator for Two Sensitive Variables
Let denote the response to the first sensitive issue, such as cheating in academic exams, and denote the response to a second issue, like cigarette use. Let and be two independent, non-sensitive random variables with known distributions, each independent of both and . If we denote the randomized response for and by and , respectively, we have
where the constant is a fixed upper bound determined using prior information about the sensitive variable . It is chosen to exceed the maximum plausible value of , ensuring that the transformed response remains valid and consistent within the randomized response mechanism.
A nonlinear estimator for the population total of the two sensitive variables, based on a sample , is introduced using the Horvitz and Thompson estimator [10] as follows
i = 1,2, where is defined as follows
The variance of the proposed estimator is expressed as
Since and are not directly observable, we use their implicit predictors, denoted by and , which are obtained from the following expression
Equation (1) represents the general Horvitz–Thompson estimator expressed in terms of the true sensitive variable . Since direct observation of is not feasible in sensitive surveys, it is replaced by its unbiased randomized response representation , defined in Equation (2). By substituting for in Equation (1), the Horvitz–Thompson-type estimator based on randomized responses is obtained. It is worth noting that Equation (1) is expressed for the estimation of the population total. Since the parameter of interest in this study is the population mean, the resulting estimator is normalized by the population size , which explains the appearance of in the final form of the proposed estimator.
Let and represent the expectation under the sampling design and the randomization device, respectively, then we have
Therefore, one can obtain
As a result
The variance of the randomized response is given by
The variance of is as follows
where denotes the jth unit in the population.
An unbiased design-based estimator for the variance of can be derived from the general variance formula for the HT estimator applied to the predicted values , scaled by
The standard error of the estimator is obtained directly from the variance estimator:
Under the asymptotic normality of the HT estimator which holds for a broad class of sampling designs an approximate 100 design-based confidence interval for the mean of the sensitive variable is given by:
where denotes the upper critical value of the standard normal distribution (e.g., for a 95% confidence level). This interval accounts for the sampling variability induced by both the randomized response mechanism and the complex survey design.
For any arbitrary sampling design the unbiased estimators under design for and are and
An unbiased estimator of the covariance between and can be calculated as
A detailed proof of Equation (4) is presented in the Appendix A.
4. Efficiency Assessment of the Proposed Estimator
To rigorously assess the performance of the proposed estimator, a comprehensive simulation study was carefully designed and implemented. This study was divided into two distinct parts to systematically evaluate different aspects of the estimator’s behavior. In the first part, the estimator’s accuracy and efficiency were examined using two key statistical metrics: absolute bias and MSE, across a range of sample sizes from small to moderate. Absolute bias measures the average deviation of the estimator from the true population parameter, providing insight into systematic errors, while MSE combines both bias and variability, offering a comprehensive assessment of overall estimation quality. By analyzing these metrics under repeated sampling scenarios, the study ensures that the estimator’s reliability, consistency, and robustness are thoroughly evaluated under conditions that mimic real-world data collection. This detailed simulation framework allows for a clear understanding of how the proposed estimator performs relative to classical methods, highlighting its advantages in terms of precision, efficiency, and applicability across diverse sample sizes and survey settings.
In the second part of the simulation, the proposed estimator was compared with two well-established estimators in survey sampling theory: the HT estimator and the HH estimator. This comparative analysis was carried out under identical sampling conditions and performance metrics, allowing for a fair and transparent evaluation of each estimator’s strengths and limitations. This two-pronged approach provides a comprehensive understanding of the behavior of the proposed method, both in isolation and relative to existing techniques, thereby reinforcing its practical advantages in sampling applications.
4.1. Performance Evaluation of the Proposed Estimator
In this section, we assess the performance of the proposed estimator in terms of absolute bias and MSE across various sample sizes. A simulation study was conducted to compare the estimator with alternative approaches under consistent population settings. Figure 1 and Figure 2 illustrate the patterns of absolute bias and MSE, respectively, for the two proposed estimators across varying sample sizes. These figures provide a comparative analysis of the estimators’ performance in estimating the sensitive variables and , offering valuable insights into their accuracy and efficiency under different sampling conditions.
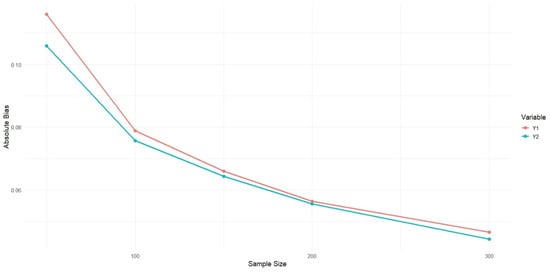
Figure 1.
Comparison of absolute bias for two estimators and vs. sample size.
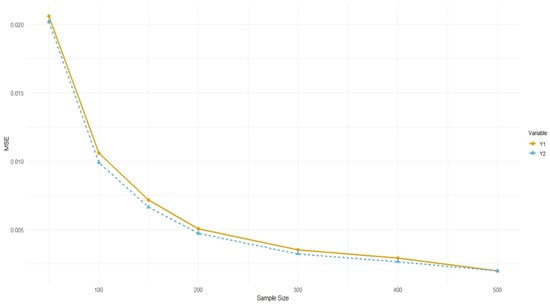
Figure 2.
Comparison of MSE for two estimators and vs. sample size.
To evaluate the performance of the proposed estimators across varying sample sizes, a simulation study was conducted. The estimators for and were assessed in terms of their absolute bias and MSE.
As shown in Figure 1, both and exhibit a decreasing trend in absolute bias and MSE as the sample size increases. This pattern indicates the consistency of the estimators; whereby larger sample sizes yield more accurate estimates. Specifically, for smaller sample sizes , the bias and MSE are relatively higher; however, these metrics decrease substantially when .
Between the two estimators, consistently outperforms across all sample sizes. Although the differences in absolute bias between and are relatively small, the MSE of is notably lower than that of , indicating greater efficiency. This suggests that the estimator may possess superior variance-reduction properties, making it more suitable for practical applications where precision is essential.
4.2. Comparative Performance Analysis of Estimators
To assess the efficiency of the proposed estimator, a comparative simulation study was conducted against the classical HT and HH estimators. The comparison focused on two key performance metrics, MSE and absolute bias, across varying sample sizes.
The results are summarized in Figure 3 and Figure 4. As illustrated, both the absolute bias and the MSE of the three estimators decrease as the sample size increases, reflecting the expected asymptotic behavior of unbiased estimators. However, the proposed estimator consistently outperforms the HT and HH estimators in terms of both criteria across all evaluated sample sizes.
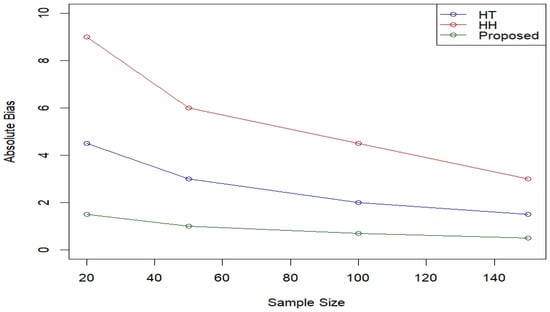
Figure 3.
Comparison of absolute bias among HT, HH, and proposed estimators.
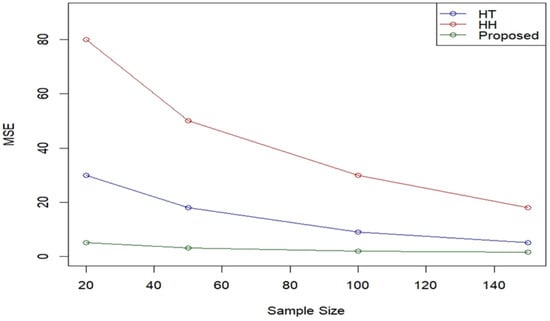
Figure 4.
Comparison of MSE among HT, HH, and proposed estimators.
The absolute bias of the proposed estimator remains considerably lower than that of the HT and HH estimators, particularly for smaller sample sizes, which is an important advantage in scenarios with limited data availability. Similarly, the MSE of the proposed estimator exhibits substantial improvement, indicating higher estimation precision.
The proposed estimator demonstrates superior accuracy and efficiency, particularly in smaller sample sizes where traditional estimators often exhibit greater variability and bias. These findings underscore the robustness and practical applicability of the proposed method in survey sampling and related statistical contexts.
5. Application of the Proposed Estimator to Real Data: A University Case Study
This section presents an application of the proposed HT estimator to real survey data collected from a university population. The structure of this section is organized to first describe the study context, followed by the input data and estimation framework, and finally the empirical results.
5.1. Case Study Description
In academic communities, the physical and mental well-being of students is essential for ensuring their future success both academically and socially. However, in recent years, two significant and concerning issues have emerged among students: academic dishonesty and daily cigarette consumption. These phenomena have a considerable impact on the quality of the educational process, students’ physical and mental health, and even their social interactions and ethical standards. Academic dishonesty not only undermines the integrity of educational assessments but also erodes students’ personal development, fostering habits that may persist into professional life. Similarly, regular cigarette consumption poses severe health risks, including respiratory and cardiovascular problems, and can negatively affect cognitive functions, concentration, and overall academic performance. Addressing these issues requires a comprehensive understanding of their underlying causes, ranging from social pressures and stress to gaps in ethical education and awareness about health consequences. By systematically investigating and quantifying these sensitive behaviors, educational institutions can implement targeted interventions that promote healthier lifestyles and uphold academic integrity. Such interventions may include awareness campaigns, counseling services, and the development of policies that encourage ethical behavior and discourage harmful habits.
Academic dishonesty, including cheating during exams, not only undermines students’ confidence and abilities but also fosters a culture of mistrust and deviation from ethical principles within academic settings. Such practices weaken the credibility of educational evaluation systems and compromise the fairness of academic assessments. Although often perceived as a shortcut to achieving higher grades, this behavior ultimately leads to a decline in critical thinking skills, reduced academic competence, and a loss of self-confidence among students. Moreover, habitual engagement in dishonest academic practices may normalize unethical behavior, increasing the likelihood that such conduct extends beyond academic environments into professional and social contexts. As a result, addressing academic dishonesty is not merely an institutional concern but also a crucial step toward nurturing responsible, competent, and ethically aware individuals.
On the other hand, daily cigarette consumption, as a harmful and dangerous habit, directly leads to serious health issues such as cardiovascular diseases, respiratory disorders, and various types of cancer. These physical consequences not only threaten students’ long-term health but may also reduce their energy levels and overall well-being, thereby impairing their academic engagement. In addition to its physical effects, smoking adversely influences students’ mental health by contributing to increased levels of anxiety, stress, and attention-related problems. Such psychological impacts can negatively affect concentration, learning capacity, and academic performance. This issue, which is alarmingly prevalent in university settings environments intended to foster personal growth, intellectual development, and healthy lifestyles can significantly diminish the overall quality of students’ academic and social lives. Consequently, understanding and accurately measuring the extent of daily cigarette consumption among students is essential for designing effective preventive strategies and health-oriented interventions within academic institutions.
Thus, addressing these two issues and gaining a deeper understanding of their underlying causes and consequences is essential. Reliable statistical analysis of such sensitive behaviors requires methodologies that can protect respondents’ privacy while ensuring accurate estimation. In this study, we employ a novel quantitative three-stage randomized response method along with an innovative HT estimator that incorporates predictor variables without requiring prior knowledge of sensitive responses. This approach allows for improved estimation efficiency while maintaining confidentiality, which is particularly crucial when dealing with sensitive characteristics such as academic dishonesty and daily cigarette consumption. The aim of this study is not only to enhance our understanding of the prevalence and influencing factors of these phenomena but also to provide a robust statistical framework that can support evidence-based strategies and informed decision-making to mitigate their adverse impacts within academic environments.
5.2. Input Data and Randomized Response Variables
Due to the sensitive nature of the variables under study, direct observations of the true responses are not available. Instead, data were collected using a quantitative randomized response questionnaire, which produces two observable randomized response variables denoted by and .
The variable corresponds to the randomized response associated with cheating incidents during examinations, while represents the randomized response related to daily cigarette consumption. These randomized variables constitute the primary input data and are subsequently transformed into unbiased quantities incorporated into the proposed Horvitz–Thompson estimation framework under the stratified sampling design.
5.3. Notation and Formulation of the Proposed Estimators
To enhance the clarity of the analysis, Table 1 and Table 2 presents the notations and corresponding formulas related to the new HT estimators for each stratum. These notations will be employed in the subsequent analysis and are essential for a clearer understanding of the results.

Table 1.
Formulas of the proposed estimators at stratum and population.
Table 2.
Summary of notations and descriptions for stratum-level estimators.
5.4. Empirical Results and Descriptive Statistics
Before presenting the stratum-level estimates, basic descriptive statistics of the randomized response variables and are reported in Table 3 to provide additional insight into the observed data. The point estimates for each faculty (stratum) are then summarized in Table 4, followed by their corresponding 95% design-based confidence intervals in Table 5.
Table 3.
Descriptive statistics of the randomized response variables.
Table 4.
Results of the proposed estimator for sensitive variables by faculty.
Table 5.
95% confidence intervals for the estimated means of sensitive variables by faculty and overall university.
Using the proposed estimator, the mean number of cheating instances during exams students at Shahid Chamran University of Ahvaz was estimated to be 2.9813, while the mean number of cigarettes smoked per day was estimated as 2.5763. These estimates are derived from survey data collected during the first semester of the 2018–2019 academic year. It is assumed that the number of cheating instances falls within the range of 0 to 9, and the daily number of cigarettes smoked ranges from 0 to 20. These findings underscore the practical utility and effectiveness of the proposed method in estimating sensitive quantitative behaviors under a stratified sampling framework, particularly in contexts where direct questioning may compromise data reliability.
In addition, design-based 95% confidence intervals were constructed for both sensitive variables. The 95% confidence interval for the mean number of cheating instances during examinations is (2.2088, 3.7540), while the corresponding 95% confidence interval for the mean number of cigarettes smoked per day is (0.9830, 4.1697). These interval estimates provide further insight into the uncertainty associated with the point estimates and demonstrate the practical feasibility of inference based on the proposed estimator.
The selected randomized response parameters in this application were chosen to balance respondent privacy and estimation efficiency, illustrating how the theoretical properties of the proposed estimator translate into practical survey implementation.
6. Discussion and Conclusions
This study introduced a new variant of the HT estimator designed to improve the estimation of sensitive quantitative variables under stratified sampling. Through extensive simulation studies, the proposed estimator exhibited favorable performance in terms of absolute bias and mean squared error (MSE), consistently outperforming classical estimators such as the HT and HH methods, particularly for small to moderate sample sizes. In addition to the simulation analysis, the estimator was applied to real survey data from Shahid Chamran University of Ahvaz, focusing on two sensitive behaviors: cheating during exams and cigarette consumption among students. The proposed estimator yielded an estimated mean of 2.9813 cheating instances per student and 2.5763 cigarettes consumed per student. Furthermore, the 95% confidence interval for the mean number of cheating instances was calculated as (2.2088, 3.7540), while the 95% confidence interval for the mean number of cigarettes consumed per day was (0.9830, 4.1697). These findings highlight the practical applicability and effectiveness of the proposed approach in real-world contexts involving privacy-sensitive topics, where conventional direct questioning may lead to biased or unreliable results. Overall, the proposed estimator provides a robust and efficient tool for researchers working with sensitive quantitative variables, preserving respondent confidentiality while enhancing the accuracy of population-level estimates.
Beyond its theoretical formulation, the empirical application demonstrates how the proposed HT estimator translates into practice under real survey conditions. The stratified sampling design adopted in the university case study aligns naturally with the design-based properties of the estimator, ensuring unbiasedness while efficiently exploiting known inclusion probabilities. The consistency between simulation outcomes and real data estimates confirms that the theoretical gains in bias and mean squared error are preserved when applied to sensitive behavioral data. This illustrates the practical relevance of the proposed framework for surveys where direct observation of sensitive quantitative variables is infeasible.
An important practical aspect of randomized response-based estimators is their sensitivity to the randomization parameters and , which control the balance between respondent privacy and estimation efficiency. Larger values of and enhance privacy protection by increasing randomization, but may also lead to higher variance. Conversely, smaller values improve efficiency at the cost of reduced confidentiality. The empirical results indicate that the proposed estimator remains stable across reasonable choices of these parameters, suggesting robustness in practical applications. This trade-off highlights the flexibility of the proposed framework, allowing practitioners to select parameter values that best match ethical considerations and precision requirements.
From a practical perspective, the proposed HT estimator is particularly efficient under probability sampling designs with unequal inclusion probabilities, such as stratified sampling and other complex survey designs. The estimator is especially advantageous in situations where auxiliary or predictive variables are available and the population exhibits heterogeneity across strata. In contrast, when simple random sampling with homogeneous populations is employed and privacy concerns are minimal, classical estimators may already provide satisfactory performance. Therefore, the proposed method is most suitable for surveys involving sensitive quantitative variables, complex sampling structures, and the need to balance estimation efficiency with respondent confidentiality.
From a conceptual perspective, the proposed approach differs from several modern methods developed for sensitive data analysis. Many recent studies rely on model-based or Bayesian frameworks, machine learning techniques, or likelihood-based inference, which often require strong distributional assumptions and may be sensitive to model misspecification. In contrast, the proposed method is fully design-based and preserves the unbiasedness property of HT estimators under general sampling designs. Compared to alternative randomized response models that focus on a single sensitive variable or specific sampling schemes, the present approach offers greater flexibility for simultaneous estimation of multiple sensitive variables while maintaining respondent privacy. This conceptual distinction highlights the complementary role of the proposed estimator within the broader landscape of modern methods for sensitive survey data.
Author Contributions
Conceptualization, H.S.; Methodology, H.S. and E.M.; Software, H.S. and O.A.A.; Investigation, H.S.; Resources, H.S. and O.A.A.; Data curation, H.S.; Writing—original draft, H.S., E.M. and O.A.A.; Writing—review & editing, E.M. and O.A.A.; Supervision, E.M.; Project administration, H.S. and E.M. All authors have read and agreed to the published version of the manuscript.
Funding
This research received no external funding.
Data Availability Statement
Due to ethical and privacy considerations involving student participants, the data supporting the findings of this study are not publicly available. The data may be obtained from the corresponding author upon reasonable request.
Conflicts of Interest
The authors declare no conflict of interest.
Appendix A
Proof of Equation (4)
To derive Equation (4), we proceed as follows:
According to Equation (3), one can obtain
Hence, the expression for the unbiased estimator in Equation (4) is established.
References
- Warner, S.L. Randomized response: A survey technique for eliminating evasive answer bias. J. Am. Stat. Assoc. 1965, 60, 63–69. [Google Scholar] [CrossRef] [PubMed]
- Greenberg, B.G.; Abul-Ela, A.L.; Simmons, W.R.; Horvitz, D.G. The unrelated question randomized response model: Theoretical framework. J. Am. Stat. Assoc. 1969, 64, 520–539. [Google Scholar] [CrossRef]
- Boruch, R.F. Assuring confidentiality of responses in social research: A note on strategies. Am. Sociol. 1971, 6, 308–311. [Google Scholar]
- Droitcour, J.; Caspar, R.A.; Hubbard, M.L.; Parsley, T.L.; Visscher, W.; Ezzati, T.M. The item count technique as a method of indirect questioning: A review of its development and a case study application. In Measurement Errors in Surveys; John Wiley & Sons: Hoboken, NJ, USA, 1991; pp. 185–210. [Google Scholar]
- Yu, J.W.; Tian, G.L.; Tang, M.L. Two new models for survey sampling with sensitive characteristic: Design and analysis. Metrika 2008, 67, 251–263. [Google Scholar] [CrossRef]
- Eichhorn, B.H.; Hayre, L.S. Scrambled randomized response methods for obtaining sensitive quantitative data. J. Stat. Plan. Inference 1983, 7, 307–316. [Google Scholar] [CrossRef]
- Mangat, N.S. An improved randomized response strategy. J. R. Stat. Soc. Ser. B Methodol. 1994, 56, 93–95. [Google Scholar] [CrossRef]
- Christofides, T.C. A generalized randomized response model. Metrika 2005, 61, 285–292. [Google Scholar]
- Chaudhuri, A.; Christofides, T.C. Indirect Questioning in Sample Surveys; Springer: Berlin/Heidelberg, Germany, 2013. [Google Scholar]
- Gupta, S.; Kalucha, G.; Shabbir, J. A regression estimator for finite population mean of a sensitive variable using an optional randomized response model. Commun. Stat. Simul. Comput. 2017, 46, 2393–2405. [Google Scholar] [CrossRef]
- Horvitz, D.G.; Thompson, D.J. A generalization of sampling without replacement from a finite universe. J. Am. Stat. Assoc. 1952, 47, 663–685. [Google Scholar] [CrossRef]
- Hansen, M.H.; Hurwitz, W.N. The problem of non-response in sample surveys. J. Am. Stat. Assoc. 1946, 41, 517–529. [Google Scholar] [CrossRef] [PubMed]
- Narjis, G.; Shabbir, J.; Onyango, R. Partial randomized response model for simultaneous estimation of means of two sensitive variables. Math. Probl. Eng. 2022, 2022, 6083646. [Google Scholar] [CrossRef]
- Kumar, A.; Vishwakarma, G.K.; Singh, G.N. An improved randomized response model for simultaneous estimation of means of two quantitative sensitive variables. Commun. Stat.—Simul. Comput. 2022, 51, 5967–5987. [Google Scholar] [CrossRef]
- Lee, G.S.; Hong, K.H.; Kim, S.H.; Son, C.K. Estimation for two sensitive variables using randomized response model under stratified random sampling. Mathematics 2025, 13, 297. [Google Scholar] [CrossRef]
- Shahzad, U.; Zhu, H.; Albalawi, O.; Arslan, M. Neutrosophic developments in Horvitz–Thompson type estimators. Math. Popul. Stud. 2025, 1, 69–82. [Google Scholar] [CrossRef]
- Murtaza, M.; Singh, S.; Hussain, Z. Complex survey design for estimation of total of sensitive variable using correlated scrambling variables. Commun. Stat.—Simul. Comput. 2025, 1, 1–10. [Google Scholar] [CrossRef]
- Salemian, H.; Mahmoudi, E.; Alamri, O.A.; Shabbir, J. Improving a novel quantitative randomized response method using auxiliary variable information. Heliyon 2024, 10, e40367. [Google Scholar] [CrossRef] [PubMed]
- Salemian, H.; Mahmoudi, E.; Shabbir, J. Novel randomized response method for mean estimation using exponential estimators. Commun. Stat. Theory Methods, 2025; accepted. [Google Scholar] [CrossRef]


Disclaimer/Publisher’s Note: The statements, opinions and data contained in all publications are solely those of the individual author(s) and contributor(s) and not of MDPI and/or the editor(s). MDPI and/or the editor(s) disclaim responsibility for any injury to people or property resulting from any ideas, methods, instructions or products referred to in the content. |
© 2026 by the authors. Licensee MDPI, Basel, Switzerland. This article is an open access article distributed under the terms and conditions of the Creative Commons Attribution (CC BY) license.