Abstract
Until 2021, experimental data on polysulfide groups in feldspathoids were limited to the properties of the S3•− chromophore center and the S2•− luminescence center in sodalite-group minerals. Interpretation of some spectroscopic data on other S-bearing groups in feldspathoids remained ambiguous because of significant differences between calculated data for isolated polysulfide species and experimental data for polysulfide groups in liquid sulfur, solutions, and matrix-isolated species published in different literature sources. For this reason, configurations of stable and metastable structures and parameters of the absorption spectra in the ultraviolet, visible, and near-infrared (UV-Vis-NIR) region and in the ESR and Raman spectra of various structure modifications of polysulfide Sn2− anions, Sn•− radical anions, and Sn neutral molecules (n = 2–6) as well as HS− in the sodalite cage of sapozhnikovite have been calculated in frames of the density functional theory using the VASP and ORCA software packages. Taking into account the obtained results of theoretical calculations, spectroscopic properties of extra-framework polysulfide groups in natural tectosilicates belonging to the cancrinite and sodalite groups are discussed. The obtained results made it possible to confirm and partially clarify the interpretation of the experimental spectroscopic data for S-containing feldspathoids obtained by the authors of this work over the past five years.
1. Introduction
Since 1975, the configurations, enthalpies, and spectroscopic properties of polysulfide molecules, anions, and radical anions have been calculated in numerous works, and these data have been summarized in several reviews (see [,,,,,,,,,] and references therein). Most experimental data on polysulfide groups published between 1975 and 2020 pertain to isolated species, solutions, liquid sulfur, and species isolated in an amorphous matrix. Similar calculations have not been performed for polysulfide groups in feldspathoid structures and their synthetic analogs, with the exception of the work [], which calculated the energetic and spectroscopic characteristics of tetrasulfur chromophore groups in sodalite-type structures including those of ultramarine pigments.
Until 2021, experimental data on polysulfide groups in feldspathoids were limited to the properties of the S3•− chromophore center and the S2•− luminescence center in sodalite-group minerals. A comparison of the results of this study with the literature data published before 2021 is provided below in Section 4.
During the last five years, a multimethodic approach based on infrared (IR), Raman, and photoluminescence spectroscopy; electron spin resonance (ESR); absorption spectroscopy in the near-infrared, visible, and ultraviolet (NIR-Vis-UV) regions; photoelectron spectroscopy (XPS); single-crystal and powder X-ray diffraction as well as electron microprobe and wet chemical analyses was applied by us to the study of the nature and mutual conversions of S-bearing extra-framework species in feldspathoids belonging to the sodalite and cancrinite groups as well as some related minerals. The results of these studies are published in numerous papers ([,,,,,,,,,,,,,,,] and references therein).
These studies demonstrated a wide diversity of S-bearing species, including different extra-framework S-bearing anions (SO42−, SO32−, S2−, S52−, HS−), radical anions (S2•−, S3•−, cis- and trans-S4•−, SO4•−), and neutral molecules (COS, H2S, cis- and trans-S4, S6) in tecto-aluminosilicate minerals and related synthetic compounds. In particular, sodalite-group minerals with species-defining HS− anions [], S4 [], and S6 [] have been described based on spectroscopic single-crystal X-ray structural data, and their thermal and radiation-induced conversions have been studied [,,,,,]. The experimental data were compared by us with the results of X-ray structural analysis (in cases in which it was possible) and with the literature data on ab initio calculations, mainly carried out for isolated polysulfide groups. However, the interpretation of some spectroscopic data on S-bearing groups in feldspathoids remained ambiguous because of significant differences between calculated and experimental data from different literature sources. In particular, it remained unclear to what extent the cationic environment influences the configuration and spectroscopic characteristics of polysulfide groups. For this reason, quantum-chemical calculations of the configurations, enthalpies, and spectroscopic characteristics of different polysulfide species, including those detected earlier in feldspathoids, were carried out. This is the subject of the present work.
2. Computational Details
Absorption spectra in the ultraviolet, visible, and near-infrared (UV-Vis-NIR) region and in the ESR and Raman spectra of various structure modifications of polysulfide Sn2− anions, Sn•− radical anions, and Sn neutral molecules (n = 2–6) as well as HS− in the sodalite cage of sapozhnikovite were calculated.
The calculations were performed in two stages. In the first stage, geometry optimization with periodic boundary conditions was performed using DFT, the PBEsol exchange-correlation functional [], and the VASP software package, version 5.4.1 (VASP Software GmbH, Berggasse 21/14 A-1090, Vienna, Austria, https://www.vasp.at/info/about/, accessed on 13 November 2025) []. Atomic positions were optimized with a stopping criterion of 0.001 eV/Å for forces. Lattice vectors were fixed at experimental values. In the second stage, the properties of the studied complexes were calculated using the embedded cluster method. The def2-TZVP basis sets, B3LYP functional [], and the ORCA software package, version 6.0.0 (FACCTs GmbH, Max-Planck-Institut für Kohlenforschung, Kaiser-Wilhelm-Platz 1, 45470 Mülheim a. d. Ruhr, Germany, https://www.faccts.de/#about, accessed on 13 November 2025) [] were used. NIR-Vis-UV spectra were calculated using TD-DFT approach, while Raman spectra were calculated using the central-differences method.
The simulation structures were based on the 48-atom ideal unit cell of the sodalite-group mineral sapozhnikovite, Na8(Al6Si6O24)(HS)2 [], using the following substitutions. To simulate Sn•− radical anions (n = 2, 3, 4, 5, and 6), the substitution HS− ⟶ Sn•− was performed. In other cases, substitutions in cation sites were applied in accordance with the charge balance requirement. To simulate Sn2−, in addition to replacing HS− with a polysulfide anion, one of the Na+ ions nearest to Sn2− was replaced with a Ca2+ ion. To simulate Sn neutral molecules, a vacancy was created at one of the nearest sites of Na+ ions.
The quantum cluster used to calculate the ESR characteristics and the vibrational and electronic (NIR-Vis-UV) absorption spectra of HS− or polysulfide group were composed of the HS− or polysulfide group itself, as well as the nearest (within a distance of 4 Å) Na+ and Ca2+ cations. The remaining cations and anions within a radius of up to 11 Å were modeled by point charges with effective core potentials (ECPs). The ECP region was surrounded by a region of point charges describing the crystal field and containing approximately 60,000 charges.
The ESR spectrum was measured on raw grains at room temperature with a RE-1306 X-band spectrometer (KBST, Smolensk, Russia) with a frequency of 9.3841 GHz.
3. Results
This article presents the results of calculations for configurations of polysulfide groups corresponding to their absolute energy minima (stable forms) and other local energy minima exceeding the energies of stable forms by no more than 1 eV (metastable forms), since the presence of higher-energy forms in the mineral-forming environment at the crystallization temperatures of feldspathoids (i.e., no more than 1100 K) is unlikely.
In this study, the atomic positions in the cells were optimized with a stopping criterion of 0.001 eV/Å, which is sufficiently accurate for calculating vibrational frequencies. The inaccuracy of the obtained spectroscopic data mainly stems from the choice of the calculation method. In our case, the transition from a periodic calculation to an embedded cluster and the change in the functional from PBEsol to B3LYP introduces some errors in the forces. These errors will be particularly pronounced for the boundary of the embedded cluster, since in this case the same bond outside and inside the cluster should be described by different methods, which would lead to the emergence of parasitic forces. To avoid this effect, we moved the cluster boundary away from the polysulfide group and from the cations closest to it.
Optimized configurations of polysulfide anions, radical anions, and molecules are shown in Figure 1, Figure 2 and Figure 3. Sizes (maximal distance between S atoms, dmax) and energetic parameters of these species are given in Table 1.
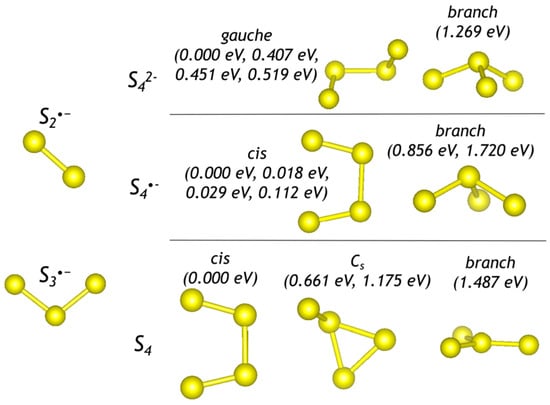
Figure 1.
Optimized configurations of di-, tri-, and tetrasulfide groups. For each configuration of a tetrasulfide group, relative energies with respect to the most stable form are given.
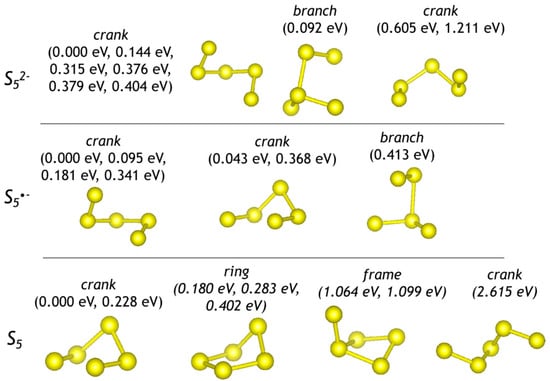
Figure 2.
Optimized configurations of pentasulfide groups (crank means crankshaft conformation). For each configuration, relative energies with respect to the most stable form are given.
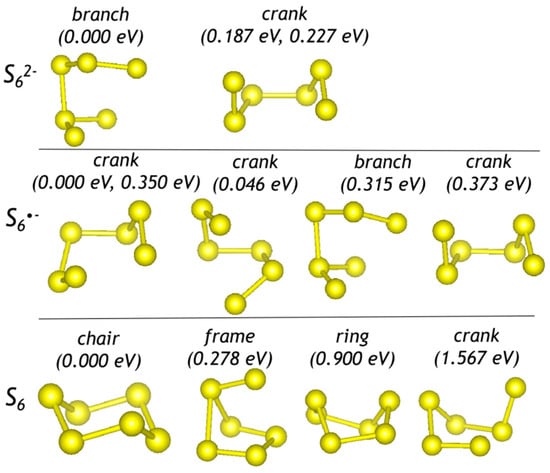
Figure 3.
Optimized configurations of hexasulfide groups. For each configuration, relative energies with respect to the most stable form are given.

Table 1.
Sizes and energetic parameters for calculated polysulfide anions, radical anions, and molecules: dmax is maximal distance between sulfur atoms; ΔE is relative full energy with respect to the most stable configuration.
Stable and metastable conformers of the non-cyclic and unbranched S4•− radical anion have internal rotation angles within 6°. Therefore, they are considered below as distorted cis-conformers. The trans-conformer S4•− in the sodalite cage of sapozhnikovite is unstable.
The refined H–S distance in the HS− anion is equal to 1.36 Å. Thus, introduction of larger species into the sodalite cage is sterically hindered. The refined S–S distance in S22−, S2*−, and S20 is equal to 2.12, 2.01, and 1.93 Å, respectively. Bond length and bond angles in trisulfide species are 2.06 ×2 Å and 103.5° for S32−; 1.97 Å, 2.00 Å, and 110.9° for S3*−; 1.89 Å, 1.99 Å, and 119.5° for S3. It is to be noted that the chair-like S6 molecule is the largest polysulfide species among those occurring in the sodalite cage []. Therefore occurrence of polysulfide groups with dmax > 4 Å in the sodalite cage is unlikely.
Calculated parameters of the ESR spectra of polysulfide radical anions are presented in Table 2. Figure 4, Figure 5, Figure 6 and Figure 7 show UV-Vis-NIR absorption spectra of polysulfide groups. Parameters of Raman and UV-Vis-NIR absorption spectra of HS− and polysulfide groups with the most stable structures are given in Table 3. For Raman data of other polysulfide groups, see Figure 8, Figure 9, Figure 10 and Figure 11 and Tables S1–S4 in Supplementary Data.
Table 2.
Calculated g factors for the ESR spectra of polysulfide radical anions.
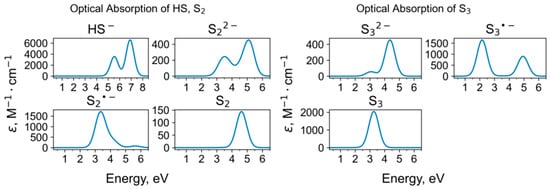
Figure 4.
Calculated UV-Vis-NIR absorption spectra of HS and di- and trisulfide groups.
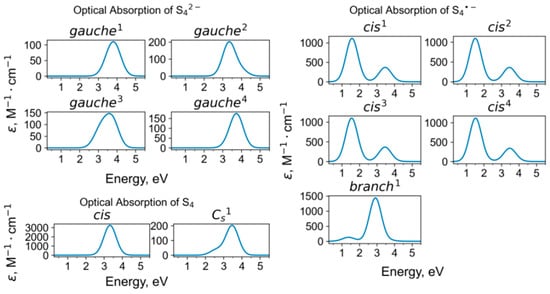
Figure 5.
Calculated UV-Vis-NIR absorption spectra of tetrasulfide groups.
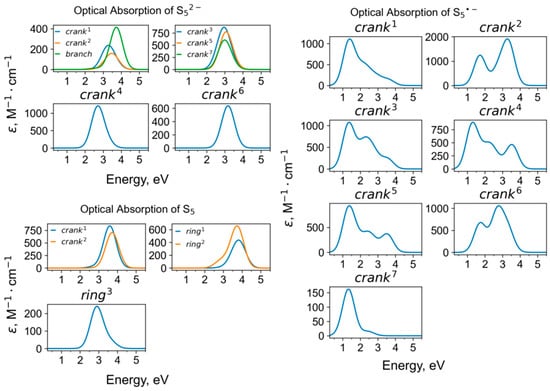
Figure 6.
Calculated UV-Vis-NIR absorption spectra of pentasulfide groups.
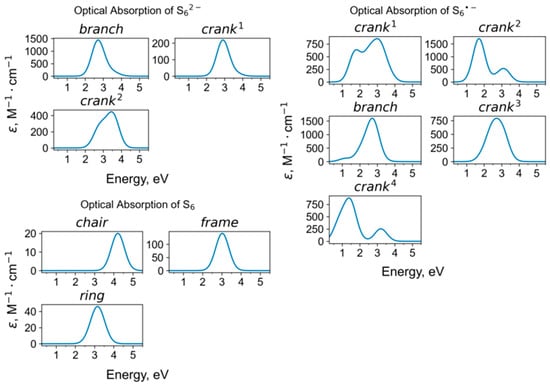
Figure 7.
Calculated UV-Vis-NIR absorption spectra of hexasulfide groups.
Table 3.
Parameters of Raman and UV-Vis-NIR spectra of HS− and polysulfide groups with the most stable structures.
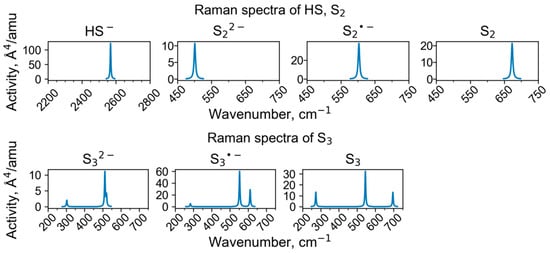
Figure 8.
Calculated Raman spectra of clusters containing HS and di- and trisulfide groups.
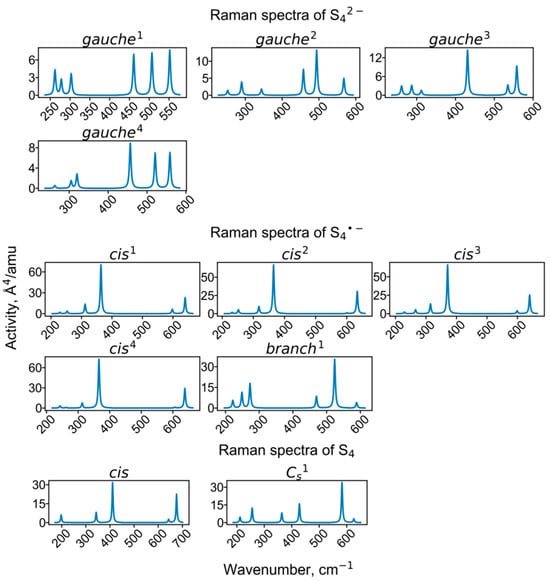
Figure 9.
Calculated Raman spectra of clusters containing tetrasulfide groups.
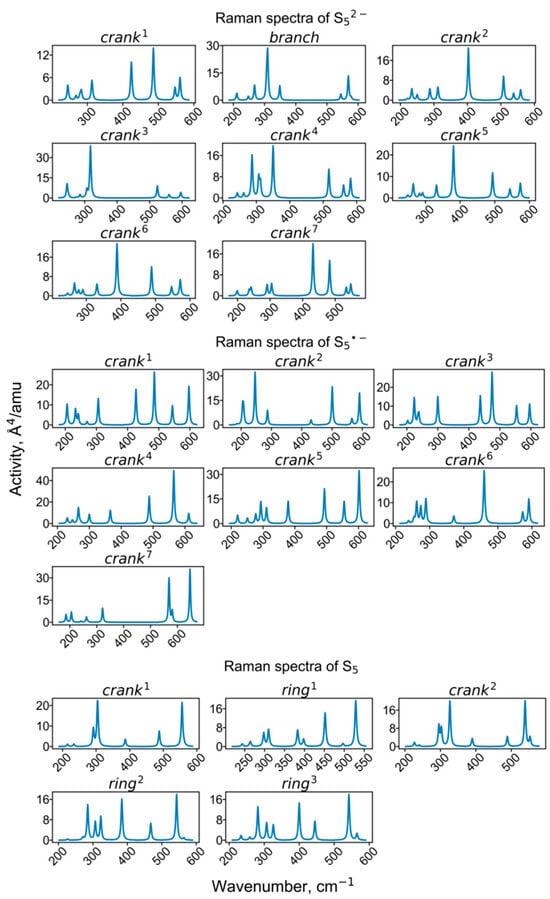
Figure 10.
Calculated Raman spectra of clusters containing pentasulfide groups.
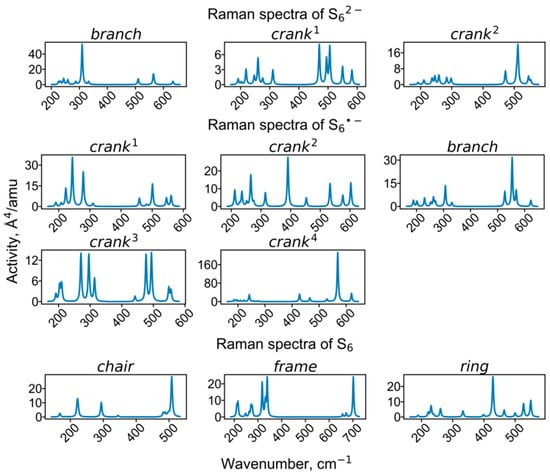
Figure 11.
Calculated Raman spectra of clusters containing hexasulfide groups.
The region of the potential energy surface corresponding to the atomic coordinates of the polysulfide complex is characterized by multiple local minima. This stabilizes a variety of structures for the same species, differing in energy and geometry. For example, for the gauche conformation of the S42− anion, four different variants were obtained, which are characterized by relative energies ranging from 0 to 0.519 eV and dihedral angles ranging from 47 to 63 degrees. For the cis conformation of the S4•− radical anion, four different variants were found, with energies ranging from 0 to 0.112 eV and dihedral angles ranging from 0.5 to 6 degrees. A similar situation takes place with other polysulfide species. Our calculations show that the stability of a conformer depends on its orientation within the sapozhnikovite cage. Calculations of barrier energies for reorientation of the polysulfide groups within the cage were not performed in this study. However, we assume the presence of significantly large barriers based on the flow of the geometry optimization: the final optimized conformation is highly dependent on the initial guess for the geometry of the species. Based on this, we tried to use different initial guesses to avoid missing possible conformations.
In order to determine which charge states of polysulfide groups are most favorable in terms of energy, additional calculations were performed. For each of the polysulfide groups, we compared the total energies of three composite systems with the same composition: (i) sapozhnikovite cell containing neutral polysulfide group together with a Na vacancy, plus single Na atom and single Ca atom; (ii) cell containing a polysulfide group as a radical anion, plus single Ca atom; (iii) cell containing polysulfide group as an anion together with Ca2+ cation replacing one of the Na+ cations, plus single Na atom. To derive the energies of single Na and Ca atoms, we used unit cells of metallic sodium and calcium.
For all polysulfide groups, the total energy decreases with an increase in the negative charge of the group: the differences E(S2) − E(S22−), E(S3) − E(S32−), E(S4) − E(S42−), E(S5) − E(S52−), and E(S6) − E(S62−) are equal to 6.27, 5.04, 4.85, 4.29, and 3.22 eV, respectively; and the differences E(S2) − E(S2•−), E(S3) − E(S3•−), E(S4) − E(S4•−), E(S5) − E(S5•−), and E(S6) − E(S6•−) are equal to 3.43, 2.79, 2.20, 1.56, and 0.72 eV, respectively.
4. Discussion
4.1. Raman Spectra
Wavenumbers of the HS− stretching mode in feldspathoids belonging to the cancrinite and sodalite groups are in the range of 2550–2567 cm−1. In particular, in the Raman spectrum of sapozhnikovite, a distinct narrow Raman peak of HS− is observed at 2553 cm−1 [,]. The calculated wavenumber of 2568 cm−1 for sapozhnikovite is slightly higher and is close to the wavenumbers of HS− in the Raman spectra of the cancrinite-group minerals sulfhydrylbystrite, Na5K2Ca(Al6Si6O24)S52−(HS)− (2562 cm−1: []), and sulfide-bearing balliranoite with the empirical formula Na5.4K0.1Ca2.4(Si6Al6O24)Cl2[(CO3)0.7(SO4)0.18(S2*−,HS−,S5−)xCl0.1(H2O)0.16] (2564 cm−1: []). In the Raman spectra of HS−-bearing tounkite, a peak of HS− is observed in the range of 2564–2567 cm−1 (Figure 12).
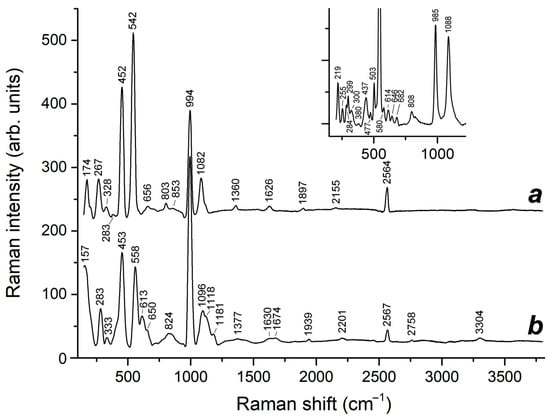
Figure 12.
Raman spectra of tounkite samples containing HS−, S4, and minor S3•− (curves a and b) as well as S2•− (the peaks at 558 and 613 cm−1 in curve b). The inset shows Raman spectrum of slyudyankaite containing cyclic S6 and cis-S4 molecules.
The assignment of the bands at 2575–2577 cm−1 in the Raman spectra of commensurately modulated sodalite-group minerals, triclinic slyudyankaite, ideally Na28Ca4(Si24Al24O96)(SO4)6(S6)1/3(CO2)·2H2O [], and haüyne analogue with the modulation parameter of 0.2 and unit cell parameter of 45.363 Å and general formula Na6Ca2−x(Si6Al6O24)(SO42−,HS−,S2•−,S4,S3•−,S52−)2−y [] (Figure 13) is ambiguous. These bands may correspond to H2S rather than to HS− []. Structure modulations of both minerals are caused by the regular alternation of small sodalite cages hosting SO42− anions and metal cations and large sodalite cages hosting neutral polysulfide molecules with minor amounts of other species.
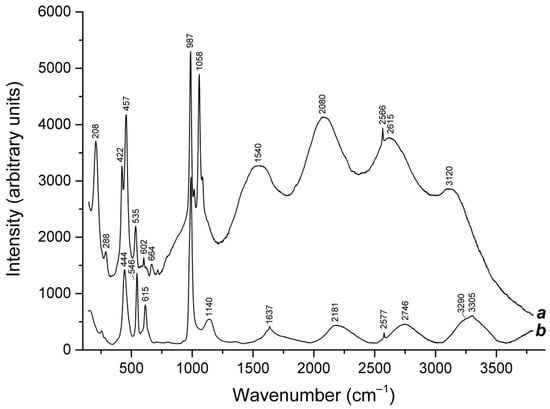
Figure 13.
Raman spectra of (a) the product of calcination in air at 600 °C of S52−-containing balliranoite from the Tultui lazurite deposit, Baikal Lake region [], and (b) S2•−-, S3•−-, S52−-, H2S-, and HS−-containing green haüyne with a commensurately modulated crystal structure and a fivefold increased cubic unit cell parameter from the Malobystrinskoe lazurite deposit, Baikal Lake region [].
A wavenumber of 673 cm−1 has been predicted for the vibrational mode of the S2 molecule in the sodalite cage (Table 3). Similar weak bands were observed in the Raman spectra of the cancrinite-group minerals, sulfide-bearing balliranoite (at 671 cm−1: []), and sulfhydrylbystrite (at 667 cm−1: []). A very weak band at 501 cm−1 in the Raman spectrum of pink S4-containing haüyne from the Malo-Bystrinskoe lazurite deposit, East Siberia [], could be assigned to the S22− anion. However, the assignment of all these bands is ambiguous.
The positions of the strongest S–S stretching Raman bands of S2•− and S3•− are close to each other. However, these radical anions can be easily distinguished by some specific features of their spectra. In particular, the Raman spectrum of S3•−, unlike that of S2•−, contains strong bands of overtones and combination modes in the range of 1090–3300 cm−1 [,] (Figure 14), which is related to a strong anharmonism. On the other hand, unlike the S2 molecule, the S2•− radical anion can be reliably identified in S-bearing tectosilicates by characteristic luminescence with the vibrational structure of S2•− [,,,,,,,,,,,] (Figure 15) as well as ESR spectroscopy [,,,,,,,,,,]. Luminescence with the vibrational structure of S2•− is also observed in Raman spectra of some S2•−-rich feldspathoids (Figure 13). In addition, photochromism of some S-bearing sodalite-group minerals [,,,,,,,,,,,,,] is usually related to the transfer of an electron from S2•− to a chlorine or oxygen vacancy under the influence of UV irradiation, which leads to the formation of F-centers absorbing near 550 nm.
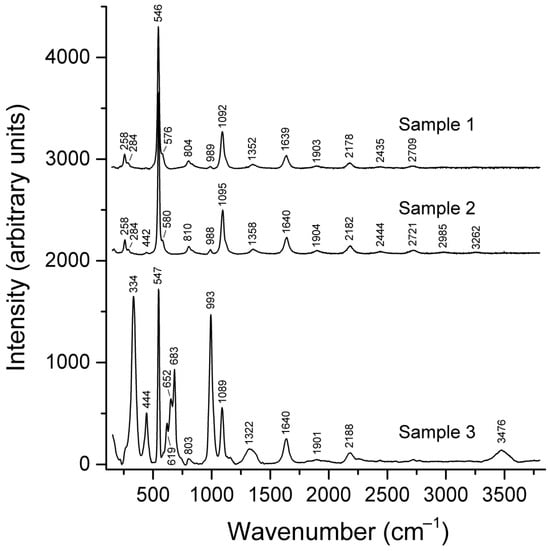
Figure 14.
Raman spectra of three vladimirivanovite varieties in which commensurate structure modulations are caused by alternation of SO42− anions with S3•− (Samples 1 and 2) and S4 molecules in different conformation states (Sample 3).
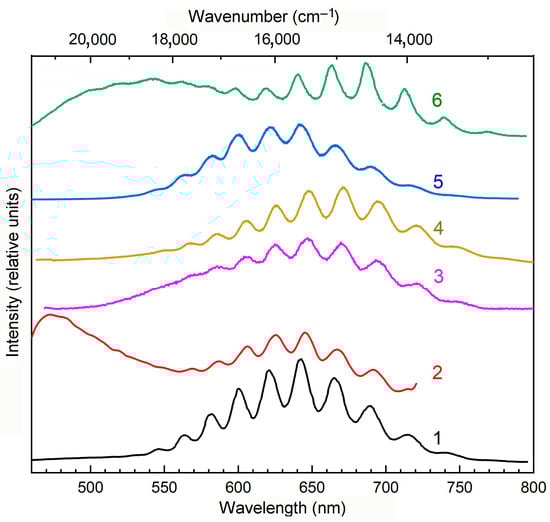
Figure 15.
Luminescence spectra of S-containing feldspathoids: (1) kyanoxalite from the Lovozero massif, Kola Peninsula []; (2) hackmanite from the Inagli massif, Aldan Shield []; (3) nosean from the Eifel sanidinite, Germany (this work); (4) haüyne from the Malobystrinskoye deposit, Baikal Lake region (this work); and (5) sapozhnikovite and (6) sodalite from Mount Flora, Lovozero massif [], obtained upon excitation with radiation with a wavelength of 405 nm at 77 K.
In different sources, the isolated S2•− radical anion was characterized by S–S distances from 2.00 to 2.08 Å and a stretching vibrational mode with wavenumbers in the range of 528–579 cm−1 [,,,,,]. According to our calculations for a model with S2•− in the sapozhnikovite unit cell, the S–S distance and wavenumber of S–S stretching vibrations are equal to 2.01 Å and 603 cm−1, respectively (Table 1 and Table 3). Based on these data, the bands at 605–611 cm−1 in the Raman spectra of natural S2•−-bearing sapozhnikovite obtained at room temperature [,], tentatively attributed to vibrations involving Na+ cations, could be assigned to stretching vibrations of disulfide radical anion. However, the photoluminescence spectrum of S2•− in sapozhnikovite obtained at 77 K has a vibrational structure with the distance between satellites equal to 536 cm−1.
Raman spectrum of the yellow-green S2•−-rich and S3•−-bearing product of heating an intermediate member of the sapozhnikovite-sodalite solid-solution series contains a distinct band at 597 cm−1, whereas, in the Raman spectrum of the blue product of its further annealing, this band shifts toward 586 cm−1 and becomes weaker []. It is to be noted that the yellow-green products of heating have unit cell a parameters (8.91–8.95 Å) rather close to that of the initial feldspathoid (8.88 Å), whereas the a parameter of the blue product of annealing is equal to 9.07 Å. This example shows that the frequency of S–S stretching vibrations of S2•− depends on the size of the sodalite cage hosting this radical anion.
A similar trend is observed for the symmetric stretching vibrations of S3•−: in the Raman spectra of lazurite with a ≈ 9.09 Å, the corresponding wavenumber is 545 cm−1, whereas, for heating products of a member of the sapozhnikovite-sodalite series with the unit cell parameters of 9.07 and 8.95 Å, this band is observed at 549 and 559 cm−1, respectively, and the band of bending vibrations has maximums at 266 and 258 cm−1, respectively []. The relatively high wavenumbers of 283 and 553 cm−1 calculated for S3•− in the sapozhnikovite sodalite cage (Table 3) are in good agreement with the small size of this cage.
There are no reliable data on the S32− and S3 groups in natural tectosilicates.
Calculation for S4 in a small sapozhnikovite cage resulted in wavenumbers of 343, 411, and 676 cm−1 for the strongest Raman bands (Table 3). According to [], the wavenumbers of Raman active harmonic vibrational modes of cis-S4 calculated using different methods are 319–334, 326–339, 655–659, and 684–688 cm−1. The calculated wavenumbers of periodic harmonic phonons with notable S4 contributions in Na,S4-sodalite are 335–357, 631–641, and 649–662 cm−1. Based on these data, distinct Raman bands of pink haüyne containing the S4 group (a red chromophore) observed at 327 and 656 + 684 cm−1 were assigned to mixed and stretching vibrations of S4, respectively []. The discrepancy between data from [,] on one hand and wavenumbers of S4 listed in Table 3 on the other hand may be caused by a significant difference between the sizes of sodalite cages in sapozhnikovite and S4-bearing haüyne: the unit cell a parameter of these minerals is equal to 8.915 and 9.073 Å, respectively.
Vladimirivanovite, (Na+6.0–6.4Ca2+1.5–1.7)(Al6Si6O24)(SO42−,S3•−,S4)1.7–1.9(CO2)0–0.1·nH2O (n = 1–3), is an orthorhombic commensurately modulated sodalite-group mineral with the unit cell parameters a ≈ 9.1, b ≈ 12.9, and c ≈ 38.6 Å; Z = 6 []. In blue and lilac varieties of vladimirivanovite, structure modulations are caused by regular alternation of sodalite cages hosting SO42− with larger sodalite cages hosting S3•− (blue chromophore) or S4 (red chromophore), respectively. Based on the ab initio calculations [,,], bands at 334 + 619, 652, and 444 + 683 cm−1 in the Raman spectrum of lilac vladimirivanovite (Figure 14, Sample 3) were assigned to cis-, gauche-, and trans-S4, respectively. These values differ significantly from the wavenumbers of 343, 411, and 676 cm−1 calculated for cis-S4 in the small sodalite cage of sapozhnikovite. Bands at 328–333 and 650–656 cm−1 in the Raman spectra of S4-bearing tounkite (Figure 12) were assigned to mixed and stretching vibrations of cis- and/or trans-S4 []. Most probably, this species occurs in the large liottite cage. Thus, in the case of S4, the same trend takes place as in the cases of S2•− and S3•−: a decrease in the size of the cage hosting the S4 molecule results in an increase in the frequency of its stretching vibrations.
The S52− anion (a strong yellow chromophore) is the only pentasulfide species detected in minerals. It is a species-defining component in four-layer cancrinite-group minerals belonging to the bystrite–sulfhydrylbystrite solid-solution series, Na5(K,Na)2Ca(Al6Si6O24)S52−(Cl−,HS−) []. In their crystal structures, S52− anions having different crankshaft conformations occur in the large Losod cage. In the Raman spectra of these minerals, strong peaks at 442–447 and 506–508 cm−1 are observed. The former peak in the Raman spectrum of bystrite is rather broad as a result of the overlapping of several bands. Similar but weak bands are observed in the Raman spectrum of S52− bearing green balliranoite, but their assignment is ambiguous because of possible overlapping with bands of SO42− and aluminosilicate framework, respectively. The strongest bands calculated for the crankshaft S52− anion have maxima at 424 + 486 (mixed modes) and 561 (stretching mode) cm−1. As in the cases discussed above, the frequency of S52− stretching vibrations decreases with an increase in the size of the cage hosting this species.
The cyclic S6 molecule having a chair-like conformation is a species-defining extra-framework component in slyudyankaite, Na28Ca4(Si24Al24O96)(SO4)6(S6)1/3(CO2)·2H2O. Slyudyankaite is a triclinic commensurately modulated sodalite-group mineral with the unit cell parameters a = 9.0523 Å, b = 12.8806 Å, c = 25.681 Å, α = 89.988(2)°, β = 90.052(1)°, and γ = 90.221(1)°; Z = 1. According to the results of the crystal structure refinement, structure modulations of slyudyankaite are caused by the regular alternation of small sodalite cages hosting SO42− anions and metal cations and large sodalite cages hosting neutral molecules S6, CO2, H2O, and minor S4. Raman bands of slyudyankaite at 284 and 477 cm−1 were assigned to bending and stretching vibrations of S6 [] (Figure 12). These values are somewhat smaller than the wavenumbers of the strongest bands at 294 and 508 cm−1 in the calculated Raman spectrum of chair-S6 in the small sodalite cage of sapozhnikovite (Table 3).
4.2. ESR Spectra
Among radical anions occurring in sodalite group minerals, S3•− is most studied by the ESR method. It was also detected in sapozhnikovite samples. An ESR spectrum with g1 = 2.001, g2 = 2.039, and g3 = 2.054, corresponding to S3•− centers, was observed for some sapozhnikovite samples (Figure 16). The intensity of these lines increases significantly upon heat treatment of the samples []. The experimental results are in good agreement with the calculated data presented in Table 2.
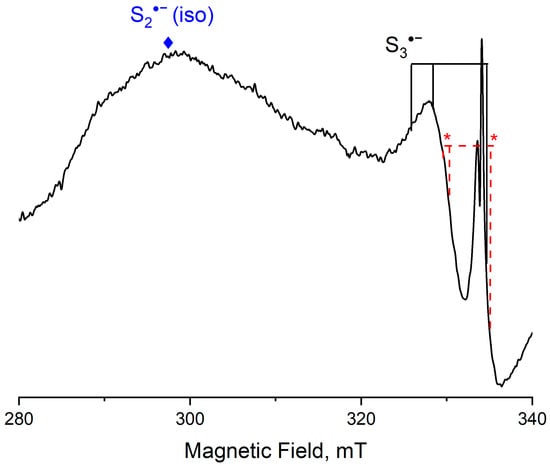
Figure 16.
ESR spectrum of a sapozhnikovite sample. Asterisks indicate the positions of the bands corresponding to S4•−.
The ESR spectrum of sapozhnikovite also contains a broad signal in the g = 2.1–2.4 range, which is close in value to the isotropic g-factor of S2•− radical anions, which can have various orientations within sodalite cages, leading to a broadening of the observed signal [,]. Also, in the holotype of sapozhnikovite, an ESR signal with g2 = 2.008 was observed [], which, according to calculations, could correspond to S5•− or S6•− radical anions, but the existence of such large species in the large sapozhnikovite cage is hardly possible. The remaining radical anions in sapozhnikovite were not detected in the ESR spectra. This is probably due to the fact that the ranges of the ESR signals for such centers are quite close, and they are difficult to distinguish from each other.
In the ESR spectra of some samples of sodalite group minerals, weak signals with g1 = 1.98, g2 = 2.023, and g3 = 2.029 are observed, which, according to calculations, correspond to the branched configuration of S4•−. In addition, for tugtupite [] and haüyne [] samples, an ESR signal with g1 = 2.002 and g2 = 2.035 was observed, which was attributed to cis-S4•− (Figure 17). A strong and rather broad signal with a g-factor of 2.030 observed in the ESR spectrum of slyudyankaite [] may correspond to overlapping bands of the S3•− and cis-S4•− radical anions (Table 2).
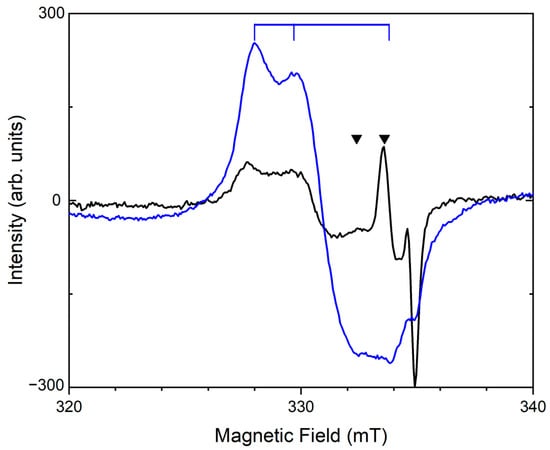
Figure 17.
The ESR spectra of S4- and S4●−-bearing lilac haüyne: initial sample (black curve) and a sample heated at a temperature of 800 °C (blue curve). The triangles indicate the bands of S4●−, and the vertical lines show the bands of S3●−.
4.3. UV-Vis-NIR Absorption Spectra
An intense band around 380 nm in the absorption spectra of some feldspathoids is associated with S2•− radical anions (Figure 18). Characteristic orange luminescence is excited in this band []. These data are in good agreement with calculated values (Table 3).
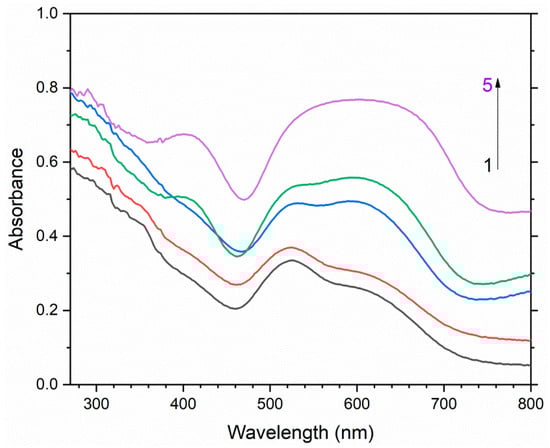
Figure 18.
Spectra of diffuse absorption of S4- and S4●−-bearing lilac haüyne with the empirical formula Na6.39K0.06Ca1.57(Si6.08Al5.92O24)(SO4)1.78(S4)0.03(S2−)0.02Cl0.07(CO2)0.15·nH2O: initial sample (1) and samples heated at 200 °C (2), 400 °C (3), 600 °C (4), and 800 °C (5). During the heating, the groups S4- and S4●− transformed into S3●− and S2●−.
A broad, low-intensity band was observed in the absorption spectrum of sapozhnikovite at 595 nm. Its intensity increases significantly upon heating of the sample and correlates with the intensity of the ESR signal []. This band corresponds to S3•−. Its position differs slightly from the calculated value, which may be due to the differences between unit cell dimensions of the initial and heated samples (see above).
UV-Vis-NIR absorption spectra peaking at 521 and 605 nm were observed for some haüyne samples []. These absorption bands were assigned to neutral S4 molecules based on calculations for sodalite presented in []. However, the calculations presented in this paper failed to yield trans-S4 molecules similar to those calculated in []. These molecules are likely unstable in the small sodalite cage of sapozhnikovite. Similar bands are observed at 530 and 605 nm in the absorption spectrum of S4- and S52−-bearing balliranoite []. The strong absorption of this sample below 450 nm can be attributed to S52− anions. Bands at 590, 385, 324, and 300 nm in the absorption spectrum of bottle-green tounkite [] may correspond to S3•−, (S4 + S52−), S4•−, and S6, respectively. The presence of S3•−, S4, S52−, and S4•− in tounkite was confirmed by means of ESR and Raman spectroscopy.
Based on the data from [,,], bands at 610 and 530–540 nm in the UV-Vis-NIR absorption spectra of green slyudyankaite were assigned to S3•− and cis-S4, respectively [] (see Figure 18). In addition, for the slyudyankaite holotype, absorption at 625 nm was observed and assigned to trans-S4 molecules detected in this sample by means of single-crystal X-ray structural analysis. The structureless absorption of the green slyudyankaite variety in the range of 350–450 nm is due to the presence of significant amounts of S2•− radical anion detected in this sample by characteristic luminescence. Based on data from Table 3, strong absorption of slyudyankaite in the range of 250–350 nm can be attributed to the chair-like conformer of the S6 molecule. According to the single-crystal X-ray structural analysis, this molecule is a species-defining component in slyudyankaite [].
The absorption bands at 380 and 456 nm were previously attributed to S52− anions in bystrite [] and haüyne-45Å []. This correlates well with the calculated values for S52− in the sodalite cage (Table 3).
5. Conclusions
The comparison of spectroscopic characteristics of HS− and polysulfide groups hosted by the sodalite cage of sapozhnikovite, calculated in this work, with spectroscopic data on different S-bearing feldspathoids published elsewhere shows that, in most cases, there is a good agreement between the theoretical and experimental data. Moreover, several new, low-energy metastable configurations of polysulfide groups have been predicted.
Wavenumbers of the HS− stretching mode in feldspathoids are in the range of 2550–2565 cm−1. The strongest Raman bands of S2•− and S3•− are close to each other, but the Raman spectrum of S3•− contains strong characteristic bands of overtones and combination modes, and the S2•− radical anion can be reliably identified by characteristic luminescence with a vibrational structure with a period in the range of 528–579 cm−1. Raman bands of the S4 group (a red chromophore) occurring in lilac varieties of sodalite-group minerals, vladimirivanovite and haüyne as well as in orange-red varieties of tounkite, observed at (327–334) + 619, (652–656), and 444 + (683–684) cm−1, correspond to cis-, gauche-, and trans-S4, respectively. Strong peaks at 442–447 and 506–508 cm−1 observed in the Raman spectra of cancrinite-group minerals belonging to the bystrite–sulfhydrylbystrite solid-solution series correspond to species-defining S52− anions having different crankshaft conformations. Raman bands of slyudyankaite at 284 and 477 cm−1 are due to bending and stretching vibrations of species-defining S6 molecules.
A broad ESR signal in the g = 2.1–2.4 range and ESR spectra with [g1 = 2.001, g2 = 2.039, and g3 = 2.054] and [g1 = 1.98, g2 = 2.023, and g3 = 2.029] correspond to S2•−, S3•−, and S4•− paramagnetic centers in sodalite cages, respectively.
Absorption bands at 350–450 nm, 590–610 nm, (521–530) + 605 nm, ~324 nm, ~300 nm, and numerous bands below 460 nm may correspond to S2•−, S3•−, S4 + S4•−, S6, and S52− chromophore centers in feldspathoids, respectively. In particular, bands of S52− at 380 and 456 nm are observed in absorption spectra of bystrite and S52−-bearing haüyne-45Å. The lilac and orange-red colors of some varieties of vladimirivanovite and haüyne are a result of a combination of S4 group with S3•− (a blue chromophore) and S52− (a yellow chromophore). The green color of sodalite-group minerals (e.g., slyudyankaite and haüyne-45Å) is a result of the simultaneous presence of S3•− and a yellow chromophore (S2•−, S52−, or S6).
The frequencies of the characteristic bands in the Raman and UV-Vis-NIR absorption spectra as well as the g-factors of ESR signals depend on the sizes of the cages hosting the polysulfide groups. In particular, a decrease in the size of the cage hosting polysulfide species results in an increase in the frequency of their stretching vibrations.
Our results support the thesis that electron transfer to a polysulfide molecule or radical anion lowers its energy. However, some neutral polysulfide molecules (S4, S6, and, possibly, S2) occur in cation-free sodalite cages of some feldspathoids, which may be a result of the charge balance requirement.
Supplementary Materials
The following supporting information can be downloaded at https://www.mdpi.com/article/10.3390/min15111207/s1: Table S1: Calculated wavenumbers of vibrational modes (cm−1) and Raman activities (Å4/amu) for bi- and trisulfide groups. Table S2: Calculated wavenumbers of vibrational modes (cm−1) and Raman activities (Å4/amu) for tetrasulfide groups. Table S3: Calculated wavenumbers of vibrational modes (cm−1) and Raman activities (Å4/amu) for pentasulfide groups. Table S4: Calculated wavenumbers of vibrational modes (cm−1) and Raman activities (Å4/amu) for hexasulfide groups. Table S5: Comparison of data calculated for crank1-S6•− using PBE and B3LYP functionals within the embedded cluster approach. Table S6: Position of the first absorption band in UV-VIS-NIR spectrum for crank1-S6•− calculated using TDDFT approach. Figure S1: Convergence of wavenumbers of vibrational modes with respect to ECP area radius (RECP) and PC area radius (RPC) for crank1-S6•−. Figure S2: Convergence of g-factor with respect to ECP area radius (RECP) and PC area radius (RPC) for crank1-S6•−. Figure S3: QM-cluster for S6•− crank1. The cluster contains S6•− in the crank1 conformation with eight nearest Na+ cations.
Author Contributions
Conceptualization, N.V.C., I.V.P. and R.Y.S.; Methodology, A.I.B., N.V.C., I.V.P. and R.Y.S.; Investigation, A.I.B. and R.Y.S.; Original Manuscript Draft Preparation, N.V.C., A.I.B. and R.Y.S.; Manuscript Review and Editing, I.V.P.; Figures, A.I.B., N.V.C. and R.Y.S. All authors have read and agreed to the published version of the manuscript.
Funding
DFT calculations were carried out by the governmental assignment in terms of Project 0284-2021-0004 (for A.I.B.). All calculations were performed on HPC-cluster “Akademik V.M. Matrosov” []. Raman spectroscopy investigation and (partly) discussion related to the comparison of theoretical and experimental spectroscopic characteristics were performed in accordance with the state task, registration number 124013100858-3 (for N.V.C.). Discussion related to ESR and UV-Vis-NIR spectroscopy was performed with the state task 124031900001-9 (for R.Y.S.). The mineralogical work was conducted under the state assignment of Lomonosov Moscow State University, state task No. 121061600049-4 (for I.V.P.). All authors have read and agreed to the published version of the manuscript.
Data Availability Statement
The original contributions presented in this study are included in the article/Supplementary Materials. Further inquiries can be directed to the corresponding author.
Conflicts of Interest
The authors declare no conflicts of interest.
References
- Steudel, R. Ermittlung von SS-Kernabständen aus Schwingungsspektren. Z. Naturforsch. B. 1975, 30, 3–4. [Google Scholar] [CrossRef]
- Stevens, F.; Vrielinck, H.; Callens, F.; Pauwels, E.; Waroquier, M. Density-functional study of S2− defects in alkali halides. Phys. Rev. B. 2002, 66, 134103. [Google Scholar] [CrossRef]
- Wong, M.W.; Steudel, R. Structure and spectra of tetrasulfur S4—An ab initio MO study. Chem. Phys. Lett. 2003, 379, 162–169. [Google Scholar] [CrossRef]
- Chivers, T.; Oakley, R.T. Structures and spectroscopic properties of polysulfide radical anions: A theoretical perspective. Molecules 2023, 28, 5654. [Google Scholar] [CrossRef] [PubMed]
- Steudel, R.; Steudel, Y. Polysulfide chemistry in sodium–sulfur batteries and related systems—A computational study by G3X(MP2) and PCM calculations. Chem. A Eur. J. 2013, 19, 3162–3176. [Google Scholar] [CrossRef]
- Steudel, R.; Chivers, T. The role of polysulfide dianions and radical anions in the chemical, physical and biological sciences, including sulfur-based batteries. Chem. Soc. Rev. 2019, 48, 3279–3319. [Google Scholar] [CrossRef] [PubMed]
- Rejmak, P. Computational refinement of the puzzling red tetrasulfur chromophore in ultramarine pigments. Phys. Chem. Chem. Phys. 2020, 22, 22684–22698. [Google Scholar] [CrossRef]
- Eckert, B.; Steudel, F. Molecular spectra of sulfur molecules and solid sulfur allotropes. Top. Curr. Chem. 2003, 231, 31–97. [Google Scholar] [CrossRef]
- Weser, G.; Hensel, F.; Warren, W.W. The optical absorption spectrum of fluid sulfur up to supercritical conditions. Berichte Der Bunsenges. Phys. Chem. 1978, 82, 588–594. [Google Scholar] [CrossRef]
- Paniz, H.; Lester, A. Vibronic absorption spectra of S3 and S4, in solid argon. J. Phys. Chem. 1992, 96, 6579–6585. [Google Scholar]
- Chukanov, N.V.; Zubkova, N.V.; Pekov, I.V.; Shendrik, R.; Varlamov, D.A.; Vigasina, M.F.; Belakovskiy, D.I.; Britvin, S.N.; Yapaskurt, V.O.; Pushcharovsky, D.Y. Sapozhnikovite, Na8(Al6Si6O24)(HS)2, a new sodalite-group mineral from the Lovozero alkaline massif, Kola Peninsula. Mineral. Mag. 2022, 86, 49–59. [Google Scholar] [CrossRef]
- Bolotina, N.B.; Chukanov, N.V.; Sapozhnikov, A.N.; Zubkova, N.V.; Pekov, I.V.; Varlamov, D.A.; Vigasina, M.F.; Bulakh, M.O.; Yapaskurt, V.O.; Ksenofontov, D.A. Vladimirivanovite revised: General crystal chemistry and isomorphous substitutions of extra-framework species. Minerals 2024, 14, 883. [Google Scholar] [CrossRef]
- Chukanov, N.V.; Shchipalkina, N.V.; Shendrik, R.Y.; Vigasina, M.F.; Tauson, V.L.; Lipko, S.V.; Varlamov, D.A.; Shcherbakov, V.D.; Sapozhnikov, A.N.; Kasatkin, A.V.; et al. Isomorphism and mutual transformations of S-bearing components in feldspathoids with microporous structures. Minerals 2022, 12, 1456. [Google Scholar] [CrossRef]
- Chukanov, N.V.; Shendrik, R.Y.; Vigasina, M.F.; Pekov, I.V.; Sapozhnikov, A.N.; Shcherbakov, V.D.; Varlamov, D.A. Crystal chemistry, isomorphism, and thermal conversions of extra-framework components in sodalite-group minerals. Minerals 2022, 12, 887. [Google Scholar] [CrossRef]
- Chukanov, N.V.; Sapozhnikov, A.N.; Shendrik, R.Y.; Zubkova, N.V.; Vigasina, M.F.; Potekhina, N.V.; Ksenofontov, D.A.; Pekov, I.V. Crystal chemistry, thermal and radiation-induced conversions and indicatory significance of S-bearing groups in balliranoite. Minerals 2023, 13, 822. [Google Scholar] [CrossRef]
- Chukanov, N.V.; Sapozhnikov, A.N.; Kaneva, E.V.; Varlamov, D.A.; Vigasina, M.F. Bystrite, Na7Ca(Al6Si6O24)S52–Cl–: Formula redefinition and relationships with other four-layer cancrinite-group minerals. Mineral. Mag. 2023, 87, 455–464. [Google Scholar] [CrossRef]
- Chukanov, N.V.; Bolotina, N.B.; Shendrik, R.Y.; Sapozhnikov, A.N.; Zubkova, N.V.; Pekov, I.V.; Vigasina, M.F.; Sandalov, F.D.; Ksenofontov, D.A. Crystal chemistry and refined formula of tounkite. Minerals 2024, 14, 382. [Google Scholar] [CrossRef]
- Chukanov, N.V.; Aksenov, S.M. Crystal chemistry, chemical diversity and physical properties of microporous sodalite-type materials: A review. Intern. J. Molec. Sci. 2024, 25, 10218. [Google Scholar] [CrossRef] [PubMed]
- Chukanov, N.V.; Zubkova, N.V.; Shendrik, R.Y.; Sapozhnikov, A.N.; Pekov, I.V.; Vigasina, M.G.; Chervonnaya, N.A.; Varlamov, D.A.; Bolotina, N.B.; Ksenofontov, D.A.; et al. Crystal structure features, spectroscopic characteristics and thermal conversions of sulfur-bearing groups: New natural commensurately modulated haüyne analogue, Na6Ca2–x(Si6Al6O24)(SO42–,HS–,S2·–,S4,S3·–,S52–)2–y. Minerals 2025, 15, 709. [Google Scholar] [CrossRef]
- Fedyaeva, M.; Lepeshkin, S.; Chukanov, N.V.; Oganov, A.R. Mutual transformations of polysulfide chromophore species in sodalite-group minerals: A DFT study on S6 decomposition. Chem. Phys. Phys. Chem. 2024, 25, e202400532. [Google Scholar] [CrossRef] [PubMed]
- Pekov, I.V.; Chukanov, N.V.; Shcherbakov, V.D.; Vigasina, M.F.; Shendrik, R.Y.; Sandalov, F.D.; Vyatkin, S.V.; Turchkova, A.G. Rock-forming sodalite–sapozhnikovite series feldspathoids from the Lovozero alkaline complex (Kola Peninsula, Russia): Isomorphism, thermal and radiation-induced transformations, and genetic mineralogy. Geol. Ore Depos. 2025, 67, 6–29. [Google Scholar] [CrossRef]
- Sapozhnikov, A.N.; Bolotina, N.B.; Chukanov, N.V.; Shendrik, R.Y.; Kaneva, E.V.; Vigasina, M.F.; Ivanova, L.A.; Tauson, V.L.; Lipko, S.V. Slyudyankaite, Na28Ca4(Si24Al24O96)(SO4)6(S6)1/3(CO2)·2H2O, a new sodalite group mineral from the Malo-Bystrinskoe lazurite deposit, Baikal Lake area, Russia. Amer. Mineral. 2023, 108, 1805–1817. [Google Scholar] [CrossRef]
- Sapozhnikov, A.N.; Tauson, V.L.; Lipko, S.V.; Danilov, B.S.; Chukanov, N.V. On the temperature conditions of formation of pink S4-containing haüyne from the Malo-Bystrinskoe lazurite deposit (East Siberia, Russia). Zapiski Russ. Mineral. Soc. 2025, 154, 99–107. [Google Scholar] [CrossRef]
- Shchipalkina, N.V.; Vereshchagin, O.S.; Chukanov, N.V.; Gorelova, L.; Pekov, I.V.; Bocharov, V.N. High-temperature behavior of the UV-luminescent sodalite-type natural compound Na8(Al6Si6O24)(HS)2: Comparative study by in situ single-crystal X-ray diffraction and Raman spectroscopy. J. Solid State Chem. 2023, 323, 124067. [Google Scholar] [CrossRef]
- Shendrik, R.; Chukanov, N.V.; Bogdanov, A.; Myasnikova, A.; Pankrushina, E.; Zolotarev, A.A.; Babkina, A.; Popova, E.; Vigasina, M.F.; Aksenov, S.M.; et al. Nature of scapolite color: Ab initio calculations, spectroscopy and structural study. Minerals 2024, 14, 937. [Google Scholar] [CrossRef]
- Shendrik, R.Y.; Chukanov, N.V.; Panikorovskii, T.L.; Vigasina, M.F.; Pekov, I.V. Radical anion S2•– in minerals. Zapiski Russ. Mineral. Soc. 2025, 154, 63–91. [Google Scholar] [CrossRef]
- Perdew, J.P.; Ruzsinszky, A.; Csonka, G.I.; Vydrov, O.A.; Scuseria, G.E.; Constantin, L.A.; Zhou, X.; Burke, K. Restoring the density-gradient expansion for exchange in solids and surfaces. Phys. Rev. Lett. 2008, 100, 136406. [Google Scholar] [CrossRef]
- Kresse, G.; Hafner, J. Ab initio molecular dynamics for liquid metals. Phys. Rev. B Condenc. Matter. 1993, 47, 558–561. [Google Scholar] [CrossRef]
- Stephens, P.J.; Devlin, F.; Chabalowski, C.; Frisch, M.J. Ab initio calculation of vibrational absorption and circular dichroism spectra using density functional force fields. J. Phys. Chem. 1992, 98, 11623–11627. [Google Scholar] [CrossRef]
- Neese, F. The ORCA program system. Wiley Interdiscip. Rev. Comput. Molec. Sci. 2012, 2, 73–78. [Google Scholar] [CrossRef]
- Graneri, M.H.V.; Spagnoli, D.; Wild, D.A.; McKinley, A.J. Twin peaks: Matrix isolation studies of H2S·amine complexes shedding light on fundamental S–H⋯N bonding. J. Chem. Phys. 2024, 160, 124312. [Google Scholar] [CrossRef] [PubMed]
- Kirk, R.D.; Schulman, J.H.; Rosenstock, H.B. Structure in the luminescence emission of the S2– ion. Solid State Commun. 1965, 3, 235–239. [Google Scholar] [CrossRef]
- Sidike, A.; Sawuti, A.; Wang, X.-M.; Zhu, H.-J.; Kobayashi, S.; Kusachi, I.; Yamasita, N. Fine structure in photoluminescence spectrum of center in sodalite. Phys. Chem. Miner. 2007, 34, 477–484. [Google Scholar] [CrossRef]
- Sidike, A.; Kusachi, I.; Kobayashi, S.; Atobe, K.; Yamashita, N. Photoluminescence spectra of S2•− center in natural and heat-treated scapolites. Phys. Chem. Miner. 2008, 35, 137–145. [Google Scholar] [CrossRef]
- Gaft, M.; Panczer, G.; Nagli, L.; Yeates, H. Laser-induced time-resolved luminescence of tugtupite, sodalite and hackmanite. Phys. Chem. Miner. 2009, 36, 127–141. [Google Scholar] [CrossRef]
- Kaiheriman, M.; Maimaitinaisier, A.; Rehiman, A.; Sidike, A. Photoluminescence properties of green and red luminescence from natural and heat-treated sodalite. Phys. Chem. Miner. 2014, 41, 227–235. [Google Scholar] [CrossRef]
- Finch, A.A.; Friis, H.; Maghrabi, M. Defects in sodalite—group minerals determined from X-ray-induced luminescence. Phys. Chem. Miner. 2016, 43, 481–491. [Google Scholar] [CrossRef]
- Radomskaya, T.A.; Kaneva, E.V.; Shendrik, R.Y.; Suvorova, L.F.; Vladykin, N.V. Sulfur-bearing sodalite, hackmanite, in alkaline pegmatites of the Inagli massif (Aldan Shield): Crystal chemistry, photochromism, and luminescence. Geol. Ore Depos. 2021, 63, 696–704. [Google Scholar] [CrossRef]
- Schneider, J.; Dischler, B.; Räuber, A. Electron spin resonance of sulfur and selenium radicals in alkali halides. Phys. Status Solidi (b) 1966, 13, 141–157. [Google Scholar] [CrossRef]
- Vannotti, L.E.; Morton, J.R. Paramagnetic-resonance spectra of S2– in alkali halides. Phys. Rev. 1967, 161, 282. [Google Scholar] [CrossRef]
- De Siebenthal, J.M.; Bill, H. Investigation of sulfur molecular paramagnetic centers in SrCl2. Phys. Status Solidi (b) 1979, 91, 479–486. [Google Scholar] [CrossRef]
- Rolfe, J. Emission spectra of S2−, Se2−, and SeS− ions in KI crystals. J. Chem. Phys. 1968, 49, 4193–4197. [Google Scholar] [CrossRef]
- Hassib, A.; Beckman, O.; Annersten, H. Photochromic properties of natural sodalite. J. Phys. D Appl. Phys. 1977, 334, 771–777. [Google Scholar] [CrossRef]
- Jensen, A.; Petersen, O.V. Tugtupite: A gemstone from Greenland. Gems Gemol. 1982, 19, 90–94. [Google Scholar] [CrossRef]
- Pizani, P.S.; Terrile, M.C.; Farach, H.A.; Poole, C.P. Color centers in sodalite. Amer. Mineral. 1985, 70, 1186–1192. [Google Scholar]
- Warner, T.E.; Hutzen, A.J. The effects of sulfur intercalation on the optical properties of artificial ‘hackmanite’, Na8[Al6Si6O24]Cl1.8S0.1; ‘sulfosodalite’, Na8[Al6Si6O24]S; and natural tugtupite, Na8[Be2Al2Si8O24](Cl,S)2–δ. Phys. Chem. Miner. 2012, 39, 163–168. [Google Scholar] [CrossRef]
- Norrbo, I.; Gluchowski, P.; Hyppänen, I.; Laihinen, T.; Laukkanen, P.; Mäkelä, J.; Mamedov, F.; Santos, H.S.; Sinkkonen, J.; Tuomisto, M.; et al. Mechanisms of tenebrescence and persistent luminescence in synthetic hackmanite Na8Al6Si6O24(Cl,S)2. ACS Appl. Mater. Interfaces 2016, 8, 11592–11602. [Google Scholar] [CrossRef] [PubMed]
- Curutchet, A.; le Bahers, T. Modeling the photochromism of S—doped sodalites using DFT, TDDFT, and SAC-CI methods. Inorg. Chem. 2017, 56, 414–423. [Google Scholar] [CrossRef]
- Agamah, C.; Vuori, S.; Colinet, P.; Norrbo, I.; de Carvalho, J.M.; Nakamura, L.K.O.; Lindblom, J.; van Goethem, L.; Emmermann, A.; Saarinen, T.; et al. Hackmanite—The natural glow-in-the-dark material. Chem. Mater. 2020, 32, 8895–8905. [Google Scholar] [CrossRef]
- Colinet, P.; Gheeraert, A.; Curutchet, A.; le Bahers, T. On the spectroscopic modeling of localized defects in sodalites by TD-DFT. J. Phys. Chem. 2020, C124, 8949–8957. [Google Scholar] [CrossRef]
- Blumentritt, F.; Fritsch, E. Photochromism and photochromic gems: A review and some new data (Part 1). J. Gemmol. 2021, 37, 780–800. [Google Scholar] [CrossRef]
- Blumentritt, F.; Notari, F.; Caplan, C. Properties and colouration of orange hackmanite from Afghanistan. J. Gemmol. 2024, 39, 160–170. [Google Scholar] [CrossRef]
- Colinet, P.; Byron, H.; Vuori, S.; Lehtio, J.-P.; Laukkanen, P.; van Goethem, L.; Lastusaari, M.; le Bahers, T. The structural origin of the efficient photochromism in natural minerals. Proc. Natl. Acad. Sci. USA. 2022, 119, e2202487119. [Google Scholar] [CrossRef] [PubMed]
- Song, C.; Guo, Q.; Liu, Y.; Rao, Y.; Liao, L. Photochromism, UV-Vis, vibrational and fluorescence spectroscopy of differently colored hackmanite. Crystals 2023, 13, 1607. [Google Scholar] [CrossRef]
- Song, C.; Guo, Q.; Wang, Y.; Liao, L. Thermoluminescence characteristics of UV-irradiated natural hackmanite. Thermochim. Acta 2024, 742, 179879. [Google Scholar] [CrossRef]
- Yang, B.; Guo, Q.; Liao, L. A new perspective on the photochromism and polysulfide radical changes in sodalite. Chem. Phys. Lett. 2024, 856, 141631. [Google Scholar] [CrossRef]
- HPC-Cluster Akademik, V.M. Matrosov—Irkutsk Supercomputer Center of SB RAS. Available online: https://hpc.icc.ru/ (accessed on 9 September 2025).
Disclaimer/Publisher’s Note: The statements, opinions and data contained in all publications are solely those of the individual author(s) and contributor(s) and not of MDPI and/or the editor(s). MDPI and/or the editor(s) disclaim responsibility for any injury to people or property resulting from any ideas, methods, instructions or products referred to in the content. |
© 2025 by the authors. Licensee MDPI, Basel, Switzerland. This article is an open access article distributed under the terms and conditions of the Creative Commons Attribution (CC BY) license (https://creativecommons.org/licenses/by/4.0/).