Article

The Thermal Damage Properties of Mudstone, Gypsum and Rock Salt from Yingcheng, Hubei, China

1
State Key Laboratory of Coal Mine Disaster Dynamics and Control, Chongqing University, Chongqing 400030, China
2
Institute of Rock and Soil Mechanics, The Chinese Academy of Science, Wuhan 430071, Hubei, China
*
Author to whom correspondence should be addressed.
Minerals 2015, 5(1), 104-116; https://doi.org/10.3390/min5010104
Submission received: 20 December 2014 / Revised: 3 March 2015 / Accepted: 3 March 2015 / Published: 12 March 2015

Abstract

:
The impacts of temperature on the surface thermal damage of rock salt, gypsum and mudstone from the Yingcheng salt mine, China were investigated by the surface crack growth and propagation tests at different temperatures. We found that: (a) high temperature could strengthen the rock salt molecular thermal motion and weaken the cohesion among the rock salt grains, so that the grain boundaries were more prone to slip and thus develop into cracks; (b) high temperature could make the water molecules evaporate from rock specimens, which should change the physical properties of gypsum and mudstone; and (c) high temperature had a significant effect on the interface between rock salt and gypsum and mudstone, therefore it should be easy to produce cracks with white or light yellow cumulate powder here. The surface crack growth and propagation of the rock salt, gypsum and mudstone have a positive correlation with the temperature by stereo microscope and the method of binary images, which could observe the surface thermal damage properties. Finally, the fractal dimension of the rock salt surface cracks was calculated based on fractal theory, and the evolution of the surface thermal damage was found from 50 to 260 °C.

1. Introduction

Underground cavities leached in salt domes and salt beds have been used extensively for storing hydrocarbons in America, Canada, and Europe [1,2,3,4]. The mechanical behavior of natural rock salt has been investigated experimentally, and it was found that rock salt has good creep, self-healing and low permeability properties [5,6,7,8]. This makes it a good candidate for storage of gas, crude oil and radioactive waste. The rock salt formations in China are usually laminated with alternations of rock salt and mud rock layers [9,10,11]. The presence of mudstone in rock salts had a significant influence on the mechanical properties and failure patterns of the rock salt. The hard mud rocks in rock salt formations enhances the stiffness and strength of the composite [12,13]. The depth of most rock salt storages worldwide is over 1000 m, and the corresponding ambient temperature is above 50 °C. What’s more, the rock salt repository of the nuclear waste will bear a high temperature of 250~400 °C, caused by the decay of isotopes [14,15,16,17]. So for the safety of the rock salt repository, it is important to study the thermal damage of the rock salt.
Recently, many reports regarding the thermal damage of different rocks have appeared. Zuo et al. [18] used scanning electron microscope (SEM) to study the mesoscopic forms of sandstone at various temperatures and pressures. They found that there was no thermal crack in the sandstone when the temperature was lower than 150 °C, but there were many random thermal cracks when the temperature exceeded 200 °C [18]. Horseman [19] used SEM to study the thermal damage of two different particle size granite from 20 to 600 °C, and analyze the length, width, shape, density and species of cracks. It was found that the extension of crack length was less than crack width. Chen [20] used ultrasound, uniaxial and triaxial mechanical tests to study the thermal damage of rock salt. It’s found that the peak strength, elastic modulus and ultrasonic velocity of rock salt decreased with the increase of temperature and there were microcracks, which were along or through the rock salt particles.
However, there is limited knowledge on the surface thermal damage of rock salt intercalated by gypsum and mudstone. The Yingcheng Salt mine in China is characterized by bedded rock salt intercalated by gypsum and mudstone. Because this mine is considered as a potential future storage facility for gas, oil or nuclear waste, it is necessary to evaluate the thermal behavior of its salt rock strata. The aim of this paper is to investigate the impact of the temperature on the surface thermal damage of the impure rock salt from the Yingcheng mine, by establishing a model relating the evolution of the surface thermal damage at temperatures from 50 to 260 °C.

2. Experimental Section

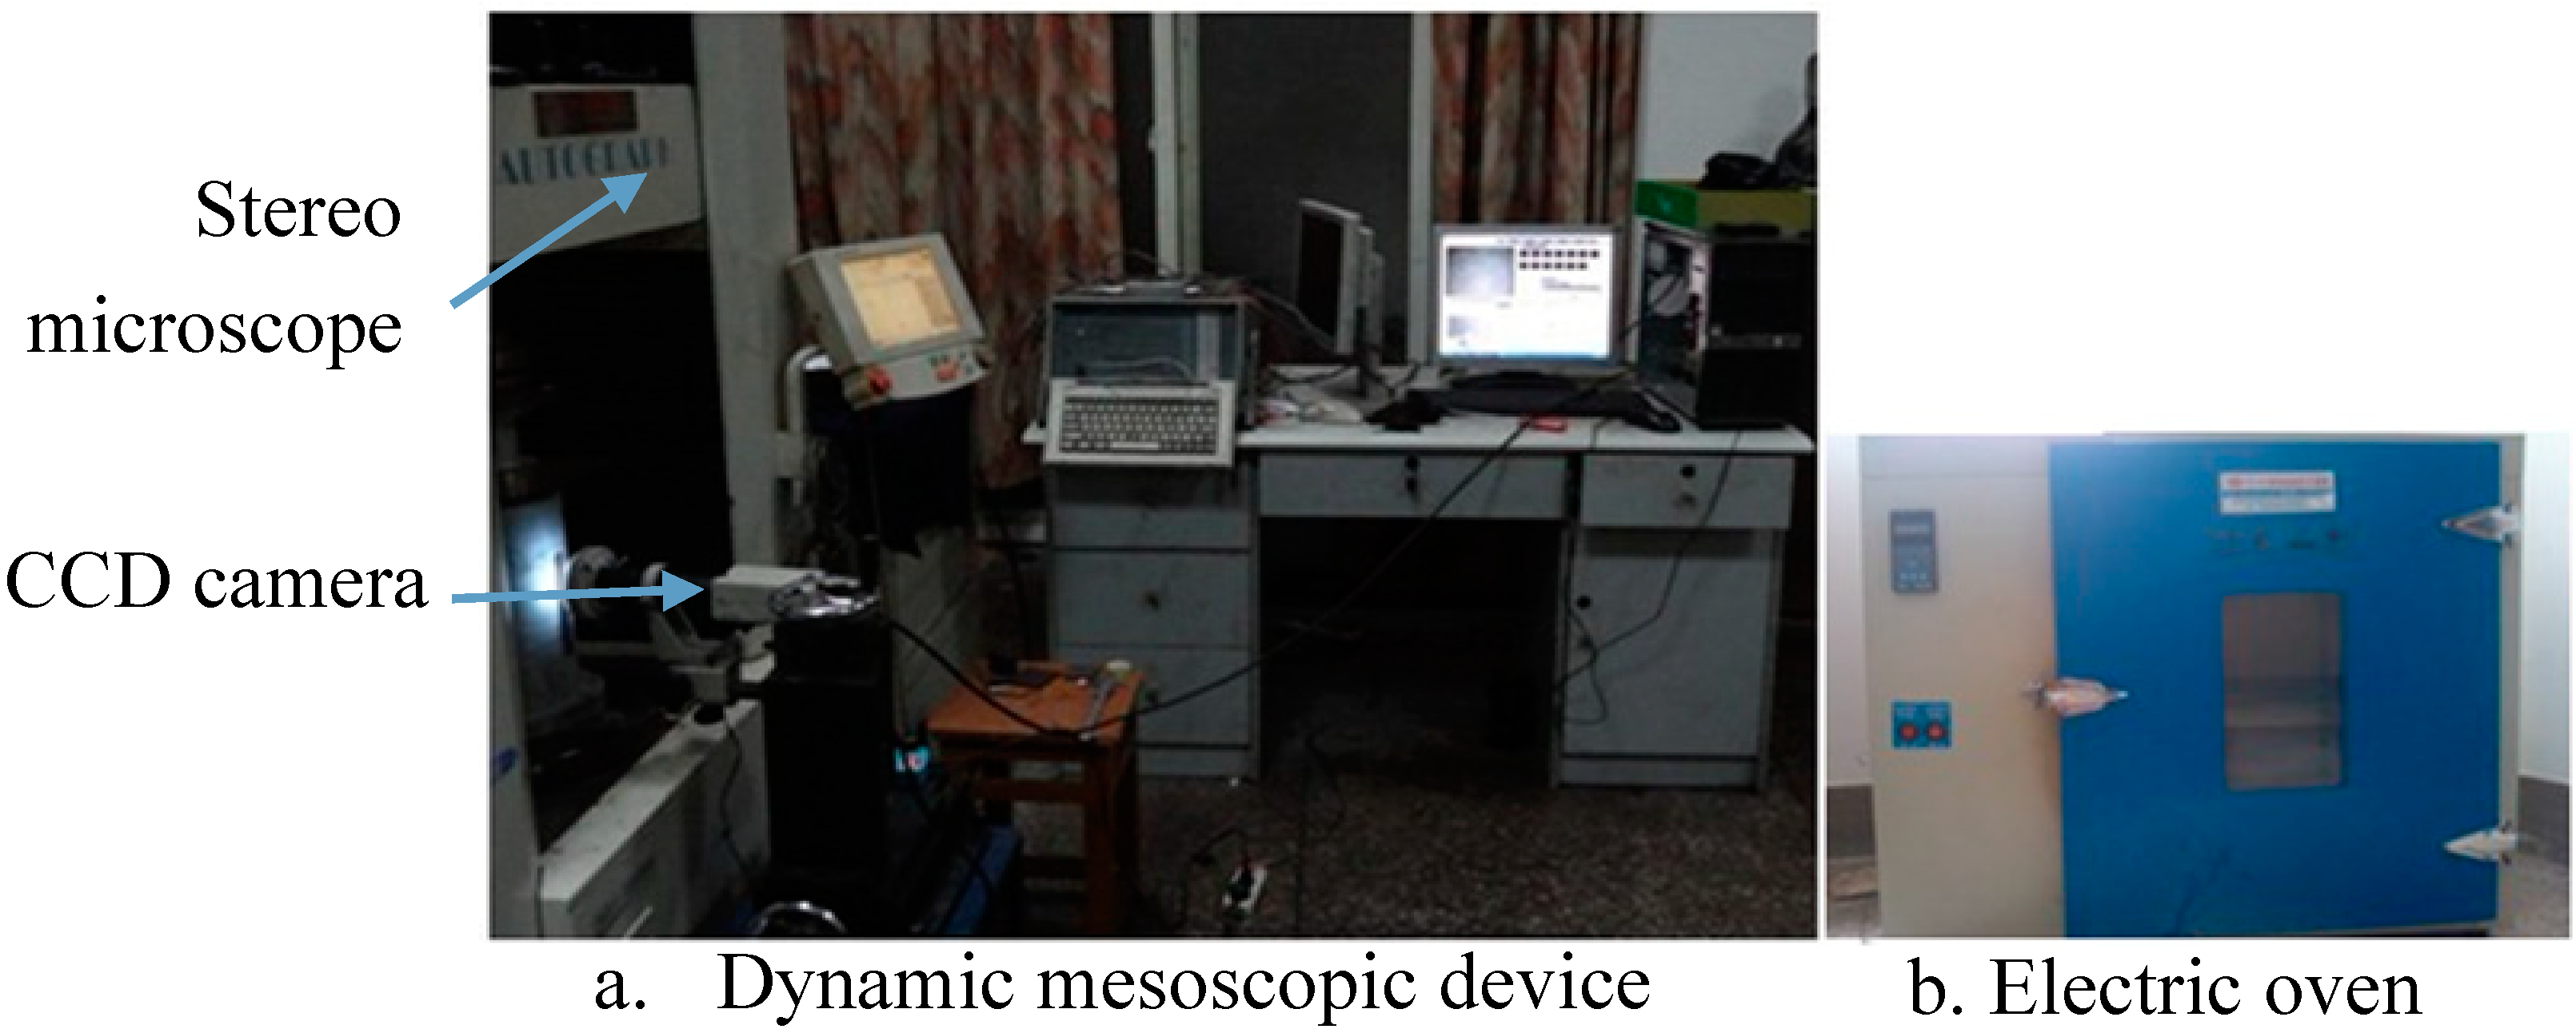
2.1. Test Equipment and Analysis Software

The test equipment include the ZY101 electric oven (Jinrui Company, Jiangsu, China), and the dynamic mesoscopic device (Figure 1). The dynamic mesoscopic device is mainly composed of the stereomicroscope and the charge-coupled-device (CCD) camera. The analyses software were MATLAB (The MathWorks, Natick, MA, USA) and Fractalfox2.0.
Figure 1. Test equipment.
Minerals 05 00104 g001

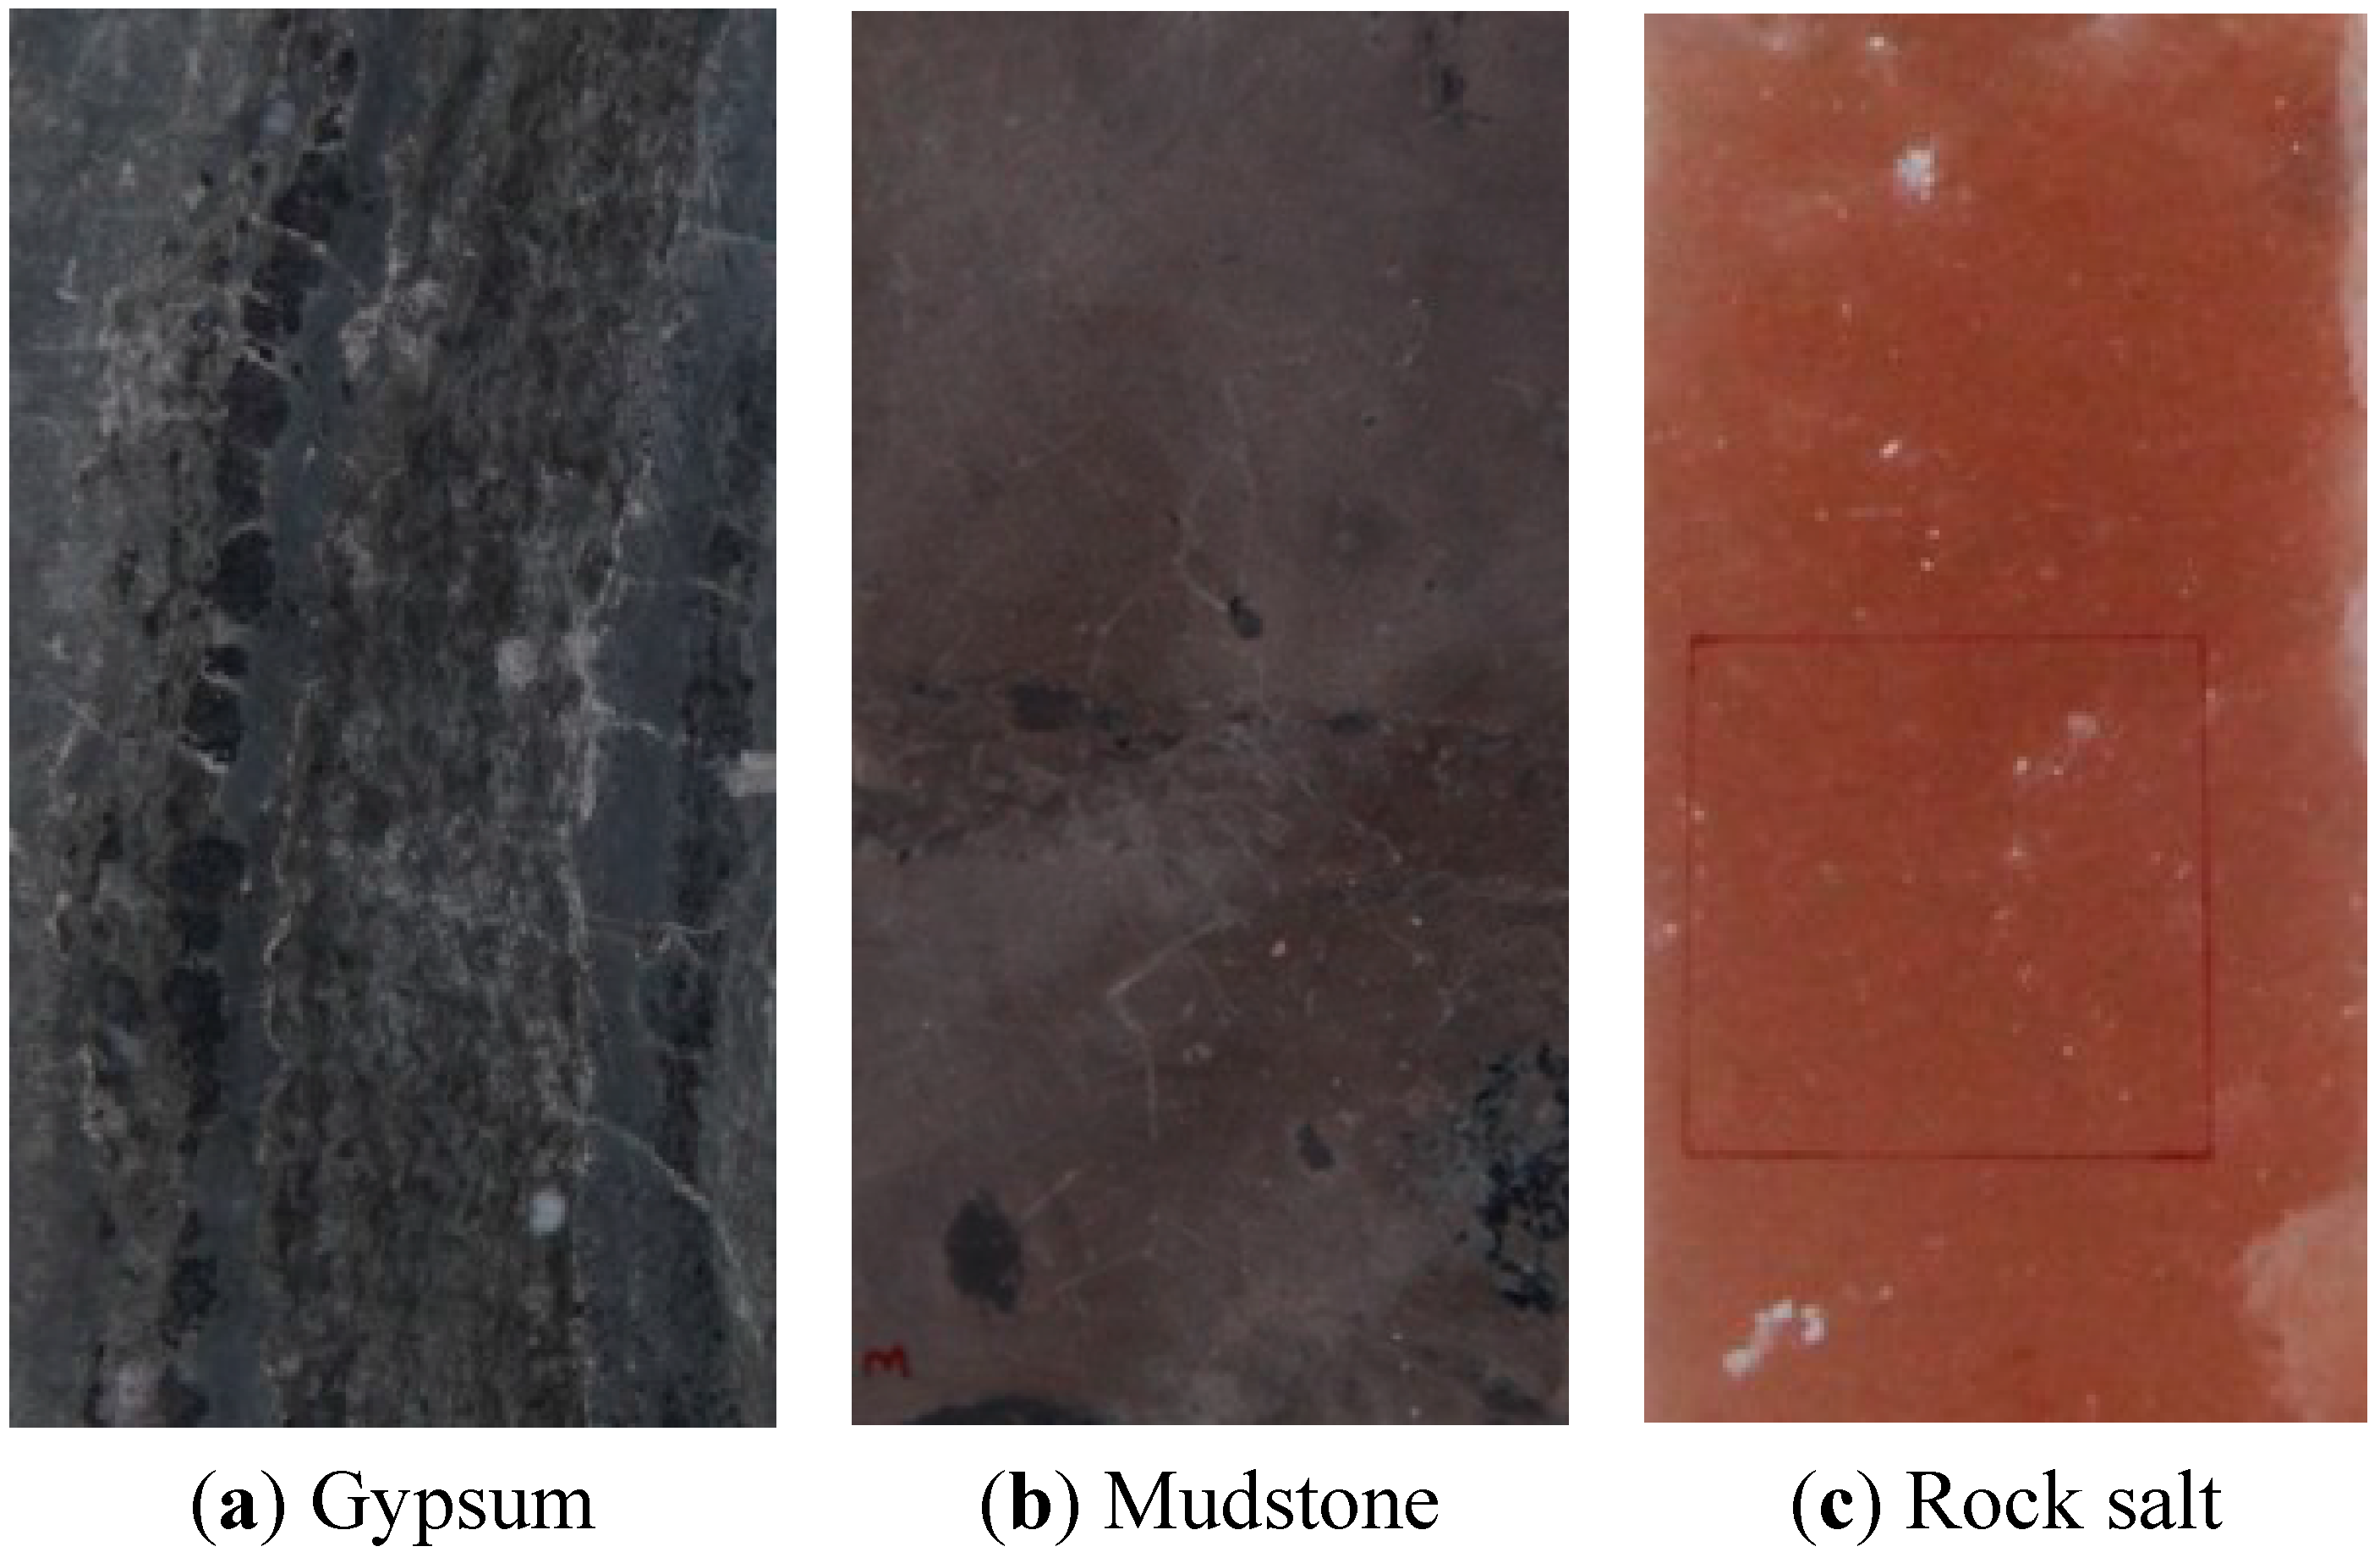
2.2. Preparation of the Test Samples

The rock salt specimens were pink, transparent and compact. The soluble content ranged from 96.3%–99.8% (soluble substances mainly NaCl, Na2SO4) and the insoluble compositions were mainly argillic minerals (same salt specimens from the Khewra salt mine, Pakistan). The gypsum and mudstone specimens were taken from Yingcheng, Hubei, China (Figure 2). All test samples were processed preliminarily by grinding machine, and then the surface was polished by fine sandpaper.
Figure 2. Specimens of gypsum, mudstone and rock salt.
Minerals 05 00104 g002

2.3. Experimental Procedure

The specimens were sealed at room temperature (18.5 °C) before test. In order to avoid the influence of water in the test specimen, before the test processed specimens were put into an oven at 30 °C for 48 h, and then took them out for photographing. The pictures were used at the original contrast. During the test, we put all specimens into an oven preheated to the predetermined temperature for 24 h, then took them out for cooling and took photos in the fixed area with a high definition camera. Next, we used the MATLAB and the Fractalfox2.0 to deal with the surface cracks of rock salt and to find the relationship between temperature and the surface damage of rock salt. The gypsum and mudstone specimens were photographed in the fixed area by stereomicroscope and the gypsum and mudstone specimens surface changes were analyzed comparatively. The initial test temperature was set at 50 °C. Using a temperature gradient of 30 °C, the final temperature was 260 °C. As the test specimens were difficult to obtain and process, there were only three specimens for the same rock group and the evolution of damage at different temperatures could be analyzed by comparative observation.

3. Results and Discussion

3.1. Changes Caused by Temperature on the Gypsum and Mudstone Surface

High temperature can affect mudstone and gypsum physical properties significantly. During the test, the most obvious influence was that at high temperatures mudstone and gypsum would lose crystal water under appearance of cracks on the surface, so that the surface color became weaker and its brittleness enhanced. If the rate of water loss was too fast, it would destroy the mudstone structure directly. A mudstone specimen heated to 200 °C quickly, would lead to uneven deformation of its interior and as a result, the mudstone to burst. These lead to the rate and extent of its interior uneven deformation and made the mudstone burst.
Mudstone is a kind of claystone. Gypsum is a mineral that mainly consists of calcium sulfate. During the test, both samples would separate out precipitates of calcium compounds at high temperature. These salt precipitates would be formed on the surface as adsorbed white films (Figure 3 and Figure 4). In addition, high temperature could further expand the original structural defects on the surface and develop into cracks. It could be observed by taking advantage of the dynamic mesoscopic device. White powder (calcium oxide) could be seen due to oxidation reaction under high temperature condition, and many tiny cracks formed at 260 °C (Figure 3 and Figure 4). This showed that high temperature had a significant effect on the physical property of the gypsum and mudstone.
Figure 3. Thermal damage cracks of mudstone under high temperature.
Minerals 05 00104 g003
Figure 4. Thermal damage cracks of gypsum under high temperature.
Minerals 05 00104 g004

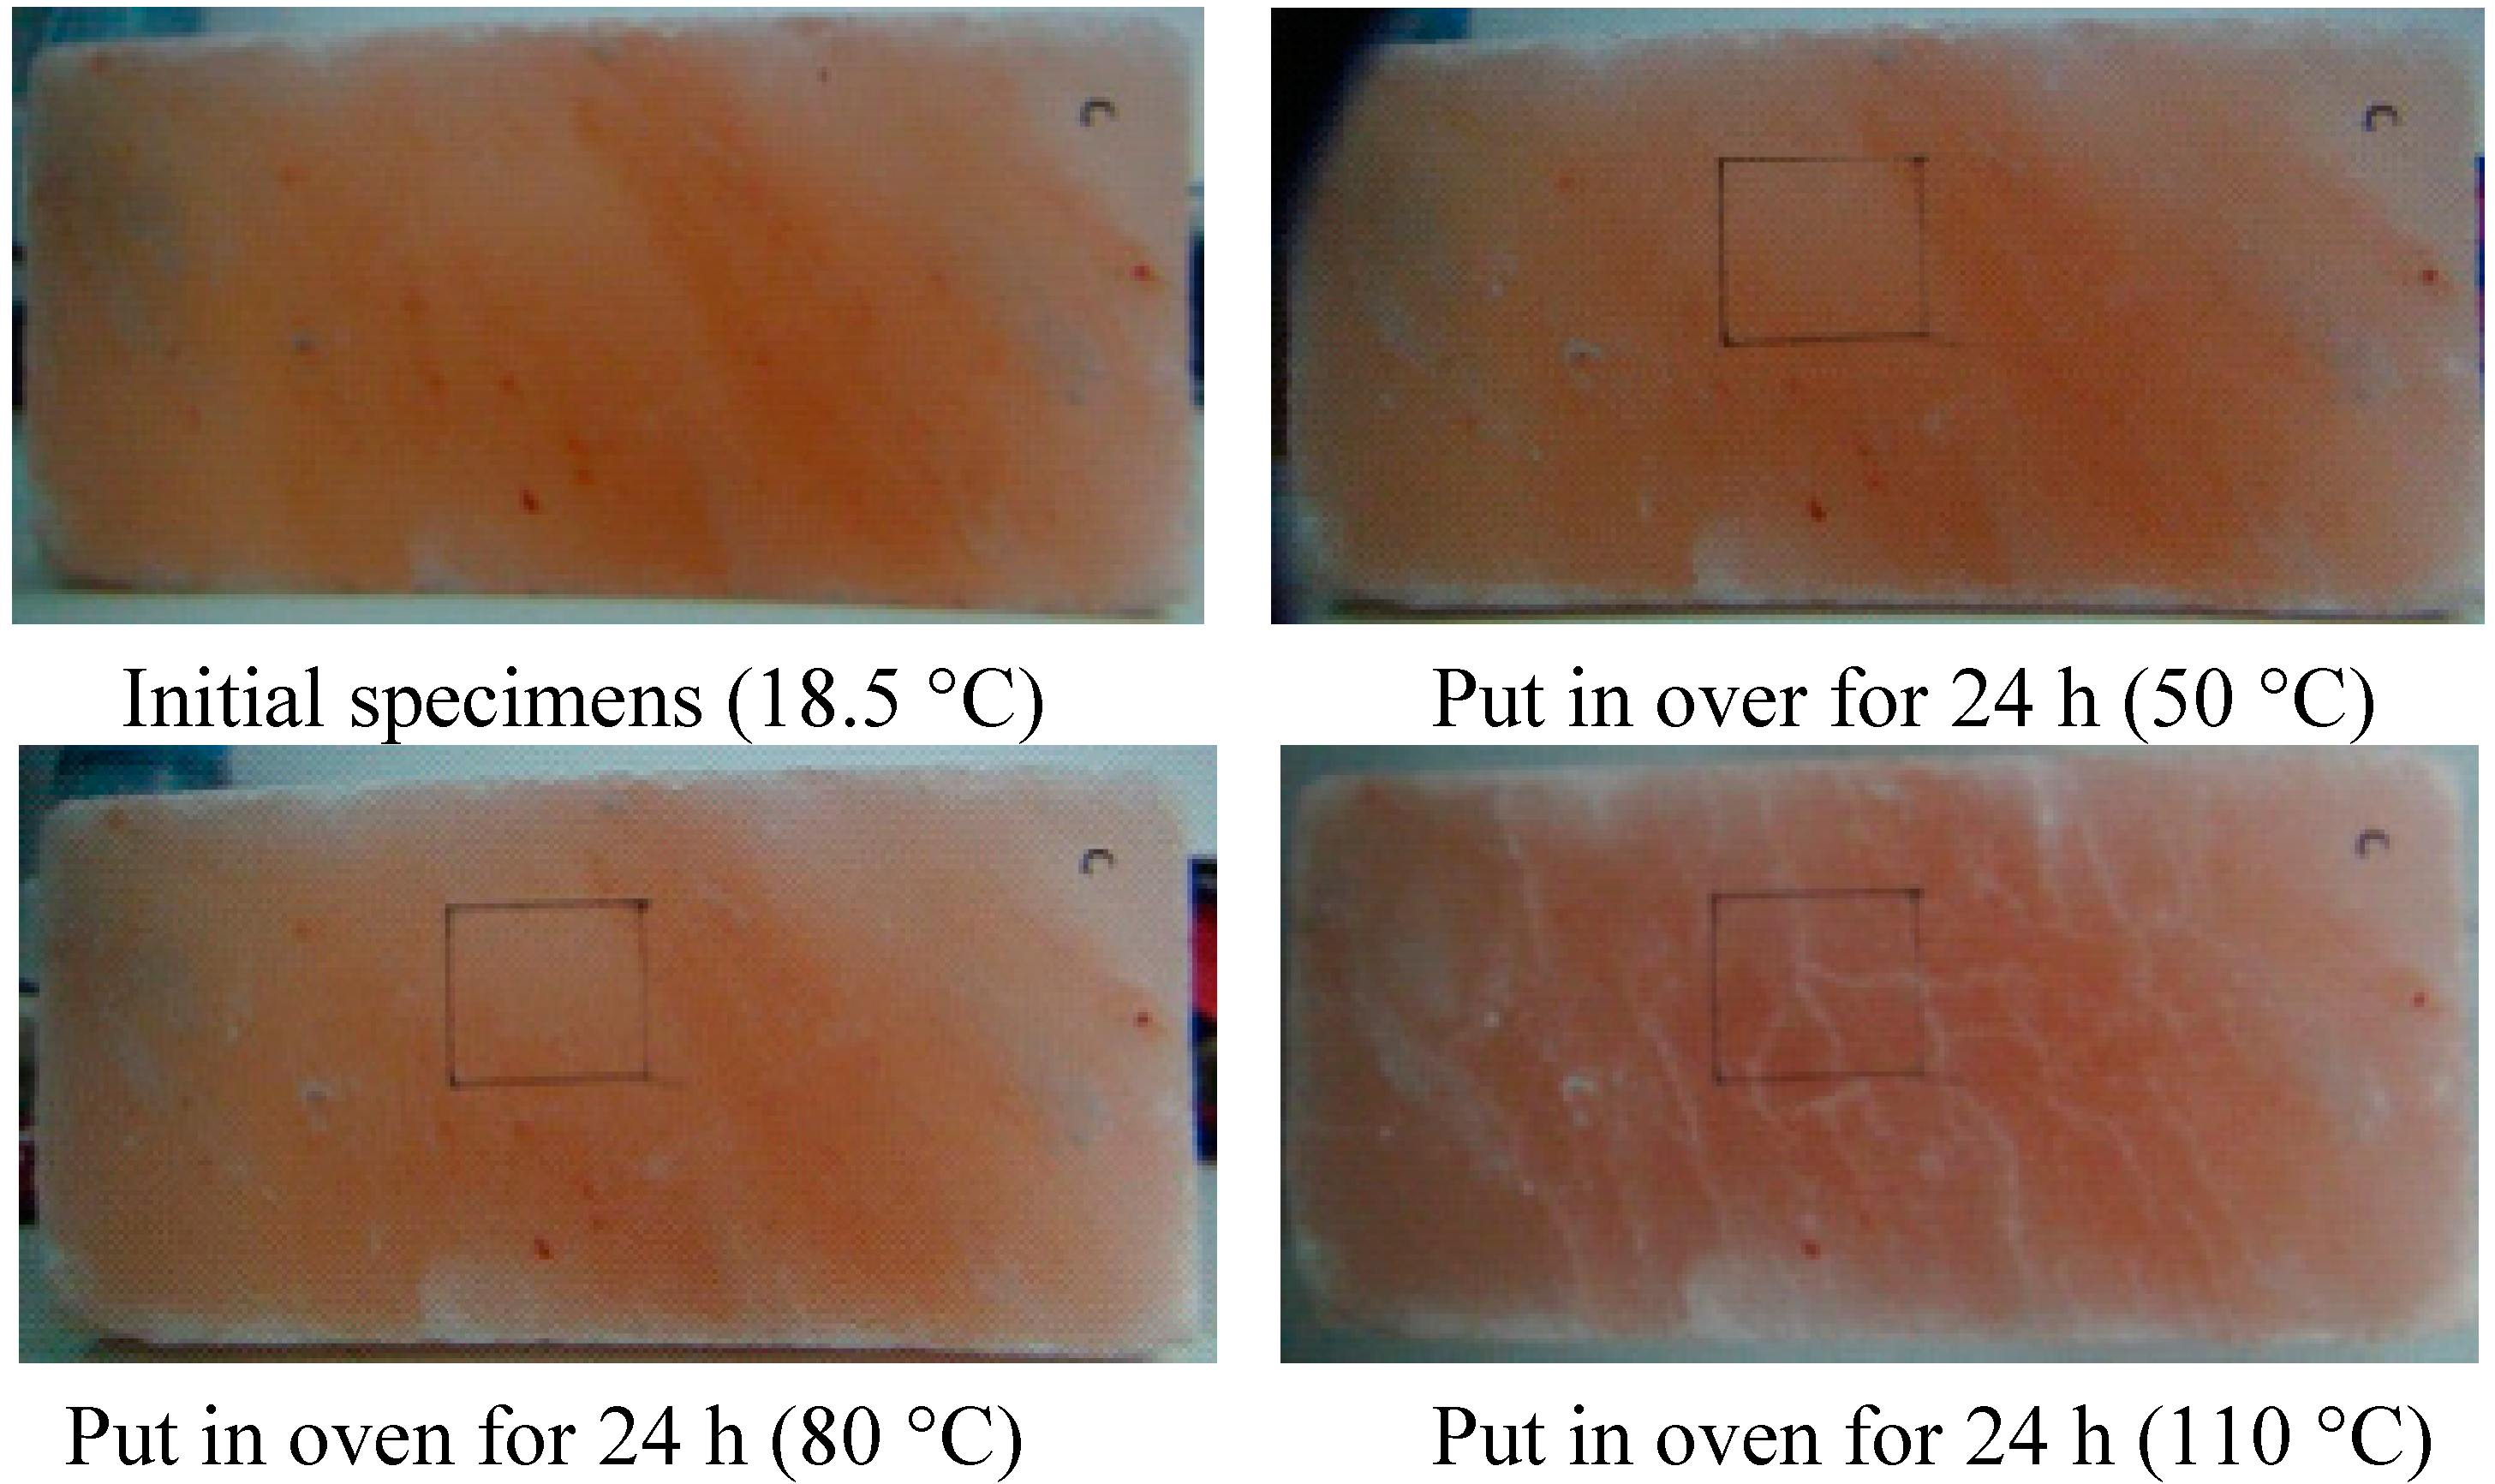
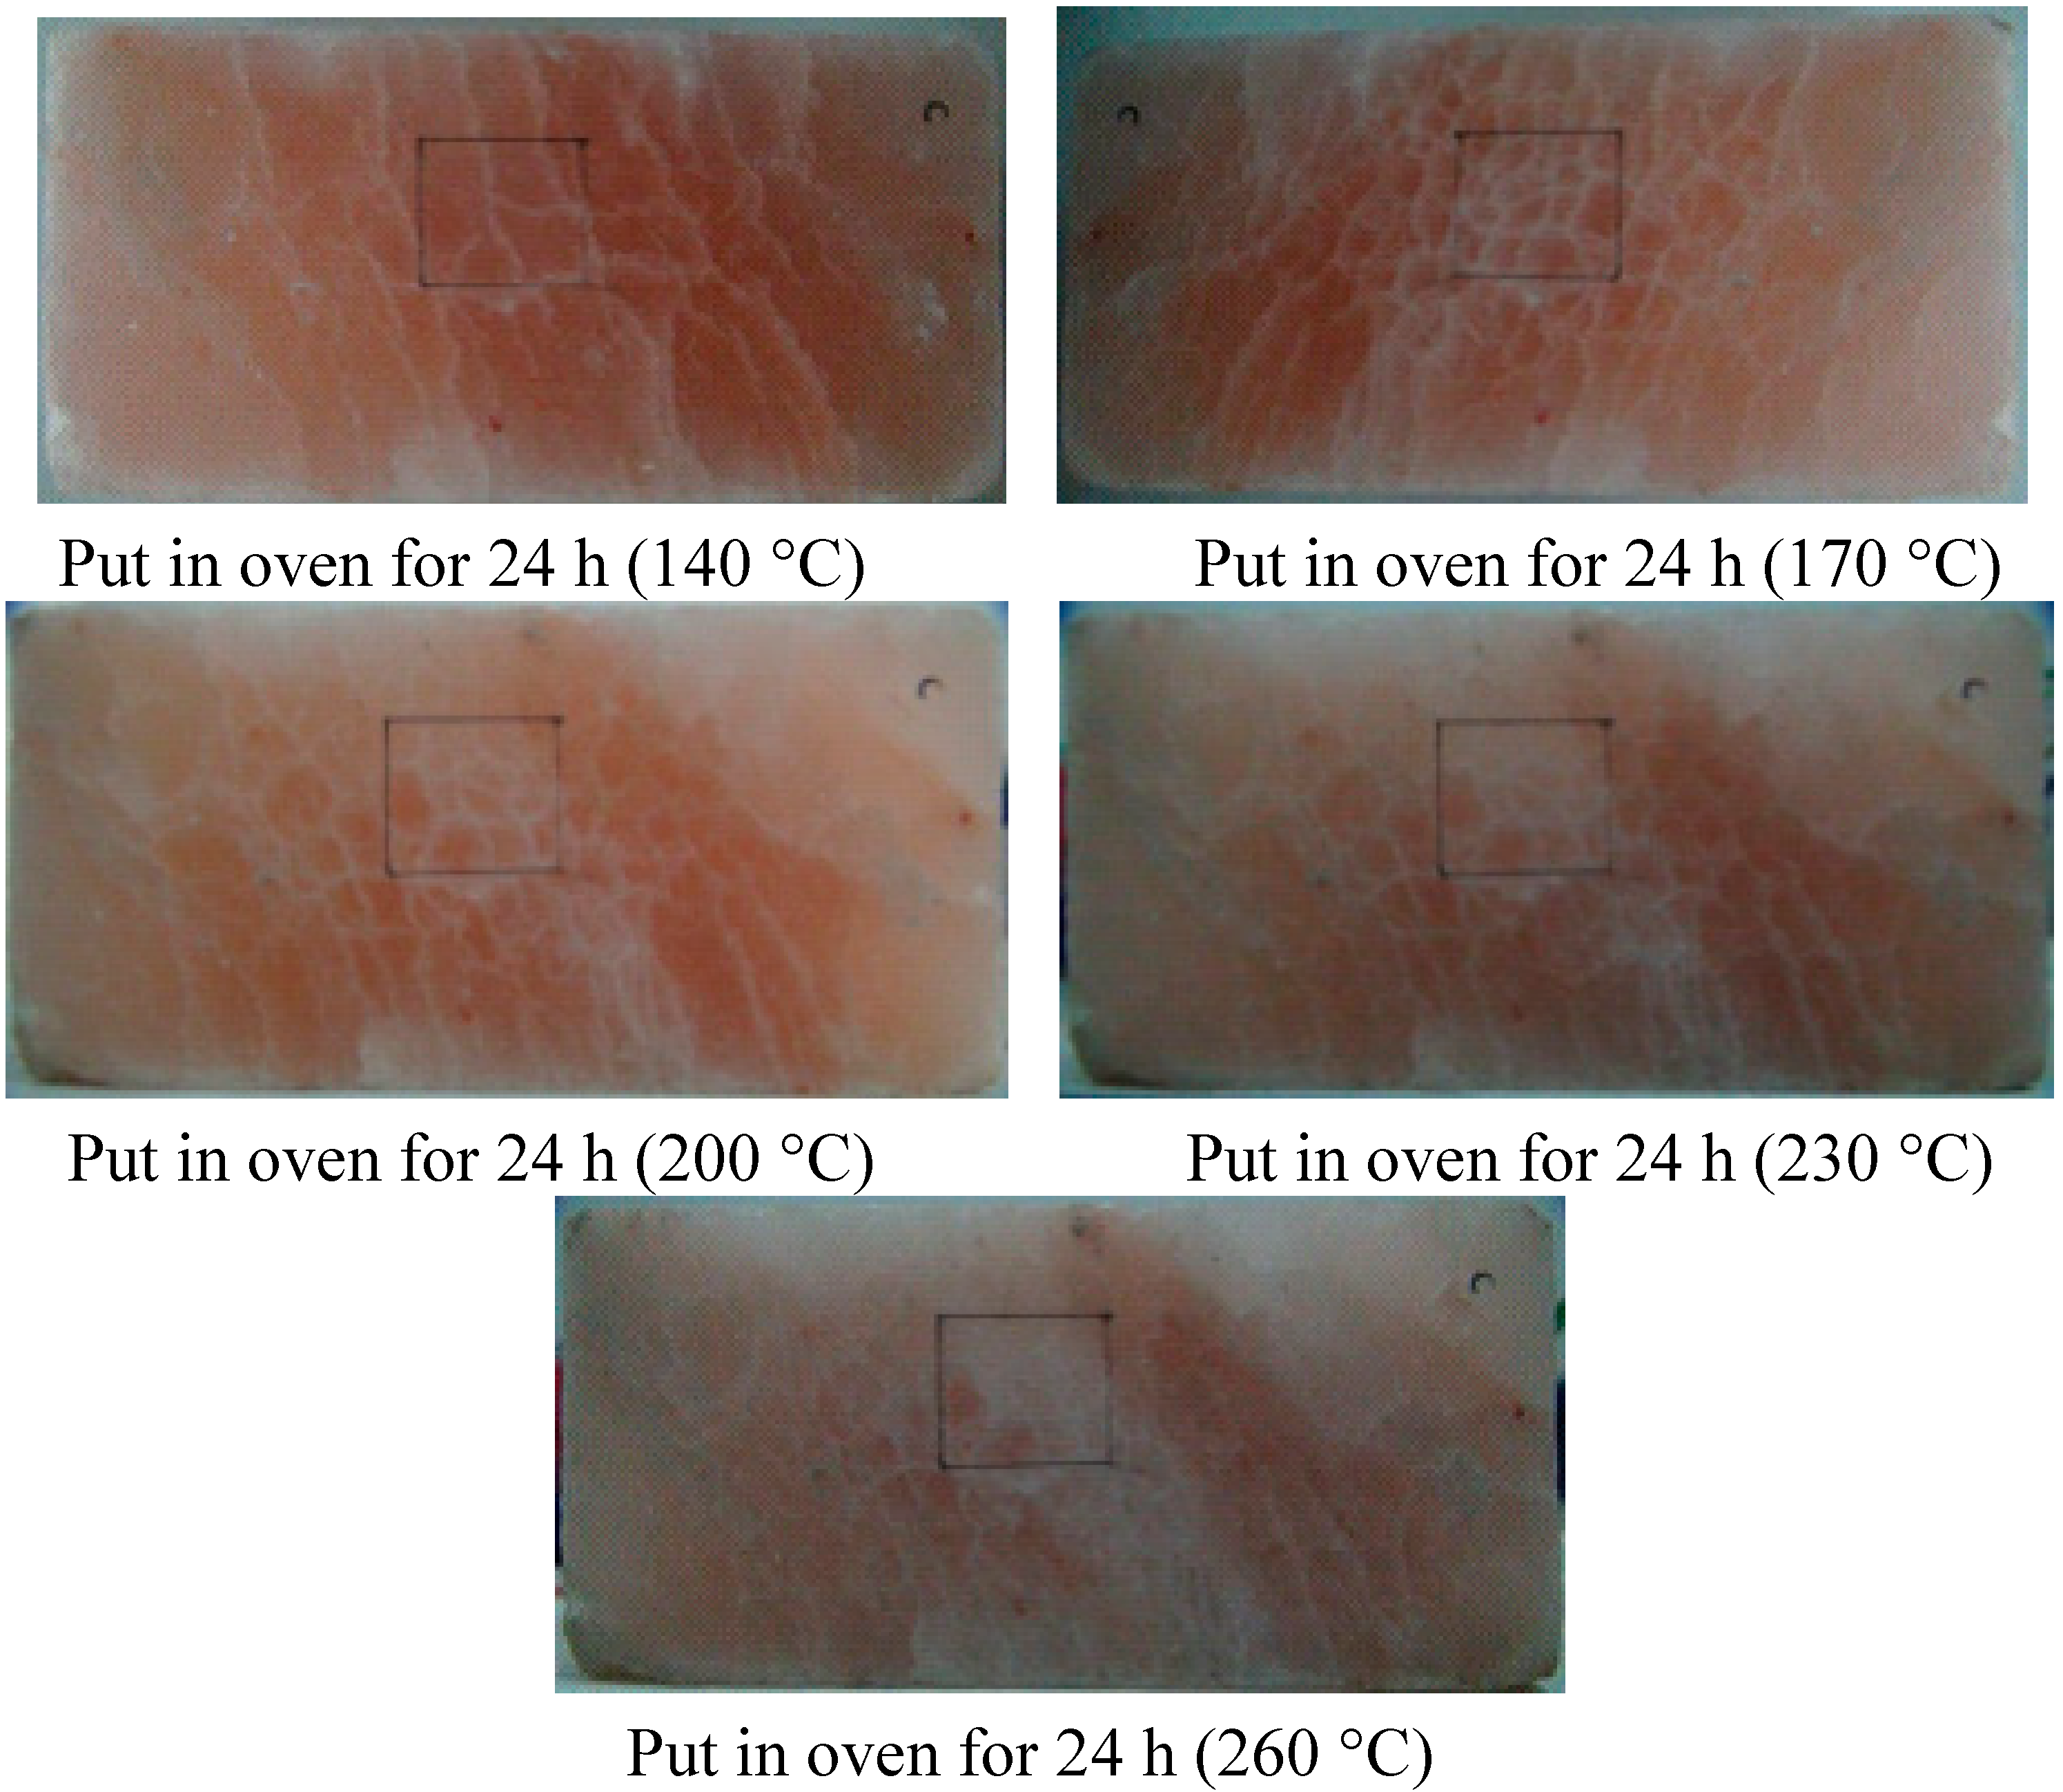
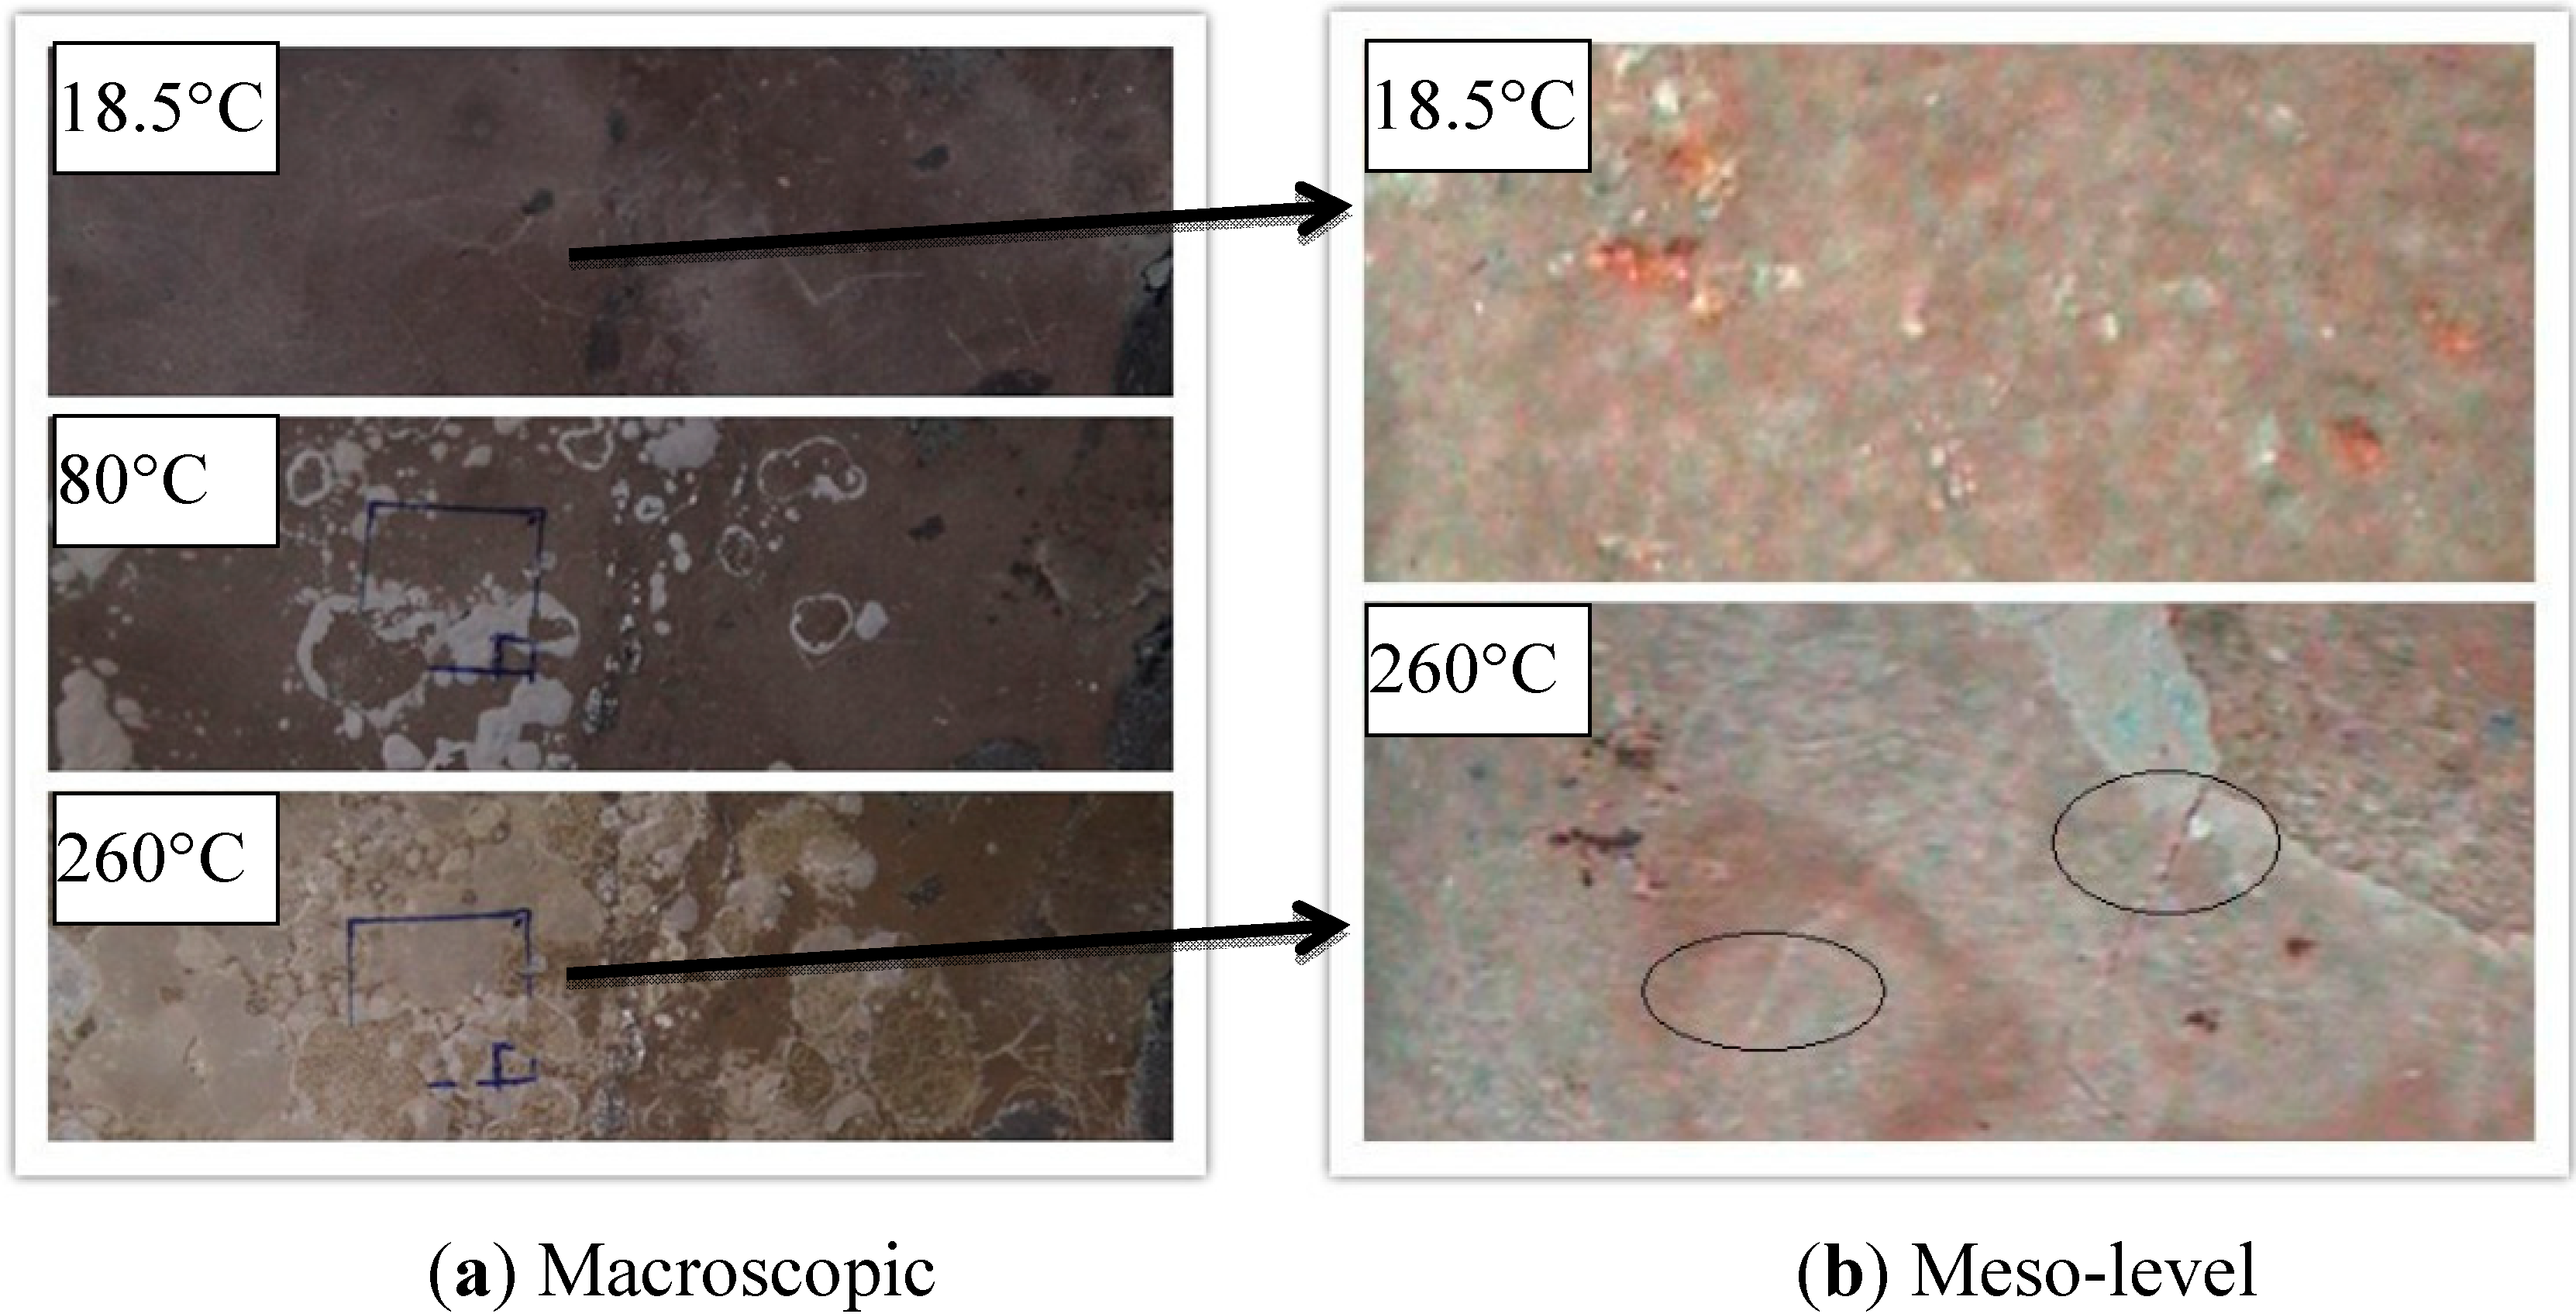
3.2. Analysis of Cracks on Rock Salt Surface

At the beginning of 50 and 80 °C, the dislocation of crystalline grains of rock salt almost do not occur, but tiny microcracks appeared on the rock salt surface, which were difficult to observe. The thermal damage was not obvious at this moment. After heating to 110 °C, the thermal motion of molecules of the rock salt was enhanced and the cohesion among crystalline grains was weak, so that the grain boundaries were prone to slip and the microcracks began to expand and become some long cracks, which run through several grain boundaries. After a further heating, the long cracks developed randomly until they covered the entire surface of the rock salt. Upon further heating, the thermal motion of molecules of the rock salt was more intense and the damaging effect of thermal stress became stronger, so that the long cracks on the surface of rock salt linked up with each other and finally, all the cracks jointly formed a crack region. The crack distributions on rock salt surface at various temperatures are shown in Figure 5.
Figure 5. Comparison of the thermal damage cracks on the surface of rock salt in a given temperature region: 18.5, 50, 80, 110, 140, 170, 200, 230 and 260 °C.
Minerals 05 00104 g005aMinerals 05 00104 g005b

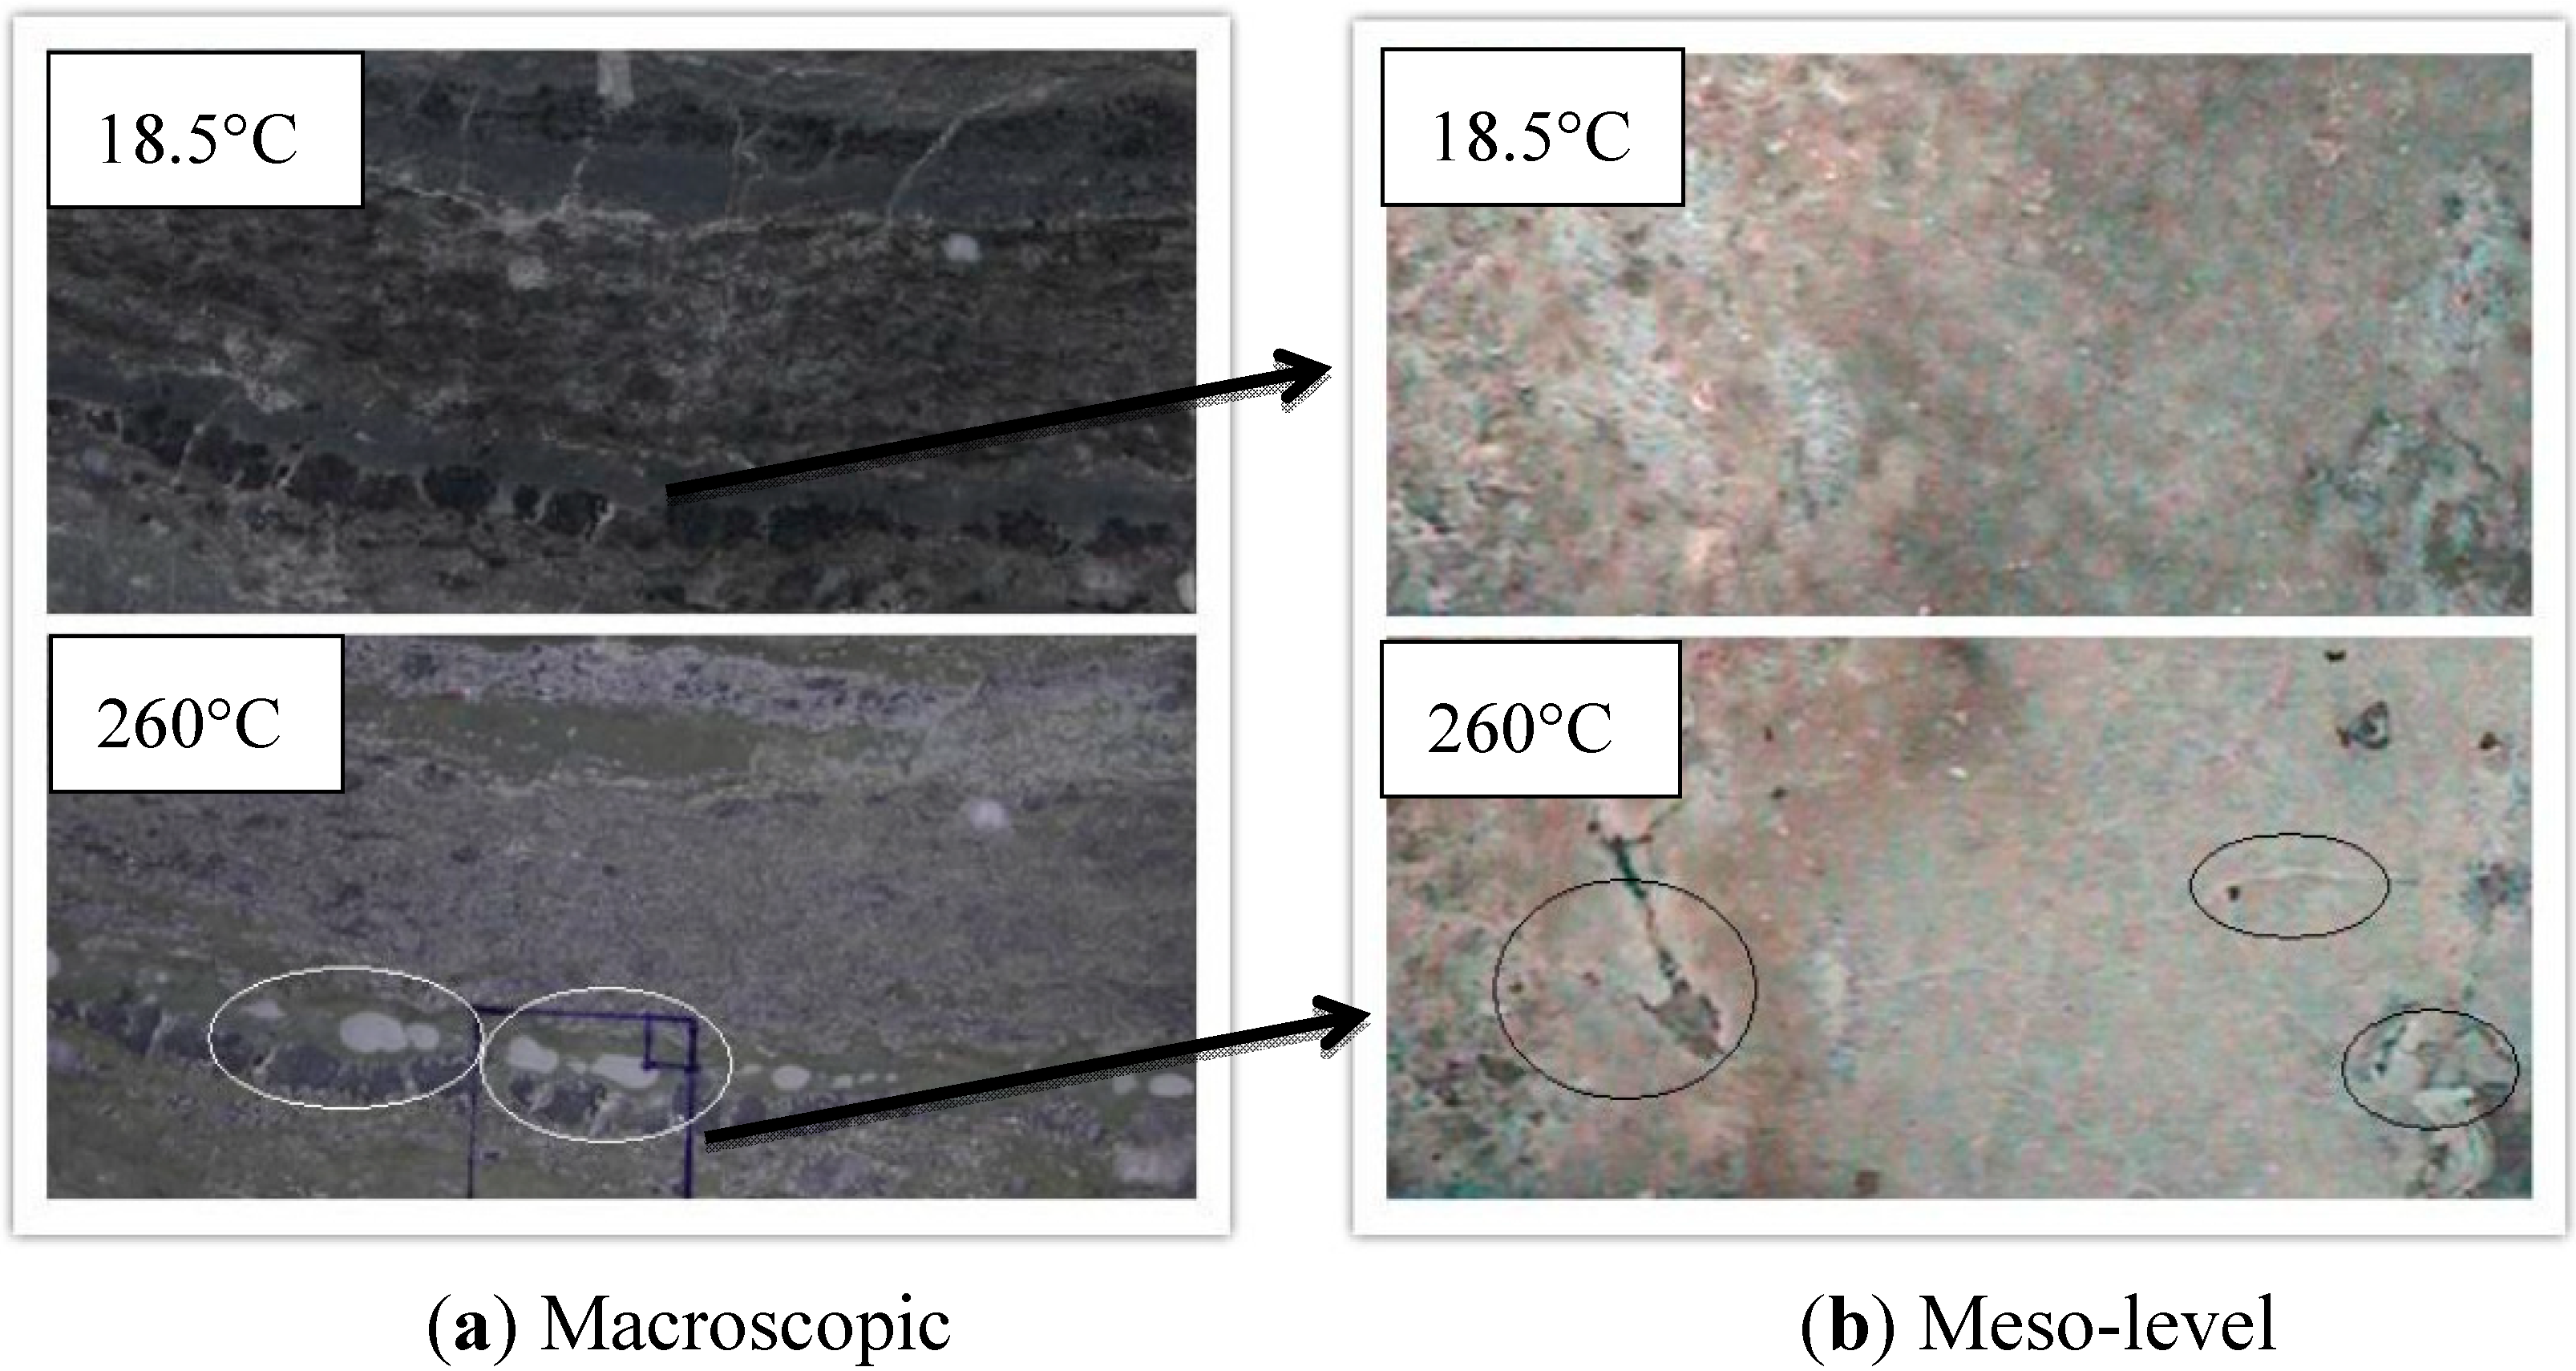
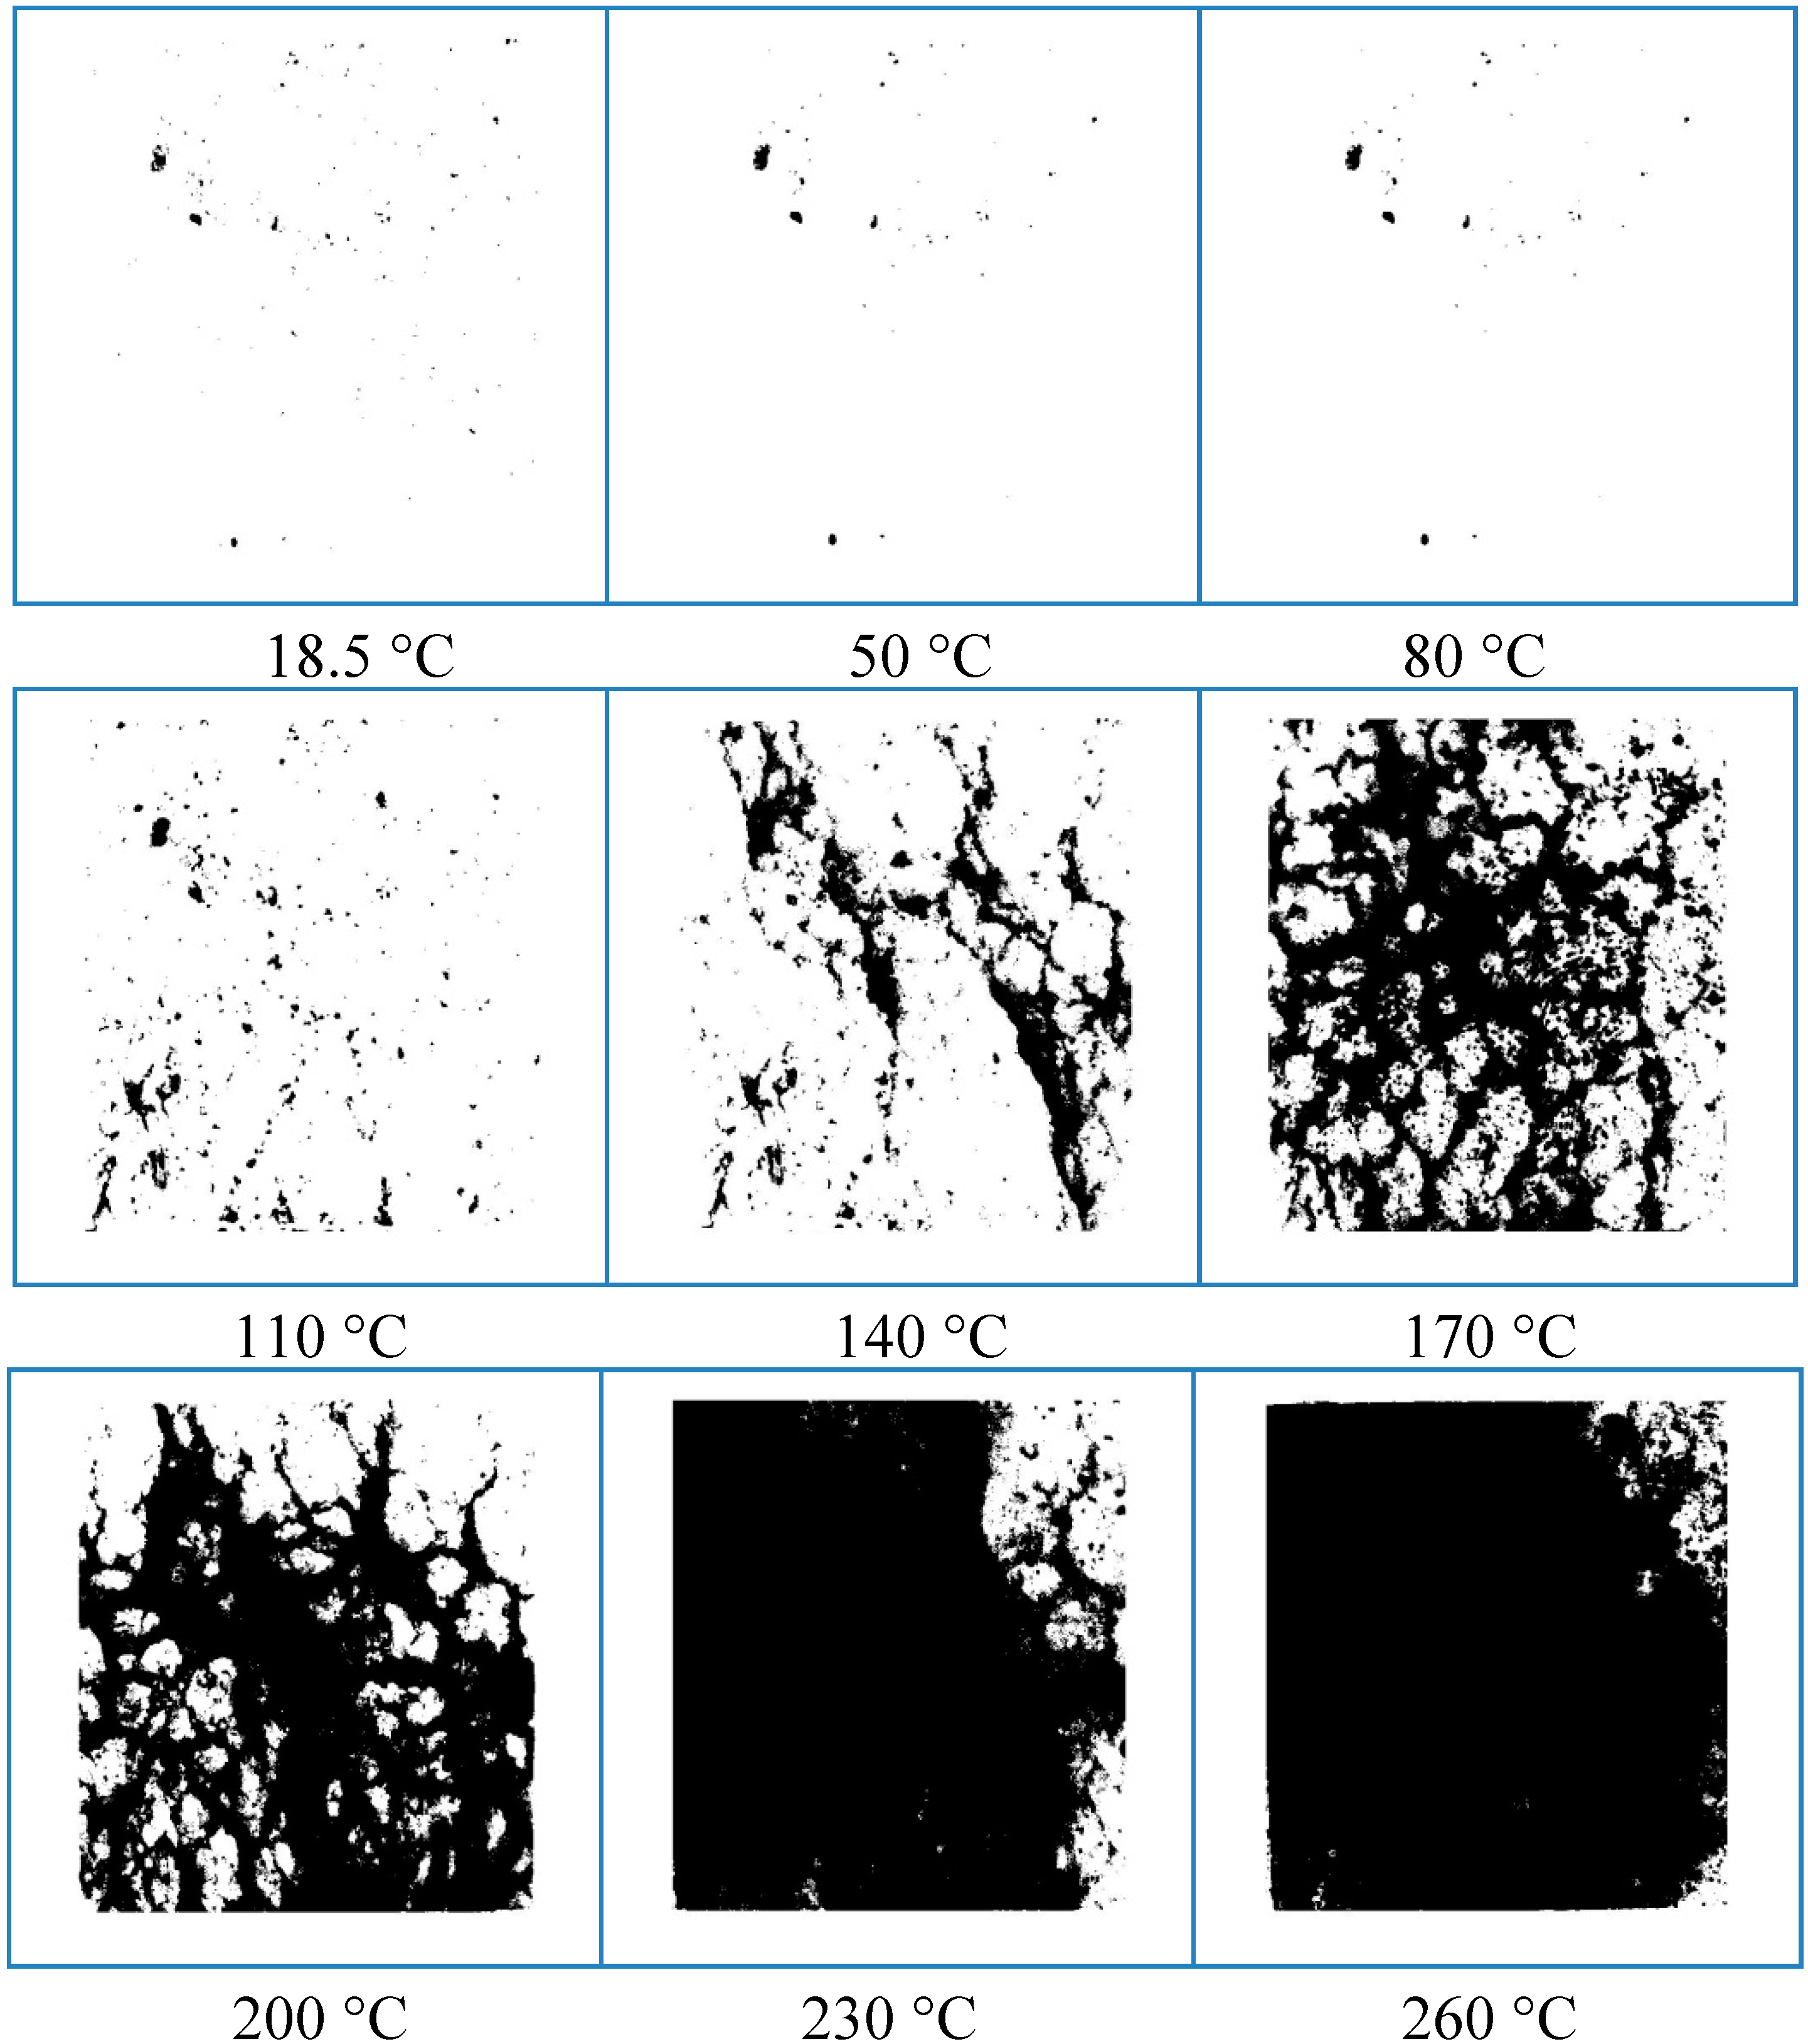
3.3. Microscopic Analysis of the Cracks of Rock Salt during the Heating Process

The cracks in the rock salt are almost always formed by the dislocation among crystalline grains. This dislocation occurs mainly at the grain boundaries, which are constituted by the difference of intercrystalline orientation during the diagenetic process of rock salt. The permutation of particles on the grain boundary is a transition state and it is different from the permutation of the two crystalline grains. The permutation of particles on some grain boundaries of large angles is even close to the state of disorder and it is a high-energy crystalline planar defect, which can adsorb foreign particles [21]. During the heating process, atoms on the surface of rock salt obtain large energy, so that its kinetic energy and amplitude become bigger. The schottky defect is existed in a crystal lattice, sodium chloride. It only occurs when there is a small difference in size between cations and anions. This is produced as the result of the thermal incorporation of unoccupied lattice sites from the exterior of the crystal [22]. The thermal defect and the dislocation movement in grain boundaries were more intense, and thus developed into cracks. In addition, thermal expansion coefficients of a variety of mineral particles are different, and thermal elastic properties of anisotropic minerals particles in rock salt are also different. Differences in thermal behavior could result in the grain boundaries expanding unequally and developing cracks.

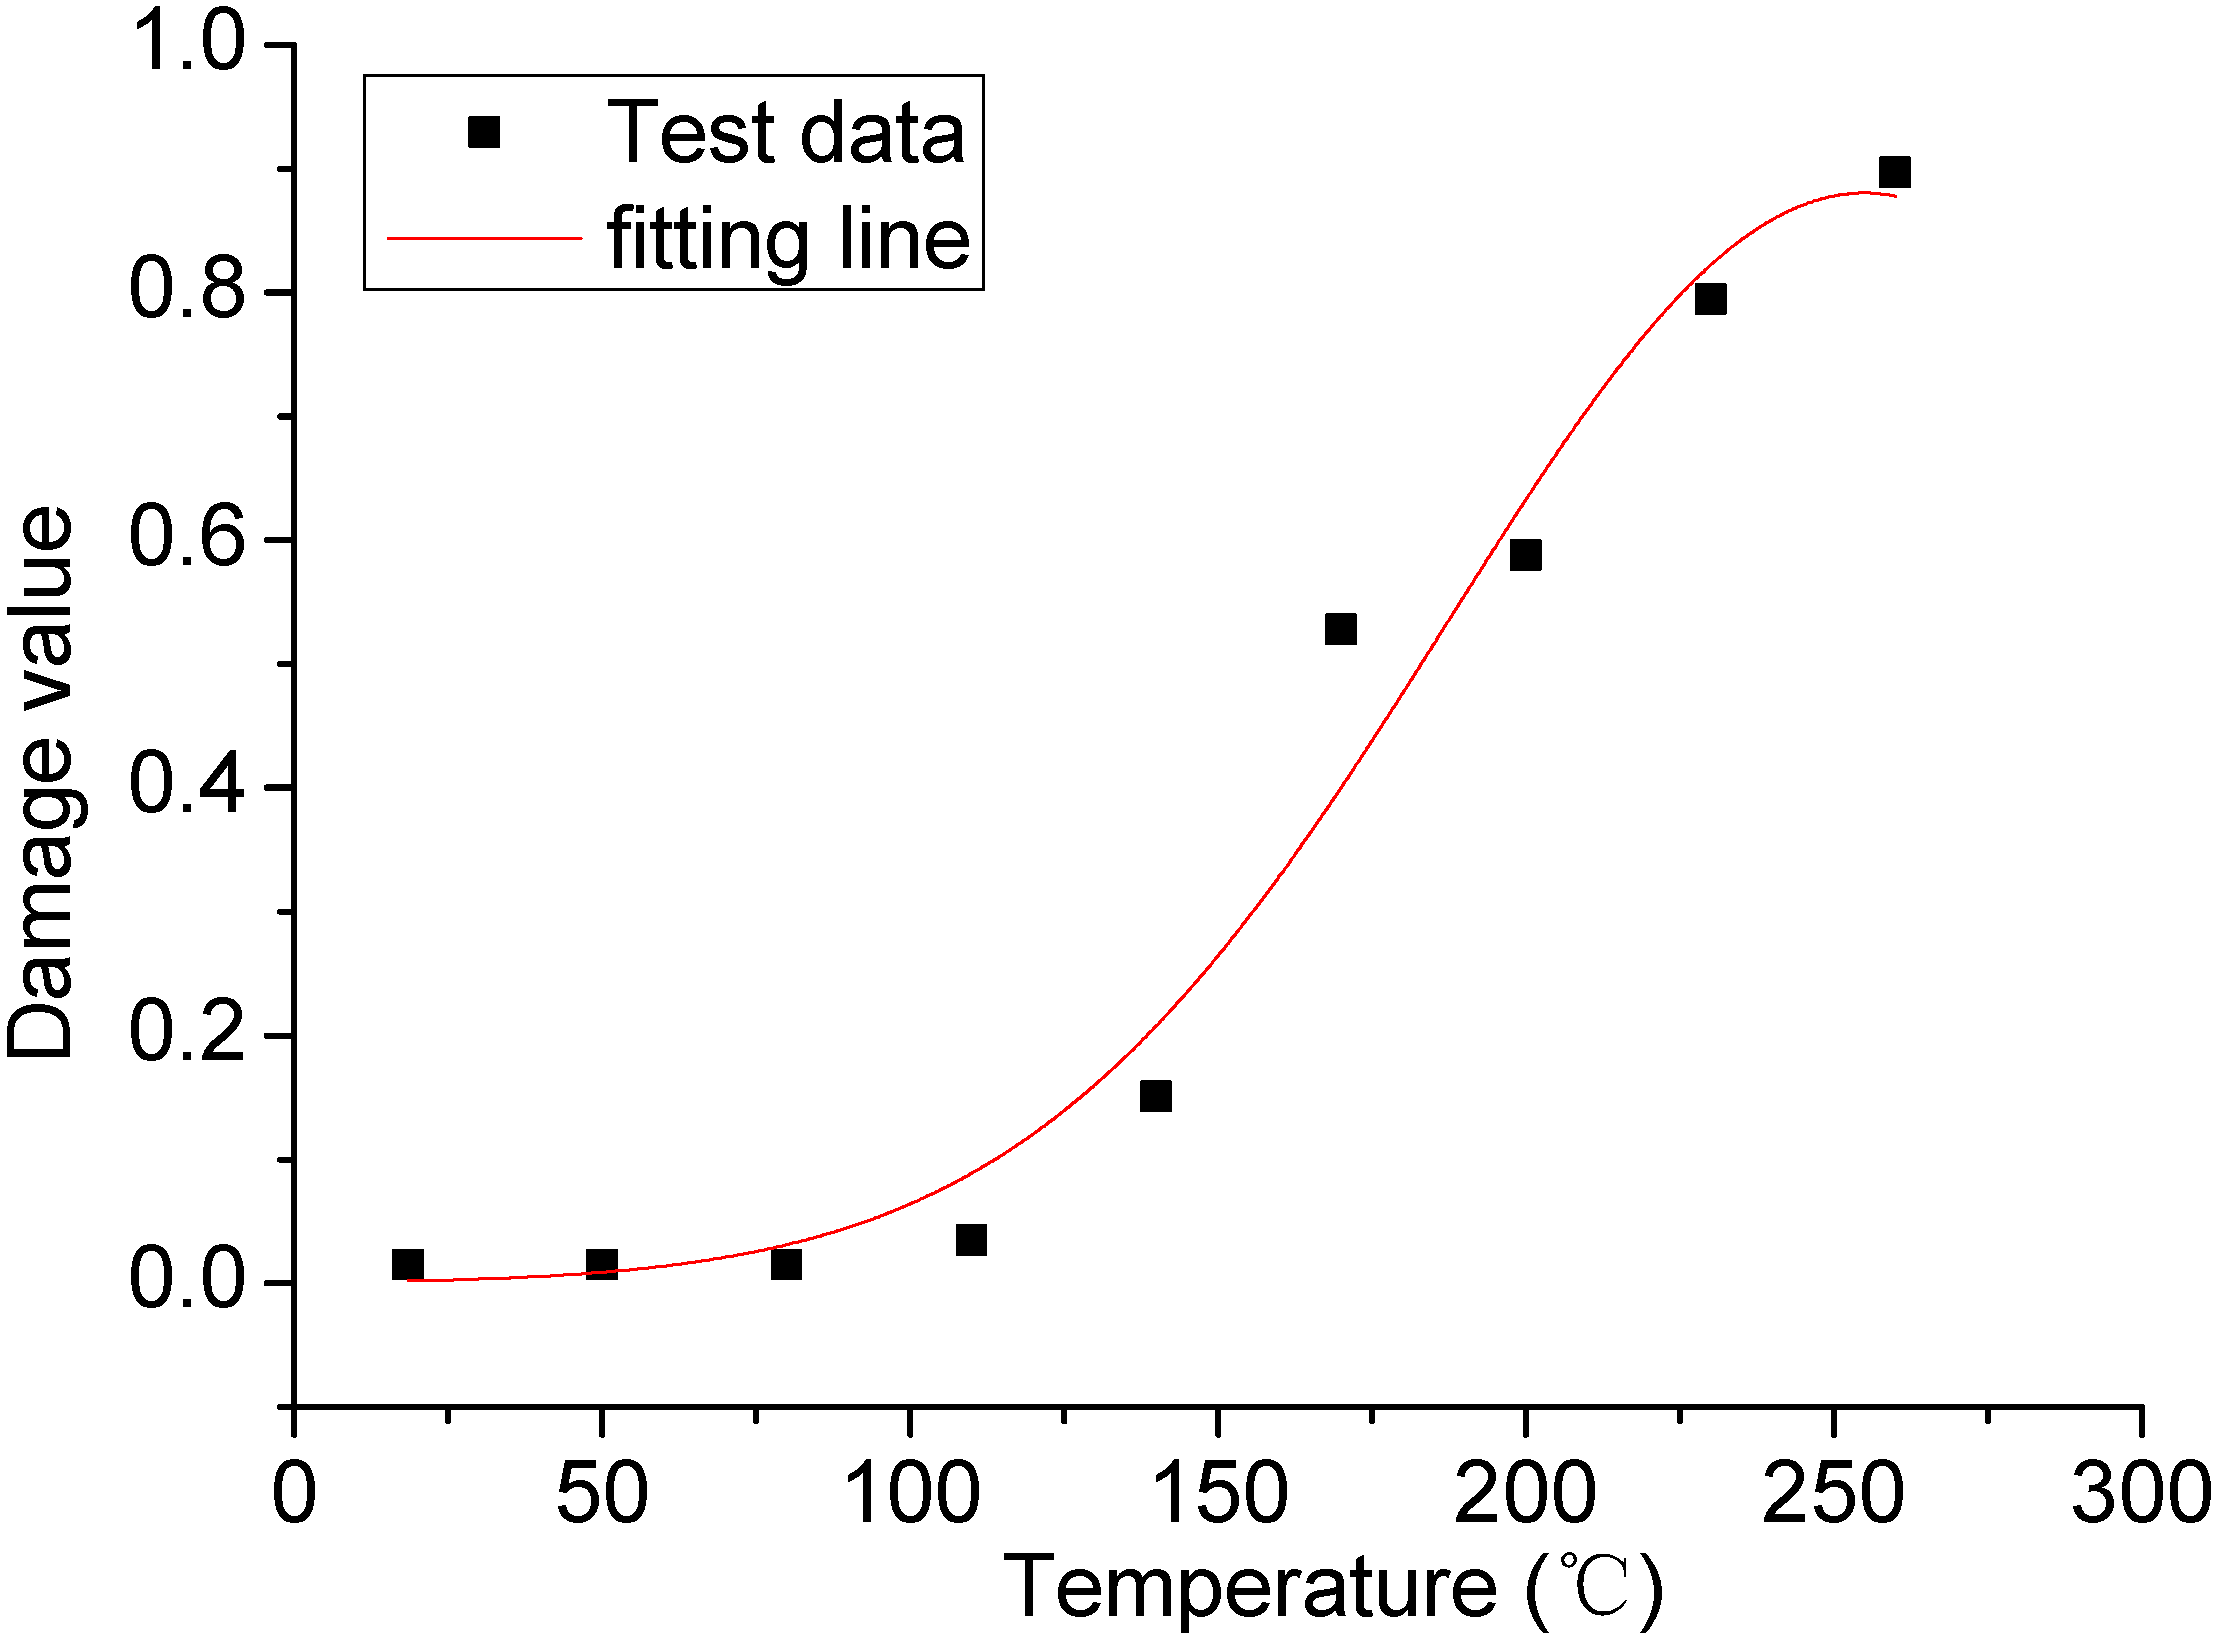
3.4. Quantitative Analysis of the Relation between the Expansion of the Rock Salt Surface Cracks and the Temperature

In order to analyze more intuitively the development and expansion of the rock salt surface cracks, grayscale and binary processing were used, which could make the graphic image of the rock salt surface cracks into the digital image (Figure 6). The grayscale image only contained the luminance information and no color information. And the binary processing aimed at setting the grayscale of the point on the image at 18.5 to 260 °C, making the whole image representing a clear white and black effect, which could be convenient for observation and analysis. It was very easy to realize this operation by using the MATLAB software. Figure 6 demonstrates a group of grayscale and binary images of the development of the rock salt surface cracks with different temperatures.
Figure 6. The grayscale and binary images of the rock salt surface thermal damage cracks at different temperature keep for 24 h from 18.5 to 260 °C.
Minerals 05 00104 g006
The black area in Figure 6 indicated the distribution of the cracks on the rock salt surface. As the temperature increased, the development and expansion of the cracks on the rock salt surface could be observed clearly. At room temperature, 50 and 80 °C, the black spots in Figure 6 were the white grains and original pore could not be smoothed on the rock salt surface. Namely, being in the ideal state free from the effect of external factors, the binary image of the smooth rock salt surface should be a blank image without black spots. By comparison, the distribution and the quantity of the black spots remained basically unchanged in the first three images. There were mainly no apparent cracks on the rock salt surface, and that the temperature exerted no obvious impact on the physical properties of its surface. With further heating, the proportion occupied by the black spot area on the rock salt surface increases (Figure 6). So the higher the temperature, the more obvious the thermal damage to the rock salt surface.
The damage variable D ¯ could be defined as [17]:
D ¯ = A d A 0
Where Ad is the effective bearing area after damage, A0 is the initial cross sectional area without damage.
Making the Af to be the cross sectional area damaged, thus:
A f = A 0 A d
Assuming that the thermal stress was applied on the material surface due to the temperature and let the crack area of the non-destructive material surface be S0. Thus, the crack area Sw could be expressed as:
S w = S 0 A 0
While the surface damage area reached to Ad, the generated crack area Sd was:
S d = S w A d = S 0 A 0 A d
It could be obtained through Equations (1) and (3):
D = S d S 0
The damage variable D in Equation (5) was the ratio of crack area (Sw) produced by thermal stress and non-destructive material surface (S0). The higher the temperature, the bigger the crack area of the rock salt surface Af, and the smaller the effective bearing area without damage; the bigger the D, the greater the thermal damage to the rock salt surface. As long as the ratio occupied by the area without cracks (white area) in the black and white binary image was obtained, the numerical value of the thermal damage to the rock salt surface at this temperature could be calculated.
MATLAB software was used to calculate the white area and the ratio of the total area in the binary image mentioned above, taken into Equation (5). Then the relation between the temperature and the damage to the rock salt surface could be obtained, as shown in Table 1.
In this table, from 18.5 to 80 °C the numerical value of the damage had no change, indicating that the rock salt surface had basically not been subjected to damage within this temperature gradient. However, the reason of these numerical values of the damage not being 0 was that the texture was brought by the rock salt itself and then remained in the picture processing. If heating continues past 110 °C, along with the increasing temperature, the damage to the rock salt surface increases, representing a growth in the form of a fixed power index. The relation between the temperature and the average numerical value of the damage was shown in the Figure 7.
Table 1. The relation between the temperature and the damage for the thermal stress cracks.
Temperature (°C)Average damage value (D)
18.50.015
500.015
800.015
1100.035
1400.151
1700.528
2000.588
2300.795
2600.897
Figure 7. The relation between the temperature and damage.
Minerals 05 00104 g007
Through the fitted curve in Figure 7, the following relation could be obtained between the temperature and the variable of the damage to the rock salt surface from 18.5 to 260 °C:
D r = e a + b T + c T 2
Where Dr is thermal damage value; a, b and c are constants; T is temperature.
Chen [20] had confirmed that high temperature could result in the obvious thermal damage to the rock salt. The higher the temperature, the greater the damage and the worse the mechanical properties become. We also analyzed the result that the higher the temperature, the more significant the effect of the development and expansion of the rock salt surface cracks, which are influenced by the temperature. This means that, by analyzing the degree of the development and expansion of the rock salt surface at different temperatures, the degree of the thermal damage caused by the temperature could be measured.

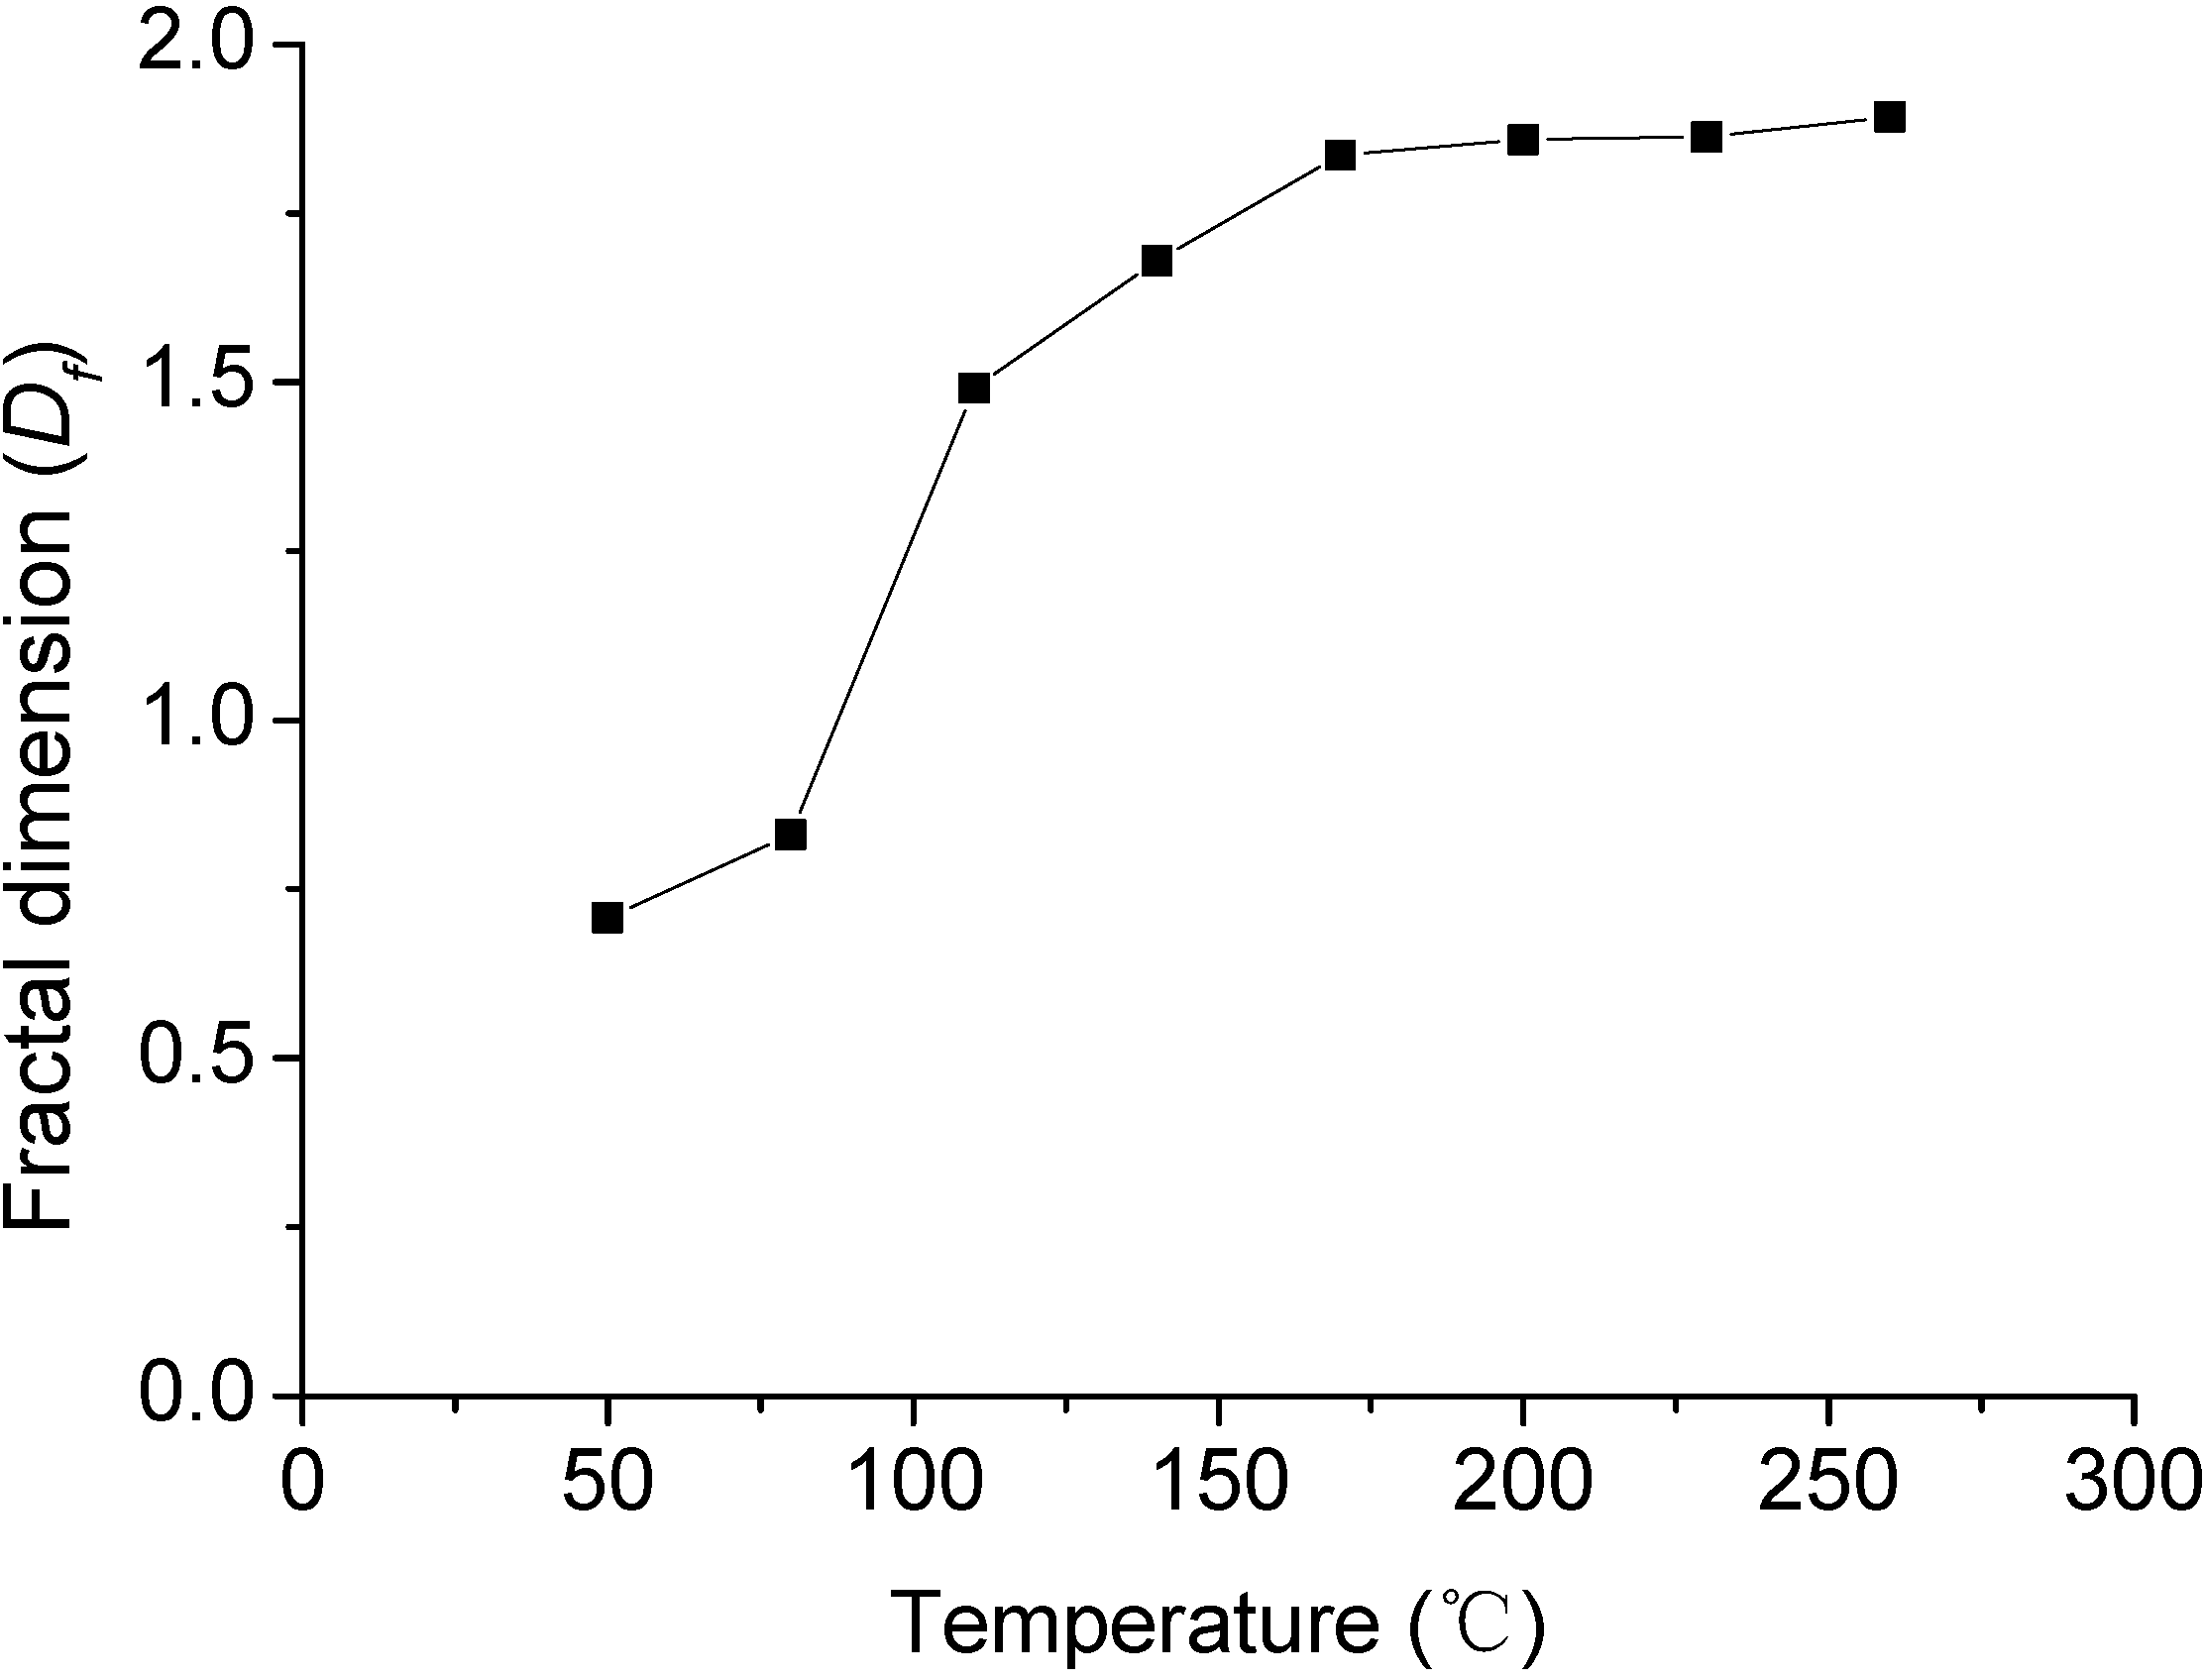
3.5 Fractal Characteristics of the Development and Expansion of the Cracks on the Rock Salt Surface

The unordered and non-uniform cracks on the surface of rock salt caused by temperature are very difficult to describe with traditional Euclidean geometry theory. However, the fractal theory appears to provide the new method for studying the irregularity of the path of the crack development. The fractal theory analyzes directly the inner regularity of the object, which had never been simplified and abstracted. These complex objects, which could not be quantitatively described or had been difficult to be quantitatively described before, can now be expressed conveniently by these space distribution parameters of fractal object. Fractal dimension reflects the effectiveness that the complex object occupies in the region, which is a measurement of the irregularities of the complex objects. There are many methods to analysis the fractal object, such as Lyapunov dimension, Hausdorff dimension, similarity dimension, box-counting dimension, information dimension, correlation dimension and so on [17].
In order to describe the fractal characteristics of the cracks on rock salt surface, the Kolomogrov capacity dimension was chosen. We utilized the fractal software of Fractalfox 2.0 to calculate these fractal dimensions of the cracks on rock salt surface at different temperatures. The basic principle of software Fractalfox 2.0 is Box-counting dimension. The Kolomogrov dimension, known as Box-counting dimension, is a kind of representations of Hausdorff dimension [22].
D f = lim ε ln N ( A , ε ) ln 1 ε
Where Df is the Kolomogrov capacity dimension of A. Let (x, d) represent the space, which owes some distances, when A ∈ ξ(X) and every ε > 0, let N(A, ε) indicated the minimum closed ball of radius ε, which used to cover the A.
The fractal dimension, Df, was calculated from the room temperature of 18.5 to 260 °C, shown in Table 2. It could be found that when heated to 170 from 80 °C, the fractal dimension Df of the cracks on rock salt surface became bigger, but when heated to 260 from 170 °C, it remained constant. It means that with the temperature rising, the disordering of development and expansion of the surface cracks first increased then stayed constant. The Figure 8 showed the relation between fractal dimension and temperature.
Table 2. Relational table of temperature and fractal dimension of the cracks on rock salt surface.
Temperature/°CFractal dimension/Df
500.708
800.830
1101.491
1401.680
1701.836
2001.859
2301.863
2601.893
The analysis of fractal dimension mentioned above kept in accordance with the macro analysis of the cracks on rock salt surface, which illustrated that fractal dimension could explained well the development and expansion situation of the cracks on rock salt surface with different temperatures, namely, the revolution law of its thermal damage. But it could not be treated as a reflection of the degree of the thermal damage to the cracks on rock salt surface.
Figure 8. The relation between fractal dimension and temperature.
Minerals 05 00104 g008

4. Conclusions

In this paper, the impact of thermal damage on rock salt, gypsum and mudstone was investigated and the evolution of the surface thermal damage cracks were found from 50 to 260 °C. The high temperature would result in an obvious thermal damage to the rock salt, and furthermore it would produce a large number of cracks on the rock salt surface. The dislocation among these grains caused by the Schottky defects and the different thermal expansion coefficients of a variety of mineral particles. After losing the crystal water, the surface color faded with the damage to the surface structure and the appearance of the cracks. Through the analysis of the cracks on rock salt surface and the grayscale binary processing of their pictures, the empirical formula of the temperature and the damage was fitted. The research showed that the degree of the development and expansion of the cracks on rock salt surface could reflect effectively the degree of the thermal damage to itself. The fractal dimension of the development and expansion of the cracks on rock salt surface could be calculated by the fractal theory.

Acknowledgments

The support of Fundamental Research Fund of the central universities of China (No. CDJZR13240022), Natural Science Fund for creative research groups in China (No. 51304256; 51204216), China Postdoctoral Science Foundation (No. 2013M540620) and the National Key Technology R&D Program (No.2012BAK04B09) are gratefully acknowledged. The authors also would like to thank the academic editor and two anonymous reviewers for their insightful comments and the thorough discussion that helped to improve the paper.

Author Contributions

Chen J. had the original idea for the study and, with all co-authors carried out the design. Yin L. and Ren S. carried out the analyses. Lin L. and Fang J. drafted the manuscript, which was revised by all authors. All authors read and approved the final manuscript.

Conflicts of Interest

The authors declare no conflict of interest.

References

  1. Kostick, D.S. The World Salt Industry: A Heritage of Progress for the 21st Century. In 7th Symposium on Salt; Elsevier: Amsterdam, The Netherlands, 1993. [Google Scholar]
  2. Thoms, R.L.; Gehle, R.M. A Brief History of Salt Cavern. In 8th World Salt Symposium; Elsevier: Amsterdam, The Netherlands, 2000; Volume 1, pp. 1–10. [Google Scholar]
  3. Bays, C.A. Use of Salt Solution Cavities for Underground Storage. Symp. Salt North. Ohio Geol. Soc. 1963, 5, 564–578. [Google Scholar]
  4. Manfed, W.; Karl, H.; Minkley, W. The Mechanical Behavior of Salt—Understanding of THMC Processes in Salt. In Proceedings of the Sixth Conference on the Mechanical Behavior of Salt, Hannover, Germany, 22–25 May 2007.
  5. Alkan, H. Percolation model for dilatancy-induced permeability of the excavation damaged zone in rock salt. Int. J. Rock Mech. Min. Sci. 2009, 46, 716–724. [Google Scholar] [CrossRef]
  6. Zhou, H.; Wang, C.; Mishnaevsky, L. A fractional derivative approach to full creep regions in salt rock. Mech. Time-Depend. Mater. 2013, 17, 413–425. [Google Scholar] [CrossRef]
  7. Alkana, H.; Cinarb, Y.; Pusch, G. Rock salt dilatancy boundary from combined acoustic emission and triaxial compression tests. Int. J. Rock Mech. Min. Sci. 2007, 44, 108–119. [Google Scholar] [CrossRef]
  8. Chen, J.; Ren, S.; Yang, C.; Jiang, D.; Li, L. Self-Healing Characteristics of Damaged Rock Salt under Different Healing Conditions. Materials 2013, 6, 3438–3450. [Google Scholar] [CrossRef]
  9. Yang, C.; Liang, W.; Wei, D. Investigation on possibility of energy storage in salt rock in China. Chin. J. Rock Mech. Eng. 2005, 24, 4409–4417. (In Chinese) [Google Scholar]
  10. Yang, C.; Li, Y.; Qu, D. Advance in researches of the mechanical behaviors of bedded salt rocks. Adv. Mech. 2008, 4, 484–494. (In Chinese) [Google Scholar]
  11. Chen, J.; Jiang, D.Y.; Ren, S. Analysis of the Surface Cracks Growth and the Damage in Salt Rock under Uniaxial Compression. In Proceedings of the 7th Conference on the Mechanical Behavior of Salt, Paris, France, 16–19 April 2012.
  12. Yang, C.; Liang, W.; Zhao, Y. Experimental investigation of mechanical properties of bedded salt rock. Int. J. Rock Mech. Min. Sci. 2006, 44, 400–411. [Google Scholar]
  13. Li, Y.P.; Yang, C.H.; Qian, Q.H. Experimental research on deformation and failure characteristics of laminated salt rock. In Proceedings of the Sixth Conference on the Mechanical Behavior of Salt, Hannover, Germany, 22–25 May 2007; pp. 69–74.
  14. Schulze, T.; Popp, H.K. Development of damage and permeability in deforming rock salt. Eng. Geol. 2010, 61, 163–180. [Google Scholar] [CrossRef]
  15. Xu, X. Study on the characteristics of thermal damage for granite. Rock Soil Mech. 2003, 24, 188–191. [Google Scholar]
  16. Li, Y.; Liu, J.; Yang, C. Influence of mudstone gypsum and mudstone on deformation and failure characteristics of salt rock. Chin. J. Rock Mech. Eng. 2006, 25, 2461–2466. (In Chinese) [Google Scholar]
  17. Xu, S.; Feng, X. Damage Mechanics; Tsinghua University Press: Beijing, China, 1997; pp. 10–12. (In Chinese) [Google Scholar]
  18. Zuo, J.; Zhou, H.; Liu, Y. Research on characteristic parameters of sandstone three-point bending failure under different temperatures. Chin. J. Rock Mech. Eng. 2010, 29, 705–712. (In Chinese) [Google Scholar]
  19. Horseman, S.T.; Handin, J. Triaxial-compression tests on rock salt at temperatures from 50 to 200 °C and strain rates from 10−4 to 10−9 S−1. In The Brittle-Ductile Transition in Rocks; Duba, A.G., Durham, W.S., Handin, J.W., Wang, H.F., Eds.; American Geophysical Union: Washington, DC, USA, 1990; pp. 103–110. [Google Scholar]
  20. Chen, J. Study on Temperature Effect of Mechanical Properties and Micro Mechanism of Rock Salt. Ph.D. Thesis, Institute of Rock and Soil Mechanics, Chinese Academy, Wuhan, China, 2008. [Google Scholar]
  21. Sirdeshmukh, D.B.; Sirdeshmukh, L.; Subhadra, K.G. Alkali Halides: A Handbook of Physical Properties; Springer: Berlin, Germany, 2001. [Google Scholar]
  22. Xu, J.; Lu, Q.; Wu, X.; Liu, D. The fractal characteristics of the pore and development of briquettes with different coal particle sizes. J. Chongqing Univ. 2011, 34, 81–89. [Google Scholar]

