

Adsorption of Caffeine and Demethylated Metabolites on Na+-Exchanged Bentonite


Abstract

1. Introduction
2. Materials and Methods
2.1. Reagents and Instrumentation
2.2. Chromatographic Conditions
2.3. Preparation of Na+ Exchanged Bentonite (Na-BT)
2.4. Sorption and Desorption Experiments
2.5. Adsorption Isotherms Fitting
2.6. Samples and Sample Preparations Used to Evaluate Caffeine Removal
3. Results and Discussion
3.1. Characterization
3.1.1. Zeta Potential
3.1.2. Specific Surface Area
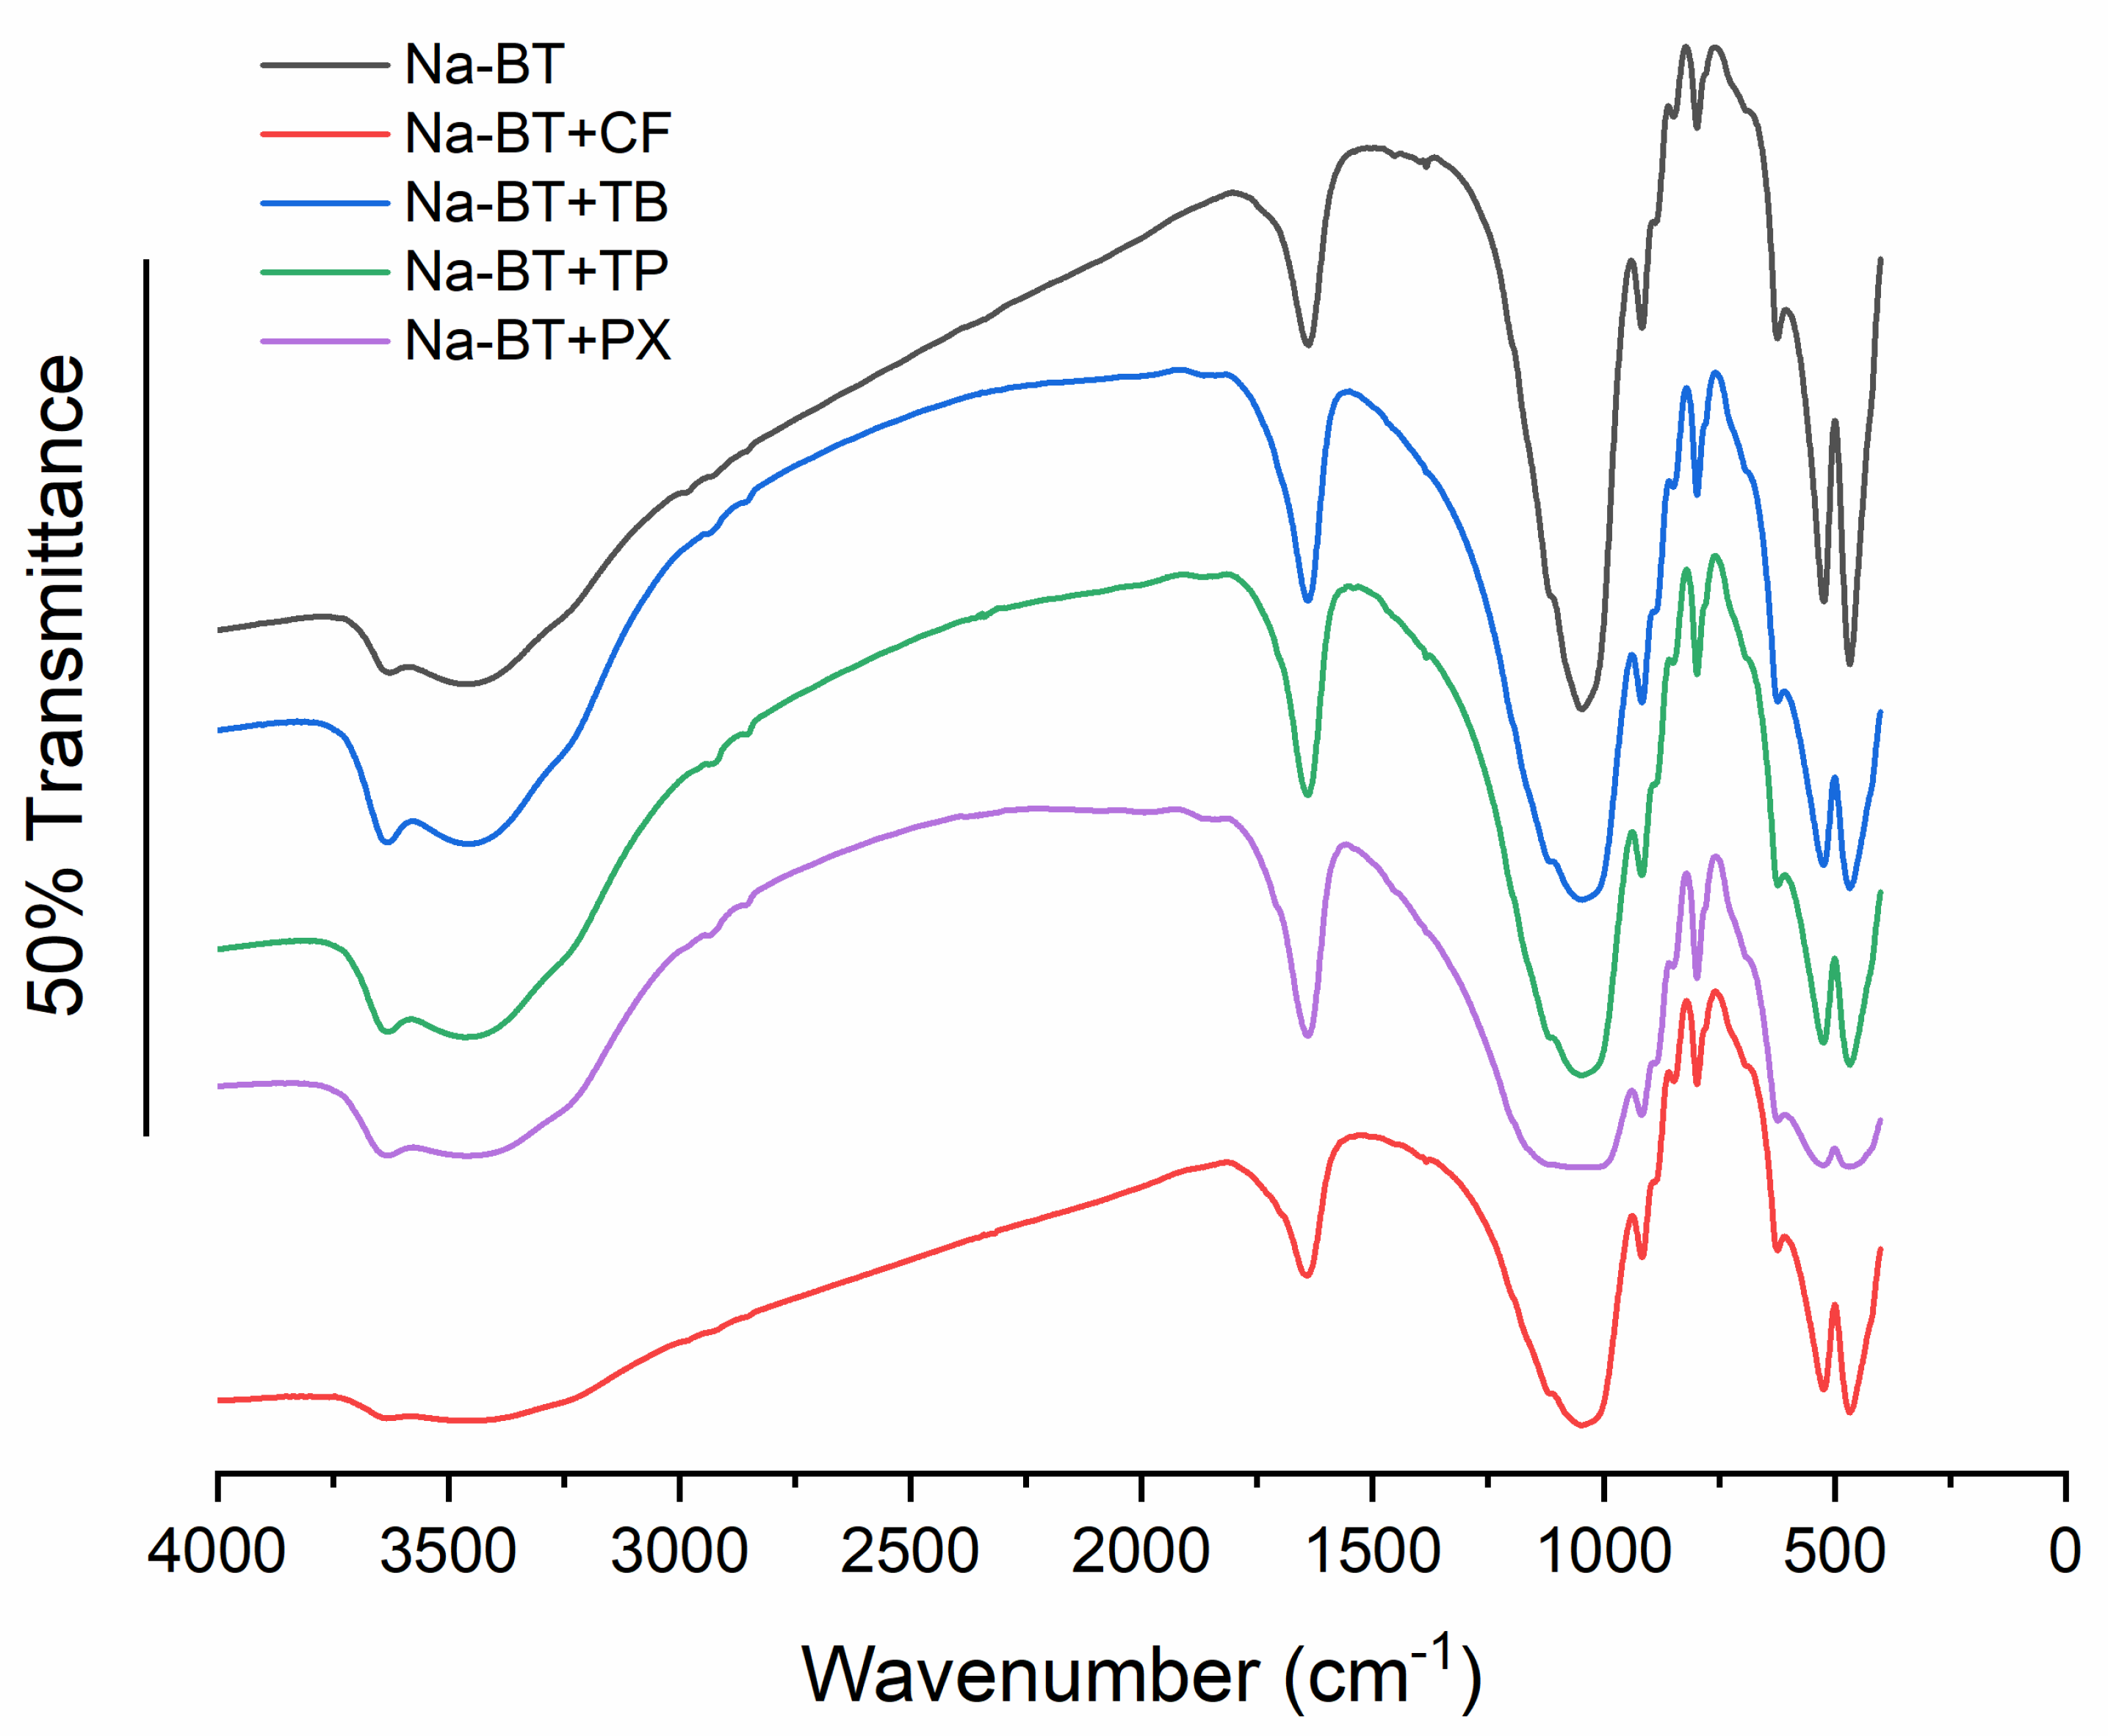
3.1.3. FT-IR
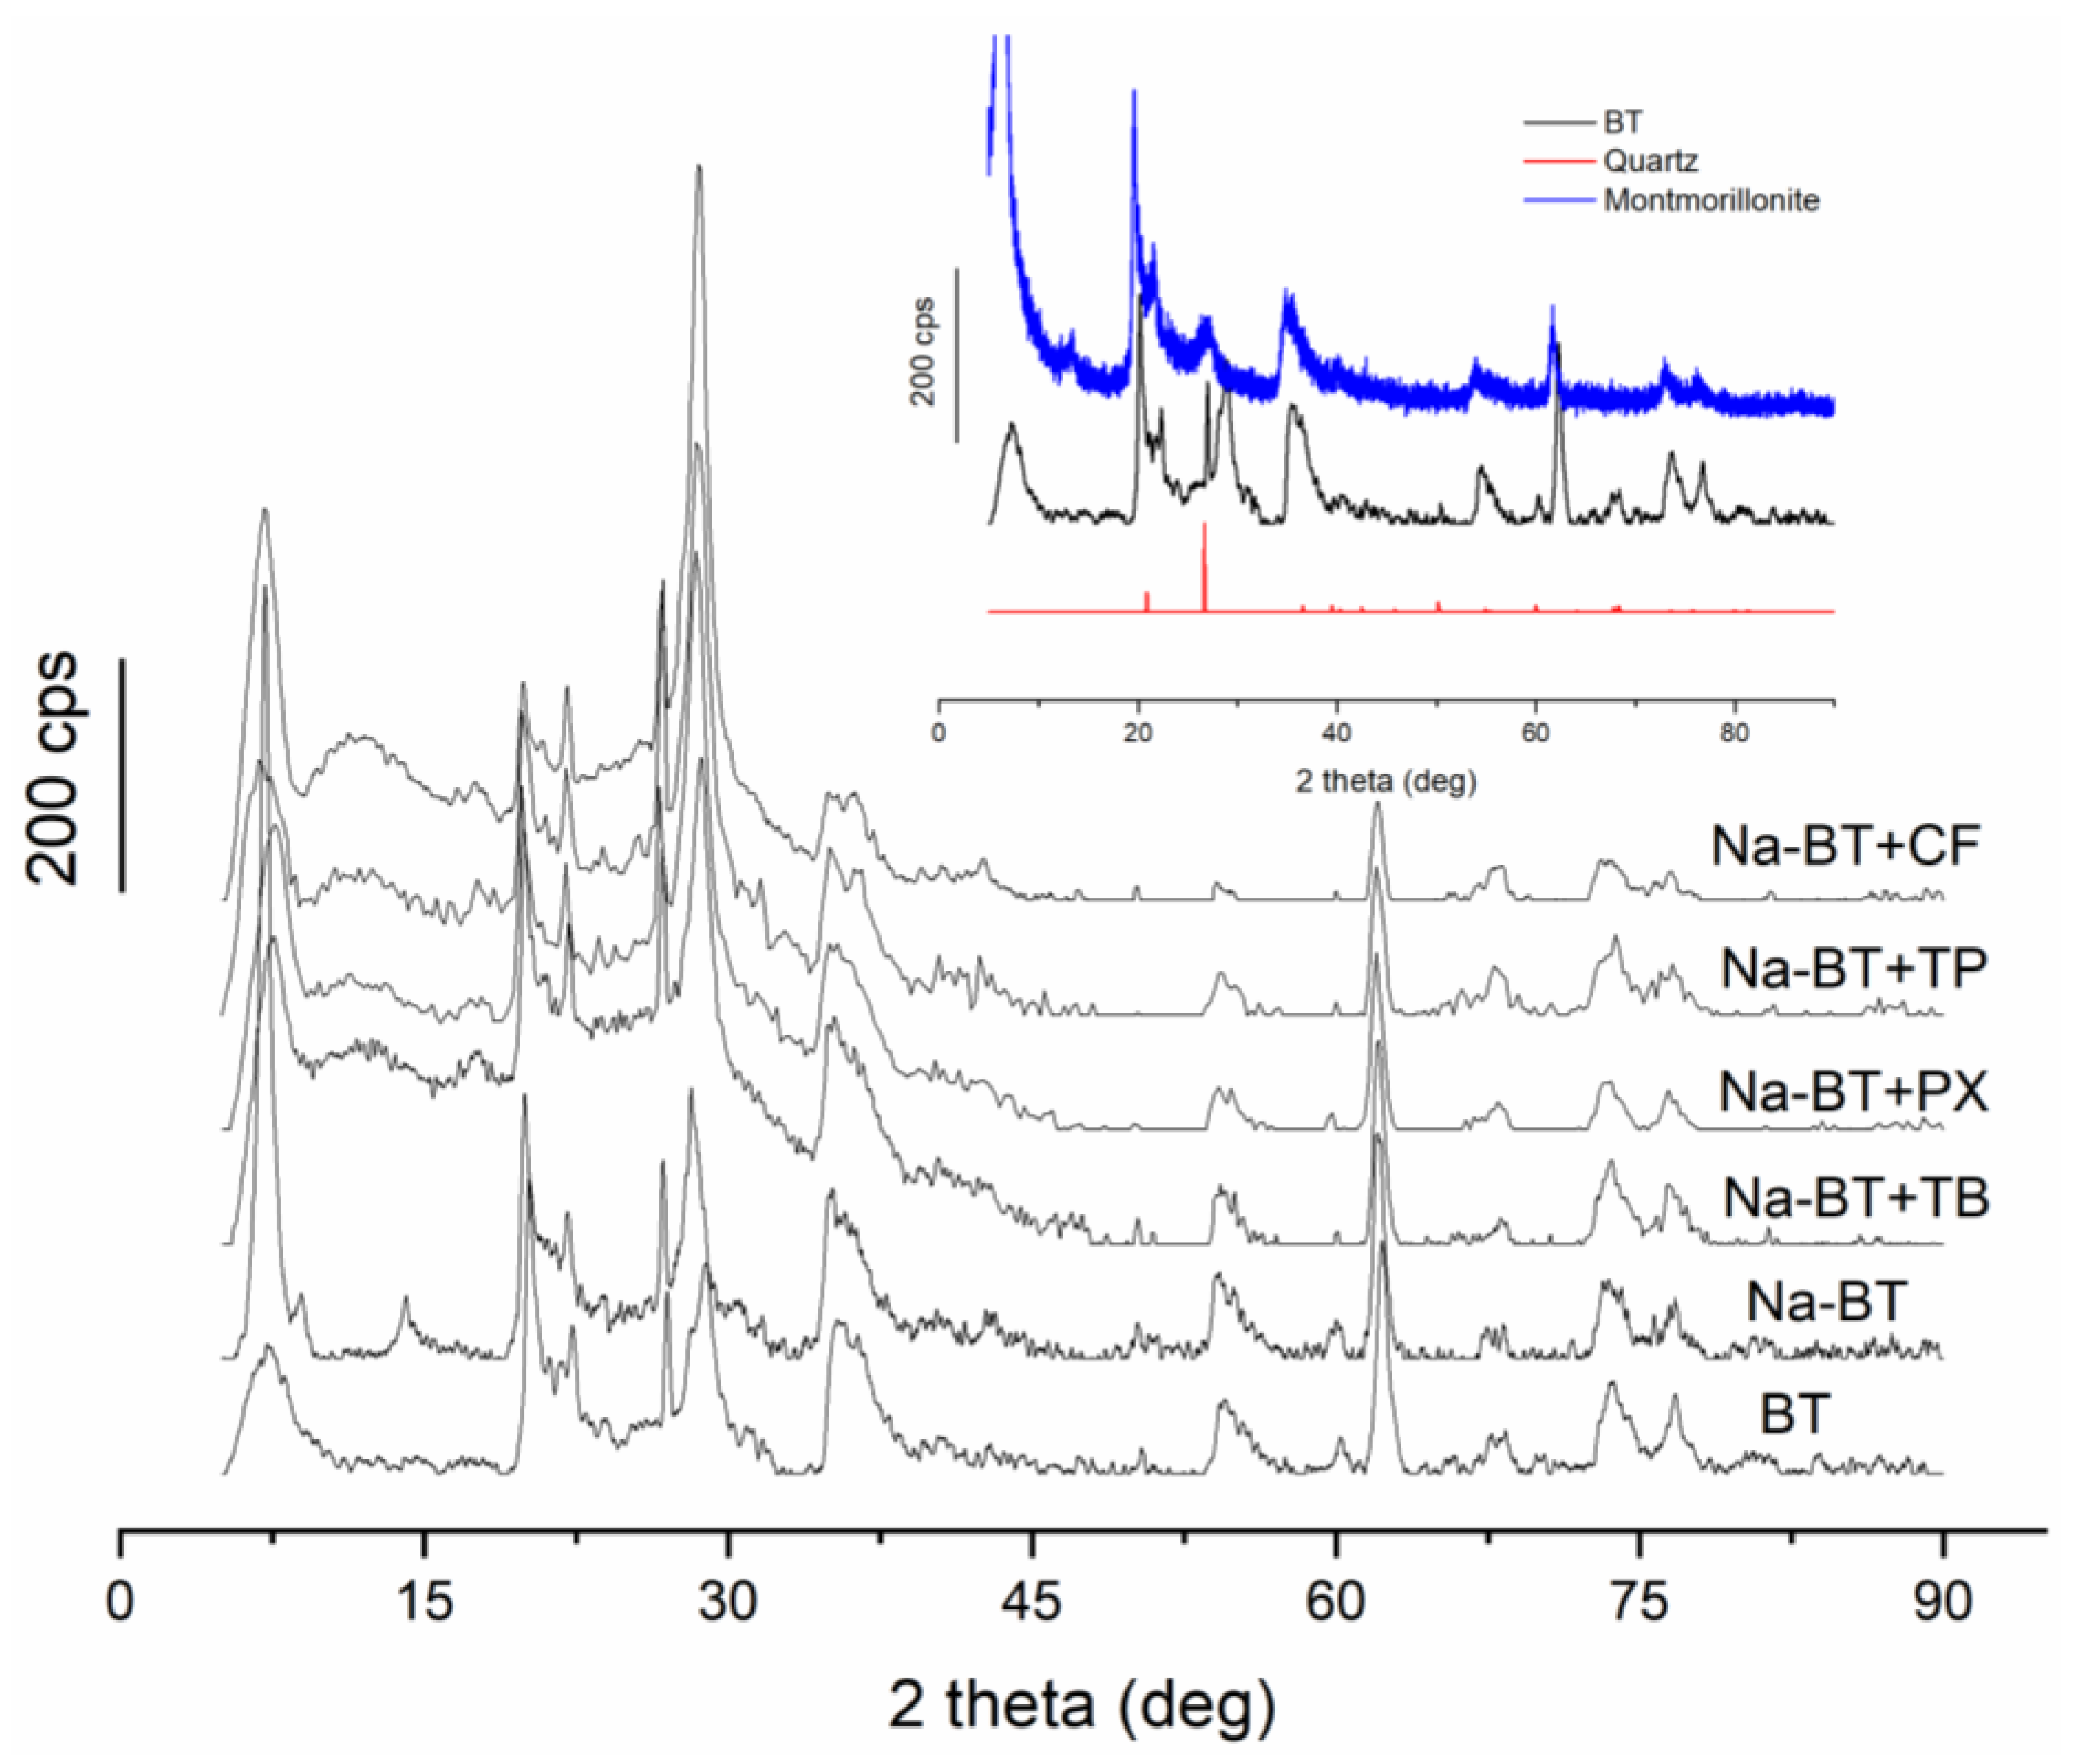
3.1.4. XRD
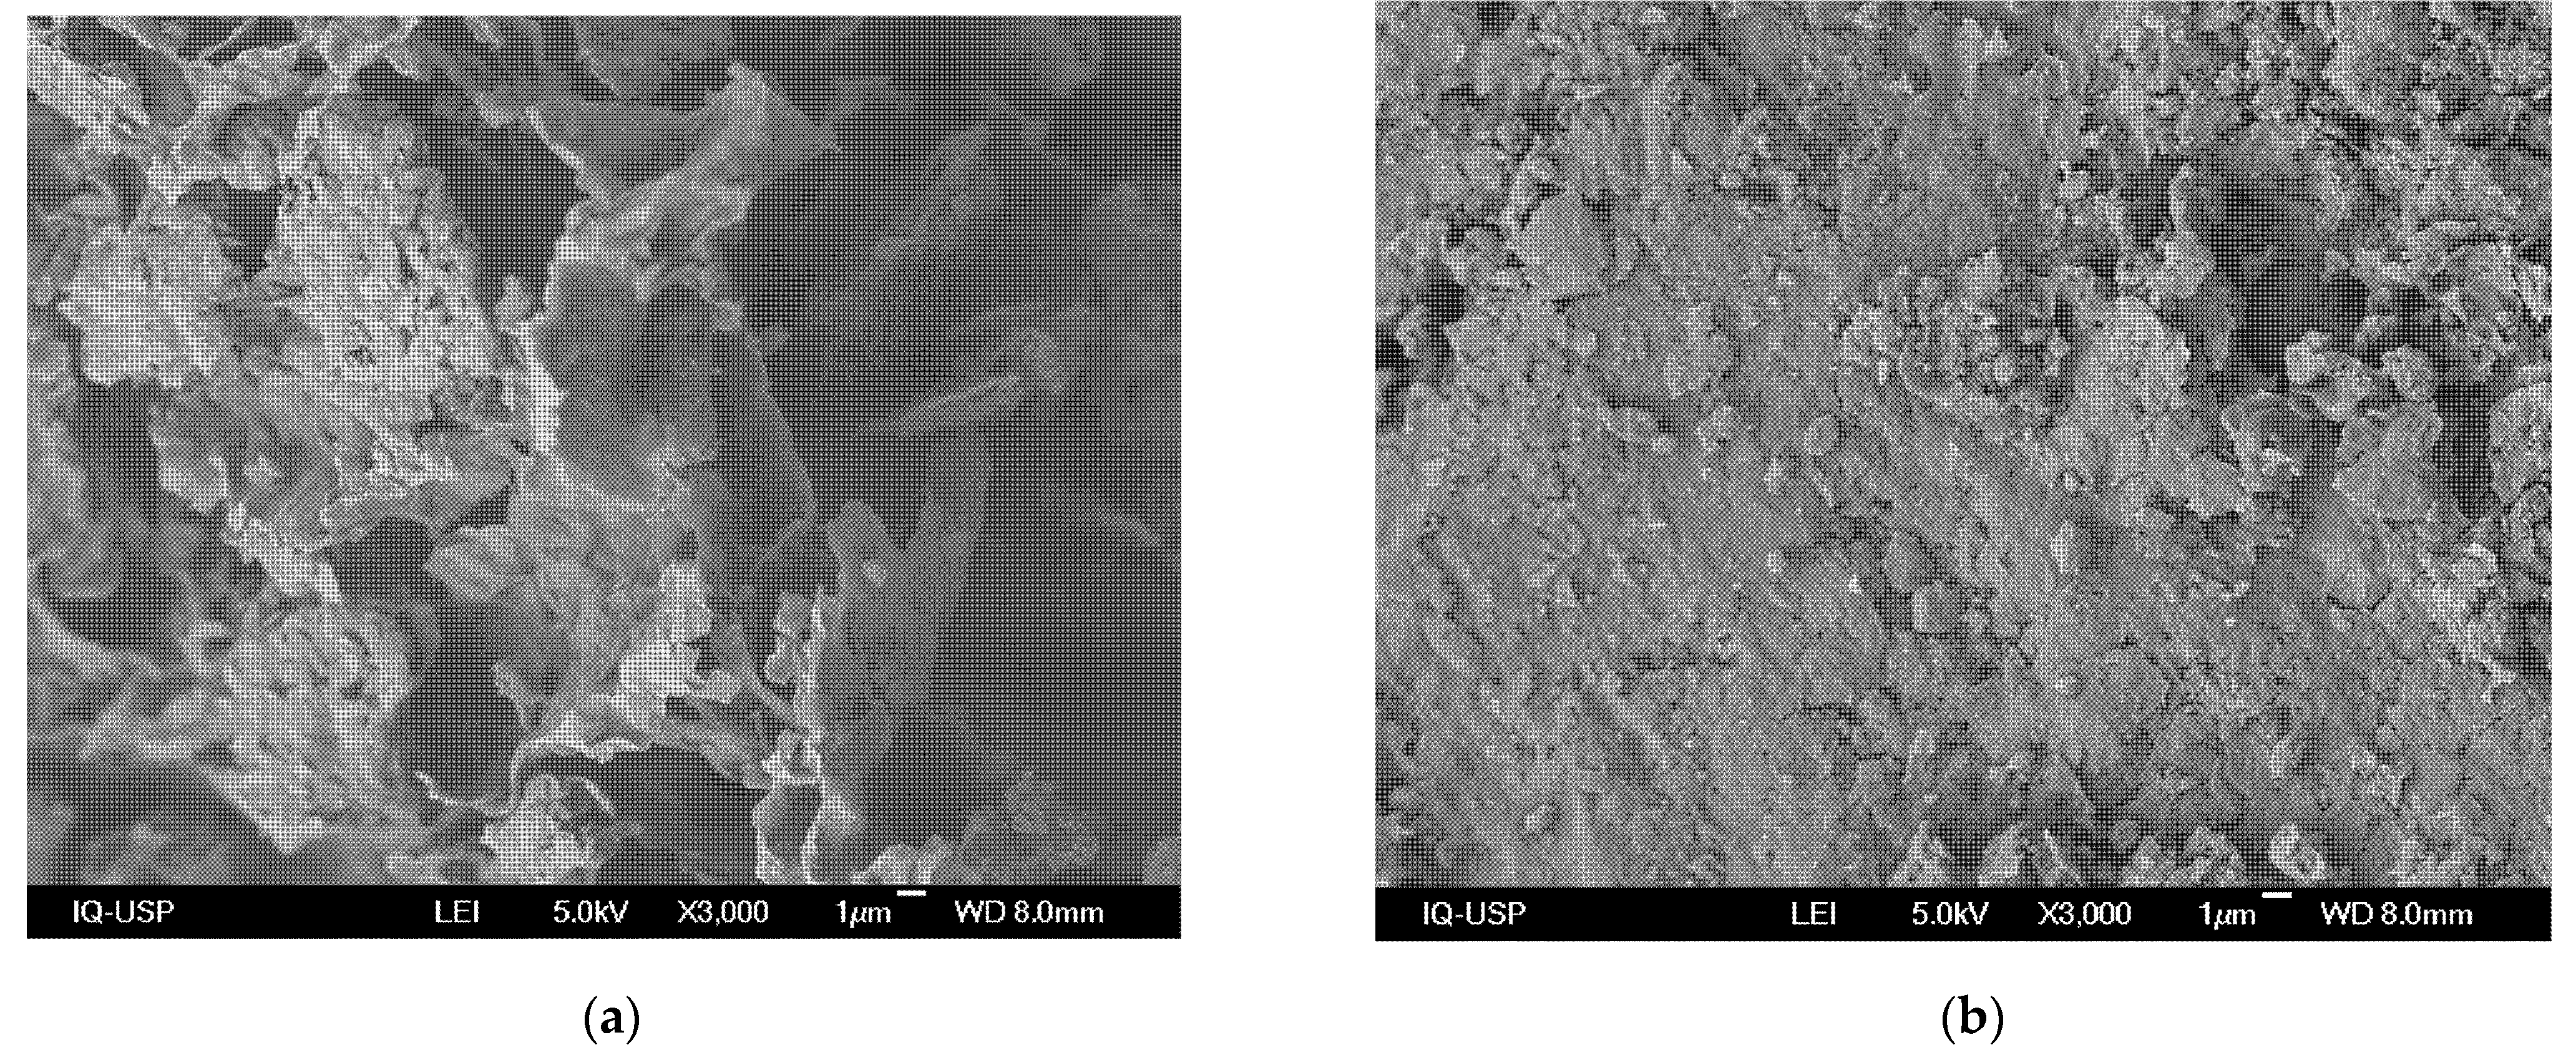
3.1.5. Scanning Electron Microscopy
3.2. Caffeine Adsorption
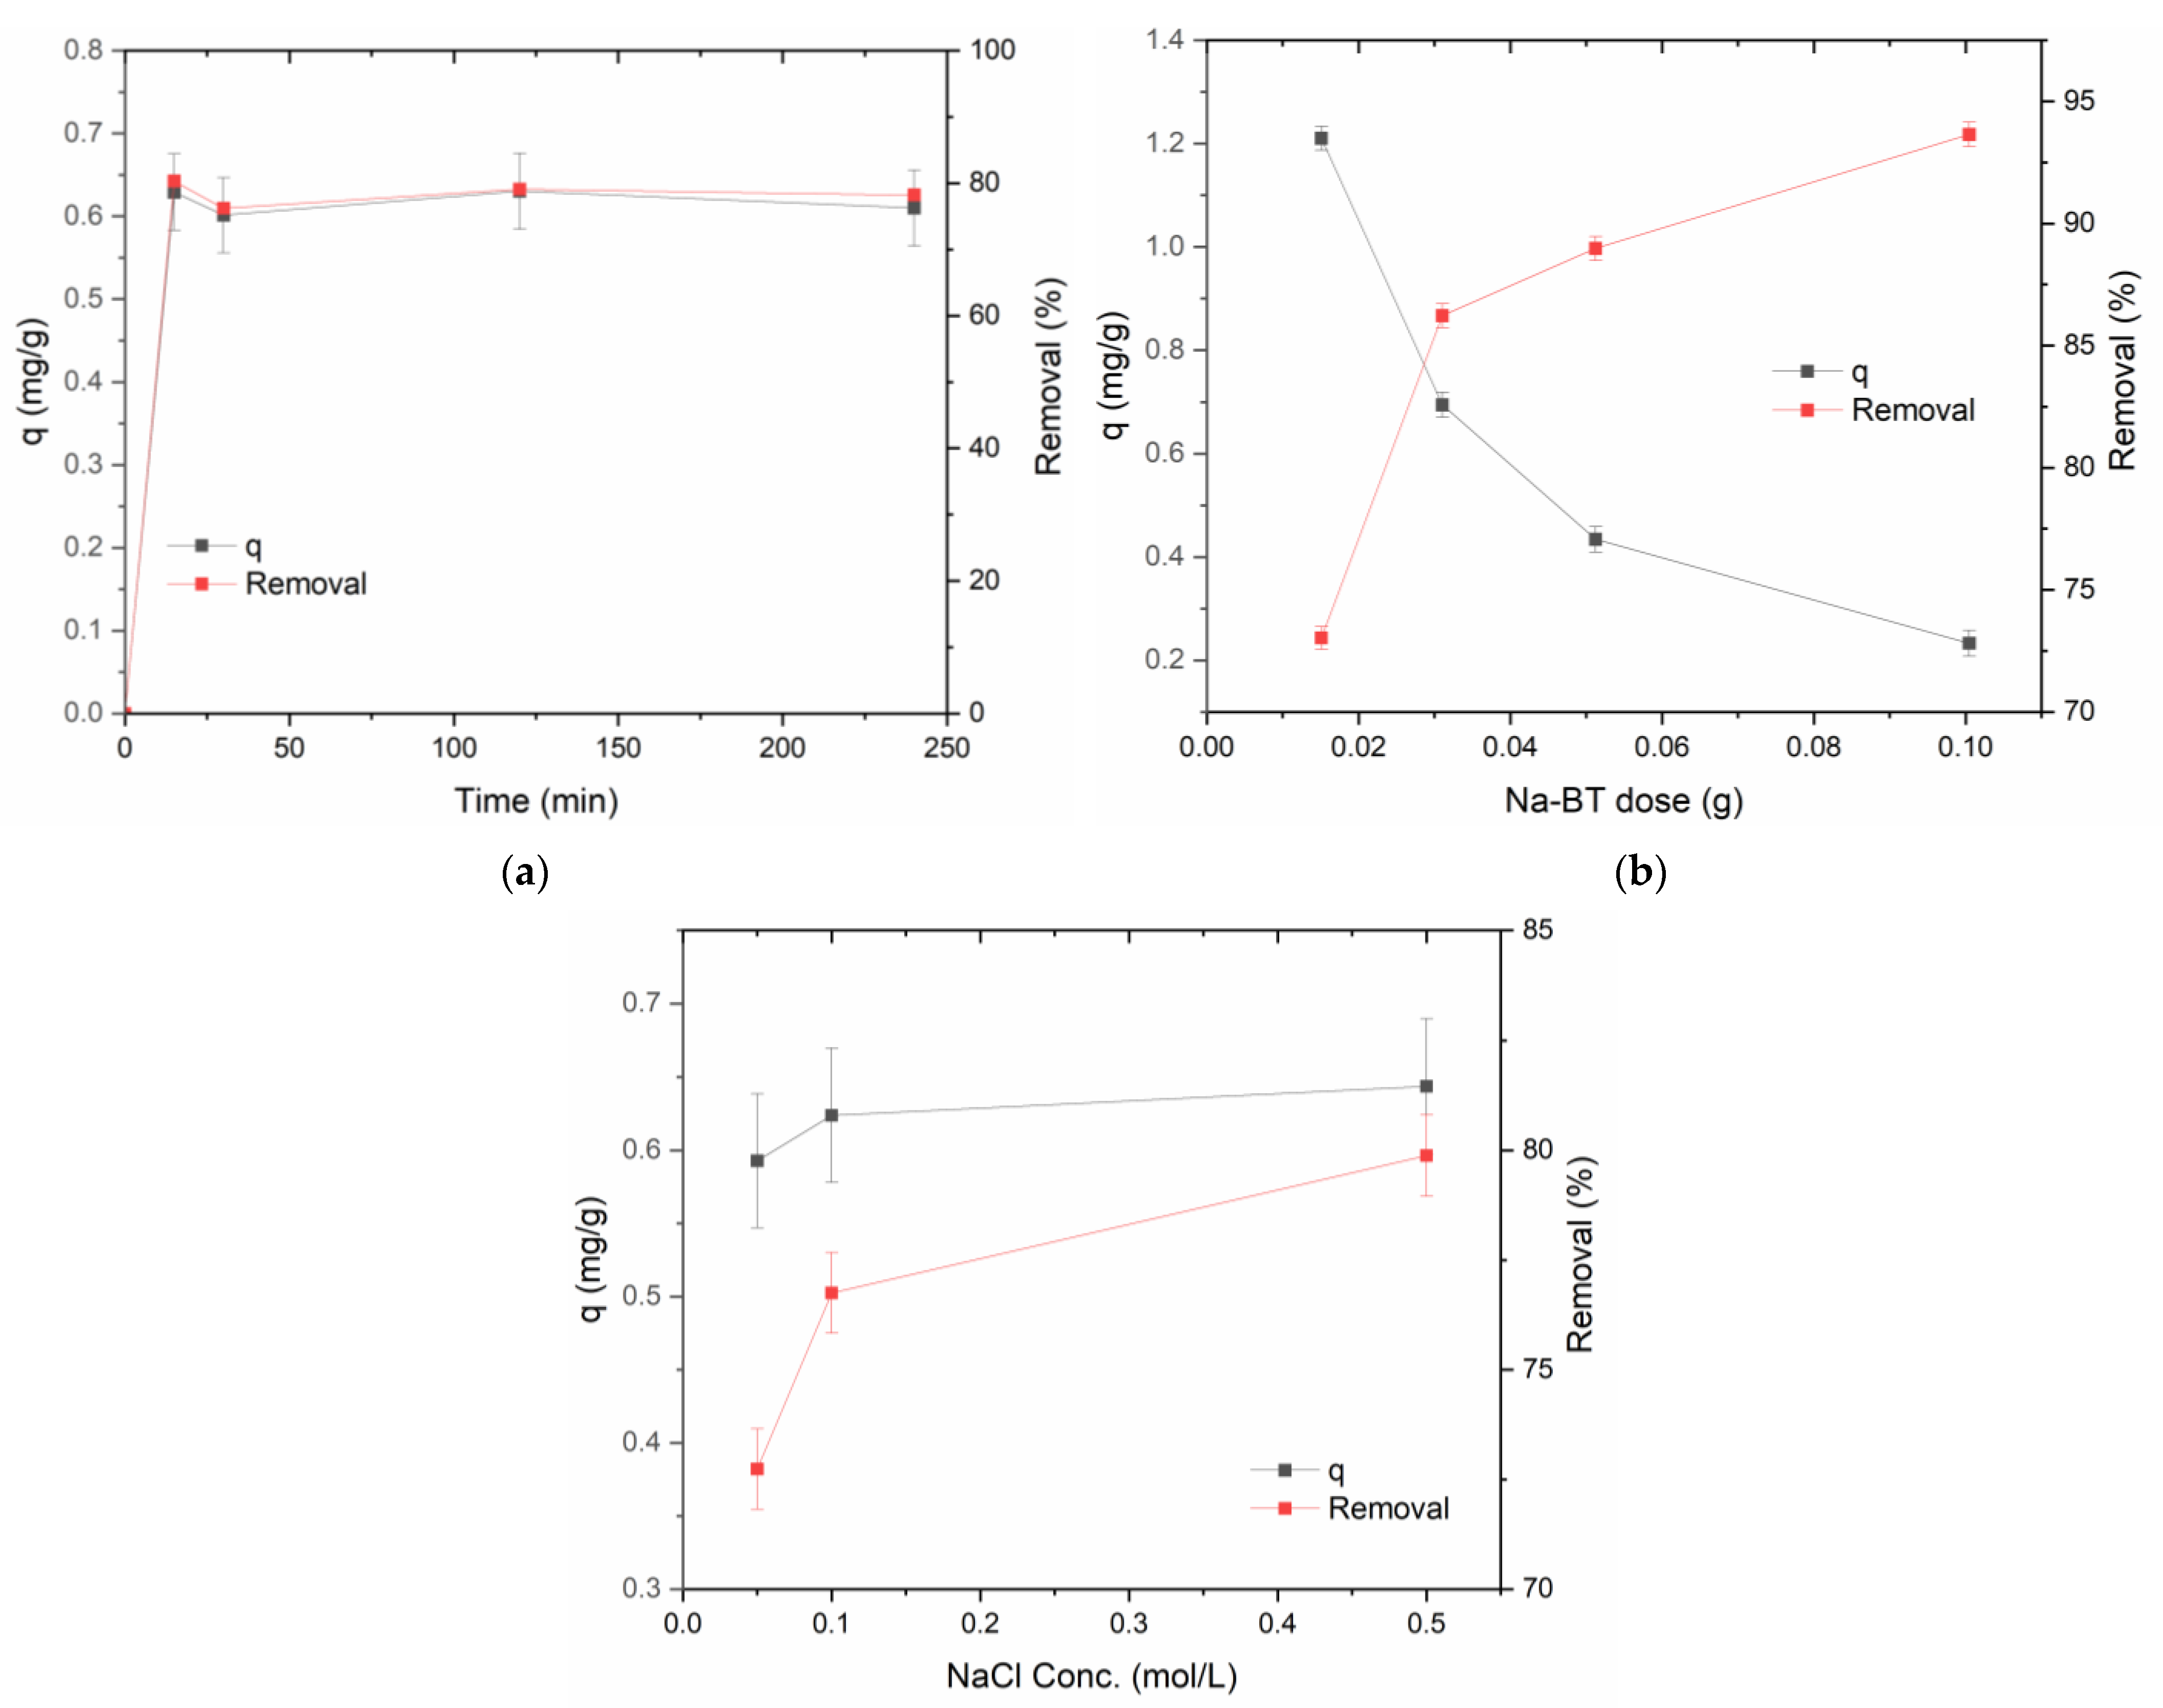
3.2.1. Effect of Contact Time
3.2.2. Effect of Na-BT Dose
3.2.3. Effect of Ionic Strength
3.2.4. Effect of Solution Initial pH
3.3. Partition Coefficient (Kd)
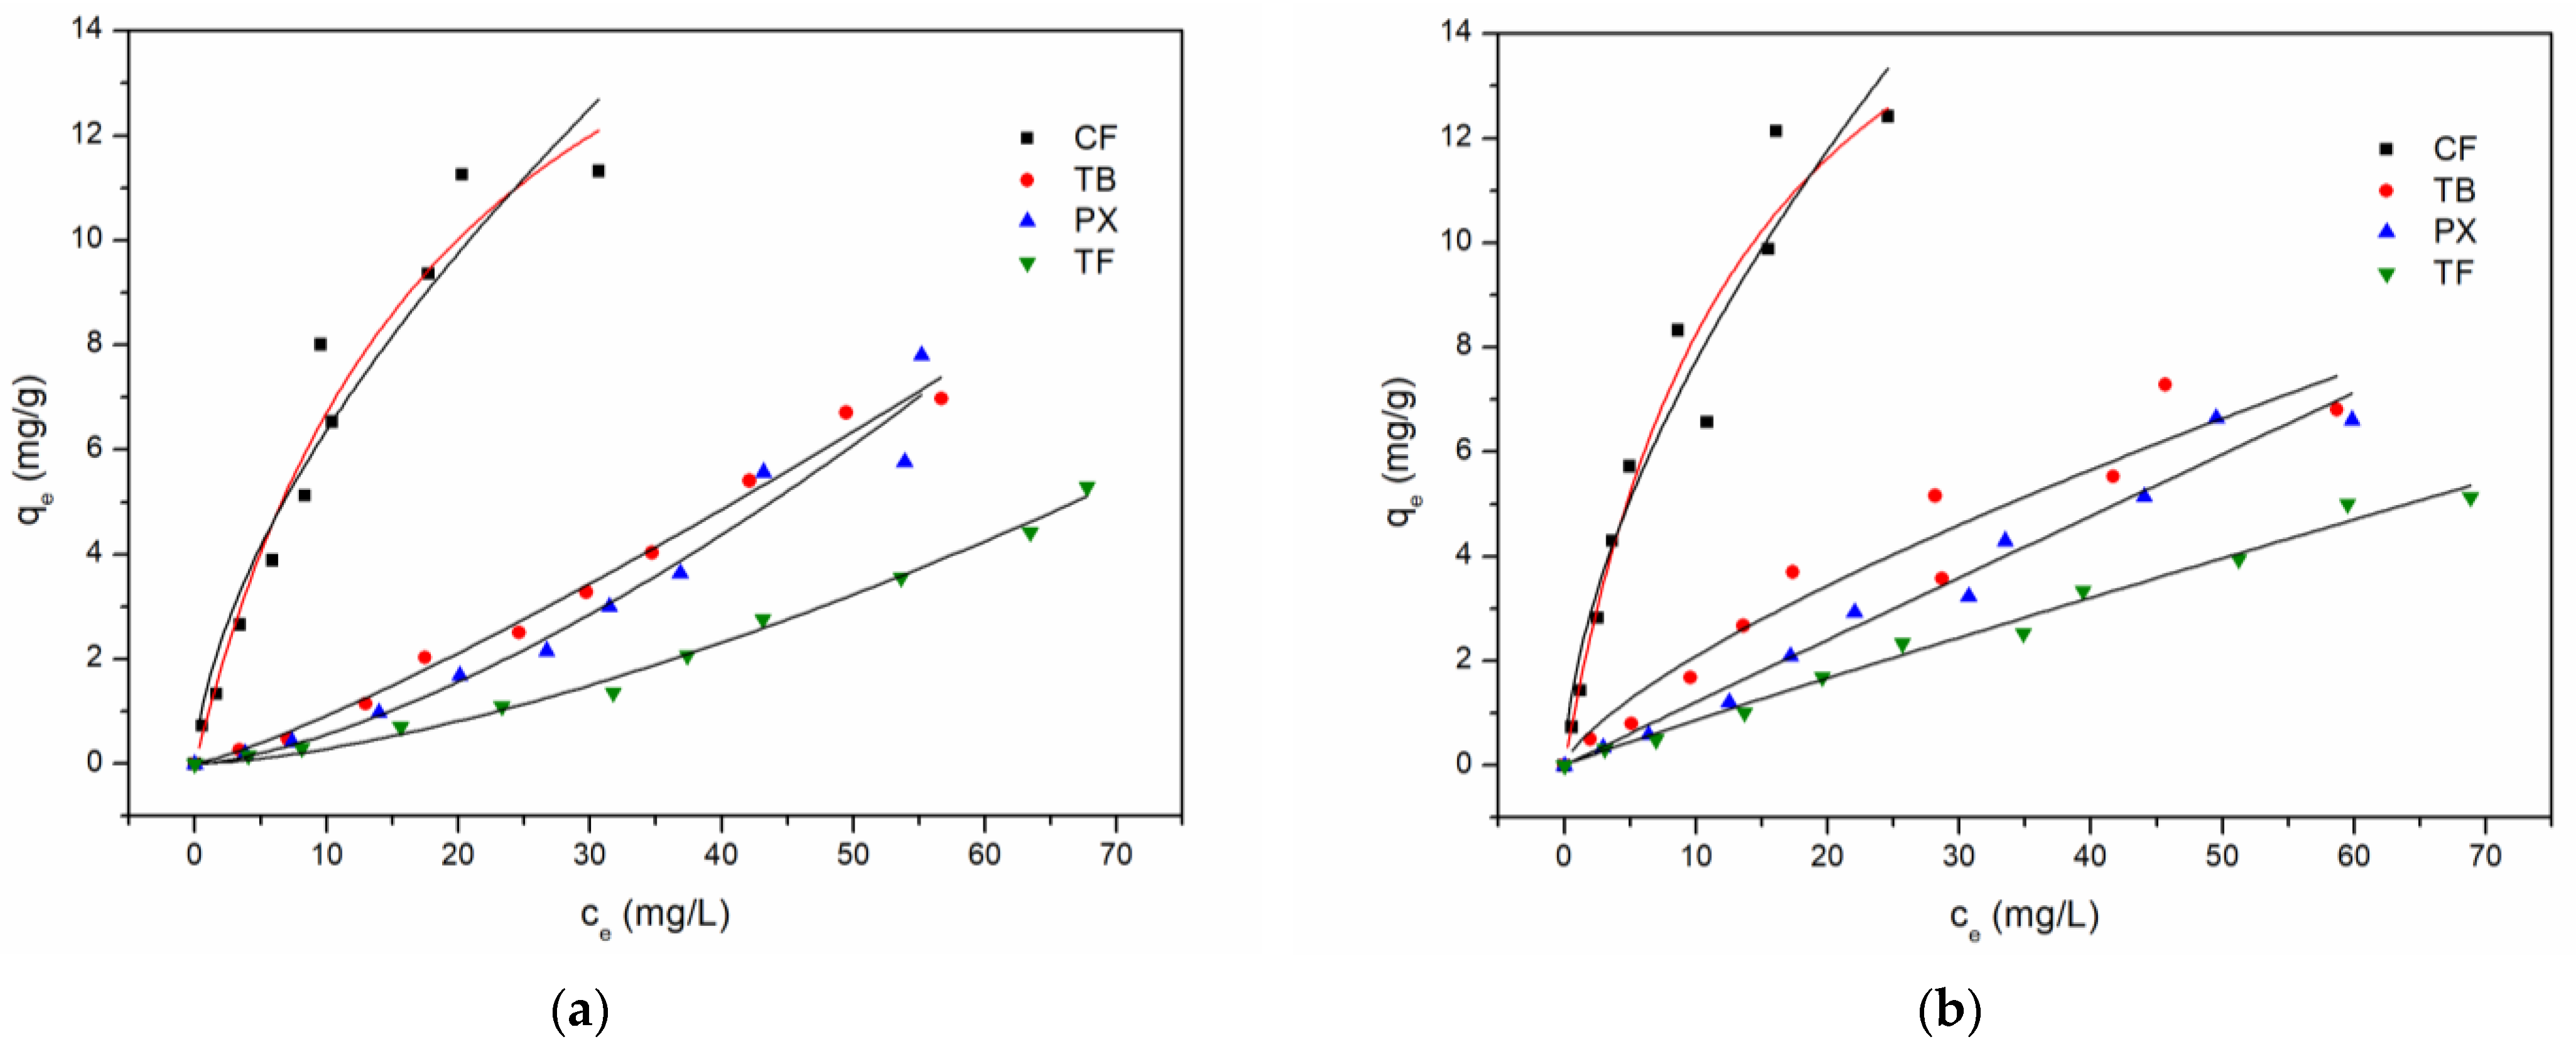
3.4. Adsorption Isotherms
3.5. Desorption Experiments
3.6. Applications
3.6.1. Cola Soda, Energy Drink, Soluble Coffee, Green Tea, and Yerba Mate
3.6.2. Artificial Urine
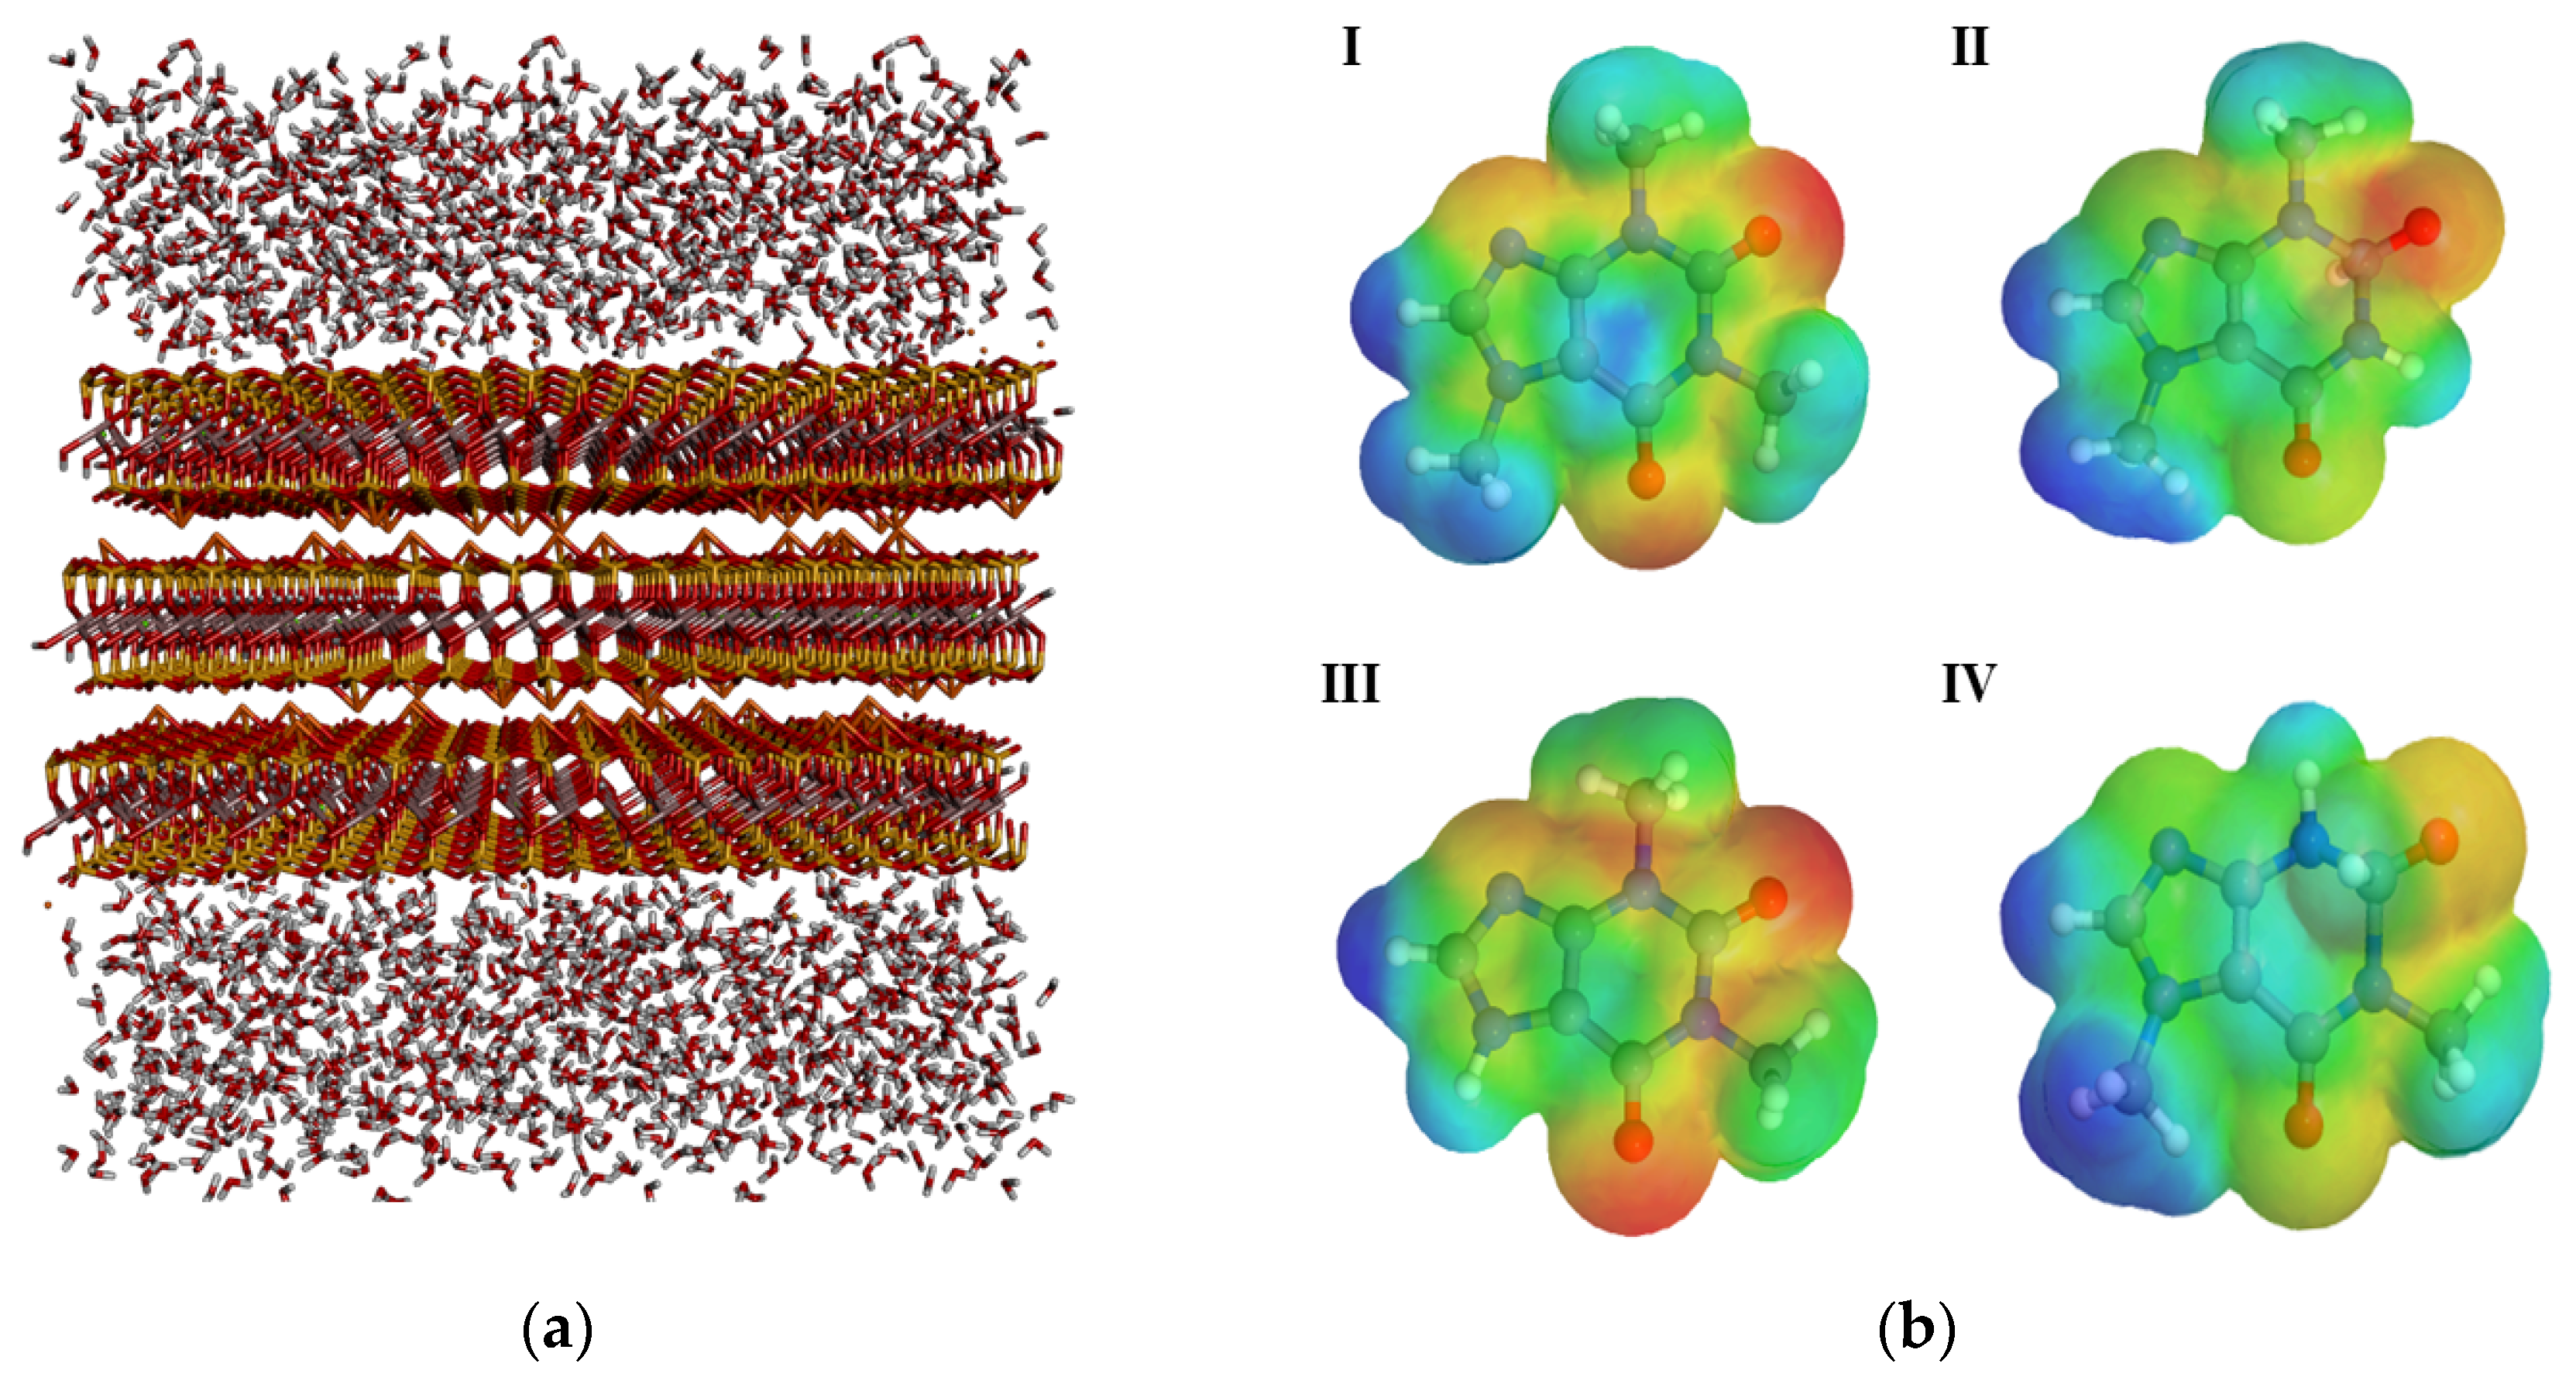
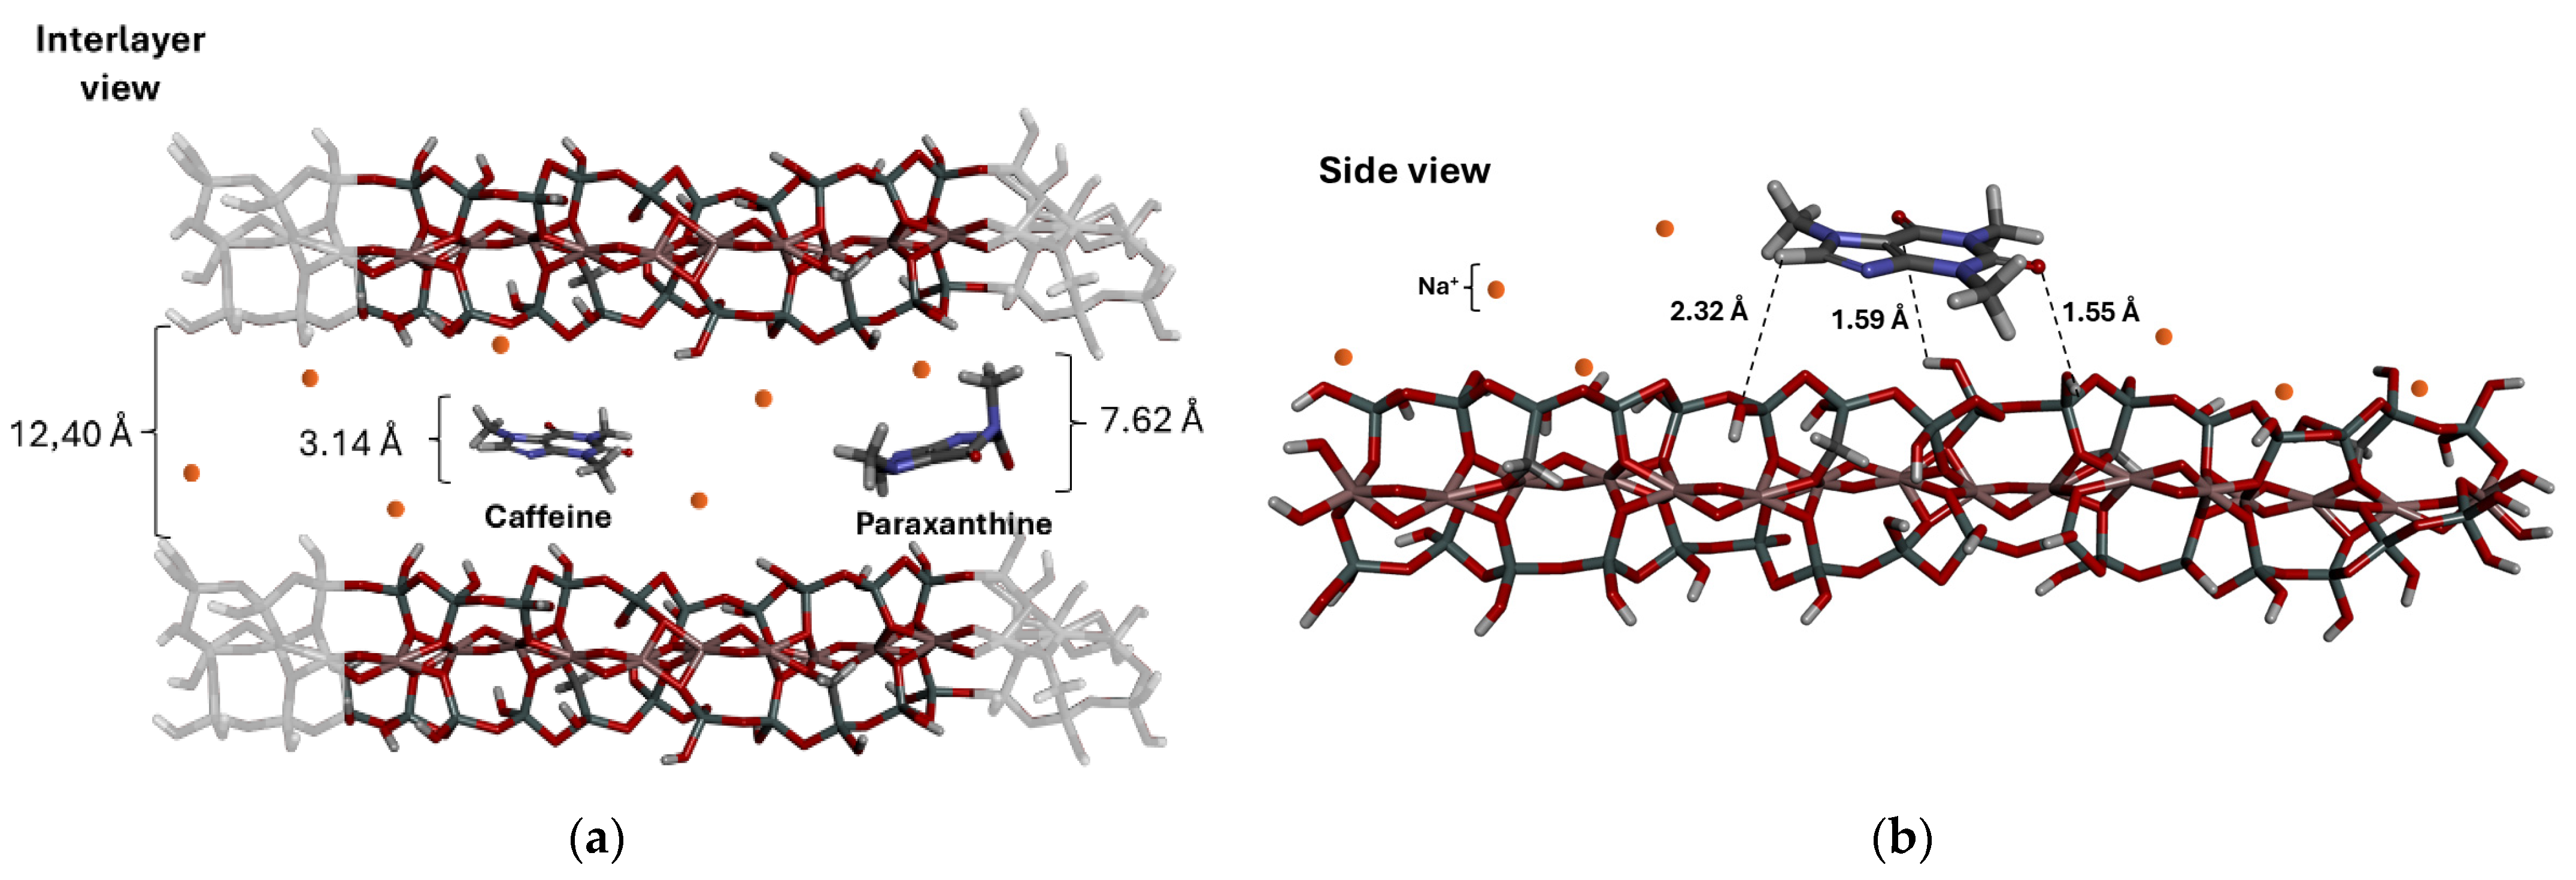
3.7. Molecular Modeling
4. Conclusions
Supplementary Materials
Author Contributions
Funding
Data Availability Statement
Acknowledgments
Conflicts of Interest
Abbreviations
| CF | caffeine |
| PX | paraxanthine |
| TB | theobromine |
| TP | theophylline |
| BT | bentonite |
| Na-BT | Na+-exchanged bentonite |
| SSAN2BET | specific surface area determined by N2 using the Brunauer–Emmett–Teller (BET) equation |
| GAMESS | General Atomic and Molecular Electronic Structure System software. |
References
- Heckman, M.A.; Weil, J.; de Mejia, E.G. Caffeine (1,3,7-Trimethylxanthine) in Foods: A Comprehensive Review on Consumption, Functionality, Safety, and Regulatory Matters. J. Food Sci. 2010, 75, 77–87. [Google Scholar] [CrossRef] [PubMed]
- Gracia-Lor, E.; Rousis, N.I.; Zuccato, E.; Bade, R.; Baz-Lomba, J.A.; Castrignanò, E.; Causanilles, A.; Hernández, F.; Kasprzyk-Hordern, B.; Kinyua, J.; et al. Estimation of Caffeine Intake from Analysis of Caffeine Metabolites in Wastewater. Sci. Total Environ. 2017, 609, 1582–1588. [Google Scholar] [CrossRef] [PubMed]
- Nehlig, A. Interindividual Differences in Caffeine Metabolism and Factors Driving Caffeine Consumption. Pharmacol. Rev. 2018, 70, 384–411. [Google Scholar] [CrossRef] [PubMed]
- Goldner, D.M.B.; do Nascimento, F.H.; Masini, J.C. A Green Liquid Chromatography Method for Simultaneous Quantification of Caffeine and Its Three Major Metabolites in Urine, Drinks, and Herbal Products. Sep. Sci. Plus 2024, 7, e202400098. [Google Scholar] [CrossRef]
- Li, S.; He, B.; Wang, J.; Liu, J.; Hu, X. Risks of Caffeine Residues in the Environment: Necessity for a Targeted Ecopharmacovigilance Program. Chemosphere 2020, 243, 125343. [Google Scholar] [CrossRef]
- Bachmann, S.A.L.; Calvete, T.; Féris, L.A. Caffeine Removal from Aqueous Media by Adsorption: An Overview of Adsorbents Evolution and the Kinetic, Equilibrium and Thermodynamic Studies. Sci. Total Environ. 2021, 767, 144229. [Google Scholar] [CrossRef]
- Anastopoulos, I.; Pashalidis, I.; Orfanos, A.G.; Manariotis, I.D.; Tatarchuk, T.; Sellaoui, L.; Bonilla-Petriciolet, A.; Mittal, A.; Núñez-Delgado, A. Removal of Caffeine, Nicotine and Amoxicillin from (Waste)Waters by Various Adsorbents. A Review. J. Environ. Manag. 2020, 261, 110236. [Google Scholar] [CrossRef]
- Fakioğlu, M.; Kalpaklı, Y. Mechanism and Behavior of Caffeine Sorption: Affecting Factors. RSC Adv. 2022, 12, 26504–26513. [Google Scholar] [CrossRef]
- Quintero-Jaramillo, J.A.; Carrero-Mantilla, J.I.; Sanabria-Gonzalez, N.R. A Review of Caffeine Adsorption Studies onto Various Types of Adsorbents. Sci. World J. 2021, 2021, 9998924. [Google Scholar] [CrossRef]
- Danish, M.; Birnbach, J.; Mohamad Ibrahim, M.N.; Hashim, R.; Majeed, S.; Tay, G.S.; Sapawe, N. Optimization Study of Caffeine Adsorption onto Large Surface Area Wood Activated Carbon through Central Composite Design Approach. Environ. Nanotechnol. Monit. Manag. 2021, 16, 100594. [Google Scholar] [CrossRef]
- Masini, J.C.; Abate, G. Guidelines to Study the Adsorption of Pesticides onto Clay Minerals Aiming at a Straightforward Evaluation of Their Removal Performance. Minerals 2021, 11, 1282. [Google Scholar] [CrossRef]
- Borisover, M.; Davis, J.A. Adsorption of Inorganic and Organic Solutes by Clay Minerals. In Natural and Engineered Clay Barriers; Tournassat, C., Steefel, C.I., Bourg, I.C., Bergaya, F., Eds.; Elsevier: Amsterdam, The Netherlands, 2015; Volume 6, pp. 33–70. [Google Scholar]
- Leite, S.T.; do Nascimento, F.H.; Masini, J.C. Fe(III)-Polyhydroxy Cations Supported onto K10 Montmorillonite for Removal of Phosphate from Waters. Heliyon 2020, 6, e03868. [Google Scholar] [CrossRef] [PubMed]
- do Nascimento, F.H.; Masini, J.C. Vermiculite Modified with Fe3+ Polyhydroxy Cations Is a Low-Cost and Highly Available Adsorbent for the Removal of Phosphate Ions. Minerals 2022, 12, 1033. [Google Scholar] [CrossRef]
- Teixeira, N.A.; Amorim Batista, L.F.; Schneider de Mira, P.; Scremin Miyazaki, D.M.; Grassi, M.T.; Zawadzki, S.F.; Abate, G. Modified Vermiculite as a Sorbent Phase for Stir-Bar Sorptive Extraction. Anal. Chim. Acta 2025, 1347, 343798. [Google Scholar] [CrossRef] [PubMed]
- Hai, L.; Wang, J. Experimental Study on the Heat Treatment Reaction Process of Bentonite. Sci. Rep. 2024, 14, 16649. [Google Scholar] [CrossRef]
- Marçal, L.; De Faria, E.H.; Nassar, E.J.; Trujillano, R.; Martín, N.; Vicente, M.A.; Rives, V.; Gil, A.; Korili, S.A.; Ciuffi, K.J. Organically Modified Saponites: SAXS Study of Swelling and Application in Caffeine Removal. ACS Appl. Mater. Interfaces 2015, 7, 10853–10862. [Google Scholar] [CrossRef]
- Okada, T.; Oguchi, J.; Yamamoto, K.I.; Shiono, T.; Fujita, M.; Iiyama, T. Organoclays in Water Cause Expansion That Facilitates Caffeine Adsorption. Langmuir 2015, 31, 180–187. [Google Scholar] [CrossRef]
- Yamamoto, K.; Shiono, T.; Matsui, Y.; Yoneda, M. Changes the structure and caffeine adsorption property of calcined montmorillonite. Int. J. GEOMATE 2016, 11, 2186–2990. [Google Scholar] [CrossRef]
- Lenzi, G.G.; Fuziki, M.E.K.; Fidelis, M.Z.; Fávaro, Y.B.; Ribeiro, M.A.; Chaves, E.S.; Lenzi, E.K. Caffeine Adsorption onto Bentonite Clay in Suspension and Immobilized. Braz. Arch. Biol. Technol. 2020, 63, e20180637. [Google Scholar] [CrossRef]
- Oliveira, M.F.; da Silva, M.G.C.; Vieira, M.G.A. Equilibrium and Kinetic Studies of Caffeine Adsorption from Aqueous Solutions on Thermally Modified Verde-Lodo Bentonite. Appl. Clay Sci. 2019, 168, 366–373. [Google Scholar] [CrossRef]
- Oliveira, M.F.; De Souza, V.M.; Da Silva, M.G.C.; Vieira, M.G.A. Fixed-Bed Adsorption of Caffeine onto Thermally Modified Verde-Lodo Bentonite. Ind. Eng. Chem. Res. 2018, 57, 17480–17487. [Google Scholar] [CrossRef]
- Quintero-Jaramillo, J.A.; Carrero, J.I.; Sanabria-González, N.R. Caffeine Adsorption on a Thermally Modified Bentonite: Adsorbent Characterization, Experimental Design, Equilibrium and Kinetics. Colloids Interfaces 2024, 8, 26. [Google Scholar] [CrossRef]
- Yamamoto, K.; Shiono, T.; Yoshimura, R.; Matsui, Y.; Yoneda, M. Influence of Hydrophilicity on Adsorption of Caffeine onto Montmorillonite. Adsorpt. Sci. Technol. 2018, 36, 967–981. [Google Scholar] [CrossRef]
- Yamamoto, K.; Shiono, T.; Matsui, Y.; Yoneda, M. Interaction of Caffeine with Montmorillonite. Part. Sci. Technol. 2017, 37, 325–332. [Google Scholar] [CrossRef]
- Shiono, T.; Yamamoto, K.; Yotsumoto, Y.; Yoshida, A. Caffeine Adsorption of Montmorillonite in Coffee Extracts. Biosci. Biotechnol. Biochem. 2017, 81, 1591–1597. [Google Scholar] [CrossRef]
- Shiono, T.; Yamamoto, K.; Yotsumoto, Y.; Kawai, J.; Imada, N.; Hioki, J.; Naganuma, H.; Eguchi, T.; Kurihara, M.; Yoshida, A.; et al. Selective Decaffeination of Tea Extracts by Montmorillonite. J. Food Eng. 2017, 200, 13–21. [Google Scholar] [CrossRef]
- Langmuir, I. The Adsorption of Gases on Plane Surfaces of Glass, Mica and Platinum. J. Am. Chem. Soc. 1918, 40, 1361–1403. [Google Scholar] [CrossRef]
- Freundlich, H. Über Die Adsorption in Lösungen. Z. Phys. Chem. 1907, 57U, 385–470. [Google Scholar] [CrossRef]
- Tran, H.N.; You, S.J.; Hosseini-Bandegharaei, A.; Chao, H.P. Mistakes and Inconsistencies Regarding Adsorption of Contaminants from Aqueous Solutions: A Critical Review. Water Res. 2017, 120, 88–116. [Google Scholar] [CrossRef]
- Sarigul, N.; Korkmaz, F.; Kurultak, İ. A New Artificial Urine Protocol to Better Imitate Human Urine. Sci. Rep. 2019, 9, 20159. [Google Scholar] [CrossRef]
- Komes, D.; Horžić, D.; Belščak, A.; Ganić, K.K.; Vulić, I. Green Tea Preparation and Its Influence on the Content of Bioactive Compounds. Food Res. Int. 2010, 43, 167–176. [Google Scholar] [CrossRef]
- Goh, R.; Leong, Y.K.; Lehane, B. Bentonite Slurries-Zeta Potential, Yield Stress, Adsorbed Additive and Time-Dependent Behaviour. Rheol. Acta 2011, 50, 29–38. [Google Scholar] [CrossRef]
- Callaghan, I.C.; Ottewill, R.H. Interparticle Forces in Montmorillonite Gels. Faraday Discuss. Chem. Soc. 1974, 57, 110–118. [Google Scholar] [CrossRef]
- Tunç, S.; Duman, O. The Effect of Different Molecular Weight of Poly(Ethylene Glycol) on the Electrokinetic and Rheological Properties of Na-Bentonite Suspensions. Colloids Surf. A Physicochem. Eng. Asp. 2008, 317, 93–99. [Google Scholar] [CrossRef]
- Duman, O.; Tunç, S. Electrokinetic and Rheological Properties of Na-Bentonite in Some Electrolyte Solutions. Microporous Mesoporous Mater. 2009, 117, 331–338. [Google Scholar] [CrossRef]
- Huang, W.; Leong, Y.K.; Chen, T.; Au, P.I.; Liu, X.; Qiu, Z. Surface Chemistry and Rheological Properties of API Bentonite Drilling Fluid: PH Effect, Yield Stress, Zeta Potential and Ageing Behaviour. J. Pet. Sci. Eng. 2016, 146, 561–569. [Google Scholar] [CrossRef]
- Ismadji, S.; Soetaredjo, F.E.; Ayucitra, A. Clay Materials for Environmental Remediation; Springer International Publishing: Cham, Switerland, 2015; ISBN 9783319167114. [Google Scholar]
- Alothman, Z.A. A Review: Fundamental Aspects of Silicate Mesoporous Materials. Materials 2012, 5, 2874–2902. [Google Scholar] [CrossRef]
- Kaufhold, S.; Dohrmann, R.; Klinkenberg, M.; Siegesmund, S.; Ufer, K. N2-BET Specific Surface Area of Bentonites. J. Colloid Interface Sci. 2010, 349, 275–282. [Google Scholar] [CrossRef]
- Yang, D.; Cheng, F.; Chang, L.; Wu, D. Sodium Modification of Low Quality Natural Bentonite as Enhanced Lead Ion Adsorbent. Colloids Surf. A Physicochem. Eng. Asp. 2022, 651, 129753. [Google Scholar] [CrossRef]
- Lafuente, B.; Downs, R.T.; Yang, H.; Stone, N. The Power of Databases: The RRUFF Project. In Highlights in Mineralogical Crystallography; Armbruster, T., Danisi, R.M., Eds.; De Gruyter: Berlin, Germany, 2015; pp. 1–30. [Google Scholar]
- Lichtenberg, D.; Bergmann, F.; Neiman, Z. Tautomeric Forms and Ionisation Processes in Xanthine and Its N-Methyl Derivatives. J. Chem. Soc. C 1971, 1676–1682. [Google Scholar] [CrossRef]
- Cavalieri, L.F.; Fox, J.J.; Stone, A.; Chang, N. On the Nature of Xanthine and Substituted Xanthines in Solution. J. Am. Chem. Soc. 1954, 76, 1119–1122. [Google Scholar] [CrossRef]
- Blanco, M.; Valverde, I. Electrophoretic Behaviour of Pharmacologically Active Alkylxanthines. J. Chromatogr. A 2002, 950, 293–299. [Google Scholar] [CrossRef] [PubMed]
- Sotelo, J.L.; Ovejero, G.; Rodríguez, A.; Álvarez, S.; García, J. Study of Natural Clay Adsorbent Sepiolite for the Removal of Caffeine from Aqueous Solutions: Batch and Fixed-Bed Column Operation. Water Air Soil. Pollut. 2013, 224, 1466. [Google Scholar] [CrossRef]
- Cabrera-Lafaurie, W.A.; Román, F.R.; Hernández-Maldonado, A.J. Transition Metal Modified and Partially Calcined Inorganic-Organic Pillared Clays for the Adsorption of Salicylic Acid, Clofibric Acid, Carbamazepine, and Caffeine from Water. J. Colloid Interface Sci. 2012, 386, 381–391. [Google Scholar] [CrossRef]
- Sakuma, H.; Tamura, K.; Hashi, K.; Kamon, M. Caffeine Adsorption on Natural and Synthetic Smectite Clays: Adsorption Mechanism and Effect of Interlayer Cation Valence. J. Phys. Chem. C 2020, 124, 25369–25381. [Google Scholar] [CrossRef]
- Zarpon, L.; Abate, G.; dos Santos, L.B.O.; Masini, J.C. Montmorillonite as an Adsorbent for Extraction and Concentration of Atrazine, Propazine, Deethylatrazine, Deisopropylatrazine and Hydroxyatrazine. Anal. Chim. Acta 2006, 579, 81–87. [Google Scholar] [CrossRef]
- Zambonin, C.G.; Aresta, A.; Palmisano, F. Determination of Methylxanthines in Urine by Liquid Chromatography with Diode Array UV Detection. J. Pharm. Biomed. Anal. 2004, 36, 621–624. [Google Scholar] [CrossRef]
- Greathouse, J.A.; Cygan, R.T. Molecular Simulation of Clay Minerals. In Developments in Clay Science; Elsevier: Amsterdam, The Netherlands, 2013; Volume 5, pp. 405–423. [Google Scholar] [CrossRef]
- Johnson, E.R.; Otero-De-La-Roza, A. Adsorption of Organic Molecules on Kaolinite from the Exchange-Hole Dipole Moment Dispersion Model. J. Chem. Theory Comput. 2012, 8, 5124–5131. [Google Scholar] [CrossRef] [PubMed]
- Cancade, M.; Thiebault, T.; Mignon, P. Selective Adsorption of Organic Micro-Pollutants by Smectite Clays Revealed from Atomistic Simulations. Int. J. Mol. Sci. 2023, 24, 14781. [Google Scholar] [CrossRef]
- Zhang, I.Y.; Wu, J.; Xu, X. Extending the Reliability and Applicability of B3LYP. Chem. Commun. 2010, 46, 3057–3070. [Google Scholar] [CrossRef]
- Min, F.; Wang, L.; Chen, J.; Liu, C.; Ren, B.; Zhang, L.; Zhu, Y. Molecular Simulation in Surface Hydration of Clay Minerals: A Review of Theory and Applications. Miner. Miner. Mater. 2022, 1, 3. [Google Scholar] [CrossRef]
- Tantardini, C. When Does a Hydrogen Bond Become a van Der Waals Interaction? A Topological Answer. J. Comput. Chem. 2019, 40, 937–943. [Google Scholar] [CrossRef] [PubMed]


| Freundlich Parameters | ||||||||
| Compound | Individual Compounds | Mixed Compounds | ||||||
| KF ((mg/g)/(mg/L)n) | 1/n | R2 | Reduced χ2 | KF ((mg/g)/(mg/L)n) | 1/n | R2 | Reduced χ2 | |
| CF | 1.6 ± 0.2 a | 0.60 ± 0.04 | 0.90 | 1.38 | 1.9 ± 0.4 | 0.93 ± 0.05 | 0.97 | 0.072 |
| TB | 0.06 ± 0.01 | 1.20 ± 0.07 | 0.96 | 0.070 | 0.37 ± 0.07 | 0.77 ± 0.05 | 0.97 | 0.21 |
| PX | 0.02 ± 0.01 | 1.5 ± 0.2 | 0.96 | 0.28 | 0.12 ± 0.04 | 0.99 ± 0.09 | 0.97 | 0.21 |
| TP | 0.009 ± 0.003 | 1.50 ± 0.08 | 0.99 | 0.028 | 0.10 ± 0.02 | 0.93 ± 0.05 | 0.93 | 1.22 |
| Langmuir Parameters | ||||||||
| Compound | KL (L/g) | qmax (mg/g) | R2 | Reduced χ2 | KL (L/g) | qmax (mg/g) | R2 | Reduced χ2 |
| CF | 0.05 ± 0.02 | 20 ± 3 | 0.95 | 0.70 | 0.08 ± 0.02 | 19 ± 2 | 0.94 | 1.00 |
| Adsorbent | qmax (mg/g) | KL (L/g) | Temperature (°C) | pH | Contact Time (min) | Dose (g/L) | Conc. Range (mg/L) | Ref. |
|---|---|---|---|---|---|---|---|---|
| Thermally modified Verdo-lodo bentonite | 40.8 | 0.03 | 25 | - | 2400 | 1.6 | 11.65–1165 | [21] |
| Organically modified saponites | 88.0 | 31 | 25 | 6 | 240 | 10 | 10–800 | [17] |
| Calcined bentonite | 41.67 | 0.72 | 25 | 2 | 1440 | 0.0005 | - | [20] |
| Organoclay (montmorillonite) | 143.7 | 7 | 25 | - | 1440 | 0.2 | 9.9–407.8 | [18] |
| Calcinated montmorillonite | 99.0 | - | - | - | 60 | 10 | 10–5000 | [19] |
| Na-type montmorillonite | 120.4 | 1.65 | room | - | 60 | 0.01 | 10–5340 | [24] |
| Montmorillonite | 122.3 | - | room | - | 60 | 100 | 9.7–5340 | [25] |
| Thermally modified bentonite | 80.3 | 0.069 | 25 | 8 | 120 | 2 | 5–250 | [23] |
| Montmorillonite | 61.2 | 17.13 | 25 | - | 120 | 20 | 4–50 | [27] |
| Montmorillonite | 64.7 | 15.1 | 25 | - | 120 | 40 | 1204.0 | [26] |
| Sepiolite | 48.7 | 200 | 25 | - | * | * | * | [46] |
| Copper-modified and partially calcined inorganic–organic bentonite | 6.70 | 300 | room | - | 1320 | 6.67 | 1–22 | [47] |
| Sodium Montmorillonite | 128.2 | - | 25 | 10 | 1440 | 10 | 19.41–5826 | [48] |
| Sodium Hectorite | 163.1 | - | 25 | 10.7 | 1440 | 10 | 19.41–5826 | [48] |
| Sodium-exchanged bentonite | 20 ± 3 | 0.05 ± 0.02 | 25 | - | 30 | 6 | 5–100 | This work |
| TB | PX | CF | |||||||
|---|---|---|---|---|---|---|---|---|---|
| Sample | Extract Concentration (µg/mL) | Equilibrium Concentration (µg/mL) | Removal (%) | Extract Concentration (µg/mL) | Equilibrium Concentration (µg/mL) | Removal (%) | Extract Concentration (µg/mL) | Equilibrium Concentration (µg/mL) | Removal (%) |
| Cola soda | <LOD | - | - | <LOD | - | - | 97.4 ± 0.7 | <(LOD) | >99.9 |
| Soluble coffee | <LOD | - | - | 12.82 ± 0.02 | 11.7 ± 0.4 | 9.0 | 791.0 ± 1.5 | 457.7 ± 1.5 | 42.1 |
| Energy drink | <LOD | - | - | <LOD | - | - | 263.5 ± 0.6 | 33.1 ± 0.6 | 87.4 |
| Green tea | 2.71 ± 0.05 | 0.57 ± 0.02 | 78.9 | <LOD | - | - | 82.2 ± 0.6 | 0.61 ± 0.01 | 99.6 |
| Yerba mate | 6.5 ± 0.1 | 2.8 ± 0.1 | 56.0 | <LOD | - | - | 33.4 ± 0.6 | 2.10 ± 0.06 | 93.7 |
| Removal (%) | ||||
|---|---|---|---|---|
| Spike (µg/mL) | TB | PX | TP | CF |
| 5.0 | 92.7 | 96.9 | 85.7 | >98 |
| 10.0 | 88.3 | 96.7 | 96.7 | >99 |
| CF | TB | TP | PX | |
|---|---|---|---|---|
| Electrostatic Interaction of Deprotonated Molecules (Kcal/mol) | ----- | −63.76 | −63.97 | −63.64 |
| Electrostatic Interaction of Neutral Molecules (Kcal/mol) | −8.39 | −9.81 | −9.05 | −8.83 |
| Energy Interaction of System (Kcal/mol) | −17.44 | −1.10 | −5.87 | −12.31 |
Disclaimer/Publisher’s Note: The statements, opinions and data contained in all publications are solely those of the individual author(s) and contributor(s) and not of MDPI and/or the editor(s). MDPI and/or the editor(s) disclaim responsibility for any injury to people or property resulting from any ideas, methods, instructions or products referred to in the content. |
© 2025 by the authors. Licensee MDPI, Basel, Switzerland. This article is an open access article distributed under the terms and conditions of the Creative Commons Attribution (CC BY) license (https://creativecommons.org/licenses/by/4.0/).
Share and Cite
Goldner, D.M.B.; Viana, L.; Masini, J.C. Adsorption of Caffeine and Demethylated Metabolites on Na+-Exchanged Bentonite. Minerals 2025, 15, 573. https://doi.org/10.3390/min15060573
Goldner DMB, Viana L, Masini JC. Adsorption of Caffeine and Demethylated Metabolites on Na+-Exchanged Bentonite. Minerals. 2025; 15(6):573. https://doi.org/10.3390/min15060573
Chicago/Turabian StyleGoldner, Débora M. B., Luan Viana, and Jorge C. Masini. 2025. "Adsorption of Caffeine and Demethylated Metabolites on Na+-Exchanged Bentonite" Minerals 15, no. 6: 573. https://doi.org/10.3390/min15060573
APA StyleGoldner, D. M. B., Viana, L., & Masini, J. C. (2025). Adsorption of Caffeine and Demethylated Metabolites on Na+-Exchanged Bentonite. Minerals, 15(6), 573. https://doi.org/10.3390/min15060573