Abstract
The unreasonable parameters of mill liner lifter bars will not only decrease the operating rate of the mill and increase electricity consumption but, also, seriously restrict the production capacity of the mill. Therefore, optimizing the parameters of liner lifter bars is helpful to save energy, improve its production capacity, and increase benefits for enterprises. Given the unreasonable parameters of the lifter bars of the semi-autogenous grinding (SAG) mill in a beneficiation plant in Yunnan (China), the distinct element method (DEM) with orthogonal tests was used to conduct simulation, the simulation results demonstrating that the three parameters all had significant influence on the collision energy, with the order of group numbers > angles > heights by the analysis of range and variance, and the optimal parameters combination, with angles of 20°, groups of 12, and heights of 210 mm, was obtained. Then, the lifer bars optimized were applied in industrial tests to verify their effect, and the results illustrated that all of the service life of lifter bars, the operating rate, production capacity, and electricity consumption were significantly improved at 159 days, 92.32%, 54.37 t/h, and 21.45 kW·h/t, respectively. This paper proposes a reference for the similar design and optimization of lifter bars for the other beneficiation plants.
1. Introduction
Lifter bars as a liner part play a pivotal role in grinding efficiency and economy (Powell, Weerasekara et al., 2011 [1], because they cannot only protect the shell of a mill from wear but, also, are an important carrier of energy by transferring energy to the grinding media and minerals (Rezaeizadeh, Fooladi, et al., 2010; Tomach, 2024) [2,3]. The grinding classification system of a beneficiation plant in Yunnan was investigated, results of which showed parameters with angles, heights, and group numbers of 15°, 230 mm, and 12, respectively, of the liner lifter bars of the semi-autogenous grinding (SAG) mill studied with a size of Ф5566 mm that were unreasonable because (1) the distance between the adjacent lifter bars was only 229 mm; however, the maximum size of 300 mm of ore fed acting as the grinding media could not be lifted, resulting in a large fluctuation of the SAG mill production capacity and far below the design capacity of 6000 t/d. (2) The height of 230 mm of the lifter bars led to the liner frequently colliding with steel balls during the process of dropping, reducing the liner’s service life and leading to a further decline in production capacity. Therefore, it was particularly necessary to optimize the parameters of the lifter bars on site.
The distinct elements method (DEM) has been used as a simulation method to gain insight into particle flow processes with shorter periods and energy consumption than the actual experiment (Rezaeizadeh, Fooladi, et al., 2010) [2]. When applied in grinding, it allows one to study several aspects of grinding in greater detail than has been possible so far, such as feed viscosity and feed size distribution (Jonsén, Pålsson et al., 2011) [4]. Since simulation based on DEM can visually display the motion trajectory of materials and clearly show the motion status of cascading and cataracting of grinding media in the mill (Wu and Wang, 2014) [5], at present, scholars have carried out a large number of studies on the grinding process based on the DEM, mainly from the motion state of materials and collision energy between grinding media and minerals (Jiang, 2022) [6], to the wear law of the mill liner, media (Xie and Zhao, 2022) [7], and power consumption (Cleary, 2019; Li, You et al., 2022) [8,9], and then to the grinding law under wet grinding and so on (Lin, Yang, et al., 2020) [10].
Qiyue Xie et al. studied the operation of an SAG mill under different conditions based on DEM and the breakage energy method; the results elaborated that, during the working process of the mill, the mill speed was crucial to the breakage effect, followed by the fill ratio, then the steel ball ratios (Xie, Zhong et al., 2020) [11]. It happens that Changhua Xie et al. also studied the influence of ore filling level and media filling level on energy consumption and vibration of an SAG mill through combining the method of the shear impact energy model and DEM. The results of energy consumption showed that increasing the ore filling level would increase energy consumption and reduce the energy efficiency and wear of the liner and grinding media; meanwhile, the results of the experiment of the vibration of the mill demonstrated that the low-frequency but high-energy collision between grinding media and the liner was the main reason for liner wear and mill vibration (Xie, Zhao, et al., 2022) [12]. Zhengbin Liu et al. performed a test with a laboratory-scale SAG mill based on DEM-EMBD, whose results also demonstrated that the particle motion characteristics were mainly determined by the fraction of critical speed and lifter face angle. The particle collision energy was mainly determined by lifter face angle and rock shape (Liu, Wang, et al., 2022) [13]. Simultaneously, Lei Xu et al. conducted a numerical prediction of wear in SAG mills based on DEM simulations combined with an erosion model. One of the results illustrated that the lifter shape has some effects on the wear of the liners within an SAG mill and the maximum wear rate increases with decreasing lifter face angle (from 30° to 0°) and increasing lifter height (from 100 to 200 mm) (Xu, Luo et al., 2018) [14].
Although a lot of previous encouraging results have been achieved by using the DEM by scholars, most real ore particles are irregular polyhedrals neglected in their research. However, Changhua Xie et al. proposed a contact model of a polyhedron sphere compared with a pure sphere (SP) through DEM in the SAG mill grinding system to explore the effect of particle shape on results. The results showed that both the power consumption and energy utilization efficiency were greater somewhat in the polyhedron sphere model, the reason for which was the ore particles and the grinding media were lifted to a higher height, which led to larger energy collisions at the toe area (Xie, Ma et al., 2021) [15]. XU Lei et al. also studied the influence of particle shape on the wear of the liner of the roller mill and concluded that the wear of cube nonspherical particles was greater than that of spherical particles, and the sliding of particles in the cylinder had a great influence on the wear of lifter bars (Xu, Luo, et al., 2019) [16].
It is proverbial that orthogonal tests are efficient, fast, and economical experimental design methods for studying multifactor and multilevel because some representative points with the characteristics of “uniform dispersion, homogeneous and comparable” can be selected from the comprehensive experiment (Liu, Li et al., 2020; Su, Xu et al., 2022) [17,18].
Therefore, herein, the effect of parameters of lifter bars on the motion state and collision energy between the materials inside the mill during the process of grinding is analyzed with DEM simulation to explore the optimal parameter combination with the orthogonal methods, which can verify DEM simulation results and declare the significance of the influence of each parameter of lifter bars on the grinding process. What counts is that the lifter bars optimized by the combination style have been applied to the industrial tests and a glorious triumph has been harvested.
2. Materials and Methods
2.1. Materials
2.1.1. Fraction Composition of Feed and Discharge
The raw ores were gold ores and were taken from a mine in Yunnan Province (China), and manually and mechanically screened (BXF Cyclone Particle Size Analyzer, Beijing General Research Institute of Mining and Metallurgy, Beijing, China). The fraction composition of feed and discharge of the SAG mill were as seen in Figure 1 and Figure 2. According to Figure 1, (1) the particle size of 95% screened for SAG mill feed is 188.11 mm; (2) the yield of coarse fraction with +100 mm acting as SAG mill media is 35.91%; and (3) the yield of the pebble of −80 - +25 mm is accounted for as 14.61%, which is relatively large and easy to form the accumulation of pebble. It can be illustrated from Figure 2 that each fraction of discharge is even on account of the cumulative curve approaching a straight line.
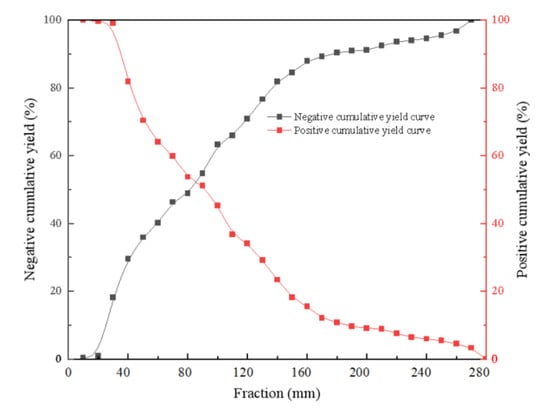
Figure 1.
Fraction composition of SAG mill feed.
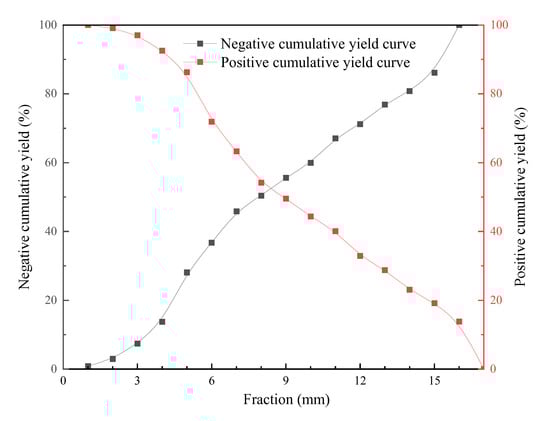
Figure 2.
Fraction composition of SAG mill discharge.
2.1.2. Mechanical Properties of Ores
The mechanical properties of ore were tested (shear resistance, microcomputer controlled electro-hydraulic servo pressure testing machine, YAW4206T, Metus Industrial Systems (China) Co., Ltd. Shenzhen branch, Shenzhen, China; compression, computer automatic constant stress testing machine, DYE-2000S, Tianjin Metes test machine factory, Tianjin, China), and the results of mechanical properties of ores are shown in Figure 3.
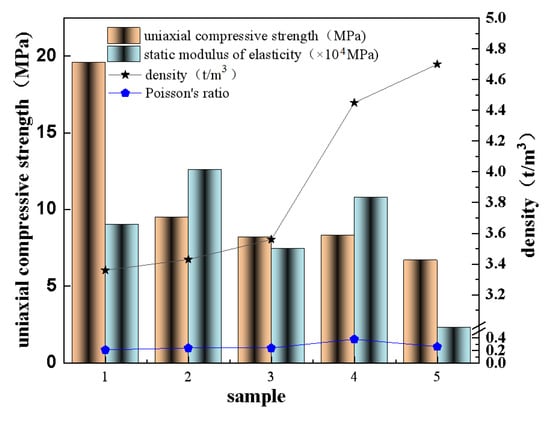
Figure 3.
Results of mechanical properties of ores.
It is seen from Figure 3 that (1) the true densities of ores with a large change vary from 4.70 t/m3 to 3.36 t/m3, and the average is 3.90 t/m3, which is easy to deposit and difficult to discharge in the grinding classification cycle, as for over-crushing. (2) The Platts hardness coefficients of the ores are from the maximum of 19.6 to the minimum of 6.69, indicating that the distribution of the ore softness and hardness is not uniform, with the average hardness of 9.64, belonging to the media hardness. (3) The maximum elastic modulus of ore is 12.6 × 10⁴ MPa, whereas the minimum is 2.33 × 10⁴ MPa, and the average is 8.44 × 10⁴ MPa, which is much greater than that of brittle limestone (Wu, Yukai et al., 2022) [19], indicating that the ore has a larger brittleness. (4) The maximum and minimum Poisson’s ratio of ore are 0.38 and 0.21, with an average of 0.27, showing the overall toughness is hard.
Therefore, during the grinding process, it is necessary to consider that not only is the high density of ore easy to deposit but, also, the hardness and toughness of ore is difficult to grind, in addition to the existence of brittleness. Hence, it is extremely important and economical to optimize the parameters of the lifter bars of the SAG mill under the current conditions of ore mechanical properties.
2.2. Model Drawing in SolidWorks
SolidWorks software is a Windows product that specializes in drawing and developing mechanical design software. By directly drawing the desired liner in the software, the shape of the liner can be restored one by one, saving huge manufacturing costs and a lot of labor force compared with direct manufacturing.
Firstly, according to the length and radius of the cylinder liner of an SAG mill, the physical model of the liner was built with the steel quality in SolidWorks software (2018 version), as shown in Figure 4. However, to carry out efficient simulation, an axial slice with a thickness of 0.3 m in the middle position of an SAG mill was taken to represent the whole mill (Weerasekara, Powell, et al., 2013) [20]. Next, the lifter bars with heights of 190 mm, 210 mm, and 230 mm, respectively, angles of 20°, 25°, and 30°, respectively, and group numbers of 12, 18, and 24, respectively, were drawn in the software. Being consistent with production conditions on site, the mill rotation rate, ore filling rate, and media filling rate were set to 76%, 22%, and 13%, respectively.
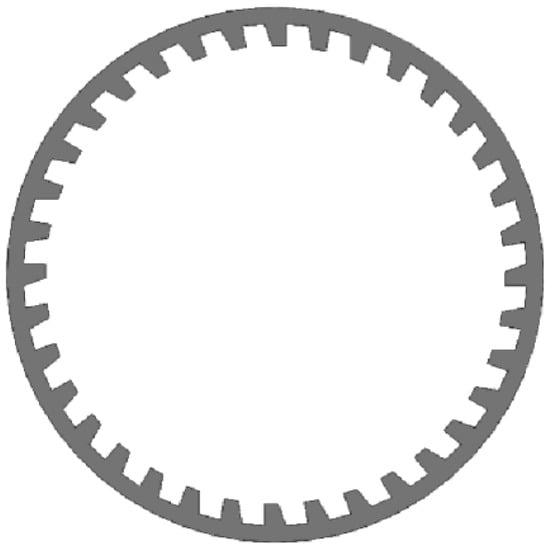
Figure 4.
Main view of cylinder liner of SAG mill with the diameter of 5.5 m.
2.3. Simulation of DEM
2.3.1. Contact Model Theory of DEM
During distinct element simulating, the Hertz Mindlin contact model, one of the many contact models, has more advantages in the simulation tests of non-viscous granular particles (Xu, Kafui et al., 2002) [21] because the contact model can match the nonlinear function relationship of contact stiffness with contact displacement and contact force and can simulate the impact behavior between particles. In the herein simulation tests, it is established that there is no bonding force among the ore, and the contact relationship between the particle model elements has the characteristics of nonlinear and anisotropic, which is consistent with the advantages of the Hertz Mindlin contact model. Therefore, the Hertz Mindlin (no slip) contact model is chosen in this paper.
The schematic diagram of the contact model is shown in Figure 5, and the radii of the two particles are set as R1 and R2, respectively. As mentioned in reference (Dong, Fatahi, et al., 2018) [22], when two spherical particles have an elastic collision, the normal force Fn of the two spherical particles can be calculated by Formula (1):
where R* is the equivalent radius of two spherical particles, .
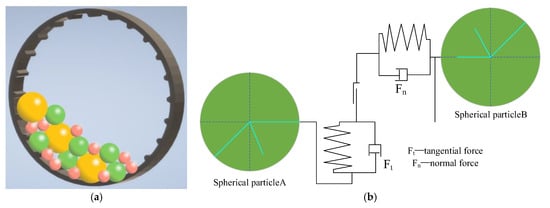
Figure 5.
Schematic diagram of contact model. (a) Schematic diagram of contact between particles (b) Contact model of Hertz Mindlin.
E* is equivalent elastic modulus, , where E1 and E2 are elastic moduli and v1 and v2 are Poisson’s ratio of spherical particles.
is the amount of normal overlap.
The normal damping force between two particles, , can be calculated by Formula (2).
where is the equivalent mass of two spherical particles, .
is the coefficient, .
is normal stiffness, .
is the recovery coefficient of particles.
The tangential force between two particles, , can be calculated by Formula (3):
where is the amount of normal overlap.
is tangential stillness, , where is the equivalent shear modulus,
, and and are the shear moduli of two spherical particles.
The tangential damping force between two particles, , can be calculated by Formula (4):
where is the relatively tangential velocity between two spherical particles.
2.3.2. Establishment of Particle Model
It would take months, if not years, to simulate the actual particle size of the ore, so the shape and size of ore particles usually were optimized (Govender, Rajamani, et al., 2018) [23] to improve the simulation speed on the premise of ensuring simulation accuracy. To make the ore particles closer to the situation on site, it was represented by irregular geometry shapes drawn by CAD, whereas the grinding media particles were represented by spheres, as shown in Figure 6. The grinding media of an SAG mill used in this simulation were steel balls with 140 mm and 127 mm, and the size of the ore particle was set at 250 mm, 200 mm, 150 mm, 120 mm, 100 mm, 80 mm, 45 mm, and 35 mm, respectively. The shape and number of materials inside the mill were generated by EDEM. The materials’ composition is shown in Table 1.
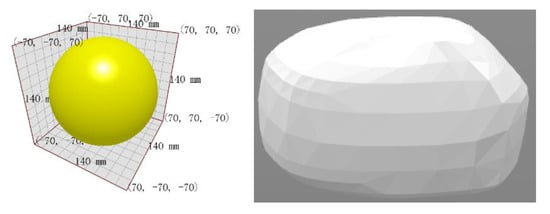
Figure 6.
Model of steel balls (left) and ore (right).

Table 1.
Materials’ content during the simulation process.
2.3.3. DEM Parameters
The Expert in Discrete Elements Method is a simulation software (2022 version) based on DEM. Using EDEM, a parameterized model can be built quickly and easily. The shape of particles can be accurately described by importing CAD models of real particles, and other mechanical properties, material properties, and other physical properties can be added to this software.
EDEM can efficiently complete the analysis of collision energy between materials with different liner parameters. The simulation parameters are determined by the Calibrai-ton_Toolkit_v2 parameter calibration tool of the EDEM. The parameters during the simulation and the SAG mill on site are shown in Table 2 and Table 3 (Wu, Yukai et al., 2022) [19].
Table 2.
Parameters of EDEM simulation.
Table 3.
Operation parameters of a SAG mill.
2.4. Orthogonal Test
It is indispensable that the orthogonal test was used to analyze the significance of the influence of the angle, height, and group numbers of the lifter bars on the energy collision in the limited time and space to better guide the modification of the lifter bars.
2.4.1. Determination of Test Indexes
The breakage behavior of the ores inside an SAG mill is closely related to the collision energy between steel balls–ore (B-O) and ore–ore (O-O). Based on the stable operation of the mill, total collision energy (T-C-E) and collision energy between B-O and O-O were selected as the index to quantitatively measure the test results in this study.
2.4.2. Determination of Factors and Levels
Combined with the field experience, angles of 20°~30°, heights of 190 mm~230 mm, and group numbers of 12~24 of lifter bars were determined as the orthogonal test factors A, B, and C, respectively. In addition, the details of the three levels of each factor set are shown in Table 4.
Table 4.
Test factors and levels.
2.4.3. Design of Orthogonal Test Scheme
According to the three factors and levels of orthogonal tests mentioned in 2.4.1 and 2.4.2, the orthogonal scheme of L9(34) was selected in this paper based on the selection principle (Liu, Li et al., 2020; Su, Xu et al., 2022) [17,18], and the test scheme is shown in Table 5.
Table 5.
Scheme of orthogonal test.
2.5. Industrial Test
The optimal parameter combination of a liner lifting strip verified by the above tests was tested in a Φ5.5 × 6.6 m SAG mill in a beneficiation plant in Yunnan. This experiment took August 2022 as the time node, and the indexes before and during the industrial tests were collected and analyzed with the service life of the liner, mill operating rate, bench efficiency, and power consumption.
3. Results and Discussion
3.1. Analysis of EDEM Simulation
The steady running time means that, after the mill is turned on for a certain time, the running power of the mill will not change greatly from then on, simulation was selected to analyze, and the collision energies between materials and the movement trajectory of materials inside the SAG mill under different schemes were compared. In the early stage of the experiment, it was proved that the steady running time of the SAG mill was from 21.30 to 25.62 s, that is, the time interval used in the simulation analysis was 4.32 s.
3.1.1. Movement State of Materials Inside an SAG Mill with the Different Parameters Based on the Orthogonal Scheme
The EDEM simulation tests were carried out randomly according to the orthogonal test scheme to reduce the test error. The movement states with different schemes are shown in Figure 7.
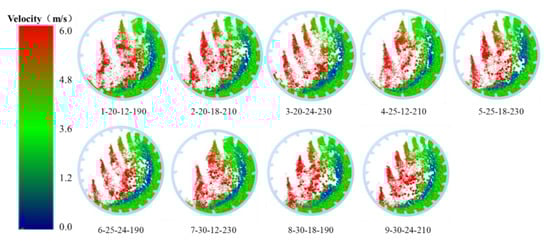
Figure 7.
Movement states of materials inside an SAG mill with different parameters.
It can be seen from Figure 7, that the single volume of materials lifted gradually decreases obviously from group numbers of 12 to 24. In addition, the heights lifted and horizontal displacements thrown gradually lower and reduce, respectively, with the angles of lifter bars increasing. Nevertheless, the effect of the height of lifter bars on grinding cannot be judged through this figure.
3.1.2. Collision Energy Between Materials Inside a SAG Mill with the Different Parameters Based on Orthogonal Scheme
Collision energies with the different parameter combinations of lifter bars based on the orthogonal scheme were calculated, and the results are shown in Table 6.
Table 6.
Collision energy between materials with the different parameters of orthogonal scheme.
As can be seen from the Table 6, we can find a pattern that the collision energy of O-O is always greater than twice that of B-O, indicating that the crushing of the ores inside the SAG mill is mainly due to their impact on each other. In addition, both the collision energy of O-O and B-O under the combination of angles of 20°, group numbers of 12, and heights of 190 mm are the greatest in the scheme with 502,881 J and 180,957 J, greater than that under current lifter bars.
3.2. Analysis of Orthogonal Tests
To further explore the significance of the influence of the lifter bar parameters on grinding and search for the optimal parameter combination of lifter bars, orthogonal tests were used to make statistics and analyze the EDEM simulation results.
3.2.1. Range Analysis of Collision Energy
Range analysis is a means to analyze the influence and its extent (Cong, Zhang et al., 2021) [24]. It reflects the variation range of the test index, and, the larger the fluctuation is, the greater the influence on the test index, which means the influence of the parameters of lifter bars on collision energy increases with the range increasing. The results of range analysis of collision energy between B-O, O-O, and T-C-E are shown from Table 7.
Table 7.
(1) Range analysis of collision energy between B-O. (2) Range analysis of collision energy between O-O. (3) Range analysis of collision energy between T-C-E.
It can be seen from Table 7 that all the range values R under the factor of group numbers are the largest, being 60,211 J, 192,308 J, and 252,519 J, respectively, indicating that the group numbers of lifter bars are the most important influencing factor on grinding, maybe because it can change the motion state of materials inside the mill and activity degree. In addition, the angle of the lifter bars is the secondary influencing factor, and the R is 55,872 J, 173,761 J, and 229,633 J, respectively. However, the influence of the height of the lifter bars on grinding is the smallest with an R of 44,722 J, 134,573 J, and 179,295 J, respectively. The higher the collision energy is, the more beneficial the crushing effect. Comparing the under the three factors, the value of with the factor of A-angles is the largest, indicating that A1 (20°) is the optimal level. Similarly, the B1 (12 groups) and the C2 (210 mm) are the optimal levers under the factors of B-group numbers and C-heights, respectively. However, it is worth noting that the best combination of A1B1C2 is not within the group of the above orthogonal scheme, so the test of A1B1C2 should be added for comparison. The collision energy of B-O, O-O, and T-C-E of the test added was 182,442 J, 517,892 J, and 700,334 J, respectively, all greater than the maximum value of 180,957 J, 502,881 J, and 683,838 J in the scheme, indicating that the orthogonal test is valid and reasonable.
In summary, the influence of each factor on the collision energy from strong to weak was B-group numbers, A-angle, and C-height. The greatest collision energy can be obtained by the optimal parameter combination A1B1C2 of lifter bars.
3.2.2. Variance Analysis of Collision Energy
Range analysis has a simple calculation process, but the influence of each factor on the test results cannot be evaluated by accurate numerical values; in addition, whether the effect of the factors is significant or not cannot be judged. To make up for the deficiency of range analysis, it is proposed to use variance analysis for further research. The results of variance analysis of the collision energy are shown from Table 8. In the table, DOF is the abbreviation of freedom and RMSE is the abbreviation of mean square error.
Table 8.
(1) Variance analysis of collision energy between B-O. (2) Variance analysis of collision energy between O-O. (3) Variance analysis of collision energy between B-O and O-O.
It can be seen from Table 8 that all of the three factors have a significant impact on the collision energy, with the order being the group numbers > angle > height, which is completely consistent with the results analyzed by the range analysis. Therefore, the group numbers should be given priority in optimizing the lifter bars; then, the angle is the second and the height is the last.
3.3. Analysis of Industrial Tests
There were no changes in operation parameters before and after the lifter bars were optimized, including raw ore hardness, ore size, media material and size, grate shape, water feed, grinding concentration, mill rotation rate, and so on.
3.3.1. Comparison of Operating Rate of the SAG Mill
The operating rate of the SAG mill is an important basis for evaluating the performance of the liner, and the differences before and after the lifter bars were optimized can be intuitively counted and compared. The calculation detail of the operating rate can be seen in Equation (5).
The operating rate results of the SAG mill before and after the lifter bars were optimized are shown in Figure 8.
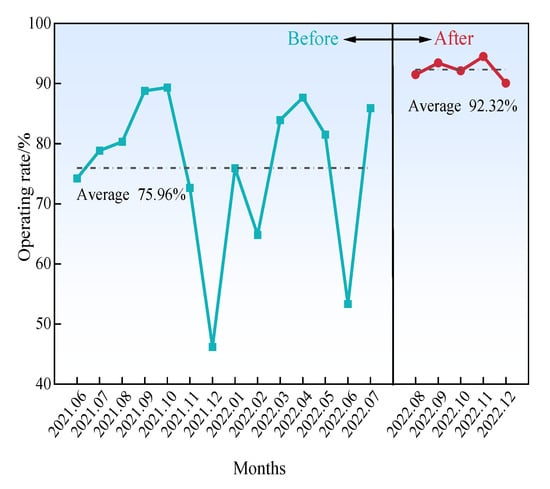
Figure 8.
The operating rate of the SAG mill before and after the lifter bars were optimized.
As can be seen from Figure 8, the average operating rate before and after the lifter bars were optimized was 75.96% and 92.32% respectively, with the operating rate after the lifter bars were optimized being 16.36 percentage points higher than that before the lifter bars were optimized, indicating that the optimized lifter bars can better meet the ores’ mechanical properties; that is to say, under the same condition, the higher the operating rate is, the greater the production capacity and the better the benefit is.
3.3.2. Comparison of Production Capacity of the SAG Mill
Under the condition that the sizes of feed and discharge of the SAG mill were the same, the production capacity of the SAG mill before and after lifting bars were optimized can be visually compared. The results of the production capacity of the SAG mill before and after the lifter bars were optimized are shown in Figure 9.
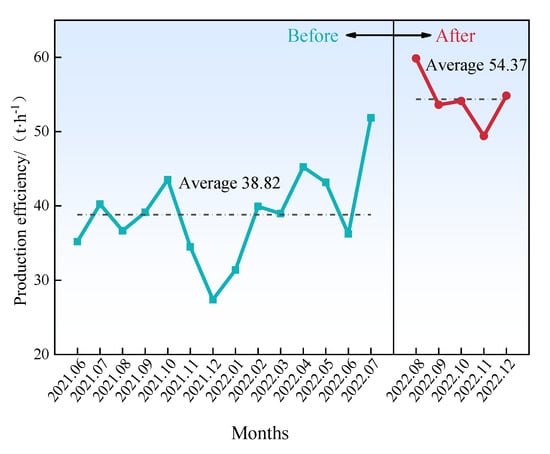
Figure 9.
The production efficiency of the SAG mill before and after the lifter bars were optimized.
As can be seen from Figure 9, the average production capacity of the SAG mill after the lifter bars were optimized can reach 54.37 t/h, which is 15.55 t/h higher than that before the lifter bars were optimized, with the production capacity being evaluated as 40.06%, almost half, because the other parameters did not change, demonstrating that the patterns of lifter bars have a remarkable effect on production capacity; that is to say, that rational patterns of lifter bars can tremendously promote production capacity.
3.3.3. Comparison of Service Life of Lifter Bars of the SAG Mill
From the previous Section 3.3.1 and Section 3.3.2, we know that, compared with the period before the liner lifting bars were optimized, the operation rate of the mill after the liner lifting bars were optimized increased by 16.36 percentage points and the production capacity of the mill was increased by 15.55 t/h. Under such production conditions, the service life of the mill liner lifting bars was compared. By comparing the service time of the lifter bars before and after the lifter bars were optimized, it can be judged whether this method is reasonable or not. The times of using one cycle of the lifter bars before and after the lifter bars were optimized were analyzed and compared. The results are shown in Table 9.
Table 9.
Statistics on the service life of liners in industrial experiments.
It can be seen from Table 9 that the service life of the optimized lifting bars is 159 d, which is 51 d longer than that under the former scheme, indicating that the optimization of the lifting bars can effectively extend the service life of the lifter bars, with an annual saving of 1.34 set and reducing the annual costs by CNY 0.7776 million. In addition, the extension of the service life of the lifting bars can enhance production capacity and reduce the labor intensity of the staff during the process of replacement. However, in fact, many factors affect the service life of the liner, such as the size of the ore, the hardness of the ore, the grinding concentration, the size of the grinding media, etc., although every variable is controlled as far as possible in the production process to ensure that the service life of the liner before and after the liner being optimized can be accurately compared, the factors inside the mill in the production process change all the time. Therefore, it may have a certain impact on the service life of the liner, but the impact is not obvious, so it can indicate that the optimized liner can increase the service life of itself.
3.3.4. Comparison of the Electricity Consumption of the SAG Mill
Electricity consumption of the mill is an important technical and economic index in the beneficiation plant, reflecting the comminution efficiency of the grinding media on ores inside the mill. Since the electricity consumed by the mill is a function of the power draw, the change in electricity can also reflect the change in the power draw. So, through analyzing the change in the electricity consumption during SAG mill operation, the comminution efficiency of the grinding media inside the mill before and after the lifter bars were optimized can be known in another form. The electricity consumption of the SAG mill before and after the lifter bars were optimized is shown in Figure 10.
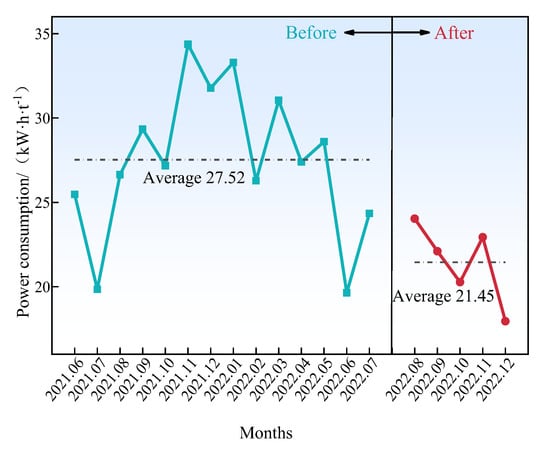
Figure 10.
The electricity consumption of the SAG mill before and after the lifter bars were optimized.
As can be seen from Figure 10, there is a sharp decreasing trend compared with electricity consumption before the lifter bars were optimized. In addition, a strange phenomenon is that the values of electricity consumption from 2021.11 to 2022.01 are especially high; maybe three months is winter in this area. The average electricity consumption of the SAG mill after the lifter bars were optimized is 21.45 kW·h/t, with a reduction of 6.07 kW·h/t and an annual average saving of CNY 987, 500 estimated in electricity consumption.
All in all, the optimized lifter bars can indeed improve the grinding index. Compared with the indexes before the lifter bars were optimized, the operation rate, production capacity, electricity consumption, and service life of lifting bars after being optimized are significantly improved, revealing that the method of operating lifter bars is suitable and reasonable to the beneficiation plant, which is consistent with the results of EDEM simulation tests.
4. Conclusions
EDEM simulation tests with different parameter combinations of the lifter bars depending on the orthogonal principle were conducted; what is more, range analysis and variance analysis were used to explore the significance of the parameters of the lifter bars on collision energy. Most important of all, the liner lifter bars optimized have been applied to industrial production and harvested a better effect. The overall results of the study are shown as follows:
(1) The range analysis results of the orthogonal test show that the optimal parameter combination is A1B1C2, that is, the angle, the group numbers, and the height of lifter bars are 20°, 12, and 210 mm, respectively, for which values of collision energy are greatest, illustrating the orthogonal tests used to determine the parameters of lifter bars are scientific and valid.
(2) The variance analysis results of the orthogonal test show that each factor has a significant impact on the collision energy, with the order of influence being the number of lifter bars > angle > height.
(3) The industrial test results show that optimized lifting bars can effectively extend the service life of the liner, and both the average operating rate and production capacity of the SAG mill increased. Moreover, the average power consumption decreased by 6.07 kW·h/t.
(4) In fact, the parameter combination of liner lifter bars above is not necessarily applicable to any beneficiation plant because there are certain differences in the attributes of each ore. However, this method is universal and can be used to explore the optimal parameter combination of lifter bars for any beneficiation plant.
(5) The grinding process is affected by many factors; however, the effect of grinding concentration, rotating rate, pulp pH, and other factors on the grinding process have not yet been considered in this study, so it is somewhat limited. In addition, the interaction of the three factors in the simulation was not contained, so there is a space for progress in this research.
(6) Although there are many variable factors in the production process and there are some problems in this study, it is still a good method to determine liner lifting strips of different sizes of mills relatively accurately under the premise of reducing the workload.
Author Contributions
G.W.: Data curation, Formal analysis, Software, Writing-original draft, Writing-review. Q.X.: Conceptualization, Methodology, Resources, Reviewing & editing. X.W.: Conceptualization, Methodology. Y.L.: Experiment research, Writing-review. S.J.: Data curation, Investigation, Methodology, Visualization, Writing—review & editing. M.W.: Methodology, Visualization, Writing-review. Y.S.: Data curation, Visualization, Writing-review & editing. Q.Z.: Conceptualization, Investigation, Writing—review & editing. Y.P.: Visualization. R.L.: Writing-review. All authors have read and agreed to the published version of the manuscript.
Funding
This research was funded by the National Natural Science Foundation of China grant number 52374269 and the Open Fund for the National Key Laboratory of Intelligent and Optimized Manufacturing of mining and Metallurgical Processes grant number BGRIMM-KZSKL-2023-02.
Data Availability Statement
The raw data supporting the conclusions of this article will be made available by the authors on request.
Acknowledgments
Thanks for all the members of Yunnan Provincial University selective grinding quality improvement and consumption reduction scientific and technological innovation team and relative leader and colleges of second processing plant of Heqing Beiya Mining Co., Ltd.
Conflicts of Interest
Yingjie Pei are employees of Anqian Mining Co., Ltd., Anshan Iron and Steel Group. The paper reflects the views of the scientists and not the company.
References
- Powell, M.S.; Weerasekara, N.; Cole, S.; LaRoche, R.; Favier, J. DEM modelling of liner evolution and its influence on grinding rate in ball mills. Miner. Eng. 2011, 24, 341–351. [Google Scholar] [CrossRef]
- Rezaeizadeh, M.; Fooladi, M.; Powell, M.; Mansouri, S.; Weerasekara, N. A new predictive model of lifter bar wear in mills. Miner. Eng. 2010, 23, 1174–1181. [Google Scholar] [CrossRef]
- Tomach, P. The Influence of the Grinding Media Diameter on Grinding Efficiency in a Vibratory Ball Mill. Material 2024, 17, 2924. [Google Scholar] [CrossRef] [PubMed]
- Jonsén, P.; Pålsson, B.I.; Tano, K.; Berggren, A. Prediction of mill structure behaviour in a tumbling mill. Miner. Eng. 2011, 24, 236–244. [Google Scholar] [CrossRef][Green Version]
- Wu, M.S.P.; Wang, V.Z.L. Modeling ball impact on the wet mill liners and its application in predicting mill magnetic liner performance. Miner. Eng. 2014, 61, 126–132. [Google Scholar] [CrossRef]
- Jiang, X. Research on Coarse-Grained Discrete Element Model and Optimization for Fine Particles. Coatings 2022, 12, 1483. [Google Scholar] [CrossRef]
- Xie, C.; Zhao, Y. Investigation of the ball wear in a planetary mill by DEM simulation. Powder Technol. 2022, 398, 117057. [Google Scholar] [CrossRef]
- Cleary, P.W. Effect of rock shape representation in DEM on flow and energy utilisation in a pilot SAG mill. Comput. Part. Mech. 2019, 6, 461–477. [Google Scholar] [CrossRef]
- Li, Y.; You, Y.; Gou, D.; Yu, A.; Yang, R. A DEM based scale-up model for tumbling ball mills. Powder Technol. 2022, 409, 117854. [Google Scholar] [CrossRef]
- Lin, C.; Yang, L.; Chen, F.; Chen, S.; Yin, H. A dissipative particle dynamics and discrete element method coupled model for particle interactions in sedimentation toward the fabrication of a functionally graded material. Colloids Surf. A Physicochem. Eng. Asp. 2020, 604, 125326. [Google Scholar] [CrossRef]
- Xie, Q.; Zhong, C.; Liu, D.; Fu, Q.; Wang, X.; Shen, Z. Operation Analysis of a SAG Mill under Different Conditions Based on DEM and Breakage Energy Method. Energies 2020, 13, 5247. [Google Scholar] [CrossRef]
- Xie, C.; Zhao, Y.; Song, T.; Zhao, Y. Investigation of the effect of filling level on the wear and vibration of a SAG mill by DEM. Particuology 2022, 63, 24–34. [Google Scholar] [CrossRef]
- Liu, Z.; Wang, G.; Guan, W.; Guo, J.; Sun, G.; Chen, Z. Research on performance of a laboratory-scale SAG mill based on DEM-EMBD. Powder Technol. 2022, 406, 117581. [Google Scholar] [CrossRef]
- Xu, L.; Luo, K.; Zhao, Y. Numerical prediction of wear in SAG mills based on DEM simulations. Powder Technol. 2018, 329, 353–363. [Google Scholar] [CrossRef]
- Xie, C.; Ma, H.; Song, T.; Zhao, Y. DEM investigation of SAG mill with spherical grinding media and non-spherical ore based on polyhedron-sphere contact model. Powder Technol. 2021, 386, 154–165. [Google Scholar] [CrossRef]
- Xu, L.; Luo, K.; Zhao, Y.; Fan, J.; Cen, K. Influence of particle shape on liner wear in tumbling mills: A DEM study. Powder Technol. 2019, 350, 26–35. [Google Scholar] [CrossRef]
- Liu, Y.; Li, Y.; Jiang, G. Orthogonal experiment on performance of mortar made with dune sand. Constr. Build. Mater. 2020, 264, 120254. [Google Scholar] [CrossRef]
- Su, Y.; Xu, Y.; Cui, T.; Gao, X.; Xia, G.; Li, Y.; Qiao, M.; Fan, H. A combined experimental and DEM approach to optimize the centrifugal maize breakage tester. Powder Technol. 2022, 397, 117008. [Google Scholar] [CrossRef]
- Wu, Y.; Xiao, Q.; Gao, Z. Hard Rock Accumulation Decrease and Grinding Effect Improvement in Semi Autogenous Grinding by Multi-Stage Ball Distribution. Chin. J. Rare Met. 2022, 46, 673–680. (In Chinese) [Google Scholar]
- Weerasekara, N.S.; Powell, M.S.; Cleary, P.W.; Tavares, L.; Evertsson, M.; Morrison, R.; Quist, J.; de Carvalho, R. The contribution of DEM to the science of comminution. Powder Technol. 2013, 248, 3–24. [Google Scholar] [CrossRef]
- Xu, Y.; Kafui, K.D.; Thornton, C.; Lian, G. Effects of Material Properties on Granular Flow in a Silo Using DEM Simulation. Part. Sci. Technol. 2002, 20, 109–124. [Google Scholar] [CrossRef]
- Dong, Y.; Fatahi, B.; Khabbaz, H.; Zhang, H. Influence of particle contact models on soil response of poorly graded sand during cavity expansion in discrete element simulation. J. Rock Mech. Geotech. Eng. 2018, 10, 1154–1170. [Google Scholar] [CrossRef]
- Govender, N.; Rajamani, R.; Wilke, D.N.; Wu, C.-Y.; Khinast, J.; Glasser, B.J. Effect of particle shape in grinding mills using a GPU based DEM code. Miner. Eng. 2018, 129, 71–84. [Google Scholar] [CrossRef]
- Cong, M.; Zhang, S.; Sun, D.; Zhou, K. Optimization of Preparation of Foamed Concrete Based on Orthogonal Experiment and Range Analysis. Front. Mater. 2021, 8, 778173. [Google Scholar] [CrossRef]
Disclaimer/Publisher’s Note: The statements, opinions and data contained in all publications are solely those of the individual author(s) and contributor(s) and not of MDPI and/or the editor(s). MDPI and/or the editor(s) disclaim responsibility for any injury to people or property resulting from any ideas, methods, instructions or products referred to in the content. |
© 2025 by the authors. Licensee MDPI, Basel, Switzerland. This article is an open access article distributed under the terms and conditions of the Creative Commons Attribution (CC BY) license (https://creativecommons.org/licenses/by/4.0/).