Abstract
Tectonic deformation can substantially change the pore characteristics and the resulting methane adsorption capacity of shales; thus, it strongly influences shale gas exploration and development in structurally complex areas of southern China. Two sets of shales with identical lithofacies that were derived from either structurally stable or deformed regions were collected at Fuling Field to evaluate the response of their pore properties and methane adsorption behavior to tectonic deformation through field emission scanning electron microscopy (FE-SEM), low-pressure gas (CO2/N2) adsorption, and high-pressure methane adsorption experiments. Three primary shale lithofacies were identified in each set of shales: organic-lean (OL) siliceous-rich argillaceous (CM-1) shale lithofacies, organic-moderate (OM) argillaceous/siliceous mixed (M-2) shale lithofacies, and organic-rich (OR) argillaceous-rich siliceous (S-3) shale lithofacies. In the stable region, organic matter (OM) pores dominated the pore types of OR S-3 shales, whereas the primary pore types of OL CM-1 shales were clay cleavage micro-fractures. OM M-2 shales exhibited a composite type of OM pores and clay cleavage micro-fractures. Compared with structurally stable shales, the original OM-hosted and clay-related pores in structurally deformed shales were extensively compacted or even closed due to tectonic compression during structural deformation. Despite pore collapse, two new types of tectonic micro-fractures were generated and found to be well developed in deformed shales through the rupture of brittle minerals in OR S-3 shales and the deformation of clay minerals in OL CM-1 shales. Simultaneously, organic matter–clay aggregates that formed during tectonic compression constituted a distinctive structure in deformed OM M-2 shales. As a result, the deformed shales displayed a decrease in their micropore and mesopore volumes, as well as a decrease in their pore surface areas, because of strong tectonic compression accompanied by an increase in the macropore volume due to the development of tectonic micro-fractures. Furthermore, the large pore surface areas in structurally stable shales could supply abundant adsorption sites and facilitate the enrichment of adsorbed gas. The expanded macropore volumes in structurally deformed shales could provide more storage spaces that are favorable for the accumulation of free gas.
1. Introduction
In recent years, shale gas has been commercially developed in North America and China, driven by advances in horizontal drilling and hydraulic fracturing technologies [1,2,3,4,5,6], which have sparked a global energy revolution. Shale gas is stored in reservoirs in three main states: (1) free gas in pore and fracture spaces; (2) adsorbed gas on the pore surface of organic matter and clay minerals; and (3) a minor fraction of dissolved gas in liquid hydrocarbons and formation water [7]. Consequently, nano- to micro-scale pores, along with fractures, serve as the storage spaces and migration pathways for the gas and are critical to the productivity of shale gas reservoirs [8,9,10]. Thus, determining the pore characteristics (including the pore type and pore structures, such as the pore volume and surface area) and understanding their controlling factors are important for assessing the potential of shale gas resources. Such characteristics have been extensively investigated [11,12,13,14,15,16]. Different from shale gas formations in North America, which generally developed with a relatively stable tectonic background, marine shale layers in south China have experienced multiple tectonic movements and intense tectonic deformation after hydrocarbon generation [17,18]. However, at present, many researchers are focusing on the variability in shale pore systems across different lithofacies [19,20,21,22,23,24,25,26,27], which are internal mixtures of organic matter and mineral compositions of shales. External tectonic deformation inevitably influences the development of pores in shales, but how tectonic deformation reshapes shale pore systems remains poorly studied. This has restricted our evaluation of shale reservoirs in structurally complex areas.
Adsorbed gas constitutes a significant portion of the total gas content in shale reservoirs, accounting for 20%–85% in the Antrim, Ohio, New Albany, Barnett, and Lewis shale formations [7] and exceeding 50% in the Devonian shales [28]. Therefore, studies on the methane adsorption capacity (MAC) of shales are essential for evaluating the shale gas resource potential [29,30,31,32,33,34,35,36,37,38,39]. Previous studies have extensively discussed the factors that influence the MAC of shales, including internal factors (such as the organic matter content, type and maturity, mineral composition, and pore structure) and external factors (such as the temperature, pressure, and moisture content) [29,30,31,32,33,34,35,36,37,38,39]. However, as the exploration of shale gas in south China gradually moves toward structurally complex areas, the modification of shale pore systems by tectonic deformation will subsequent impact the adsorption capacity of shales. However, this remains inadequately researched.
In this study, a suite of related experiments on the TOC content, XRD, FE-SEM, low-pressure CO2/N2 adsorption, and high-pressure methane adsorption were performed on two shale gas wells located in structurally stable and deformed regions, respectively, in Fuling Field, Sichuan Basin, China. The experiments aimed to (1) develop a lithofacies classification of shales and (2) conduct a differential comparison and analysis of the pore characteristics and MAC of shales subjected to different intensities of tectonic deformation. This study provides significant insights for the further evaluation of shale gas resources in structurally complex areas of southern China.
2. Geological Setting and Samples
Fuling Field is located in the eastern Sichuan Basin and comprises six secondary tectonic units: Jiangdong Slope, Jiaoshiba Anticline, Zilichang Anticline, Baitao Syncline, Pingpiao Anticline, and Baima Syncline (Figure 1a,b). During the Late Ordovician to Early Silurian, two large-scale transgressions occurred. The study area was in a low-energy and anoxic semi-closed restricted continental shelf environment, and deposited the Wufeng–Longmaxi Formation shales [40,41]. The shales were subdivided from the bottom to the top into three intervals, namely the Long 1 shales (first member of the Longmaxi Formation, including the Wufeng Formation), the Long 2 shales (second member of the Longmaxi Formation), and the Long 3 shales (third member of the Longmaxi Formation) according to the shale lithology, color, and biological fossil assemblages [42,43]. Among them, the gray-black radiolarian and graptolite shales of the Long 1 member formed the target interval for this study (Figure 2).
The two studied shale gas wells, JYA and JYB, were distributed in the core part of the Jiaoshiba block and Pingqiao block, respectively (Figure 1b). These two blocks exhibit different tectonic deformation characteristics. The Jiaoshiba block features a gently faulted anticline, for which tectonic deformation is weak and the strata tend to be flat (Figure 1d). The fault density in this region is typically less than 0.02/km2, and the fault scale is small, with the largest fault distance being less than 50 m [44,45]. Conversely, the Pingqiao block is a narrowly faulted anticline with strong tectonic deformation and accompanied by pronounced bending strata (Figure 1c). The fault density in this region is dramatically improved and the largest fault distance can reach 600 m [46]. Thus, the Jiaoshiba block is structurally more stable than the Pingqiao block. The Jiaoshiba block belongs to the structurally stable region, whereas the Pingqiao block represents a structurally deformed region.
Twelve marine shale samples, including six undeformed samples from well JYA in the Jiaoshiba block (stable region), and six deformed samples from well JYB in the Pingqiao block (deformed region), were collected based on the variation characteristics of the gamma and density logging curves. These selected shale samples also capture the variability in the TOC content, mineral composition, and lithofacies vertically (Figure 2). By laterally comparing shales with identical lithofacies from different structural blocks, the impact of tectonic deformations on shale pore development and the MAC was systematically evaluated.

Figure 1.
(a) Regional position of Fuling Field; (b) tectonic units and well locations in Fuling Field (modified from Xu et al., 2020 [47]); (c) narrowly faulted Pingqiao anticline; and (d) gently faulted Jiaoshiba anticline.

Figure 2.
Simplified stratigraphic columns of wells JYA (a) and JYB (b) in Fuling Field. Arrows represent shale samples in these two wells with corresponding burial depth, and red, blue, and green arrows represent OL CM-1, OM M-2, and OR S-3 shales, respectively.
3. Experimental Methods
3.1. TOC Content
The TOC content was measured for powdered samples of less than 200 mesh by a CS844 carbon/sulfur analyzer (Leco Corporation, USA). Prior to the TOC content determination, the powdered samples were treated with dilute hydrochloric acid (HCl) and heated at 80 °C for 2 h to thoroughly remove inorganic carbon from the samples. The TOC values were quantified based on the amounts of CO2 released during the combustion of the samples, and were calibrated using standard samples.
3.2. X-Ray Diffraction (XRD)
The mineral composition of the studied shale samples was determined with an X-ray diffraction analysis using a D/max-2600 X-ray diffractometer (Rigaku Corporation, Japan) with Cu Kα radiation, operating at a working voltage of 40 kV and a current of 30 mA. The powdered samples were tiled on a glass slide and then scanned from 3 to 85° (2θ) using a stepwise scanning rate of 4°/min to acquire the XRD spectra. The relative percentages of the minerals were determined semi-quantitatively by calculating the area under the curve for the major peaks of each mineral.
3.3. Field Emission Scanning Electron Microscopy (FE-SEM)
To interpret the microscopic pore attributes of the studied shale samples, such as the type, morphology, size, and number of the pores, argon ion milling and FE-SEM observations were used [48,49,50]. Before the imaging, all the samples were first mechanically ground and subsequently polished with an argon ion-beam system using a LEICA EM RES102 (Leica Corporation, Germany) to achieve an ultra-smooth surface. After that, a secondary electron detector was utilized to image the ion-milled surface of the samples via a Zeiss Merlin Compact FE-SEM instrument (Carl Zeiss AG, Germany).
3.4. Low-Pressure Gas Adsorption
By integrating low-pressure CO2 and N2 adsorption experiments at a Quantachrome Autosorb-iQ3 fully automatic specific surface area and porosity analyzer (Quantachrome Instruments, USA), the volume and surface area distribution of shale pores with an aperture ranging from 0.3 nm to 300 nm were quantitatively characterized. Firstly, powdered samples (60–80 mesh) were degassed at 110 °C for 12 h in a vacuum tube wrapped with a heating mantle to eliminate volatile components and free water. A CO2 adsorption experiment across a relative pressure (P/P0) range of 4 × 10⁻⁴–3 × 10⁻² at a temperature of 273.15 K was employed to characterize micropore parameters (0.3–1.5 nm). The data from CO2 adsorption were interpreted via the density functional theory (DFT) method. N2 adsorption–desorption isotherms were obtained at a temperature of 77.35 K over a relative pressure (P/P0) range between 0.005 and 1. The mesopore and macropore (1.5–300 nm) parameters were determined from N2 adsorption data by applying the Barrett–Joyner–Halenda (BJH) method.
3.5. High-Pressure Methane Adsorption
3.5.1. Excess Methane Adsorption
High-pressure methane isothermal adsorption experiments were performed through a gravimetric isothermal adsorption analyzer (ISOSORP-HP II Static (Rubotherm GmbH, Germany)). Prior to the experiments, the powdered samples (60–80 mesh) were first vacuum-dried at 110 °C for 12 h to remove moisture and impurity gases. The methane adsorption isotherms were conducted using an ultra-high purity (99.99%) methane in a pressure range of 0–24 MPa. The temperature of the sample cell was set at a constant of 30 ± 0.1 °C.
3.5.2. Calculation of Absolute Methane Adsorption
Isothermal adsorption parameters are commonly compiled via the Langmuir monolayer adsorption model, which is used to describe the amount of adsorbed gas on a solid surface at a given pressure and temperature [51]:
where Vabs (cm3/g) refers to the absolute adsorption capacity of methane; VL (cm3/g) refers to the Langmuir volume and corresponds to the maximum MAC; PL (MPa) refers to the Langmuir pressure, which denotes the pressure at half of the Langmuir volume; and P (MPa) refers to the equilibrium pressure.
In fact, the Langmuir adsorption model is a limiting model that is applicable only to the absolute adsorption capacity. The measured adsorption capacity from the isothermal adsorption experiment is the excess adsorption capacity rather than the absolute adsorption capacity. Therefore, to approximate the measured data of the isotherms, some scholars have proposed a modified Langmuir model to express the relationship between the excess adsorption capacity and the absolute adsorption capacity [52,53,54,55,56,57], as follows:
where Vexc (cm3/g) refers to the excess adsorption capacity of methane and ρgas (g/cm3) and ρads (g/cm3) refer to the density of the free-phase methane and the adsorbed-phase methane, respectively. The free gas density was obtained from the high-accuracy equation of state (EOS). The calculated density values using this EOS are available on the United States National Institute of Standards and Technology (NIST) website. This work assumed that the adsorbed phase density was equal to the liquid density at the boiling temperature and ambient pressure (0.423 g/m3 was used for methane) [38,52].
Substituting Equation (1) into Equation (2) yields the following:
The important parameters VL and PL can be obtained by fitting Equation (3) to the experimental excess adsorption data using a least squares minimization procedure.
4. Results
4.1. Shale Lithofacies
The TOC content and mineral compositions of the studied shale samples are tabulated in Table 1. The TOC values ranged from 0.50% to 3.85% with an average of 1.80% for the well JYA shales, and from 1.32% to 3.34% with an average of 2.10% for the well JYB shales. Overall, both wells showed an increasing trend in the TOC content with burial depth (Table 1). The mineral compositions of the shales from wells JYA and JYB were dominated by quartz and clay minerals, with subordinate contents of feldspar (k-feldspar and plagioclase), calcite, dolomite, and pyrite (Table 1). The quartz content was in the range of 31.0%–50.1% (average: 39.7%) and 27.4%–55.3% (average: 39.5%), whereas the clay content varied from 25.3% to 58.0% (average: 40.0%) and 26.7% to 58.8% (average: 41.9%) for the shales from wells JYA and JYB, respectively. Additionally, the quartz content in these two wells gradually increased with depth, while the clay content gradually decreased correspondingly (Table 1).

Table 1.
Basic geological parameters of the studied shales.
Furthermore, the shale lithofacies were recognized and characterized on the basis of their TOC content and mineral compositions [58,59]. The three identified lithofacies and their key characteristics can be summarized as follows.
Organic-lean (OL) and siliceous-rich argillaceous (CM-1) shale lithofacies: This lithofacies occurs in the upper section of the Long 1 member (Figure 2) and contains 50%–75% clay minerals, 25%–50% siliceous minerals, and less than 25% carbonate minerals (Figure 3a). The organic matter in this lithofacies is usually sparse, with an average TOC content of 0.61% and 1.39% for wells JYA and JYB, respectively (Figure 3b). A relatively high-energy and shallow-water environment is interpreted for this lithofacies.
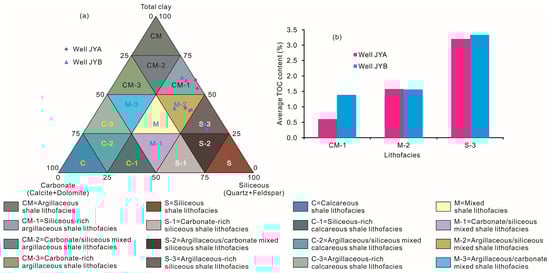
Figure 3.
(a) Ternary diagram of mineralogy, indicating that shales are dominated by siliceous-rich argillaceous shale lithofacies (CM-1), argillaceous/siliceous mixed shale lithofacies (M-2), and argillaceous-rich siliceous shale lithofacies (S-3); (b) distribution of TOC content in three lithofacies.
Organic-moderate (OM) and argillaceous/siliceous mixed (M-2) shale lithofacies: Shales are defined by this lithofacies when the clay and siliceous contents are both between 25% and 50% and the carbonate content is below 25% (Figure 3a). This lithofacies was observed in the middle part of the Long 1 member (Figure 2) and accompanied by moderate organic matter content, displaying average TOC values of 1.59% and 1.57% in wells JYA and JYB, respectively (Figure 3b).
Organic-rich (OR) and argillaceous-rich siliceous (S-3) shale lithofacies: The major components of this lithofacies are siliceous minerals, with a content between 50% and 75% (Figure 3a). The clay content is relatively low, ranging from 25% to 50%, while the carbonate content is less than 25% (Figure 3a). This lithofacies is enriched in organic matter, with average TOC contents of 3.21% and 3.34% in wells JYA and JYB, respectively (Figure 3b). This lithofacies is deposited in a low-energy and deep-water environment and developed at the bottom of the Long 1 member (Figure 2).
4.2. Pore Characteristics
4.2.1. Pore Types
The pore types of the studied shales were determined using FE-SEM. According to the FE-SEM observations, four distinct pore categories were identified in the shales: organic matter (OM) pores, interparticle (InterP) pores, intraparticle (IntraP) pores, and micro-fractures.
OM pores form due to hydrocarbon generation and expulsion during the thermal maturation of kerogen; they are a primary pore type in shales [1,31,48]. In this study, we found that the OM pores were well developed in OR S-3 shales (Figure 4m–q), moderately developed in OM M-2 shales (Figure 4g–l), and poorly developed in OL CM-1 shales (Figure 4a–f). In undeformed OR S-3 and OM M-2 shales, the OM pores were well preserved with bubble-like to spherical shapes (Figure 4m–o,g–i). In contrast, within the deformed counterparts, the OM pores exhibit the results of intense deformation under the action of tectonic stress, showing a preferred orientation and arrangement with elliptical, slit, and moon shapes (Figure 4p,q,j–l). In general, compared with the shales in the stable region, the OM pores in the shales of the deformed region have a smaller pore size and a worse roundness. Furthermore, under intense tectonic compression, clay flakes are bent or even separated into fragments, dispersing in the organic matter particles and forming organic matter–clay aggregates [60]. OM–clay aggregates are a distinctive feature of deformed OM M-2 shales (Figure 4j–l).
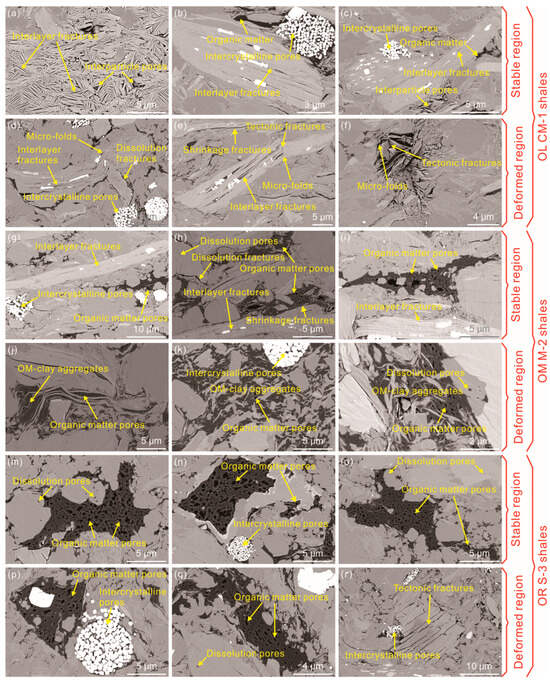
Figure 4.
FE-SEM images of the studied shales. (a–c) OL CM-1 shales from the stable region; (d–f) OL CM-1 shales from the deformed region; (g–i) OM M-2 shales from the stable region; (j–l) OM M-2 shales from the deformed region; (m–o) OR S-3 shales from the stable region; and (p–r) OR S-3 shales from the deformed region.
InterP pores exist between two or more particles and are highly susceptible to destruction under the influence of mechanical compaction and tectonic compression during long-term geological movements [61]. InterP pores mainly developed as triangular and polygonal shapes between clay minerals in the undeformed OL CM-1 shales examined here (Figure 4a,c).
IntraP pores are primarily identified as dissolution pores and intercrystalline pores inside carbonate minerals and pyrite framboids, respectively. Throughout thermal evolution, the produced organic acidic fluids dissolve unstable minerals, such as calcite and dolomite, to form secondary dissolution pores (also including some ring-like, grainmarginal dissolution micro-fractures along unstable mineral peripheries) [62]. In this study, dissolution pores were most abundant in the OR S-3 shales (Figure 4m,o,q), followed by the OM M-2 shales (Figure 4h,l), and they rarely developed in the OL CM-1 shales (Figure 4d). The intercrystalline pores present within the pyrite framboids were visible across all the lithofacies shales (Figure 4), some of which were infilled by organic matter to form OM pores.
Micro-fractures are continuous linear openings with a size ranging from nanometers to micrometers that connect pores and macro-fractures; they play a critical role in shale gas migration [63,64]. Massive interlayer micro-fractures developed in the OL CM-1 shales (Figure 4a–e) and undeformed OM M-2 shales (Figure 4g–i); they formed along the cleavage sheets of oriented clay flakes because of dewatering shrinkage and mineral phase transitions during diagenesis [65,66]. These micro-fractures were parallel to each other and extended for up to several micrometers. Simultaneously, in the deformed OL CM-1 shales, clay minerals were distorted by tectonic compression to form micro-folds, and the tensile stress at the hinge zone of these micro-folds promoted the development of tectonic micro-fractures (Figure 4e,f). In addition, brittle minerals such as quartz, feldspar, and carbonates have a high Young’s modulus and a low Poisson’s ratio [67,68], making them more prone to rupture under external stress to form IntraP tectonic micro-fractures, which were widely distributed in the deformed OR S-3 shales (Figure 4r).
4.2.2. Isotherms of CO2 Adsorption
Low-pressure CO2 adsorption isotherms of the shales from the stable and deformed regions are presented in Figure 5a and b. With an increase in the relative pressure, the CO2 adsorption isotherms of the shales in both the stable and deformed regions showed a similar rapid increasing trend, belonging to type І according to the IUPAC classification [69]. This suggests the presence of substantial micropores in the shales. At a relative pressure of approximately 0.03, the average maximum CO2 adsorption volumes of the OL CM-1, OM M-2, and OR S-3 shales in the stable region were 1.4668 cm3/g, 1.7340 cm3/g, and 2.1398 cm3/g, respectively, while those of the deformed region were 1.4002 cm3/g, 1.4764 cm3/g, and 1.9246 cm3/g, respectively. This demonstrates that the shales from the stable region possessed higher micropore volumes.
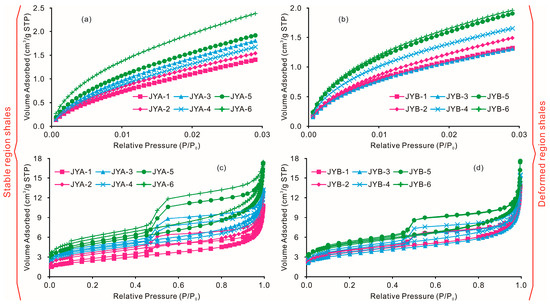
Figure 5.
CO2 and N2 isotherms of the studied shales. (a) CO2 isotherms for the stable-region shales; (b) CO2 isotherms for the deformed-region shales; (c) N2 isotherms for the stable-region shales; and (d) N2 isotherms for the deformed-region shales.
4.2.3. Isotherms of N2 Adsorption and Desorption
The low-pressure N2 adsorption–desorption isotherms of the shales from the stable and deformed regions are shown in Figure 5c and d. The inversed S-shaped N2 adsorption isotherms conformed to type II according to the BET classification [70]. At a low relative pressure (<0.1), the adsorption volumes did not increase significantly, and the adsorption curves displayed a slightly convex shape, reflecting the transition stage of adsorption from a mono-molecular layer to a multi-molecular layer. At an intermediate relative pressure (0.1 ~ 0.8), the adsorption volumes increased slowly with increasing pressure, which is indicative of a multi-layer adsorption process. When the relative pressure was above 0.8, the adsorption volumes increased rapidly, and there was no adsorption saturation phenomenon, suggesting the presence of some large pores or fractures in the shale samples. In addition, all of the studied samples displayed hysteresis loops between the adsorption and desorption branches due to capillary condensation when the relative pressure was above 0.45. Based on the classification proposed by IUPAC [71], the hysteresis loops of the shales from the stable region were similar to type H2 (Figure 5c), implying the dominance of inkbottle-shaped pores. The hysteresis loops of the shales from the deformed region resembled type H3, indicating the presence of slit-shaped pores. The average adsorption volumes of N2 at the maximum relative pressure (close to 1.0) for the OL CM-1, OM M-2, and OR S-3 shales were 11.7230 cm3/g, 13.1824 cm3/g, and 17.3281 cm3/g in the stable region and 13.6451 cm3/g, 15.0623 cm3/g, and 16.0032 cm3/g in the deformed region. These results indicate that the deformed OL CM-1 and OM M-2 shales, along with the undeformed OR S-3 shales, have higher meso- and macropore volumes compared to their lithofacies equivalents in contrasting structural positions.
4.3. Methane Adsorption Isotherms
The excess and absolute methane adsorption isotherms of the shales from the stable and deformed regions are plotted in Figure 6. As displayed in Figure 6a,b, it is obvious that the excess MAC first increased monotonically with increasing pressure, and then reached its maximum value at a pressure of 8–10 MPa; after that, it began to slowly decrease. The experimentally measured excess methane adsorption isotherms were well fitted by the modified Langmuir model, with a fitting degree (R2) above 0.99 (Table 2). The derived Langmuir parameters, i.e., the Langmuir volume (VL) and Langmuir pressure (PL), are listed in Table 2. The average Langmuir volumes were 1.91 cm3/g, 3.24 cm3/g, and 4.85 cm3/g for the stable region’s OL CM-1, OM M-2, and OR S-3 shales and 3.01 cm3/g, 3.65 cm3/g, and 4.19 cm3/g for their counterparts from the deformed region, respectively. Vertically, the MAC of shales with different lithofacies but an identical structural position followed the order of OR S-3 shales > OM M-2 shales > OL CM-1 shales. However, there seemed to be no consistency in the comparison of the MAC for shales across different structural positions with same lithofacies laterally. In addition, unlike the excess adsorption isotherms, the absolute adsorption isotherms exhibited a monotonic increasing trend with the pressure, and gradually approached a plateau when the pressure exceeded 10 MPa (Figure 6c,d).
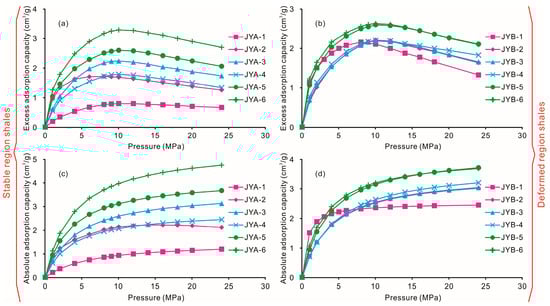
Figure 6.
Methane excess and absolute adsorption isotherms for the studied shales. (a) Excess adsorption isotherms for the stable-region shales; (b) excess adsorption isotherms for the deformed-region shales; (c) absolute adsorption isotherms for the stable-region shales; and (d) absolute adsorption isotherms for the deformed-region shales.
Table 2.
Fitting the Langmuir parameters of methane adsorption for the studied shales.
5. Discussion
5.1. Effects of Tectonic Deformation on Pore Characteristics of Shales
5.1.1. Pore Volume and Surface Area Characteristics
Significant differences exist in the pore structure of shales across the same lithofacies, but different levels of tectonic deformation. The results regarding the pore volume and surface area of pores with various sizes are listed in Table 3 and Table 4, and illustrated in Figure 7 and Figure 8.
Table 3.
Pore volumes of the studied shales.
Table 4.
Pore surface areas of the studied shales.

Figure 7.
Pore volume distributions of the studied shales. (a) Absolute pore volume distributions of the OL CM-1 shales; (b) relative pore volume distributions of the OL CM-1 shales; (c) absolute pore volume distributions of the OM M-2 shales; (d) relative pore volume distributions of the OM M-2 shales; (e) absolute pore volume distributions of the OR S-3 shales; and (f) relative pore volume distributions of the OR S-3 shales.

Figure 8.
Pore surface area distributions of the studied shales. (a) Absolute pore surface area distributions of the OL CM-1 shales; (b) relative pore surface area distributions of the OL CM-1 shales; (c) absolute pore surface area distributions of the OM M-2 shales; (d) relative pore surface area distributions of the OM M-2 shales; (e) absolute pore surface area distributions of the OR S-3 shales; and (f) relative pore surface area distributions of the OR S-3 shales.
The mean values of the micropore, mesopore, and macropore volumes in the stable OL CM-1 shales were 0.00620 cm3/g, 0.00857 cm3/g, and 0.00739 cm3/g, accounting for 27.97%, 38.68%, and 33.35%, respectively (Table 3). The mean values of the micropore, mesopore, and macropore volumes in the stable OM M-2 shales were 0.00760 cm3/g, 0.01036 cm3/g, and 0.00636 cm3/g, accounting for 31.25%, 42.61%, and 26.14%, respectively (Table 3). The mean values of the micropore, mesopore, and macropore volumes in the stable OR S-3 shales were 0.00969 cm3/g, 0.01381 cm3/g, and 0.00840 cm3/g, accounting for 30.36%, 43.28%, and 26.36%, respectively (Table 3). The mean values of the micropore, mesopore, and macropore volumes were 0.00588 cm3/g, 0.00897 cm3/g, and 0.00870 cm3/g in deformed OL CM-1 shales, accounting for 24.96%, 38.12%, and 36.92%, respectively (Table 3); 0.00615 cm3/g, 0.00954 cm3/g, and 0.01038 cm3/g in deformed OM M-2 shales, accounting for 23.57%, 36.59%, and 39.83%, respectively (Table 3); and 0.00792 cm3/g, 0.01094 cm3/g, and 0.00916 cm3/g in deformed OR S-3 shales, accounting for 28.46%, 39.36%, and 32.18%, respectively (Table 3). As shown in Figure 7, regardless of whether the lithofacies shales were from the structurally stable or deformed region, mesopores made the greatest contribution to the pore volumes. However, compared to their stable-region counterparts of the same lithofacies, the shales from the deformed region exhibited a consistent decrease in their micropore and mesopore volume and an increase in their macropore volume (Figure 7).
In the stable OL CM-1, OM M-2, and OR S-3 shales, the average values for the micropore surface areas were 17.912 m2/g, 21.749 m2/g, and 27.831 m2/g, accounting for 74.95%, 75.48%, and 74.73%, respectively (Table 4). The average values for the mesopore surface areas were 5.758 m2/g, 6.838 m2/g, and 9.097 m2/g, accounting for 24.02%, 23.74%, and 24.48%, respectively (Table 4). The average values for the macropore surface areas were 0.244 m2/g, 0.226 m2/g, and 0.293 m2/g, accounting for 1.03%, 0.78%, and 0.79%, respectively (Table 4). The average values for the micropore surface areas in the deformed OL CM-1, OM M-2, and OR S-3 shales were 17.695 m2/g, 18.598 m2/g, and 24.210 m2/g, accounting for 74.66%, 74.37%, and 75.99%, respectively (Table 4); the average values for the mesopore surface areas in the deformed OL CM-1, OM M-2, and OR S-3 shales were 5.711 m2/g, 6.064 m2/g, and 7.367 m2/g, accounting for 24.18%, 24.37%, and 23.12%, respectively (Table 4). The average values for the macropore surface areas in the deformed OL CM-1, OM M-2, and OR S-3 shales were 0.275 m2/g, 0.312 m2/g, and 0.281 m2/g, accounting for 1.17%, 1.26%, and 0.88%, respectively (Table 4). As displayed in Figure 8, whether in the structurally stable or deformed regions, micropores were the main contributors to the pore surface areas across all lithofacies shales, followed by mesopores, while macropores made a negligible contribution. Furthermore, compared to their stable-region counterparts of the same lithofacies, the shales from the deformed region exhibited reduced surface areas for micropores, mesopores, and total pores (Figure 8).
The above results demonstrate that there are indeed substantial differences in the pore structure between deformed and undeformed shales across the same lithofacies, demonstrating that tectonic deformation has a considerable influence on the pore properties of shales. Owing to tectonic compression, a substantial number of pores in the deformed shales were markedly compressed compared with those in the undeformed shales. This was especially true for plastic organic matter and clay minerals, as OM-hosted and clay-related original pores cannot be protected from tectonic compressive stress, resulting in the deformation, collapse, and/or ever closure of the pores (Figure 4). First, the macropore volume is lost in response to tectonic compression, and as the structural stress increases, the mesopore and micropore volumes are also lost (Figure 7) [61]. Simultaneously, the formation of clay- and brittle- mineral-related tectonically induced micro-fractures can increase the macropore volume (Figure 7). Moreover, this increase in the macropore volume due to the development of tectonic micro-fractures exceeds the decrease in the macropore volume due to tectonic compression; this is the main reason why deformed shales had a greater macropore volume compared to their undeformed counterparts. Additionally, since micro- and mesopores are the primary contributors to the pore surface area (Figure 8), the disappearance of some micro- and mesopores due to strong tectonic compression accounts for the reduction in the pore surface area observed in deformed shales (Figure 8).
In conclusion, the pore structure of shales can be greatly affected by tectonic deformation. This is accompanied by reduced micro- and mesopore volumes, decreased pore surface areas due to the tectonic compression, and increased macropore volumes because of the development of tectonic micro-fractures. These novel findings seem to suggest that undeformed shales are more beneficial for adsorbed gas storage, while deformed shales are more favorable for free gas accumulation.
5.1.2. Conceptual Model for Development of Pores in Shales
Based on a qualitative analysis of the pore type and a quantitative characterization of the pore structure, a model was developed for the formation of pores in different types of shales under the joint control of lithofacies and tectonic deformation. This model is presented in Figure 9. The OL CM-1 shales were rich in clay minerals and lacked organic matter. The pores in the OL CM-1 shales from the stable region were dominated by interlayer cleavage micro-fractures within clay particles generated during clay diagenesis (Figure 9a). In the deformed OL CM-1 shales, numerous distinctive tensile tectonic micro-fractures developed at the hinge zone of clay micro-folds (Figure 9b). The development of OM pores was limited in both the undeformed and deformed OL CM-1 shales (Figure 9a,b). The OR S-3 shales exhibited a high content of organic matter and a low content of clay minerals. OM pores were abundant and dominant in the OR S-3 shales, with dissolution pores contributing as another significant pore type (Figure 9e,f). However, different from the bubble-like or sponge-like OM pores that developed in the undeformed OR S-3 shales, OM pores in the deformed regions displayed elliptical-shaped or slit-shaped morphologies under the influence of intense tectonic compression (Figure 9e,f), and the pores were damaged with a reduced roundness. Meanwhile, brittle minerals within the deformed OR S-3 shales cracked under the action of external stress, forming extensive tectonic micro-fractures (Figure 9f). The OM M-2 shales were characterized by moderate clay mineral and organic matter content. The coexistence of OM pores and clay cleavage micro-fractures is a typical feature of pore development in undeformed OM M-2 shales (Figure 9c). In the deformed counterparts, the primary pore type constituted unique pore systems developed within organic matter–clay aggregates under the influence of tectonic compression (Figure 9d). In summary, it is worth noting that the main distinctions in the pore types between the deformed and undeformed shales lie in the variations in the morphology and size of the same types of pores, as well as diverse newly formed special pores related to tectonic deformation.
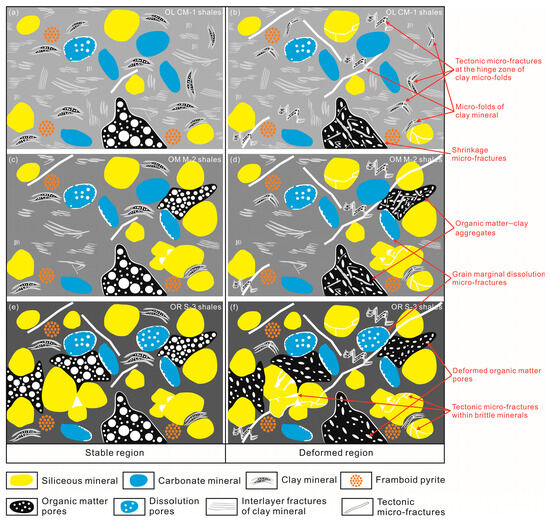
Figure 9.
Developmental model of pores in shales under the joint control of tectonic deformation and lithofacies. (a) OL CM-1 shales from the stable region; (b) OL CM-1 shales from the deformed region; (c) OM M-2 shales from the stable region; (d) OM M-2 shales from the deformed region; (e) OR S-3 shales from the stable region; and (f) OR S-3 shales from the deformed region.
The differences in the pore types induced by tectonic deformation further influenced the pore structure parameters and caused divergent pore volumes and surface areas across shales of the same lithofacies from distinct structural positions. With an increasing tectonic deformation strength, the plastic organic matter and clay minerals in the deformed shales could not protect the original OM pores and clay cleavage micro-fractures from tectonic compressive stress, resulting in the destruction, collapse, and even closure of a portion of the pores. This was accompanied by a decrease in both the micro- and mesopore volumes, as well as a decrease in the pore surface areas (Figure 7 and Figure 8). Nevertheless, the newly formed clay- and brittle-mineral-related tectonic micro-fractures induced by structural deformation increased the volume of macropores in the deformed shales (Figure 7).
5.2. Effects of Tectonic Deformation on MAC of Shales
5.2.1. Effects of Internal Rock Composition
Organic matter has been widely reported as a dominant factor influencing the MAC of shales [29,30,31,32,33,34,35,36,37,38]. In our shale samples, methane adsorption parameters (both the Langmuir VL and the Maximum Vexc) were positively correlated with the TOC content (Figure 10), indicating that organic matter contributes greatly to the MAC of shales in both structurally stable and deformed regions.

Figure 10.
Effect of organic matter on MAC.
Additionally, the micro- and mesopore volumes and surface areas showed positive correlations with the TOC content, whereas the macropore structure parameters displayed no obvious relationships with the TOC content (Figure 11). This is in accordance with the results of previous studies on Wufeng–Longmaxi shales, which argued that the thermal maturation of organic matter can result in the generation of a large number of organic micro–mesopores [22,24,47,59,72]. Micro- and mesopores significantly enhance the MAC of shales due to their larger surface area and greater adsorption energy than macropores [3,31,32]. Specifically, the considerably larger surface areas of micro- and mesopores (Figure 8) provide more adsorption sites for the methane molecules. Moreover, the adsorption of gas molecules in porous shale reservoirs is controlled by van der Waals forces, which are influenced by the distance between gas molecules and the pore walls: a shorter distance corresponds to stronger van der Waals forces and a greater adsorption energy [73]. Therefore, smaller pores with an increased adsorption energy exhibit a higher adsorption potential and preferentially adsorb more gas compared with larger pores. In this study, the Langmuir VL and maximum Vexc were positively correlated with the micro- and mesopore volumes and surface areas in shales from both the stable and deformed regions, but they were not correlated with the macropore properties (Figure 12). This supports the interpretation that methane adsorption in shales is mainly contributed by micro- and mesopores.
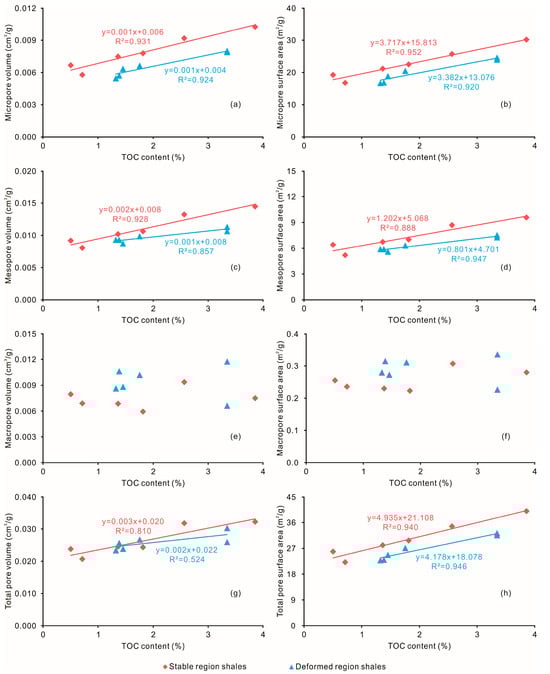
Figure 11.
Relationships between TOC content and pore structure parameters. (a) TOC content vs. micropore volume; (b) TOC content vs. micropore surface area; (c) TOC content vs. mesopore volume; (d) TOC content vs. mesopore surface area; (e) TOC content vs. macropore volume; (f) TOC content vs. macropore surface area; (g) TOC content vs. total pore volume; and (h) TOC content vs. total pore surface area.

Figure 12.
Effects of pore structure on MAC. (a) Micropore volume vs. MAC; (b) micropore surface area vs. MAC; (c) mesopore volume vs. MAC; (d) mesopore surface area vs. MAC; (e) macropore volume vs. MAC; and (f) macropore surface area vs. MAC.
In summary, organic micro–mesopores serve as the main adsorption sites and possess a high adsorption energy, thus promoting the MAC of shales.
5.2.2. Effects of External Tectonic Deformation
Notably, the correlation coefficients between the TOC content, pore structure parameters, and the MAC were higher in the shales from the stable region than in those from the deformed region (Figure 10 and Figure 12). It appears that the MAC of the stable region’s shales was mainly controlled by the TOC content, whereas for the deformed region’s shales, the TOC content is not the sole dominant controlling factor. Tectonic deformation could modify the pore networks, thereby further influencing the methane adsorption behavior of shales [74].
To isolate the effect of external tectonic deformation on the MAC of shales from that of the intrinsic TOC content, the methane adsorption values were normalized to the TOC content. This is exhibited in Table 5. The averaged TOC-normalized Langmuir VL and maximum Vexc of the OL CM-1 shales in the stable region were 338.23 cm3/g TOC and 226.63 cm3/g TOC, respectively (Table 5), compared to 215.77 cm3/g TOC and 157.30 cm3/g TOC for the shales from the deformed region, respectively (Table 5). Similarly, the OR S-3 shales showed an averaged TOC-normalized Langmuir VL and maximum Vexc of 153.33 cm3/g TOC and 93.18 cm3/g TOC in the stable region, respectively (Table 5), and 125.30 cm3/g TOC and 77.99 cm3/g TOC in the deformed region, respectively (Table 5). In contrast, the averaged TOC-normalized Langmuir VL and maximum Vexc were 204.41 cm3/g TOC and 127.04 cm3/g TOC for undeformed OM M-2 shales and 235.25 cm3/g TOC and 141.56 cm3/g TOC for deformed OM M-2 shales, respectively (Table 5). Apparently, for the OL CM-1 and OR S-3 shales, the undeformed samples displayed higher TOC-normalized adsorption capacities than their deformed counterparts (Figure 13). Conversely, for the OM M-2 shales, the samples from the deformed region exhibited greater methane adsorption than those from the stable region (Figure 13). Intensive tectonic deformation leads to the collapse and closure of a large number of organic matter- and clay-associated micro–mesopores, further resulting in a decrease in the pore surface areas and the disappearance of some adsorption sites (Figure 8). This is unfavorable for the methane adsorption of deformed OL CM-1 and OR S-3 shales. Meanwhile, tectonic compression adequately mixes organic matter and clay particles in deformed OM M-2 shales, forming efficient nanoscale pore networks in OM–clay aggregates and seemingly improving the MAC of the shales. However, further in-depth studies are required to address the underlying mechanisms.
Table 5.
TOC-normalized adsorption capacity of the studied shales.

Figure 13.
Comparisons of MAC between shales from the stable and deformed regions. (a) TOC-normalized maximum Vexc of the OL CM-1 shales; (b) TOC-normalized Langmuir VL of the OL CM-1 shales; (c) TOC-normalized maximum Vexc of the OM M-2 shales; (d) TOC-normalized Langmuir VL of the OM M-2 shales; (e) TOC-normalized maximum Vexc of the OR S-3 shales; and (f) TOC-normalized Langmuir VL of the OR S-3 shales. The dotted lines represent the dividing line between the stable and deformed regions.
6. Conclusions
Shales from both deformed and undeformed regions in Fuling Field were characterized to elucidate the influences of tectonic deformation on the pore properties and MAC. OM pores and clay cleavage micro-fractures represent the dominant pore types and mainly develop in OR S-3 and OL CM-1 shales, respectively. Compared with undeformed shales, the original OM-hosted and clay-related pores in deformed shales were compacted to the point of shrink or collapse. However, newly formed micro-fractures, including two types of tectonic micro-fractures formed by the rupture of brittle minerals and the deformation of clay minerals, were abundant in the deformed OR S-3 and OL CM-1 shales, respectively. In terms of the pore structure, the structurally deformed shales contained reduced micro- and mesopore volumes and decreased pore surface areas associated with tectonic compression, as well as increased macropore volumes associated with tectonic micro-fractures. The great pore surface areas in undeformed shales provide more adsorption sites and promote the enrichment of adsorbed gas. The large macropore volumes in deformed shales offer a greater number of storage spaces, which are beneficial for the accumulation of free gas. Our findings have practical significance for the exploration and production of shale gas in complex structural areas of southern China. Due to the small number of samples, the current study has certain limitations. Future research should expand the coverage of the sample sets across a wider range of tectonic settings to validate our findings and quantitatively constrain the relationships between tectonic stress and pore structure, as well as methane adsorption parameters. Such work will be essential for suggesting shale reservoir sweet spots in structurally deformed basins.
Author Contributions
Conceptualization, X.Z. and C.H.; methodology, X.Z. and C.H.; validation, L.C.; formal analysis, X.Z., D.W., X.W., Q.F., and Y.L.; investigation, X.Z., D.W., X.W., Q.F., and Y.L.; resources, L.C. and Z.S.; data curation, X.Z.; writing—original draft preparation, X.Z.; writing—review and editing, Q.H.; project administration, X.Z. and C.H.; funding acquisition, X.Z. and C.H. All authors have read and agreed to the published version of the manuscript.
Funding
This work was jointly supported by the “Tianchi Talent” funded by Xinjiang Uygur Autonomous Region Introduction Plan, the Key Research and Development Program of Xinjiang Uygur Autonomous Region (Nos. 2024B03007 and 2024B03007-2); the Research Initiation Fund of Shandong Institute of Petroleum and Chemical Technology (No. DJB20240013); and the Natural Science Foundation of Dongying City (No. 2025ZR018).
Data Availability Statement
The original contributions presented in this study are included in the article. Further inquiries can be directed to the corresponding authors.
Acknowledgments
The samples in this manuscript were from the Sinopec Jianghan Oilfield Company, for which we would like to express our gratitude. In addition, we are grateful to two anonymous reviewers for their excellent assistance and constructive comments that considerably improved the quality of this work.
Conflicts of Interest
Authors Lanpu Chen and Zhiguo Shu were employed by the SINOPEC Jianghan Oilfield Company. The remaining authors declare that the research was conducted in the absence of any commercial or financial relationships that could be construed as a potential conflict of interest.
References
- Jarvie, D.M.; Hill, R.J.; Ruble, T.E.; Pollastro, R.M. Unconventional shale-gas systems: The Mississippian Barnett Shale of north-central Texas as one model for thermogenic shale-gas assessment. AAPG Bull. 2007, 91, 475–499. [Google Scholar] [CrossRef]
- Pollastro, R.M. Total petroleum system assessment of undiscovered resources in the giant Barnett Shale continuous (unconventional) gas accumulation, Fort Worth Basin, Texas. AAPG Bull. 2007, 91, 551–578. [Google Scholar] [CrossRef]
- Ross, D.J.K.; Bustin, R.M. Characterizing the shale gas resource potential of Devonian-Mississippian strata in the Western Canada sedimentary basin: Application of an integrated formation evaluation. AAPG Bull. 2008, 92, 87–125. [Google Scholar] [CrossRef]
- Zou, C.N.; Dong, D.Z.; Wang, S.J.; Li, J.Z.; Li, X.J.; Wang, Y.M.; Li, D.H.; Cheng, K.M. Geological characteristics and resource potential of shale gas in China. Pet. Explor. Dev. 2010, 37, 641–653. [Google Scholar] [CrossRef]
- Zou, C.N.; Dong, D.Z.; Wang, Y.M.; Li, X.J.; Huang, J.L.; Wang, S.F.; Guan, Q.Z.; Zhang, C.C.; Wang, H.Y.; Liu, H.L.; et al. Shale gas in China: Characteristics, challenges and prospects (I). Pet. Explor. Dev. 2015, 42, 753–767. [Google Scholar] [CrossRef]
- Zou, C.N.; Dong, D.Z.; Wang, Y.M.; Li, X.J.; Huang, J.L.; Wang, S.F.; Guan, Q.Z.; Zhang, C.C.; Wang, H.Y.; Liu, H.L.; et al. Shale gas in China: Characteristics, challenges and prospects (II). Pet. Explor. Dev. 2016, 43, 182–196. [Google Scholar] [CrossRef]
- Curtis, J.B. Fractured shale-gas systems. AAPG Bull. 2002, 86, 1921–1938. [Google Scholar] [CrossRef]
- Hill, D.G.; Nelson, C.R. Gas productive fractured shales: An overview and update. Gas Tips 2000, 6, 4–13. [Google Scholar]
- Bowker, K.A. Barnett shale gas production, Fort Worth Basin: Issues and discussion. AAPG Bull. 2007, 91, 523–533. [Google Scholar] [CrossRef]
- Hammes, U.; Hamlin, H.S.; Ewing, T.E. Geologic analysis of the Upper Jurassic Haynesville Shale in east Texas and west Louisiana. AAPG Bull. 2011, 95, 1643–1666. [Google Scholar] [CrossRef]
- Chalmers, G.R.; Bustin, R.M.; Power, I.M. Characterization of gas shale pore systems by porosimetry, pycnometry, surface area, and field emission scanning electron microscopy/transmission electron microscopy image analyses: Examples from the Barnett, Woodford, Haynesville, Marcellus, and Doig units. AAPG Bull. 2012, 96, 1099–1119. [Google Scholar] [CrossRef]
- Wang, P.F.; Jiang, Z.X.; Chen, L.; Yin, L.S.; Li, Z.; Zhang, C.; Tang, X.L.; Wang, G.Z. Pore structure characterization for the Longmaxi and Niutitang shales in the Upper Yangtze Platform, South China: Evidence from focused ion beam-He ion microscopy, nano-computerized tomography and gas adsorption analysis. Mar. Pet. Geol. 2016, 77, 1323–1337. [Google Scholar] [CrossRef]
- Yang, R.; He, S.; Yi, J.Z.; Hu, Q.H. Nano-scale pore structure and fractal dimension of organic-rich Wufeng-Longmaxi shale from Jiaoshiba area, Sichuan Basin: Investigations using FE-SEM, gas adsorption and helium pycnometry. Mar. Pet. Geol. 2016, 70, 27–45. [Google Scholar] [CrossRef]
- Chen, L.; Jiang, Z.X.; Liu, Q.X.; Jiang, S.; Liu, K.Y.; Tan, J.Q.; Gao, F.L. Mechanism of shale gas occurrence: Insights from comparative study on pore structures of marine and lacustrine shales. Mar. Pet. Geol. 2019, 104, 200–216. [Google Scholar] [CrossRef]
- Li, Y.; Wang, Z.S.; Pan, Z.J.; Niu, X.L.; Yu, Y.; Meng, S.Z. Pore structure and its fractal dimensions of transitional shale: A cross-section from east margin of the Ordos Basin, China. Fuel 2019, 241, 417–431. [Google Scholar] [CrossRef]
- Ma, X.; Guo, S.B.; Shi, D.S.; Zhou, Z.; Liu, G.H. Investigation of pore structure and fractal characteristics of marine-continental transitional shales from Longtan Formation using MICP, gas adsorption, and NMR (Guizhou, China). Mar. Pet. Geol. 2019, 107, 555–571. [Google Scholar] [CrossRef]
- He, D.F.; Li, D.S.; Zhang, G.W.; Zhao, L.Z.; Fan, C.; Lu, R.Q.; Wen, Z. Formation and evolution of multi-cycle superposed Sichuan Basin, China. Chin. J. Geol. 2011, 46, 589–606, (In Chinese with English abstract). [Google Scholar]
- Liu, S.G.; Deng, B.; Zhong, Y.; Ran, B.; Yong, Z.Q.; Sun, W.; Yang, D.; Jiang, L.; Ye, Y.H. Unique geological features of burial and superimposition of the Lower Paleozoic shale gas across the Sichuan Basin and its periphery. Earth Sci. Front. 2016, 23, 11–28, (In Chinese with English abstract). [Google Scholar]
- Wang, P.F.; Jiang, Z.X.; Yin, L.S.; Chen, L.; Li, Z.; Zhang, C.; Li, T.W.; Huang, P. Lithofacies classification and its effect on pore structure of the Cambrian marine shale in the Upper Yangtze Platform, South China: Evidence from FE-SEM and gas adsorption analysis. J. Pet. Sci. Eng. 2017, 156, 307–321. [Google Scholar] [CrossRef]
- Li, Y.F.; Schieber, J.; Fan, T.L.; Wei, X.J. Pore characterization and shale facies analysis of the Ordovian-Silurian transition of northern Guizhou, South China: The controls of shale facies on pore distribution. Mar. Pet. Geol. 2018, 92, 697–718. [Google Scholar] [CrossRef]
- Yang, W.; Zuo, R.S.; Jiang, Z.X.; Chen, D.X.; Song, Y.; Luo, Q.; Wang, Q.Y.; Zhu, H.J. Effect of lithofacies on pore structure and new insights into pore-preserving mechanisms of the over-mature Qiongzhusi marine shales in Lower Cambrian of the southern Sichuan Basin, China. Mar. Pet. Geol. 2018, 98, 746–762. [Google Scholar] [CrossRef]
- Zhang, L.C.; Lu, S.F.; Jiang, S.; Xiao, D.S.; Chen, L.; Liu, Y.; Zhang, Y.Y.; Li, B.; Gong, C. Effect of shale lithofacies on pore structure of the Wufeng-Longmaxi shale in Southeast Chongqing, China. Energy Fuels 2018, 32, 6603–6618. [Google Scholar] [CrossRef]
- Guo, X.W.; Qin, Z.J.; Yang, R.; Dong, T.; He, S.; Hao, F.; Yi, J.Z.; Shu, Z.G.; Bao, H.Y.; Liu, K.Y. Comparison of pore systems of clay-rich and silica-rich gas shales in the lower Silurian Longmaxi formation from the Jiaoshiba area in the eastern Sichuan Basin, China. Mar. Pet. Geol. 2019, 101, 265–280. [Google Scholar] [CrossRef]
- Yang, F.; Xu, S.; Hao, F.; Hu, B.Y.; Zhang, B.Q.; Shu, Z.G.; Long, S.Y. Petrophysical characteristics of shales with different lithofacies in Jiaoshiba area, Sihuan Basin, China: Implications for shale gas accumulation mechanism. Mar. Pet. Geol. 2019, 109, 394–407. [Google Scholar] [CrossRef]
- Wang, X.M.; Liu, L.F.; Wang, Y.; Sheng, Y.; Zheng, S.S.; Wu, W.W.; Luo, Z.H. Comparison of the pore structures of Lower Silurian Longmaxi Formation shales with different lithofacies in the southern Sichuan Basin, China. J. Nat. Gas Sci. Eng. 2020, 81, 103419. [Google Scholar] [CrossRef]
- Xu, S.; Hao, F.; Shu, Z.G.; Zhang, A.H.; Yang, F. Pore structures of different types of shales and shale gas exploration of the Ordovician Wufeng and Silurian Longmaxi successions in the eastern Sichuan Basin, South China. J. Asian Earth Sci. 2020, 193, 104271. [Google Scholar] [CrossRef]
- Yang, W.; He, S.; Iglauer, S.; Guo, X.W.; Zhai, G.Y.; Zhou, Z.; Dong, T.; Tao, Z.; Wei, S.L. Porosity characteristics of different lithofacies in marine shale: A case study of Neoproterozoic Sinian Doushantuo formation in Yichang area, China. J. Pet. Sci. Eng. 2020, 187, 106856. [Google Scholar] [CrossRef]
- Lu, X.C.; Li, F.C.; Watson, A.T. Adsorption measurements in Devonian shales. Fuel 1995, 74, 599–603. [Google Scholar] [CrossRef]
- Chalmers, G.R.L.; Bustin, R.M. The organic matter distribution and methane capacity of the Lower Cretaceous strata of Northeastern British Columbia, Canada. Int. J. Coal Geol. 2007, 70, 223–239. [Google Scholar] [CrossRef]
- Chalmers, G.R.L.; Bustin, R.M. Lower Cretaceous gas shales in northeastern British Columbia, Part I: Geological controls on methane sorption capacity. Bull. Can. Pet. Geol. 2008, 56, 1–21. [Google Scholar] [CrossRef]
- Ross, D.J.K.; Bustin, R.M. Shale gas potential of the Lower Jurassic Gordondale Member, northeastern British Columbia, Canada. Bull. Can. Pet. Geol. 2007, 55, 51–75. [Google Scholar] [CrossRef]
- Ross, D.J.K.; Bustin, R.M. The importance of shale composition and pore structure upon gas storage potential of shale gas reservoirs. Mar. Pet. Geol. 2009, 26, 916–927. [Google Scholar] [CrossRef]
- Zhang, T.W.; Ellis, G.S.; Ruppel, S.C.; Milliken, K.; Yang, R.S. Effect of organic-matter type and thermal maturity on methane adsorption in shale-gas systems. Org. Geochem. 2012, 47, 120–131. [Google Scholar] [CrossRef]
- Hao, F.; Zou, H.Y.; Lu, Y.C. Mechanisms of shale gas storage: Implications for shale gas exploration in China. AAPG Bull. 2013, 97, 1325–1346. [Google Scholar] [CrossRef]
- Wang, S.B.; Song, Z.G.; Cao, T.T.; Song, X. The methane sorption capacity of Paleozoic shales from the Sichuan Basin, China. Mar. Pet. Geol. 2013, 44, 112–119. [Google Scholar] [CrossRef]
- Ji, W.M.; Song, Y.; Jiang, Z.X.; Wang, X.Z.; Bai, Y.Q.; Xing, J.Y. Geological controls and estimation algorithms of lacustrine shale gas adsorption capacity: A case study of the Triassic strata in the southeastern Ordos Basin, China. Int. J. Coal Geol. 2014, 134–135, 61–73. [Google Scholar] [CrossRef]
- Ji, W.M.; Song, Y.; Jiang, Z.X.; Chen, L.; Li, Z.; Yang, X.; Meng, M.M. Estimation of marine shale methane adsorption capacity based on experimental investigations of Lower Silurian Longmaxi formation in the Upper Yangtze Platform, south China. Mar. Pet. Geol. 2015, 68, 94–106. [Google Scholar] [CrossRef]
- Yang, F.; Ning, Z.F.; Zhang, R.; Zhao, H.W.; Krooss, B.M. Investigations on the methane sorption capacity of marine shales from Sichuan Basin, China. Int. J. Coal Geol. 2015, 146, 104–117. [Google Scholar] [CrossRef]
- Ibad, S.M.; Padmanabhan, E. Methane sorption capacities and geochemical characterization of Paleozoic shale Formations from Western Peninsula Malaysia: Implication of shale gas potential. Int. J. Coal Geol. 2020, 224, 103480. [Google Scholar] [CrossRef]
- Ma, Y.Q.; Fan, M.J.; Lu, Y.C.; Guo, X.S.; Hu, H.Y.; Chen, L.; Wang, C.; Liu, X.C. Geochemistry and sedimentology of the Lower Silurian Longmaxi mudstone in southwestern China: Implications for depositional controls on organic matter accumulation. Mar. Pet. Geol. 2016, 75, 291–309. [Google Scholar] [CrossRef]
- Huang, H.Y.; He, D.F.; Li, Y.Q.; Li, J.; Zhang, L. Silurian tectonic-sedimentary setting and basin evolution in the Sichuan area, southwest China: Implications for palaeogeographic reconstructions. Mar. Pet. Geol. 2018, 92, 403–423. [Google Scholar] [CrossRef]
- Dai, J.X.; Zou, C.N.; Liao, S.M.; Dong, D.Z.; Ni, Y.Y.; Huang, J.L.; Wu, W.; Gong, D.Y.; Huang, S.P.; Hu, G.Y. Geochemistry of the extremely high thermal maturity Longmaxi shale gas, southern Sichuan Basin. Org. Geochem. 2014, 74, 3–12. [Google Scholar] [CrossRef]
- Li, Y.F.; Zhang, T.W.; Ellis, G.S.; Shao, D.Y. Depositional environment and organic matter accumulation of Upper Ordovician-Lower Silurian marine shale in the Upper Yangtze Platform, South China. Palaeogeogr. Palaeoclimatol. Palaeoecol. 2017, 466, 252–264. [Google Scholar] [CrossRef]
- Yi, J.Z.; Bao, H.Y.; Zheng, A.W.; Zhang, B.Q.; Shu, Z.G.; Li, J.Q.; Wang, C. Main factors controlling marine shale gas enrichment and high-yield wells in South China: A case study of the Fuling shale gas field. Mar. Pet. Geol. 2019, 103, 114–125. [Google Scholar] [CrossRef]
- Nie, H.K.; Li, D.H.; Liu, G.X.; Lu, Z.Y.; Wang, H.; Wang, R.Y.; Zhang, G.R. An overview of the geology and production of the Fuling shale gas field, Sichuan Basin, China. Energy Geosci. 2020, 1, 147–164. [Google Scholar] [CrossRef]
- Guo, X.S. Major factors controlling the shale gas accumulations in Wufeng-Longmaxi Formation of the Pingqiao Shale Gas Field in Fuling Area, Sichuan Basin, China. J. Nat. Gas Geosci. 2019, 4, 129–138. [Google Scholar] [CrossRef]
- Xu, S.; Gou, Q.Y.; Hao, F.; Zhang, B.Q.; Shu, Z.G.; Lu, Y.B.; Wang, Y.X. Shale pore structure characteristics of the high and low productivity wells, Jiaoshiba shale gas field, Sichuan Basin, China: Dominated by lithofacies or preservation condition? Mar. Pet. Geol. 2020, 114, 104211. [Google Scholar] [CrossRef]
- Loucks, R.G.; Reed, R.M.; Ruppel, S.C.; Jarvie, D.M. Morphology, genesis, and distribution of nanometer-scale pores in siliceous mudstones of the Mississippian Barnett Shale. J. Sediment. Res. 2009, 79, 848–861. [Google Scholar] [CrossRef]
- Loucks, R.G.; Reed, R.M.; Ruppel, S.C.; Hammes, U. Spectrum of pore types and networks in mudrocks and a descriptive classification for matrix-related mudrock pores. AAPG Bull. 2012, 96, 1071–1098. [Google Scholar] [CrossRef]
- Slatt, R.M.; O’Brien, N.R. Pore types in the Barnett and Woodford gas shales: Contribution to understanding gas storage and migration pathways in fine-grained rocks. AAPG Bull. 2011, 95, 2017–2030. [Google Scholar] [CrossRef]
- Langmuir, I. The adsorption of gases on plane surfaces of glass, mica and platinum. J. Am. Chem. Soc. 1918, 40, 1361–1403. [Google Scholar] [CrossRef]
- Gasparik, M.; Ghanizadeh, A.; Bertier, P.; Gensterblum, Y.; Bouw, S.; Krooss, B.M. High-pressure methane sorption isotherms of black shales from the Netherlands. Energy Fuels 2012, 26, 4995–5004. [Google Scholar] [CrossRef]
- Gasparik, M.; Bertier, P.; Gensterblum, Y.; Ghanizadeh, A.; Krooss, B.M.; Littke, R. Geological controls on the methane storage capacity in organic-rich shales. Int. J. Coal Geol. 2014, 123, 34–51. [Google Scholar] [CrossRef]
- Rexer, T.F.; Benham, M.J.; Aplin, A.C.; Thomas, K.M. Methane adsorption on shale under simulated geological temperature and pressure conditions. Energy Fuels 2013, 27, 3099–3109. [Google Scholar] [CrossRef]
- Rexer, T.F.; Mathia, E.J.; Aplin, A.C.; Thomas, K.M. High-Pressure methane adsorption and characterization of pores in Posidonia shales and isolated kerogens. Energy Fuels 2014, 28, 2886–2901. [Google Scholar] [CrossRef]
- Tan, J.Q.; Weniger, P.; Krooss, B.; Merkel, A.; Horsfield, B.; Zhang, J.C.; Boreham, C.J.; Graas, G.V.; Tocher, B.A. Shale gas potential of the major marine shale formations in the Upper Yangtze Platform, South China, Part II: Methane sorption capacity. Fuel 2014, 129, 204–218. [Google Scholar] [CrossRef]
- Tian, H.; Li, T.F.; Zhang, T.W.; Xiao, X.M. Characterization of methane adsorption on overmature Lower Silurian-Upper Ordovician shales in Sichuan Basin, southwest China: Experimental results and geological implications. Int. J. Coal Geol. 2016, 156, 36–49. [Google Scholar] [CrossRef]
- Wu, L.Y.; Hu, D.F.; Lu, Y.C.; Liu, R.B.; Liu, X.F. Advantageous shale lithofacies of Wufeng Formation-Longmaxi Formation in Fuling gas field of Sichuan Basin, SW China. Pet. Explor. Dev. 2016, 43, 208–217. [Google Scholar] [CrossRef]
- Wu, L.Y.; Lu, Y.B.; Jiang, S.; Lu, Y.C.; Liu, X.F.; Hu, H.Y. Pore structure characterization of different lithofacies in marine shale: A case study of the Upper Ordovician Wufeng-Lower Silurian Longmaxi formation in the Sichuan Basin, SW China. J. Nat. Gas Sci. Eng. 2018, 57, 203–215. [Google Scholar] [CrossRef]
- Zhu, H.J.; Ju, Y.W.; Qi, Y.; Huang, C.; Zhang, L. Impact of tectonism on pore type and pore structure evolution in organic-rich shale: Implications for gas storage and migration pathways in naturally deformed rocks. Fuel 2018, 228, 272–289. [Google Scholar] [CrossRef]
- Xiang, J.; Zhu, Y.M.; Wang, Y.; Chen, S.B.; Jiang, Z.F. Structural deformation and its pore-fracture system response of the Wufeng-Longmaxi shale in the Northeast Chongqing area, using FE-SEM, gas adsorption, and SAXS. J. Pet. Sci. Eng. 2022, 209, 109877. [Google Scholar] [CrossRef]
- Allan, A.M.; Vanorio, T.; Dahl, J.E.P. Pyrolysis-induced P-wave velocity anisotropy in organic-rich shales. Geophysics 2014, 79, 41–53. [Google Scholar] [CrossRef]
- Anders, M.H.; Laubach, S.E.; Scholz, C.H. Microfractures: A review. J. Struct. Geol. 2014, 69, 377–394. [Google Scholar] [CrossRef]
- Ougier-Simonin, A.; Renard, F.; Boehm, C.; Vidal-Gilbert, S. Microfracturing and microporosity in shales. Earth-Sci. Rev. 2016, 162, 198–226. [Google Scholar] [CrossRef]
- Guo, X.S.; Hu, D.F.; Wei, X.F.; Li, Y.P. Main controlling factors on shale fractures and their influences on production capacity in Jiaoshiba area, the Sichuan Basin. Oil Gas Geol. 2016, 37, 799–808, (In Chinese with English abstract). [Google Scholar]
- Wang, X.M.; Jiang, Z.X.; Wang, S.C.; Chen, L.; Wei, K.; Gao, F.L. Characteristics of natural fractures in shale and their control effect on shale gas accumulation and development. Sci. Technol. Eng. 2018, 18, 34–42, (In Chinese with English abstract). [Google Scholar]
- Zhang, X.M.; Shi, W.Z.; Hu, Q.H.; Zhai, G.Y.; Wang, R.; Xu, X.F.; Meng, F.L.; Liu, Y.Z.; Bai, L.H. Developmental characteristics and controlling factors of natural fractures in the lower paleozoic marine shales of the upper Yangtze Platform, southern China. J. Nat. Gas Sci. Eng. 2020, 76, 103191. [Google Scholar] [CrossRef]
- Zhang, X.M.; Wang, R.; Shi, W.Z.; Hu, Q.H.; Xu, X.F.; Shu, Z.G.; Yang, Y.; Feng, Q. Structure- and lithofacies-controlled natural fracture developments in shale: Implications for shale gas accumulation in the Wufeng-Longmaxi Formations, Fuling Field, Sichuan Basin, China. Geoenergy Sci. Eng. 2023, 223, 211572. [Google Scholar] [CrossRef]
- Sing, K.S.W. Reporting physisorption data for gas/solid systems with special reference to the determination of surface area and porosity. Pure Appl. Chem. 1985, 57, 603–619. [Google Scholar] [CrossRef]
- Gregg, S.J.; Sing, K.S.W. Adsorption, Surface Area, and Porosity, 2nd ed.; Academic Press: New York, NY, USA, 1982. [Google Scholar]
- Thommes, M.; Kaneko, K.; Neimark, A.V.; Olivier, J.P.; Rodriguez-Reinoso, F.; Rouquerol, J.; Sing, K.S.W. Physisorption of gases, with special reference to the evaluation of surface area and pore size distribution (IUPAC Technical Report). Pure Appl. Chem. 2015, 87, 1051–1069. [Google Scholar] [CrossRef]
- Wang, Y.; Liu, L.F.; Zheng, S.S.; Luo, Z.H.; Sheng, Y.; Wang, X.M. Full-scale pore structure and its controlling factors of the Wufeng-Longmaxi shale, southern Sichuan Basin, China: Implications for pore evolution of highly overmature marine shale. J. Nat. Gas Sci. Eng. 2019, 67, 134–146. [Google Scholar] [CrossRef]
- Mosher, K.; He, J.J.; Liu, Y.Y.; Rupp, E.; Wilcox, J. Molecular simulation of methane adsorption in micro- and mesoporous carbons with applications to coal and gas shale systems. Int. J. Coal Geol. 2013, 109–110, 36–44. [Google Scholar] [CrossRef]
- Zhang, X.B.; Wang, Z.X.; Cao, Z.Y. Experimental study on the relationship between brittle deformation, fracturing and gas adsorption capacity. In Proceedings of the Project Annual Conference, Beijing, China, 9–10 December 2016. [Google Scholar]
Disclaimer/Publisher’s Note: The statements, opinions and data contained in all publications are solely those of the individual author(s) and contributor(s) and not of MDPI and/or the editor(s). MDPI and/or the editor(s) disclaim responsibility for any injury to people or property resulting from any ideas, methods, instructions or products referred to in the content. |
© 2025 by the authors. Licensee MDPI, Basel, Switzerland. This article is an open access article distributed under the terms and conditions of the Creative Commons Attribution (CC BY) license (https://creativecommons.org/licenses/by/4.0/).