Abstract
The kinetics of the dissolution of Estonian phosphate rock and the governing reaction mechanisms in hydrochloric acid in technological processes were investigated. The influences of particle size and acid concentrations of 0.5–1.5 M on the reaction rate and the pH variation during the process were studied at a dosage of 2.1 moles of HCl per mole of calcium for 60 min. The results indicated that the solubility of phosphorus reached 94%–100% for the fine samples and 82%–99% for the coarse samples. The time required to achieve an apparent steady-state pH reduced with the increasing acid concentrations and decreasing particle sizes. It was determined that the CaF2 precipitation in solutions starting at 1 M was faster at higher concentrations. The SEM surface analysis of the insoluble particles proved the existence of etch pit formation. The XPS and EDX analyses affirmed that the dissolution was incongruent. The surface composition of the unreacted particles gave a stoichiometry of CaF1.8, showing the formation of CaF2 on the surface. The dissolution kinetics were analyzed using the shrinking core model and showed a combination of chemical reaction, diffusion or interfacial transfer, and diffusion, sequentially for coarse particles or simultaneously for fine fractions.
1. Introduction
Phosphate minerals are the main constituents of phosphate rock (PR) and the main source of phosphorus in fertilizer production; they are also considered to be a source of rare earth elements (REEs). Globally, the quantity of available phosphorus is limited, and 90% of mined phosphorus is used for fertilizer production. In 2020, the European Commission recognized both phosphorus and REEs as critical raw materials (CRMs) that are essential to the European economy [1].
Estonian phosphorites are among the largest unmined phosphorite deposits in the European Union (EU) [2]. Estonian phosphate rock (EPR) resources are estimated to have more than 800 million tons of P2O5. The content of P2O5 in the Estonian phosphate ore varies between 6% and 20% [3]. The composition and quantity of rock impurity minerals (quartz, dolomite, pyrite, alumosilicates, etc.) varies from deposit to deposit.
The oldest industrial process of phosphoric acid production is based on phosphate concentrate dissolution in sulfuric acid (H2SO4) and is still widely used; this process has serious economic and environmental drawbacks, such as the formation of large amounts of phosphogypsum waste (5 tons per ton of P2O5) and the loss of REEs (up to 50% with phosphogypsum) [4,5,6]. In order to fulfill critical environmental requirements, it is necessary to establish new sustainable and waste-free processing methods for valorizing phosphate ores [7].
The dissolution of PR or concentrates in acids other than H2SO4 has also been studied, with different aims. For instance, recent studies have focused on the leaching of REEs from fluorapatite concentrate using nitric acid [8]. Bandara’s most recent studies of PR treatment with mineral acids showed that the PR leaching efficiency decreases in the following order: HCl > perchloric > nitric > sulfuric > phosphoric [9,10,11].
PR treatment with hydrochloric acid (HCl) has gained more attention as an environmentally friendly process, making this a potential method for industrial setups. This became a prominent topic under the concept of ‘Moving to Green Economy’ [12], which urged researchers to find sustainable processing methods.
A process for the preparation of phosphoric acid from phosphate rock using HCl was first patented in 1959 [13]. Then, the HCl method was further developed by an Israeli mining engineering company in the 1960s [14] and was patented in 1967 [15]. Due to the complexity of the process and equipment corrosion, the method received less attention from the industry [16]. However, research on the use of HCl to recover both phosphorus and REEs has been continued by different research groups [11,17,18].
According to the literature, the dissolution reaction rate depends on several parameters, such as the particle size, acid dosage, solid-to-liquid ratio, agitation speed, chemical and mineralogical composition of the PR, and temperature [5,10,11,19,20,21]. Particle size and acid dosage have the greatest impacts on the dissolution rate. Additionally, the complex mineralogical composition affects the reactivity and dissolution behavior of PR in acid solutions [22].
In the most recent studies on thermodynamic calculations and the experimental study of fluorapatite (FAp) dissolution in HCl by Tõnsuaadu. K. et al. [23], it was found that the amount/dosage of HCl needed for FAp dissolution depends on the acid concentration.
There are several possible reactions that take place during the PR dissolution process, depending on the acid concentration, dosages, temperature, and impurity minerals present. The overall reaction of calcium fluorapatite (FAp) with HCl leads to phosphoric acid and water-soluble calcium chloride formation (reaction 1). According to [24], calcium dihydrogen phosphate will form at low acid concentrations according to reaction 2, and high acid concentrations will form phosphoric acid (reaction 3). This can react further with residual PR to form calcium hydrogen phosphate (reaction 4).
Ca5(PO4)3F + 10HCl → 5CaCl2 + 3H3PO4 + HF
Ca5(PO4)3F + 7H+ → 5Ca2+ + 3H2PO4− + HF
Ca5(PO4)3F + 10H+ → 5Ca2+ + 3H3PO4 + HF
Ca5(PO4)3F + 2 H3PO4 → 5CaHPO4 + HF
Several side reactions can take place, depending on the impurity content and composition. The resulting diluted HF may react with silicates when diluted HCl is used, initially forming silicon tetrafluoride, which is then converted to hexafluorosilicic acid (reaction 5) [25]. The fluoride ion is involved in reactions 6 and 7, and at higher acid concentrations, CaF2 can be formed (reaction 8) [23,26,27,28,29]. The effects of these side reactions in technological processes also depend on their kinetics.
6HF + SiO2 ↔ 2H+ + SiF62− + 2H2O
(PO4)3F + 6H+ ↔ CaF+ + 4Ca2+ + 3H2PO4−
nF− + H+ ↔ HFn (2n−1)+ (n = 1, 2)
Ca2+ + 2F− ↔ CaF2
According to the review by Dorozhkin [30], there are eight dissolution models that involve in the apatite dissolution process under different conditions. Each of the studied models was found to have limitations and drawbacks. No study has been able to definitively explain the general dissolution mechanism of apatite, as the obtained results are only valid within the experimental conditions. Moreover, most of the models explained apatite dissolution in slightly acidic or nearly neutral (4 < pH < 8) solutions. Therefore, the validity of these models for apatite dissolution in strong inorganic acids with a solution pH < 2 has not been entirely revealed. The reason is that in strongly acidic conditions, solution undersaturation becomes uncertain due to the complexity of solubility determination [31]. However, these apatite dissolution conditions are common in the fertilizer industry [32,33]. Despite the explanation of eight dissolution mechanisms in [30], six unaddressed facts that may impact the dissolution of apatite were pointed out; it is necessary to consider these facts when attempting to describe the entire dissolution phenomenon.
When a solid contacts a liquid, the following reactions can occur:
A(fluid) + B(solid) → fluid products(C)
→ solid products (D)
→ fluid and solid products(E)
The kinetics of apatite dissolution in strong acids have been studied/examined using mathematical models such as pseudo-homogeneous models [34], the shrinking core model (SCM) [35,36], and the Avrami–Erofeev equation [37,38].
The shrinking core model (SCM) is referred to as an approximation of real-world scenarios of gas or liquid contacting with a solid [39]. The dissolution of natural and synthetic apatites in mineral acids has been studied [9,40,41,42,43,44,45,46]; for the identification of the rate-controlling factor(s) in the PR dissolution process, the SCM model is most frequently used [9,41,43,44,45].
Bandara et al. [9] studied the dissolution kinetics of the Australian FAp variety in different acids, and it was concluded that the dissolution process of phosphorus and calcium was mainly controlled by chemical reaction with HCl, while in H3PO4 (3.25 M), calcium dissolution was controlled by diffusion [9]. The mathematical treatment of the data of Zhijin Xinhua phosphorite dissolution [41] in 36 wt% HCl led to the conclusion that PR dissolution is mainly controlled by a chemical reaction, as well as by diffusion. Similarly, several other researchers have attempted to incorporate SCM to study the rate-controlling steps of apatite dissolution in HCl [42,43,44,45].
Unfortunately, in most cases, large dosages and high concentrations of HCl were used in the experiments; this also increases the dissolution of impurity minerals and is not needed for the dissolution of phosphorites. The most recent study [47] showed that the optimum HCl dosage depends on the apatite mineral content in the sample.
A fundamental understanding of the kinetics of the phosphate rock dissolution process in strong acids and the determination of the reaction mechanisms is essential to optimize process conditions when designing an industrial-scale reactor. However, the complex dissolution mechanism of PR with a hydrochloric acid solution has not yet been completely revealed.
The aim of this study was to investigate the impact of particle size and HCl concentration on Estonian phosphate rock (Ülgase deposit) dissolution kinetics using phosphorus and fluorine solubility data and measuring the pH change during the dissolution process at room temperature. Additional surface studies were performed for initial and insoluble solid surfaces after the reaction with HCl using scanning electron microscopy (SEM), energy dispersive X-ray spectrometry (EDX), and X-ray photoelectron spectroscopy (XPS) techniques. As a preliminary step prior to the identification of a generalized dissolution model, these data were processed using the shrinking core model.
2. Materials and Methods
2.1. Materials
An Estonian PR sample from the Ülgase deposit with two different particle sizes (coarse: mean = 1735 µm, median = 1698 µm and fine: mean = 226.6 µm, median = 118.4 µm) was used in the experiments. The chemical and mineralogical composition of the sample is given in Table 1.

Table 1.
Chemical and mineralogical composition of Estonian PR sample.
The PR sample is characterized by a low content of acid-soluble impurities and mainly consists of carbonate apatite and quartz.
Concentrated HCl (Sigma-Aldrich, ACS reagent, St. Louis, MO, USA) was used to prepare a series of HCl solutions ranging from 0.5 M to 1.5 M. The concentration of the acid solution was determined by potentiometric titration with a KOH solution.
2.2. Methods
2.2.1. Experiment Setup
The dissolution of PR was performed in a LARA CLR reactor (Radleys, Essex, UK) with a volume of 1 L, using 500 mL of acid under the optimal conditions described in the previous publication (47). The acid dose corresponded to the apatite dissolution (reaction 9) + 5% excess. The mole ratio of HCl/Ca was 2.1 in all the experiments.
Ca5(PO4)3−x(CO3)xFy + 10H+ + 10Cl− → 5Ca2+ + (3−x)H3PO4 + 10Cl− + yHF + xCO2
3(3−x) + y = 10
Simultaneously, the pH was measured throughout the reaction duration with a combination VP (virtual prototyping) pH probe electrode, calibrated with pH buffer solutions at 4.01, 7.00, and 9.00 (Hamilton Bonaduz AG, Bonaduz, Switzerland). All the experiments were performed at room temperature, 25 ± 1 °C, at a mixing rate of 550 rpm. A known amount of reaction mixture was collected at different time intervals (from 2 to 60 min of experiment duration) and diluted (~30 times) with distilled water. The suspension obtained was centrifuged, and the clear solutions were used for the determination of the dissolved amounts of P and F.
2.2.2. Analysis and Characterization
The element content in each solution fraction was determined as follows: the concentration of phosphorus was determined spectrophotometrically (Biochrom Libra S70PC Cambridge, UK) as a phosphomolybdate yellow complex (λ = 430 nm); Ca was determined using atomic absorption spectrometry (Spectra AA 55B, Varian BV, Varian Australia Pty Ltd., Belrose, NSW, Australia); and fluorine was determined using an F-sensitive electrode (Mettler Toledo GmbH, Schwerzenbach, Switzerland).
The phase composition and changes in the morphology of the PR particles before and after reaction with HCl were further investigated using XPS and SEM-EDS analyses. The elemental composition was determined using X-ray photoelectron spectroscopy (XPS) (Kratos Axis UltraDLD, Kratos Analytical Ltd, Manchester, UK). The O 1s and F peak positions were used to calibrate the spectral energies of the selected samples. The changes in the morphology of the PR particles before and after acid treatment were further investigated using a scanning electron microscope (HR-SEM Zeiss—ULTRA 55, Zeiss Group, Oberkochen, Germany). The particle size was determined using PSD analysis (Horiba Laser Scattering instrument—LA-950V2, Horiba, Kyoto, Japan). For the evaluation of the dissolution rate-limiting stages, the shrinking core model equations proposed by Levenspiel [39] were used.
The mineralogical composition of the PR was determined at the Institute of Geology, TalTech using XRD analysis (X-ray diffractometer, model D8 Advance, Fe-filtered Co radiation, Lynxeye detector, Bruker AXS GmbH, Karlsruhe, Germany). Quantitative analysis was carried out with TOPAS software V6 (Rietveld refinement method).
3. Results and Discussion
3.1. The pH Changes during the Dissolution Process
For the first time, a thorough investigation of the PR dissolving process in a HCl solution was conducted with continuous pH monitoring. During PR dissolution in HCl, the pH of the suspension increases, and the shape of the curve depends on the acid concentration (Figure 1). The pH increase is fast for the fine sample, especially during the first minutes, and then slows down significantly. For both particle sizes, the time to reach a stable pH value decreases with the increase in the acid concentration (Figure 2). The fine sample tends to reach a stable pH earlier compared to the coarse sample under similar conditions. After an apparent steady state is achieved, a decrease in pH is followed for acid concentrations above 1 M in the case of the fine sample (Figure 1b) and 1.5 M for the coarse sample (Figure 1a).
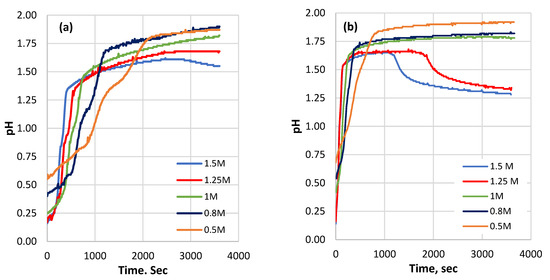
Figure 1.
The pH variation during the processing time of the reaction: (a) coarse sample; (b) fine sample at different initial acid concentrations.
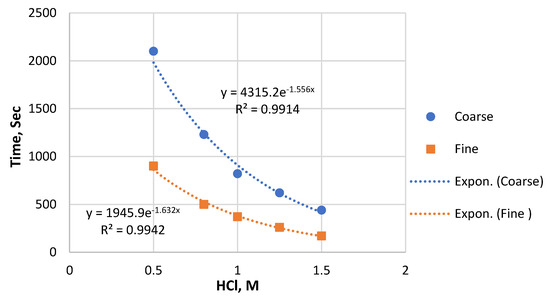
Figure 2.
The time required to reach pH stabilization depending on the particle size and the HCl concentration.
3.2. Effect of Particle Size and HCl Concentration on Solubility of P
The leaching efficiency of P from the two particle size fractions of PR as a function of time was determined. The results are shown in Figure 3. The leaching efficiency of P from both samples increased with the prolonging of the process time. As assumed, the P solubility against time indicated that the coarse sample had a slow leaching rate from the beginning, while the fine samples showed a rapid reaction. The fine particles reacted faster, reaching slightly higher P recovery compared to the coarse sample under the same reaction conditions. It is clear that the particle size directly affects the dissolution rate.
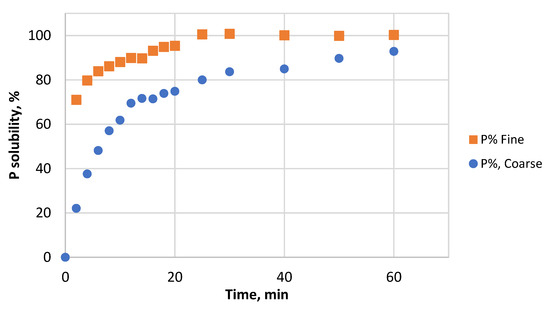
Figure 3.
Dissolution of P from fine and coarse samples as a function of time in 1.5 M HCl.
The P solubility in the HCl solution of the coarse sample depended on the acid concentration (Figure 4). In 2 min, it increased from 0 to 12% (in 0.5 M HCl) and to 22% (in 1.5 M HCl). During the whole reaction duration, the difference in P dissolution between 0.5 M and 1.5 M acid was about 10%–12%, whereas the solubilities for the concentrations above 0.5 M were remarkably close. The rate of dissolution decreased with time, and the solubility of P reached 82% in 0.5 M acid and 92%–99% for the other acid concentrations at 60 min. A significant decrease in the reaction rate was observed from 16 to 20 min up to 60 min.
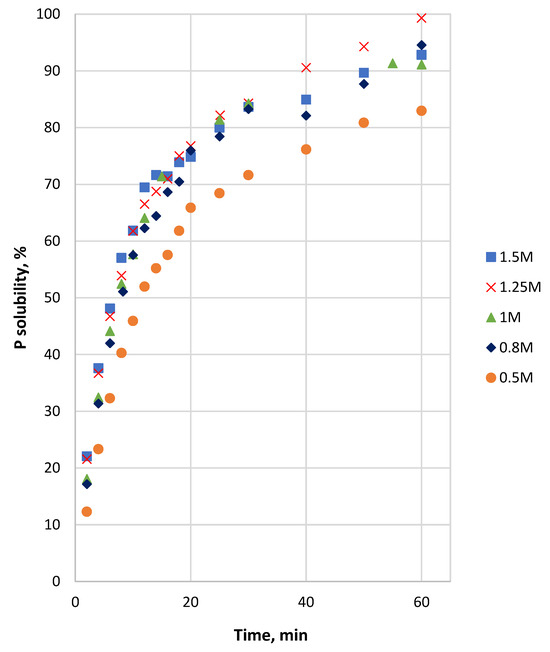
Figure 4.
P solubility from Ülgase coarse sample as a function of time at different initial HCl concentrations.
The dissolution of the fine sample was fast in the first 2 min, reaching up to 61%–71% depending on the acid concentration (Figure 5). The final P solubility for the fine samples was between 94 and 100% at 60 min. The logarithmic scale of the P solubility of the fine fraction versus time (Figure 5) shows that the difference in P dissolution between 0.5 M and 1 M acid was at the level of 3%–4% throughout most of the process. Comparing the 0.5 M and 1.5 M acid solutions, the level was about 7% until 15 min, increasing gradually to about 8% for the rest of the reaction duration.
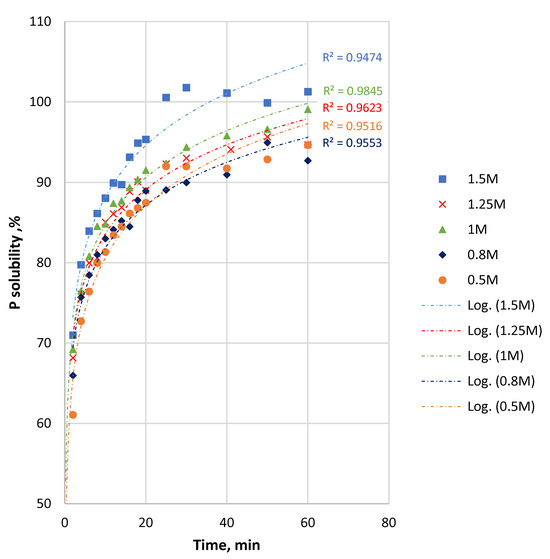
Figure 5.
P solubility and logarithmic values of P solubility from Ülgase fine sample as a function of time at different initial HCl concentrations.
The P solubility was the lowest in 0.5 M HCl. According to reaction 2, calcium dihydrogen phosphate will be the main form of leached P in the solution. For both samples, the dissolution rate was strongly reduced with the prolonging of the time. According to the literature, this slowing down of the dissolution process can be attributed to the development of a self-inhibiting Ca-rich layer on the apatite surface during the dissolution [34,48]. Further studies showed that the initial surface favored Ca release and that this was due to the exchange process of the apatite-bound Ca for the hydrogen ion in solution during the first stages of the dissolution reaction [35,49].
3.3. P Solubility and pH Variation
There are visible differences in the pH and P solubility profiles as time increases (Figure 6). For the fine sample in 1.5 M HCl, the P solubility exceeded 80% when the pH increased to 1.47 within 6 min. Thereafter, the P solubility continued to rise throughout the remaining time of the process. However, the pH increased progressively to 1.58 at 20 min and then decreased to 1.29 at the end of the process.
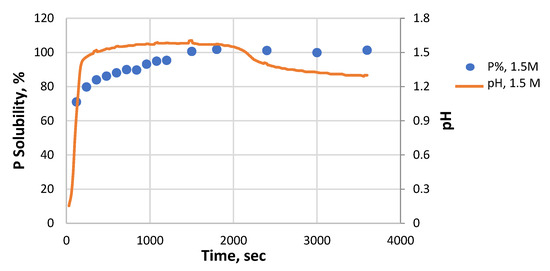
Figure 6.
The pH and P solubility profiles versus time of the fine sample in 1.5 M HCl.
Assuming that the H+ ions were mainly used in the apatite dissolution reaction, the plot of the P solubility that depended on the changing pH value of the solution was constructed (Figure 7).
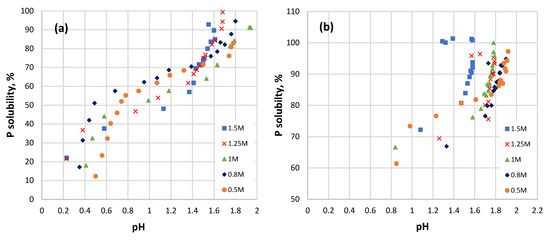
Figure 7.
P solubility as a function of pH at different initial HCl concentrations: (a) coarse sample; (b) fine sample.
The plot of the P solubility of the coarse sample versus pH (Figure 7a) reveals that it can be divided into three different stages of different linearity. The P solubility reached almost 40% or above for all the coarse samples by a pH of 0.8. In the pH interval from 0.8 to 1.4, the solubility of P increased by only 10%–15%. At this point, all the samples reached a P solubility of 60% or above. Moreover, in the pH interval from 0.8 to 1.4, the P solubility was higher at a HCl concentration of less than 1 M and lower at a HCl concentration above 1 M. The next increase in P solubility by an additional ~30% raised the pH value up to 1.8.
For the fine sample (Figure 7b), the dependence of P solubility on the pH looks different for the initial HCl concentrations of 0.5–1 M and 1.25–1.5 M. In the first case, two reaction stages can be distinguished. The pH increases, respectively, from 0.4 to 0.7 up to 0.6 to 0.98, and the P solubility increases at that pH by up to 70%. A further increase in P solubility by another 10% causes the pH to increase up to 1.61–1.76.
In the more concentrated 1.25 M and 1.5 M acid, three visible stages can be seen. The dissolution of P up to 80% causes the pH to increase to 1.47. The additional dissolution of 20% of P takes place at an almost constant pH value. When the maximum P solubility is reached (97%–100%), the pH value starts to decrease, and if it falls back to ~1.4, the solubility of P slightly decreases. All of this indicates that the dissolution processes taking place have different mechanisms; it can also be related to shifts in the complex ionization and solubility equilibrium.
At the initial step, the acid attacks the apatite particles, releasing F−, Ca²+, HPO42−, and PO4³− ions into the solution, which can then develop a barrier liquid layer on the unreacted core. As the reaction proceeds, the dissolution rate gradually reduces. A similar behavior was also observed in previous studies [50,51,52].
The H+ ions then react with the PO43−, OH−, or F− ions that are already present in the bulk solution, lowering their concentration. According to the solubility product principle, during this process a change in the concentration of solution ions causes an unreacted solid to dissolve more readily [53]. According to [49], the experiments suggested that the FAp surface exchanges Ca2+ for two H+ ions and one F− ion for OH−. The overall low P solubility rate observed from a pH of 0.64 to 1.76 may be attributable to the equilibration between ions in the surface layer and bulk solution.
If the unreacted particle surface forms a Ca-rich layer due to re-adsorption, there will be a gradient of ionic chemical potential between the surface and the bulk solution. The remaining protons will rapidly attack the surface layer again to release P and Ca. The consumption of solution protons will cause the next increase in the pH value. The results show that the protonation of apatite surfaces is negligible at a pH ≥ 3 [49], which suggests that pH values below 3 possibly provide a potential environment for the protonation of the apatite surface. Therefore, this transition can cause higher P solubilities to be reached with a narrower pH shift during the last stage of the process (Figure 7).
3.4. P Solubility versus F Solubility
Assuming that apatite dissolution was the only source of P and F in the solution, the plot of P solubility versus F solubility for selected time intervals was constructed (Figure 8). In the case of stoichiometric apatite dissolution, the P–F plot has to be linear.
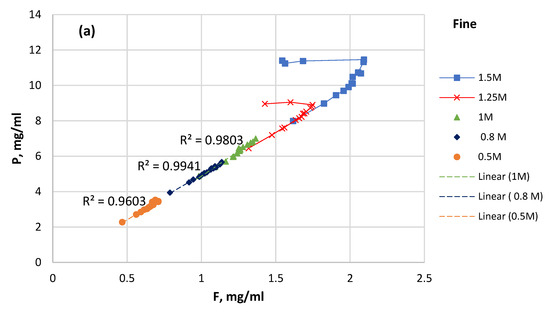
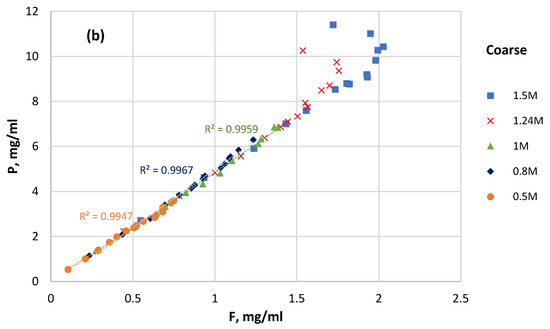
Figure 8.
P solubility versus F solubility at different initial HCl concentrations: (a) fine sample; (b) coarse sample.
As can be seen in Figure 8, the decrease in the fluorine content can be followed in the solutions starting at 1 M and upward, and this decrease happens faster at higher concentrations. This can be explained by the formation of solid CaF2 (reaction 10) in HCl ≥ 1 M, and it also explains the solution’s simultaneous drop in pH.
2HF + Ca2+ → CaF2 + 2H+
3.5. PR Particle Surface Analysis—Before and after Dissolution
3.5.1. SEM Observations
The study of the particles before and after acid treatment using SEM revealed the surface transformation that resulted from the dissolution process. In agreement with earlier works [52], etch pit formation during dissolution was found (Figure 9).
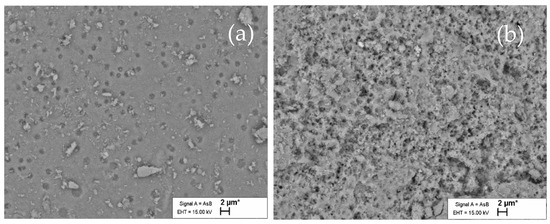
Figure 9.
SEM image of PR surface of coarse sample: (a) before acid dissolution; (b) after dissolution in 1.24 M HCl and washed with water.
The pits were detected on a smooth surface of the initial coarse sample (Figure 9a). Pit size is a critical requirement for the initiation of dissolution, and the following dissolution proceeds through the growth of these pits, resulting in the increase in surface area [54]. The SEM results demonstrate well that the acid-treated PR has small pits that lose their orientation and become isotropic (Figure 9b).
According to Dorozhkin’s assumption [55], the detachment of phosphate anions creates a hole on the surface with dimensions close to the lattice parameters (6–9 Å) of apatite. As a result of this, he assumed that the development of such holes could form an etch pit and that this hole could grow in width and spread over the surface with a finite lateral rate in the dissolution step. The SEM images of the reacted particles verified this hypothesis.
According to the literature, dissolution often starts with the formation of etch pits [56]. Therefore, the pits observed in the initial particle can start the spreading of the etch pits (i.e., the spreading of collections of vacant sites for Ca2+, PO43− and F−). The observed non-etched areas can be associated with the variability of the PR surface and impurities. The EDX analysis of different regions of the same particle (Figure 10) confirmed the diversity of the surface.
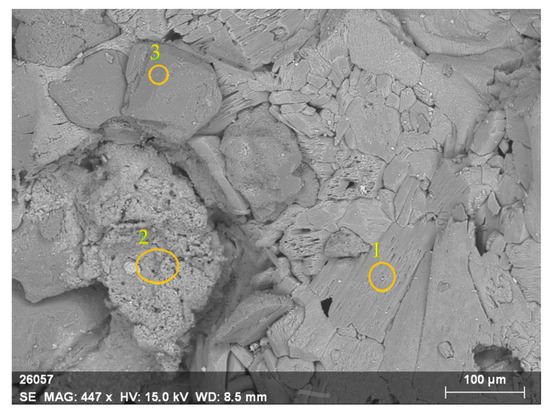
Figure 10.
Regions with concentrations of (1) Ca and O; (2) Ca, Si, Al, P, and O; (3) Si and O.
3.5.2. XPS Data
The XPS was utilized to determine the composition of the surface layers formed on the particles that reacted at higher acid concentrations. The surface composition obtained for the non-treated and HCl-treated PR was different from the bulk solution compositions. For the acid-treated and water-washed sample surface, the Ca/P ratio decreased compared to the unreacted particles (Table 2). Considerably lower Ca/F and P/F ratios were found in the final bulk solution. This may be attributable to the preferential accumulation of F and some quantities of Ca at the surface of the treated particle.
Table 2.
Ca/P ratio on the surface before and after acid treatment and in bulk solution.
The elements released into the solution at the different stages of the process were not in the same proportions. The ratios of dissolved Ca: P, Ca: F, and P: F were slightly higher at the beginning of the dissolution of PR. This is in accordance with the prediction made by Dorozhkin [57], who stated that the chemistry of apatite dissolution appears to be incongruent (non-stoichiometric) at the atomic (ionic) level or due to the preferential dissolution of carbonate apatite. Fluorcarbonate apatite releases calcium more easily, resulting in non-stoichiometric dissolution. The Ca/F and P/F ratios of the bulk solution increased at the end of the process and rose with the concentration of the acid. This indicated that a definite amount of F was re-adsorbed or precipitated on the insoluble part.
The scans of the P 2p, Ca 2p, and F 1s signals and of the respective binding energies for the acid-treated samples were collected and are summarized in Table 3. All the curves were fitted with the Gaussian distribution using a least-squares iteration.
Table 3.
Binding energies (eV) of XPS peaks of PR treated in HCl and washed with water.
The XPS spectra shown in Figure 11 confirm the presence of calcium fluoride. The doublet at B.E. 346.9 and 350.5 eV in the Ca2p region is assigned to fluorine-bonded calcium. As mentioned above, the F1s region is present only as one peak, which is assigned to fluorine in calcium fluoride. The calculated composition from the XPS spectra gives a stoichiometry of CaF1.8.
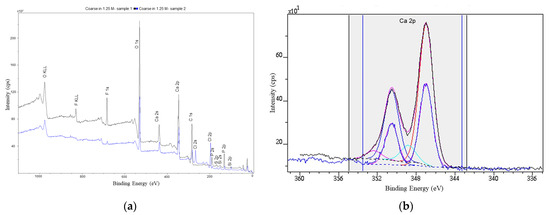
Figure 11.
XPS spectra: (a) PR treated in 1.24M hydrochloric acid: washed with water; (b) Ca2p region: solid lines Ca2p3/2 and Ca2p1/2 of CaF2.
3.6. Dissolution Kinetics—Models and Mechanism
The leaching of P from PR is a typical solid–liquid reaction. The rate of the solid–liquid reaction can be controlled by several different mechanisms [39]. These models are not all valid in every situation and for all stages of dissolution.
Three distinct stages were identified from the plots of P solubility versus time (Figure 4); this may be attributable to the fact that there were different rate-controlling mechanisms. The possibility of the existence of three stages was also noticed in the P solubility versus the pH curves of the coarse sample (Figure 7a). The SCM model and three corresponding integral equations [39] were used to clarify the rate-controlling mechanisms of the PR dissolution.
Based on the different descriptions in the literature, it can be assumed that the particle is spherical and that the reaction causes etching. According to Levenspiel [39], the reaction proceeds until the unreacted particle is semi- or fully consumed and reproduces a reaction “product”. As mentioned earlier, some amount of desorbed F, Ca, and phosphate from the solution can be adsorbed back onto the apatite surface and can lead to a resistance to solubility. Then, the acid diffuses through this layer; it has been suggested that this is due to the diffusion of H+ through this product layer (intra-particle diffusion).
In view of the possible dissolution steps, the rate-limiting processes were determined by considering three phenomena: (1) the chemical reaction at the particle surface; (2) the diffusion of the reactants or products into the particle through the possible solid product layer on the particle; and (3) the interfacial transfer and diffusion through the product layer [58]. Any of these could be rate-controlling mechanisms at some stage during the overall dissolution process, and they can all vary depending on the extent of the reaction.
Model 1: Chemical reaction limitation
1 − (1 − x) (1/3) = k1 t
Model 2: Intra-particle diffusion through the residue or product layer
1 − 3(1 − x) (2/3) +2(1 − x) = k2 t
Model 3: Interfacial transfer and diffusion through the product layer
1/3 ln (1 − x) + ((1 − x) (−1/3) − 1) = k3 t
Here, x is the P leaching efficiency; k1 is the apparent rate constant for chemical reaction; k2 is the apparent rate constant for diffusion; k3 is the apparent rate constant for interfacial transfer and diffusion; and t is the time in minutes.
The data obtained within 2–60 min in the leaching experiments were analyzed utilizing models 1–3. The appropriate mechanism validity intervals were identified by the best linear fit or estimated by the highest value of the regression coefficient R2. The rate constants were determined from the slope of the fitting line by plotting the left side of the equation vs. the reaction time using the P leaching efficiency from the coarse and fine sample dissolution experiments. The rate constants and respective R2 values calculated for the coarse fraction are listed in Table 4.
Table 4.
Time periods of the validity of different models and the respective apparent rate constants for the coarse sample.
However, as particle morphology varies during the leaching process, it influences the significance of the chemical reaction, intra-particle diffusion, and interfacial transfer. This can be adapted to the PR dissolution in such a way that the initial stage is governed by the chemical reaction while the other mechanisms do not exist, as the reaction proceeds mainly on the surface and there is no product layer. However, the other mechanisms can become progressively dominating as the particle morphology changes.
It was found that, for different reaction stages, different models were valid according to the regression coefficient and that a single reaction mechanism controlled the reaction rate during a certain time period. A graphical representation of the analysis is shown in Appendix A.
The dissolution of the coarse particles of PR is controlled by the chemical reaction that occurs between 2 and 8 min in 0.5 to 1 M HCl. At higher acid concentrations, this time period shortens, and at the concentration of 1.48 M, from the first measurable moment, the limiting process is already intra-particle diffusion. The last time interval from 20 to 25 up to 60 min is attributable to interfacial transfer and diffusion through the product layer. The insoluble residue is formed by the insoluble impurities (quartz and pyrite), whereas the solid product at HCl concentrations above 1 M was proven to be CaF2.
The SCM model gave a different result for the dissolution process of the fine sample. It was not possible to detect a single reaction mechanism for a certain stage of dissolution, but multiple mechanisms can control the reaction rate at the same time due to the rapid reaction (Appendix B).
4. Conclusions
The specifics and kinetics of Estonian PR dissolution in HCl were studied based on the measurements of the release of P and F into the solution, together with simultaneous pH monitoring. The impact of the particle size and acid concentration on the process was determined.
The results showed that the particle size and acid concentration affect the P leaching efficiency, rate, and specifics. Notably, the fine samples reacted more quickly and almost reached the maximum leaching efficiency of 94%–100% within 50–60 min. The coarse samples reached 82%–99% P solubility within 60 min.
For the first time, the pH value was continually monitored during the PR dissolution process. The pH variation revealed that the time required to achieve an apparent steady-state pH was reduced with an increasing acid concentration and decreasing particle size.
The analysis of the surface composition of the reacted particle proved that there was precipitation of CaF2 on the surface. The CaF2 precipitation was clearly fixed in the HCl solutions with concentrations starting from 1 M, and the phenomenon was more intensive at higher acid concentrations. The formation of CaF2 in the more concentrated HCl solutions caused a simultaneous drop in the pH and F concentration in the bulk solution.
It was shown that the dissolution was incongruent, and surface analysis confirmed the formation of etch pits, which grew during the dissolution process and increased in surface area. However, the dissolution process was accompanied by complex shifts in ionization and the solubility equilibrium, as shown by the mutual variations in the P leaching efficiency and pH.
The application of the shrinking core model revealed that P dissolution was controlled by two or three different reaction mechanisms, depending on the extent of the process. Under the experimental conditions used, dissolution was controlled by a combination of chemical reaction, diffusion or interfacial transfer, and diffusion sequentially (for coarse particles) or simultaneously (for the fine fraction).
Author Contributions
Conceptualization, R.S.A., K.T. and A.T.; methodology, R.S.A., K.T. and T.K.; validation, R.S.A., K.T. and T.K.; formal analysis, R.S.A.; investigation, R.S.A., K.T. and T.K.; writing—original draft preparation, R.S.A. and K.T.; writing—review and editing, R.S.A., K.T. and A.T.; visualization, R.S.A. and K.T.; supervision, A.T. project administration, A.T.; funding acquisition, A.T. All authors have read and agreed to the published version of the manuscript.
Funding
This study was supported by Estonian Research Council via project ResTA23 and grant PRG1779 and funded by the Ministry of Education and Research through the Centre of Excellence in Circular Economy for Strategic Mineral and Carbon Resources (01.01.2024–31.12.2030, TK228).
Data Availability Statement
Data are contained within the article.
Acknowledgments
We would like to thank Marve Einard, Valdek Mikli, Mati Danilson, and Toivo Kallaste for the technical support they provided.
Conflicts of Interest
The authors declare no conflicts of interest.
Appendix A
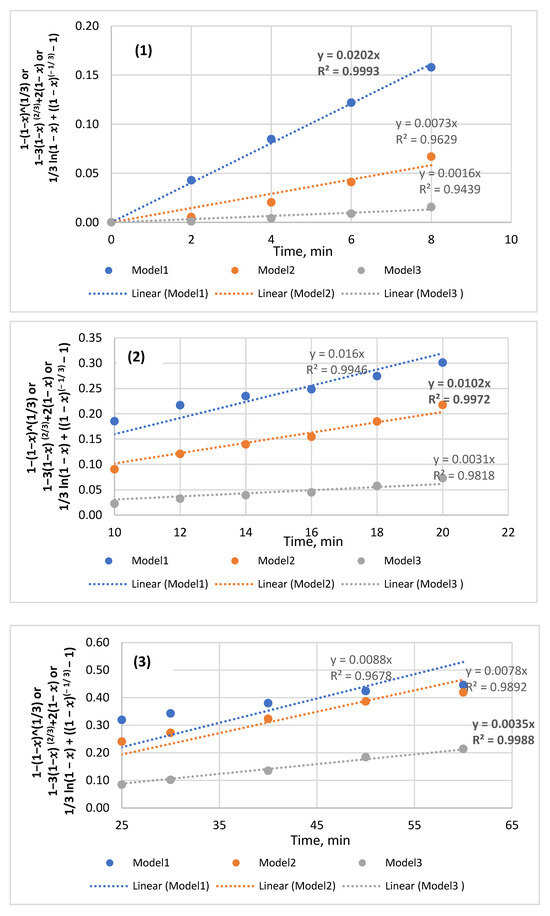
Figure A1.
P solubility data of coarse sample reacted with 0.5M HCl and manipulated using all three models to identify the best fitted line for the region: (1) from 2 to 8 min; (2) from 10 to 20 min; (3) from 25 to 60 min.
Appendix B
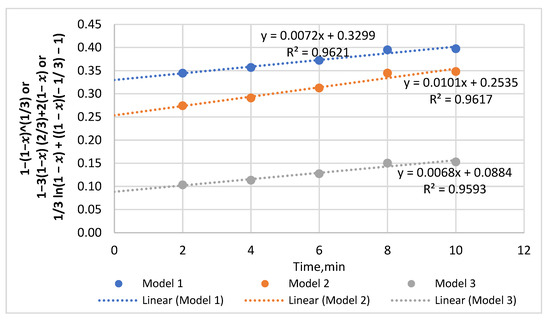
Figure A2.
The P solubility data of fine sample reacted with 0.5 M HCl from 2 to 10 min and manipulated using all three models to identify the best fitted line for the region.
References
- Bobba, S.; Carrara, S.; Huisman, J.; Mathieux, F.; Pavel, C.; European Commission. Critical Raw Materials for Strategic Technologies and Sectors in the EU: A Foresight Study; Publications Office of the European Union: Luxembourg, 2020. [Google Scholar] [CrossRef]
- Joosu, L.; Vind, J.; Lumiste, K.; Polikarpus, M.; Tarros, S.; Pärn, J.; Kansi, K.; Tamm, K.; Bauert, H.; Kaasik, T.; et al. Exploration of Phosphorite and Black Shale in North-Eastern Estonia; Geological Survey of Estonia (EGT): Rakvere, Estonia, 2023. [Google Scholar]
- Raukas, A.; Teedumäe, A. (Eds.) Geology and Mineral Resources of Estonia; Estonian Academy Publishers: Tallinn, Estonia, 1997. [Google Scholar]
- Wu, S.; Wang, L.; Zhang, P.; El-Shall, H.; Moudgil, B.; Huang, X.; Zhao, L.; Zhang, L.; Feng, Z. Simultaneous recovery of rare earths and uranium from wet process phosphoric acid using solvent extraction with D2EHPA. Hydrometallurgy 2018, 175, 109–116. [Google Scholar] [CrossRef]
- Wu, S.; Zhao, L.; Wang, L.; Huang, X.; Zhang, Y.; Feng, Z.; Cui, D. Simultaneous recovery of rare earth elements and phosphorus from phosphate rock by phosphoric acid leaching and selective precipitation: Towards green process. J. Rare Earths 2019, 37, 652–658. [Google Scholar] [CrossRef]
- Wu, S.; Wang, L.; Zhao, L.; Zhang, P.; El-Shall, H.; Moudgil, B.; Huang, X.; Zhang, L. Recovery of rare earth elements from phosphate rock by hydrometallurgical processes—A critical review. Chem. Eng. J. 2018, 335, 774–800. [Google Scholar] [CrossRef]
- Hermann, L.; Kraus, F.; Hermann, R. Phosphorus processing-potentials for higher efficiency. Sustainability 2018, 10, 1482. [Google Scholar] [CrossRef]
- Banihashemi, S.R.; Taheri, B.; Razavian, S.M.; Soltani, F. Selective Nitric Acid Leaching of Rare-Earth Elements from Calcium and Phosphate in Fluorapatite Concentrate. JOM 2019, 71, 4578–4587. [Google Scholar] [CrossRef]
- Bandara, A.M.T.S.; Senanayake, G. Leachability of rare-earth, calcium and minor metal ions from natural Fluorapatite in perchloric, hydrochloric, nitric and phosphoric acid solutions: Effect of proton activity and anion participation. Hydrometallurgy 2015, 153, 179–189. [Google Scholar] [CrossRef]
- Stone, K.; Bandara, A.M.T.S.; Senanayake, G.; Jayasekera, S. Processing of rare earth phosphate concentrates: A comparative study of pre-leaching with perchloric, hydrochloric, nitric and phosphoric acids and deportment of minor/major elements. Hydrometallurgy 2016, 163, 137–147. [Google Scholar] [CrossRef]
- Bandara, A.M.T.S.; Senanayake, G. Dissolution of calcium, phosphate, fluoride and rare earth elements (REEs) from a disc of natural fluorapatite mineral (FAP) in perchloric, hydrochloric, nitric, sulphuric and phosphoric acid solutions: A kinetic model and comparative batch leaching of major and minor elements from FAP and RE-FAP concentrate. Hydrometallurgy 2019, 184, 218–236. [Google Scholar] [CrossRef]
- Taha, Y.; Elghali, A.; Hakkou, R.; Benzaazoua, M. Towards zero solid waste in the sedimentary phosphate industry: Challenges and opportunities. Minerals 2021, 11, 1250. [Google Scholar] [CrossRef]
- Baniel, A.; Blumberg, R. Process for the Preparation of Phosphoric Acid. U.S. Patent WO 2,880,063, 31 March 1959. [Google Scholar]
- Long, R.S.; Ellis, D.A. Preparation of Phosphoric Acid. U.S. Patent WO 3,072,461, 29 July 1960. Available online: https://patentimages.storage.googleapis.com/48/fc/e3/81d33d394b3b6d/US3072461.pdf> (accessed on 23 August 2023).
- Baniel, A.M.; St, H.; Blumberg, R.; St, V.; Carmel, M.; Alon, A. Process for Preparation of Substantially Pure Phosphoric Acid; 1967. Available online: https://patents.google.com/patent/US3338674A/en (accessed on 23 August 2023).
- Sandström, Å.; Fredriksson, A. Apatite for extraction: Leaching of Kiirunavaara apatite for simultaneous production of fertilizers and REE. In XXVI International Mineral Processing Congress: IMPC 2012; The Indian Institute of Metals: New Delhi, India, 2012; pp. 4707–4714. [Google Scholar]
- Kim, R.; Cho, H.; Han, K.N.; Kim, K.; Mun, M. Optimization of acid leaching of rare-earth elements from mongolian apatite-based ore. Minerals 2016, 6, 63. [Google Scholar] [CrossRef]
- Amine, M.; Asafar, F.; Bilali, L.; Nadifiyine, M. Hydrochloric Acid Leaching Study of Rare Earth Elements from Moroccan Phosphate. J. Chem. 2019, 2019, 4675276. [Google Scholar] [CrossRef]
- Abu-Eishah, S.I.; Abu-Jabal, N.M. Parametric study on the production of phosphoric acid by the dihydrate process. Chem. Eng. J. 2001, 81, 231–250. [Google Scholar] [CrossRef]
- Dorozhkin, S.V. Dissolution Kinetics of Single Fluoroapatite Crystals in Phosphoric Acid Solution under the Conditions of the Wet-Process Phosphoric Acid Production. J. Prakt. Chem. 1996, 338, 620–626. [Google Scholar] [CrossRef]
- Habashi, F.; Awadalla, F.T.; Yao, X.-B. The Hydrochloric Acid Route for Phosphate Rock. J. Chern. Technol. Biorechnol. 1987, 38, 115–126. [Google Scholar] [CrossRef]
- Han, K.N. Effect of Anions on the Solubility of Rare Earth Element-Bearing Minerals in Acids. Min. Metall. Explor. 2019, 36, 215–225. [Google Scholar] [CrossRef]
- Tõnsuaadu, K.; Kallas, J.; Kuusik, R.; Hacialioglu-Erlenheim, G.; Trikkel, A. A new perspective on fluorapatite dissolution in hydrochloric acid: Thermodynamic calculations and experimental study. Inorganics 2021, 9, 65. [Google Scholar] [CrossRef]
- Shlewit, H. Treatment of phosphate rocks with hydrochloric acid. J. Radioanal. Nucl. Chem. 2011, 287, 49–54. [Google Scholar] [CrossRef]
- Colton, E. Fluosilicic acid. J. Chem. Educ. 1958, 35, 562–563. [Google Scholar] [CrossRef]
- Zendah, H.; Khattech, I.; Jemal, M. Synthesis, characterization, and thermochemistry of acid attack of B type carbonate fluorapatites. J. Therm. Anal. Calorim. 2012, 109, 855–861. [Google Scholar] [CrossRef]
- Soltani, F.; Abdollahy, M.; Petersen, J.; Ram, R.; Javad Koleini, S.M.; Moradkhani, D. Leaching and recovery of phosphate and rare earth elements from an iron-rich fluorapatite concentrate: Part II: Selective leaching of calcium and phosphate and acid baking of the residue. Hydrometallurgy 2019, 184, 29–38. [Google Scholar] [CrossRef]
- Bengtsson, Å.; Sjöberg, S. Surface complexation and proton-promoted dissolution in aqueous apatite systems. Pure Appl. Chem. 2009, 81, 1569–1584. [Google Scholar] [CrossRef]
- Nath Misra, D. Interaction of Citric or Hydrochloric Acid with Calcium Fluorapatite: Precipitation of Calcium Fluoride. J. Colloid Interface Sci. 1999, 220, 387–391. [Google Scholar] [CrossRef]
- Dorozhkin, S.V. Dissolution mechanism of calcium apatites in acids: A review of literature. World J. Methodol. 2012, 2, 1. [Google Scholar] [CrossRef] [PubMed]
- Elliott, J.C. Structure and Chemistry of the Apatites and Other Calcium Orthophosphates; Elsevier: Amsterdam, The Netherlands, 1994; p. 387. [Google Scholar]
- Becker, P. Phosphates and phosphoric acid: Raw materials technology and economics of the wet process. In Fertilizer Science and Technology Series; Marcel Dekker: New York, NY, USA, 1989; Volume 6, p. 760. [Google Scholar]
- Hocking, M.B. Modern Chemical Technology and Emission Control; Springer: Berlin/Heidelberg, Germany, 1985. [Google Scholar] [CrossRef]
- Lachkar-Zamouri, O.; Brahim, K.; Bennour, F.; Khattech, I. Dissolution of Tunisian phosphate ore by a mixture of sulfuric and phosphoric acid: Kinetics study by means of differential reaction calorimetry. J. Min. Metall. Sect. B Metall. 2019, 55, 9–19. [Google Scholar] [CrossRef]
- Li, Z.; Xie, Z.; Deng, J.; He, D.; Zhao, H.; Liang, H. Leaching kinetics of rare earth elements in phosphoric acid from phosphate rock. Metals 2021, 11, 239. [Google Scholar] [CrossRef]
- Roshdy, O.E.; Haggag, E.A.; Masoud, A.M.; Bertau, M.; Haneklaus, N.; Pavón, S.; Hussein, A.E.; Khawassek, Y.M.; Taha, M.H. Leaching of rare earths from Abu Tartur (Egypt) phosphate rock with phosphoric acid. J. Mater. Cycles Waste Manag. 2023, 25, 501–517. [Google Scholar] [CrossRef]
- Aouadi-Selmi, H.; Antar, K.; Khattech, I. Thermochemical and kinetic study of the attack of fluorapatite by sulfuric acid solution at different temperatures. J. Therm. Anal. Calorim. 2020, 141, 807–817. [Google Scholar] [CrossRef]
- Sevim, F.; Saraç, H.; Kocakerim, M.M.; Yartaş, A. Dissolution kinetics of phosphate ore in H2SO4 solutions. Ind. Eng. Chem. Res. 2003, 42, 2052–2057. [Google Scholar] [CrossRef]
- Levenspiel, O. Chemical Reaction Engineering, 3rd ed.; John Wiley & Sons, Inc.: New York, NY, USA, 1999. [Google Scholar]
- Smith, A.N.; Posner, A.M.; Quirk, J.P. A Model Describing the Kinetics of Dissolution of Hydroxyapatite. J. Colloid Interface Sci. 1977, 62, 475–494. [Google Scholar] [CrossRef]
- Nie, D.; Xue, A.; Zhu, M.; Zhang, Y.; Cao, J. Separation and recovery of associated rare earths from the Zhijin phosphorite using hydrochloric acid. J. Rare Earths 2019, 37, 443–450. [Google Scholar] [CrossRef]
- Lv, L.; Zheng, D.; Tang, S.; Zhang, T.; Liu, W. Phosphate ore particles dissolution kinetics in hydrochloric acid based on a structure-related segmented model. Powder Technol. 2021, 392, 141–149. [Google Scholar] [CrossRef]
- Abd El-Mottaleb, M.; Cheira, M.F.; Gouda, G.A.H.; Ahmed, A.S.A. Leaching of Rare Earth Elements from Egyptian Western Desert Phosphate Rocks using HCl. Chem. Adv. Mater. 2016, 1, 33–40. [Google Scholar]
- Aly, H.F.; Ali, M.M.; Taha, M.H. Dissolution kinetics of Western Desert phosphate rocks, Abu Tartur with hydrochloric acid. Arab J. Nucl. Sci. Appl. 2013, 46, 1–16. [Google Scholar]
- Brahim, K.; Soussi-Baatout, A.; Khattech, I.; Jemal, M. Dissolution kinetics of fluorapatite in the hydrochloric acid solution. J. Therm. Anal. Calorim. 2017, 129, 701–708. [Google Scholar] [CrossRef]
- Calmanovici, C.E.; Gilot, B.; Laguérie, C. Mechanism and Kinetics for the Dissolution of Apatitic Materials in Acid Solutions. Braz. J. Chem. Eng. 1997, 14, 95–102. [Google Scholar] [CrossRef]
- Tõnsuaadu, K.; Kallas, J.; Kallaste, T.; Urtson, K.; Einard, M.; Martin, R.; Kuusik, R.; Trikkel, A. Estonian Phosphate Rock Dissolution in Hydrochloric Acid: Optimization of Acid Dosage and Concentration. Minerals 2023, 13, 578. [Google Scholar] [CrossRef]
- Gasser, P.; Haikel, Y.; Voegel, J.C.; Gramain, P. Surface reactions of hydroxyapatite in the presence of fluoride ions 2. Effects of calcium and phosphate in saturated solutions. Colloids Surf. A Physicochem. Eng. Asp. 1994, 88, 157–168. [Google Scholar] [CrossRef]
- Chaïrat, C.; Oelkers, E.H.; Schott, J.; Lartigue, J.E. Fluorapatite surface composition in aqueous solution deduced from potentiometric, electrokinetic, and solubility measurements, and spectroscopic observations. Geochim. Cosmochim. Acta 2007, 71, 5888–5900. [Google Scholar] [CrossRef]
- Tang, R.; Wang, L.; Orme, C.A.; Bonstein, T.; Bush, P.J.; Nancollas, G.H. Dissolution at the Nanoscale: Self-Preservation of Biominerals. Angew. Chem. 2004, 116, 2751–2755. [Google Scholar] [CrossRef]
- Tang, R.; Wang, L.; Naacollas, G.H. Size-effects in the dissolution of hydroxyapatite: An understanding of biological demineralization. J. Mater. Chem. 2004, 14, 2341–2346. [Google Scholar] [CrossRef]
- Thirioux, L.; Baillif, P.; Touray, J.C.; Ildefonse, J.P. Surface reactions during fluorapatite dissolution-recrystallization in acid media (hydrochloric and citric acids). Geochim. Et Cosmochmica Acta 1990, 54, 1969–1977. [Google Scholar] [CrossRef]
- Pearce, E.I.F. On the Dissolution of Hydroxyapatite in Acid Solutions. J. Dent. Res. 1988, 67, 1056–1058. [Google Scholar] [CrossRef] [PubMed]
- Tang, R.; Orme, C.A.; Nancollas, G.H. Dissolution of crystallites: Surface energetic control and size effects. ChemPhysChem 2004, 5, 688–696. [Google Scholar] [CrossRef] [PubMed]
- Dorozhkin, S.V. Acidic dissolution mechanism of natural fluorapatite II. Nanolevel of investigations. J. Cryst. Growth 1997, 182, 133–140. [Google Scholar] [CrossRef]
- Dorozhkin, S.V. Acidic dissolution mechanism of natural fluorapatite I. Milli-and microlevels of investigations. J. Cryst. Growth 1997, 182, 125–157. [Google Scholar] [CrossRef]
- Dorozhkin, S.V. Inorganic chemistry of the dissolution phenomenon: The dissolution mechanism of calcium apatites at the atomic (ionic) level. Comments Inorg. Chem. 1999, 20, 285–299. [Google Scholar] [CrossRef]
- Dickinson, C.F.; Heal, G.R. Solid-liquid diffusion controlled rate equations. Thermochim. Acta 1999, 340–341, 89–103. [Google Scholar] [CrossRef]
Disclaimer/Publisher’s Note: The statements, opinions and data contained in all publications are solely those of the individual author(s) and contributor(s) and not of MDPI and/or the editor(s). MDPI and/or the editor(s) disclaim responsibility for any injury to people or property resulting from any ideas, methods, instructions or products referred to in the content. |
© 2024 by the authors. Licensee MDPI, Basel, Switzerland. This article is an open access article distributed under the terms and conditions of the Creative Commons Attribution (CC BY) license (https://creativecommons.org/licenses/by/4.0/).