1. Introduction
There are three main types of flotation equipment used for coal and mineral flotation: mechanical agitation flotation machines, jet flotation machines, and flotation columns [
1,
2]. Compared to mechanically agitated flotation machines and flotation columns, the jet flotation machine has the advantages of not having a mechanical structure and instead having a relatively simple structure, high inflation in the jet chamber, and the ability to facilitate the precipitation of air in the form of microbubbles [
3,
4]. During its working process, it can precipitate a large number of tiny bubbles with an activation effect, which enhances the mineralization process of bubbles and is beneficial to the flotation of fine-grained coal slurry [
5]. The representative normal jet flotation machines include FJC flotation machines, Jameson flotation cells, and PNEUFLOT flotation machines. The FJC flotation machine has the advantages of high inflation strength and uniformity of inflation, but the system is relatively complicated, and the nozzles are easily clogged [
6,
7]. The advantages of the Jameson flotation machine include its facilitation of a wide range of separation sizes, low operating and maintenance costs, and high degree of automation [
8], but there are disadvantages, such as insufficient aeration, and its performance in coarse particle sorting is rather weak [
9]. With its fast flotation speed, large processing capacity, and high level of automation, the PNEUFLOT flotation machine [
10] has outstanding advantages, especially when processing easily separated coal. However, production practice shows that this machine’s effect is less satisfactory when separating coal that is difficult to float.
The self-oscillating jet is a new type of jet developed in recent years that can produce strong self-excited oscillations without an additional external driving mechanism. Its pressure field, velocity field, and density field all pulsate strongly with time, and there is a complex coherent interaction between these physical fields [
11,
12,
13]. The self-oscillating jet produces oscillation in the special fluid structure through self-excitation, modulating the continuous jet into an oscillating pulse jet, thus making full use of the water hammer effect and aggregation effect of the high-frequency impact of the liquid beads and avoiding the water cushion effect of the continuous jet impact. The water cushion phenomenon of continuous jet impact is avoided, which will greatly improve the energy utilization rate of the jet [
14]. Meanwhile, due to the vortex ring structure of the self-oscillating jet, an effective cavitation jet at a high cavitation number can be formed, and then, the shock wave and microjet generated during the bubble collapse process can enhance the striking erosion effect [
15,
16]. For the flotation process, these characteristics can strengthen the gas–liquid mixing of the jet, produce more microbubbles, and modify the surface of mineral particles, which is conducive to flotation.
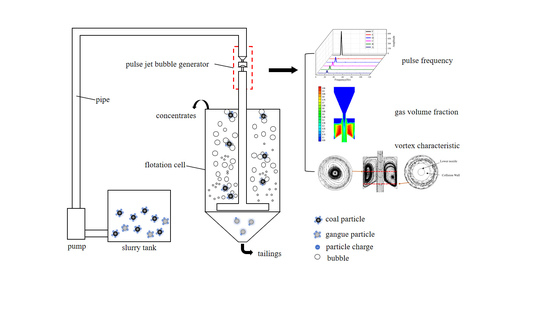
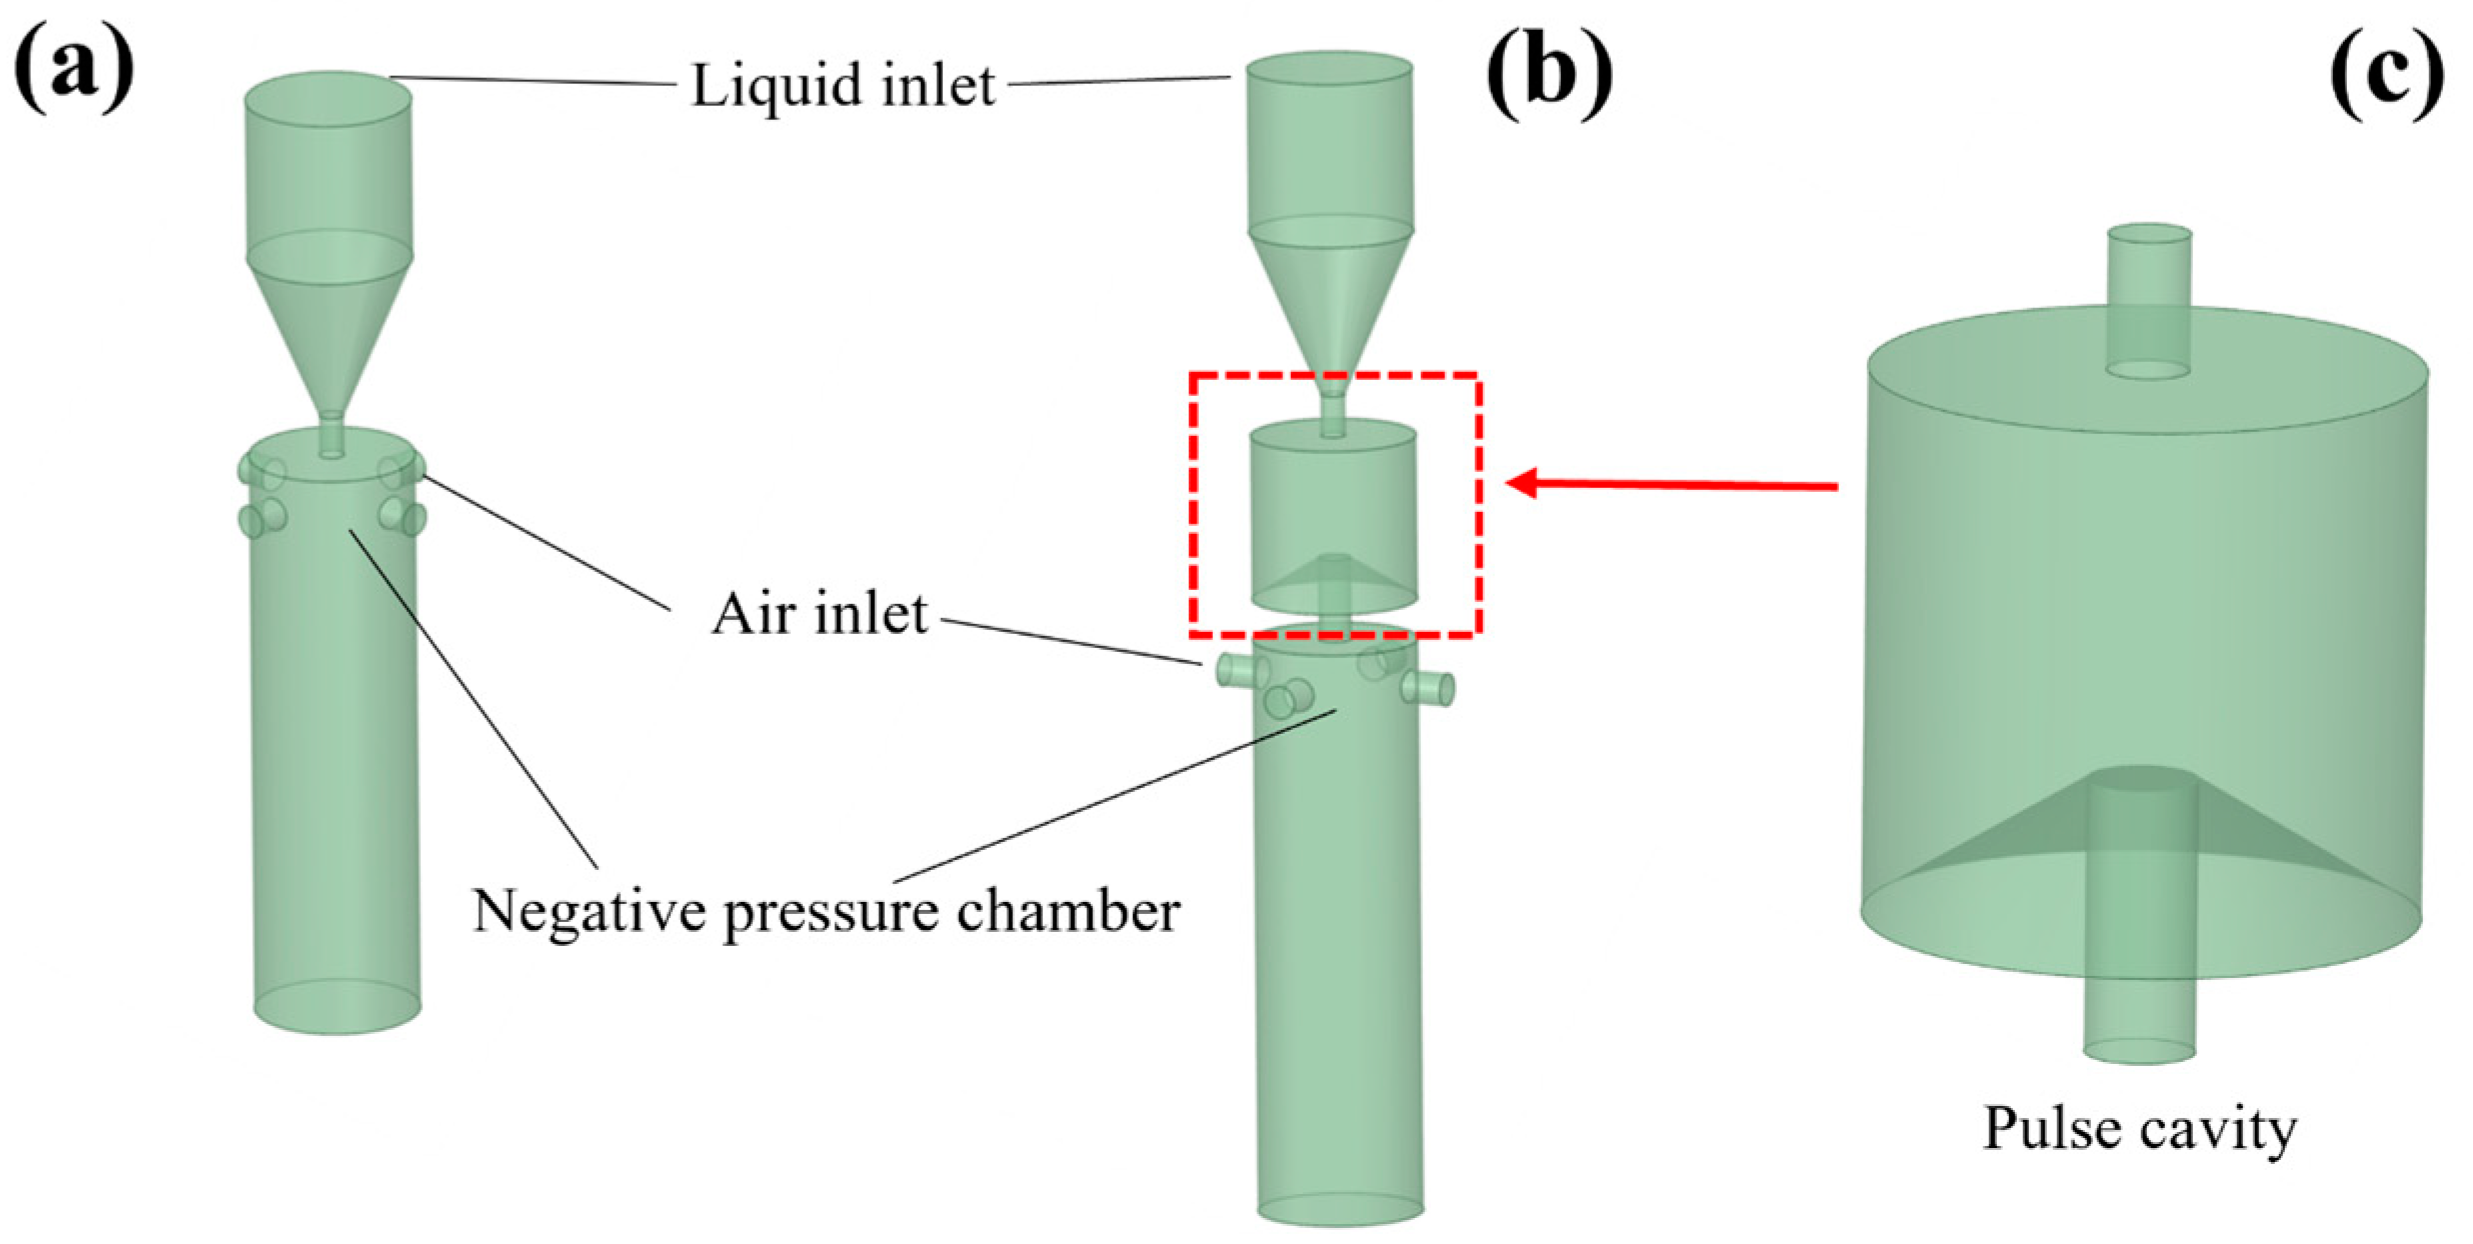
Based on the above theory, a pulse jet flotation machine (PJFM) was developed by adding a pulse cavity structure to the common jet flotation machine [
17]. We used the pulse jet to create favorable conditions for the flotation process, strengthen pulp mixing and particle surface modification and produce microbubbles so as to improve flotation efficiency. A model of the PJFM is shown in
Figure 1a. During operation, the pump moves the slurry under a specific pressure to the pipe, feeding it straight into the pulse jet bubble generator, which creates a high-speed slurry jet through the top nozzle, as shown in
Figure 1b. The high-speed slurry flow and the unique cavity structure of the jet within the pulse cavity create a periodic annular air vortex, resulting in uneven air pressure inside the cavity. This periodic blocking effect causes the high-speed slurry flow to form a pulse jet, which is then expelled through the lower nozzle.
Figure 1 shows the air-containing pulp jet entering the throat, which produces collision-free mineralization due to the special structure of the throat. The pulp is then evenly fed into the flotation tank by the pulp distributor to achieve static separation and complete the flotation process.
The use of a self-excited oscillatory structure has been investigated in other domains [
18], but its impact on the flotation process has not been studied. This study investigated the unique flow field characteristics of the PJFM through CFD simulation to theoretically reveal its performance advantages. Additionally, the effect of the pulse jet on flotation is evaluated by testing the aeration performance of the PJFM. The changes in surface electrical properties and floatability of the coal to be sorted under pulse jet conditions provide a foundation for the large-scale design and industrial application of the flotation machine.
3. Numerical Calculation Results and Analysis
3.1. Study of the Pulse Jet Oscillation Characteristics
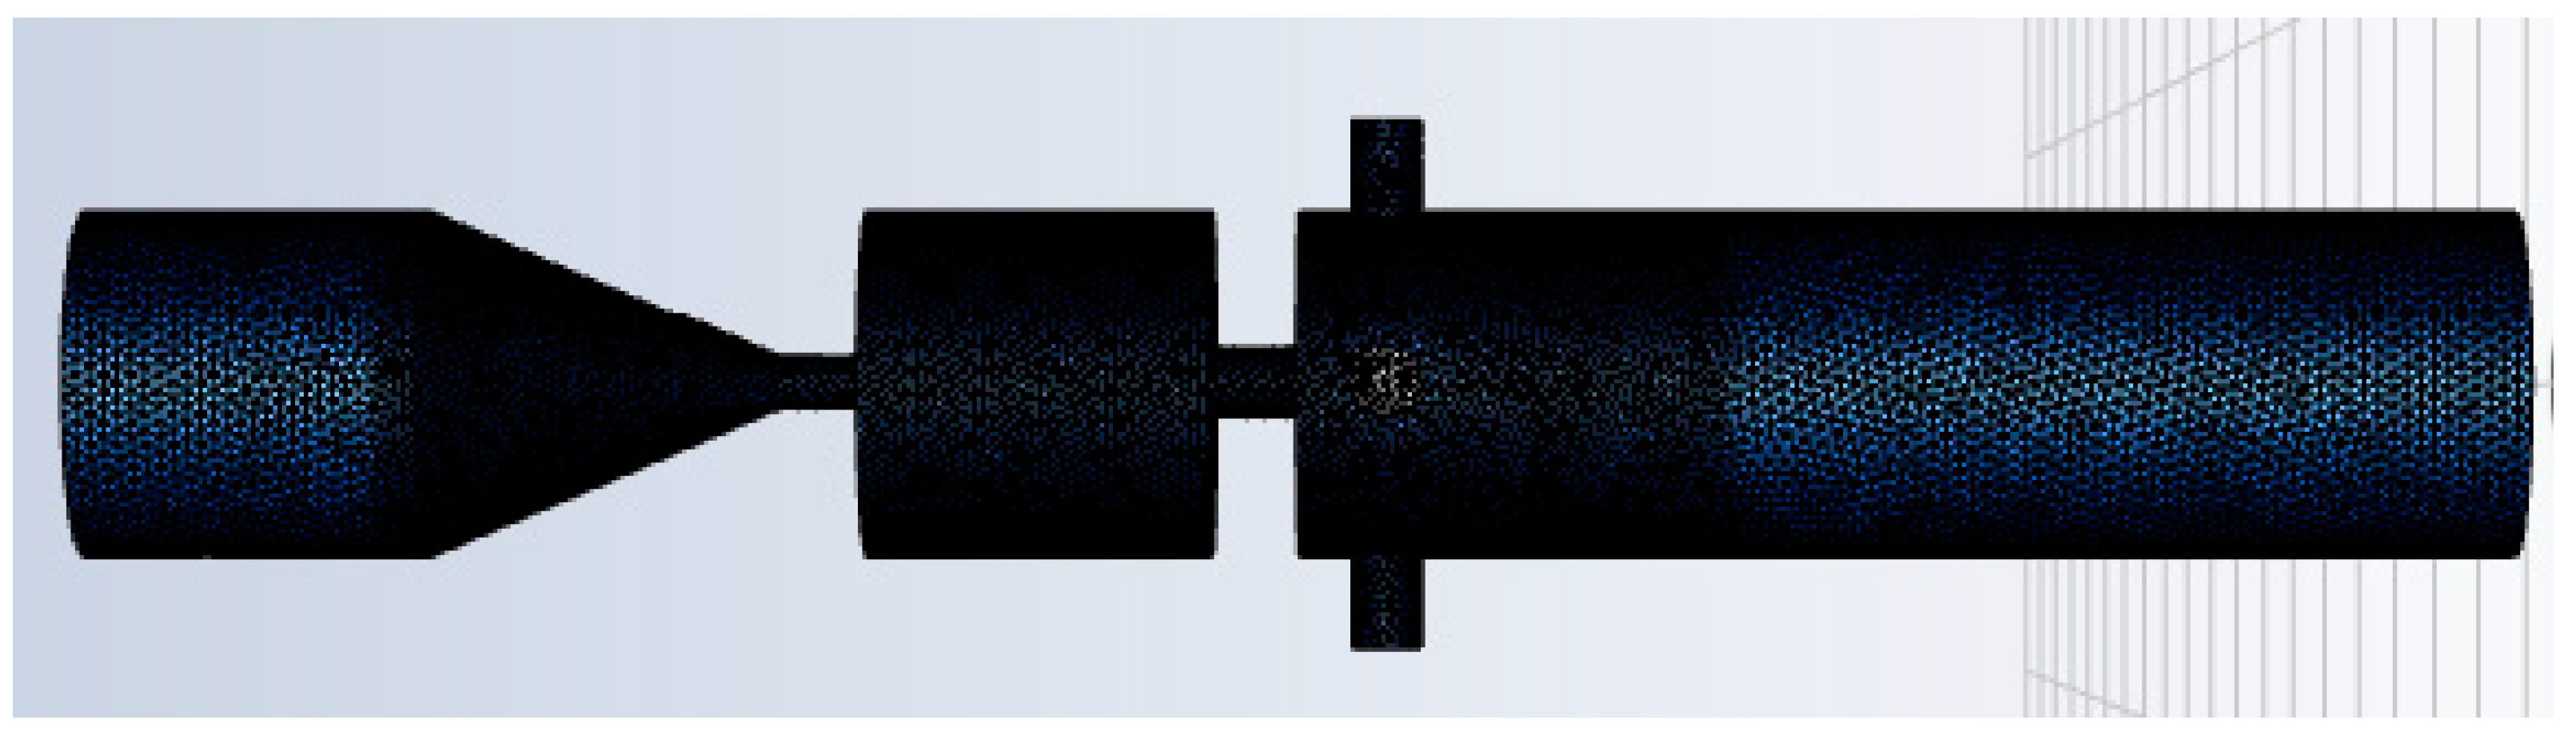
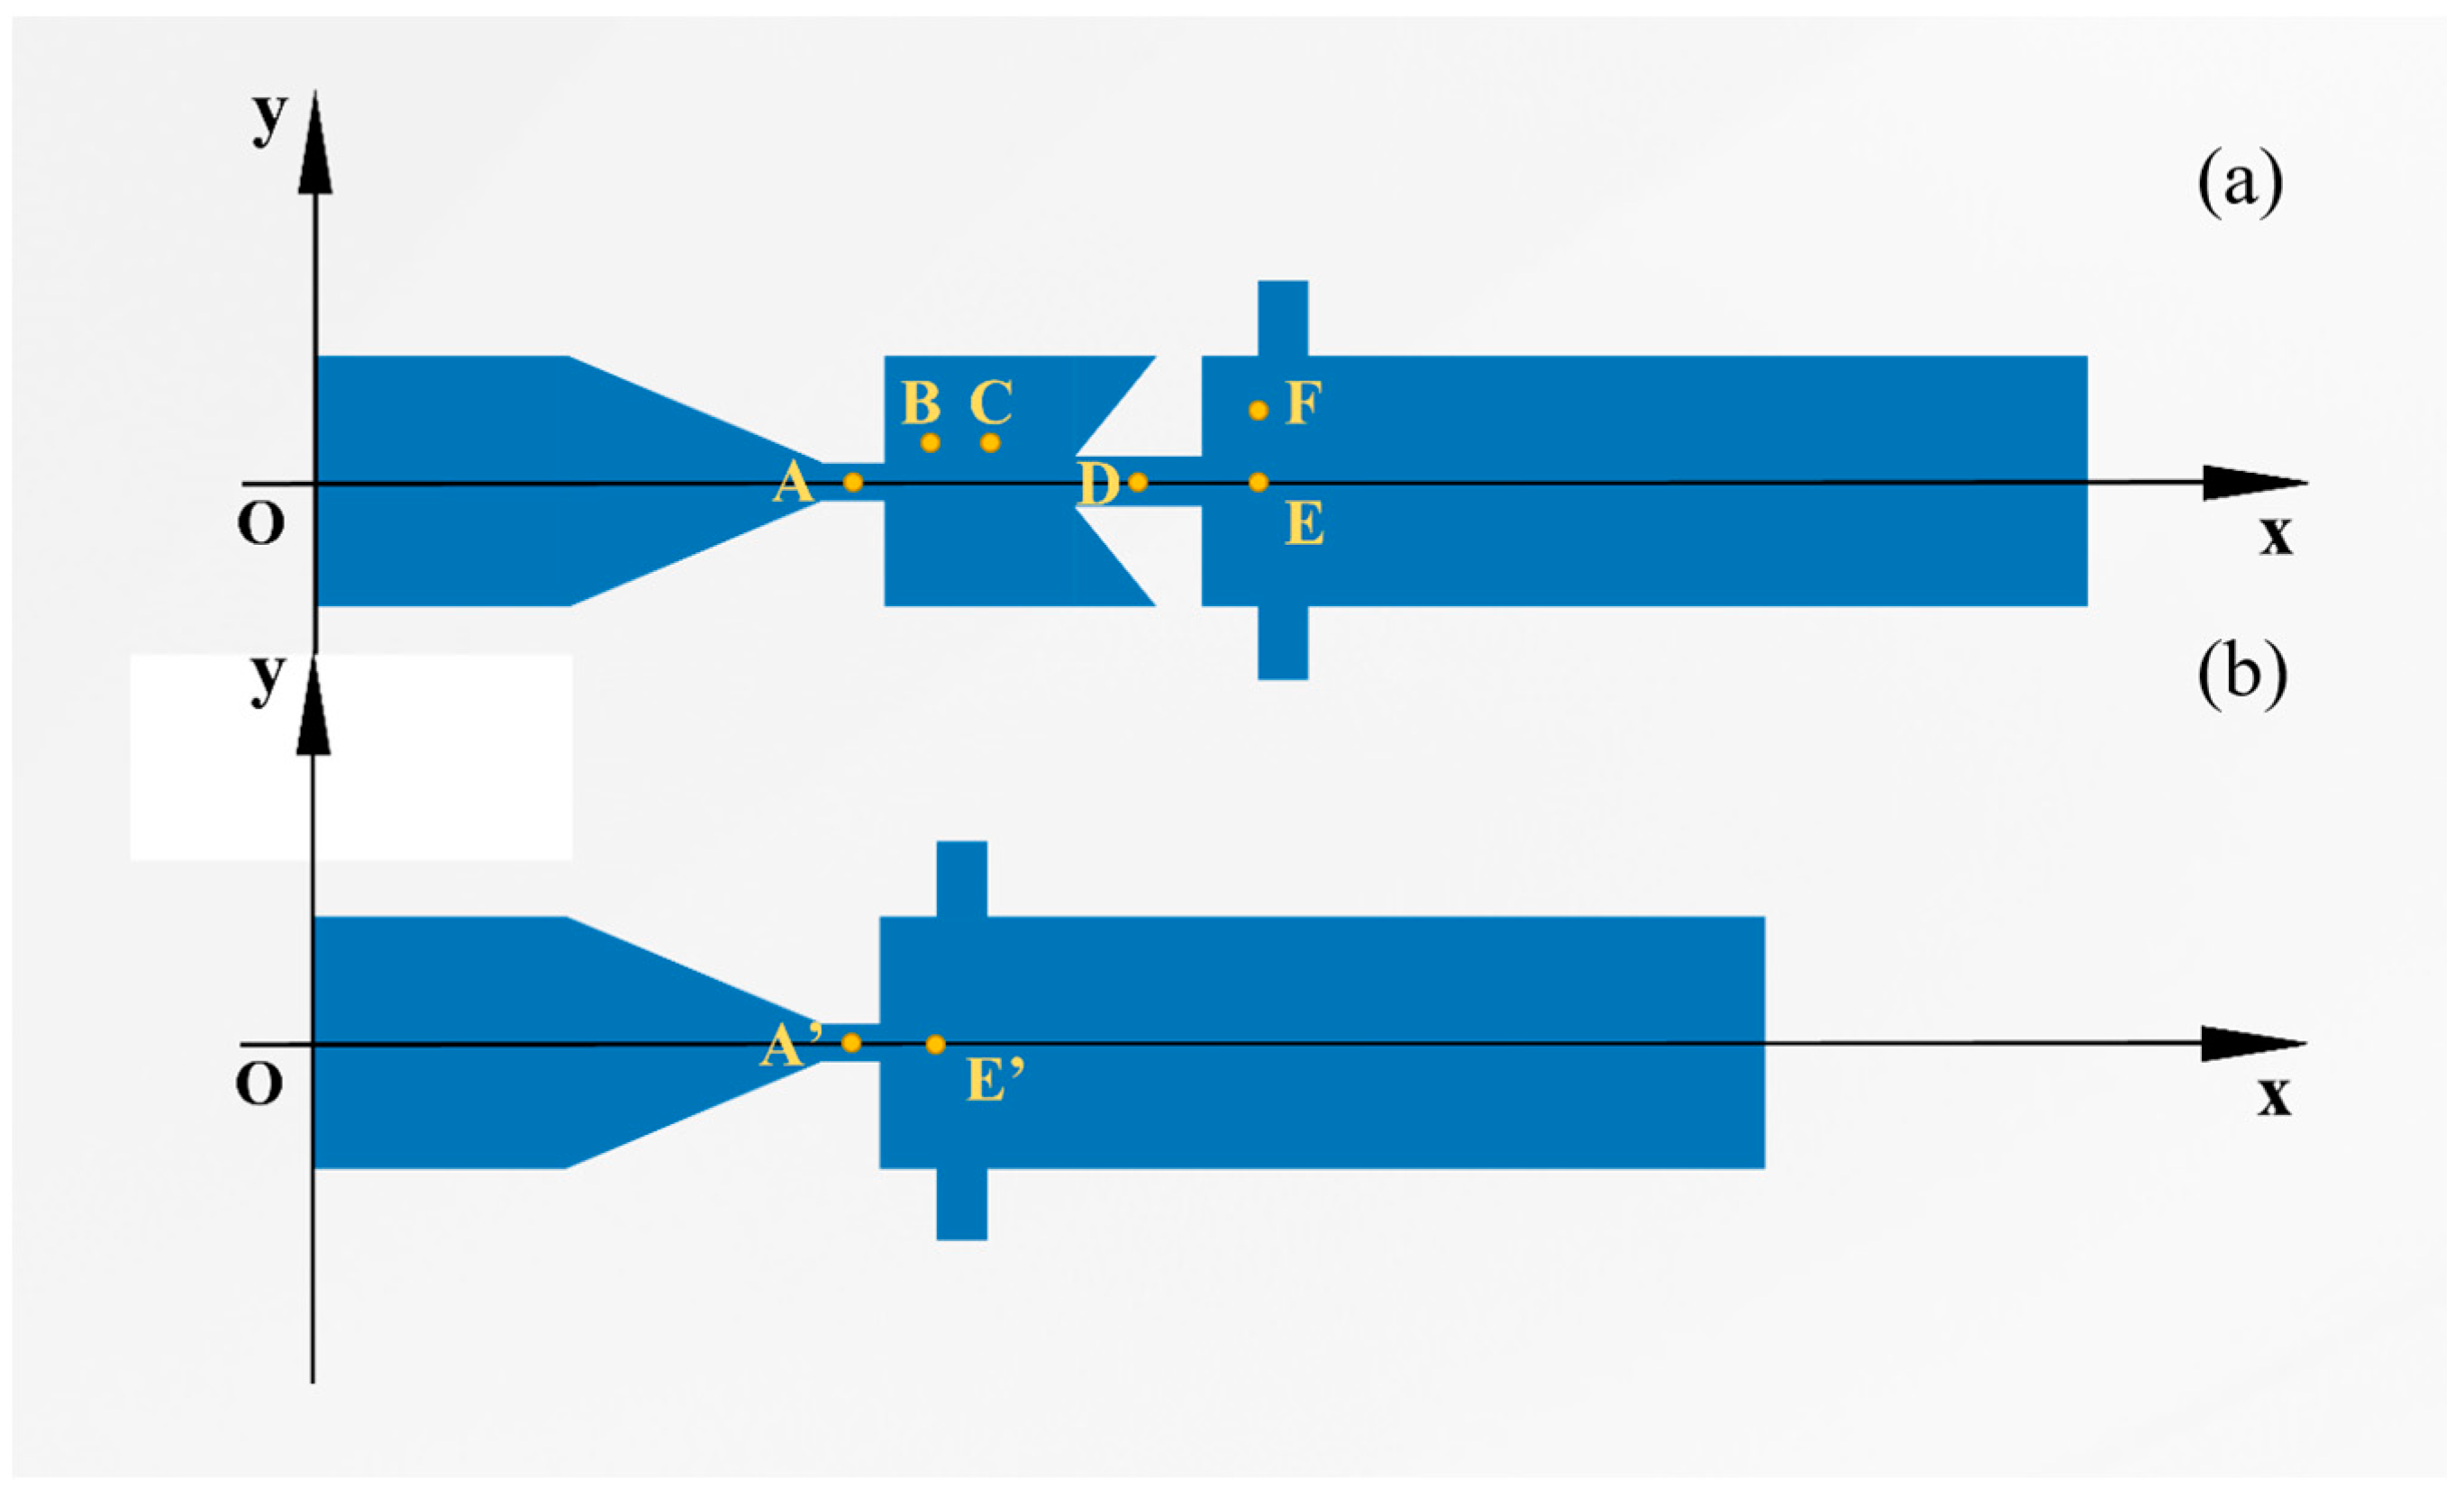
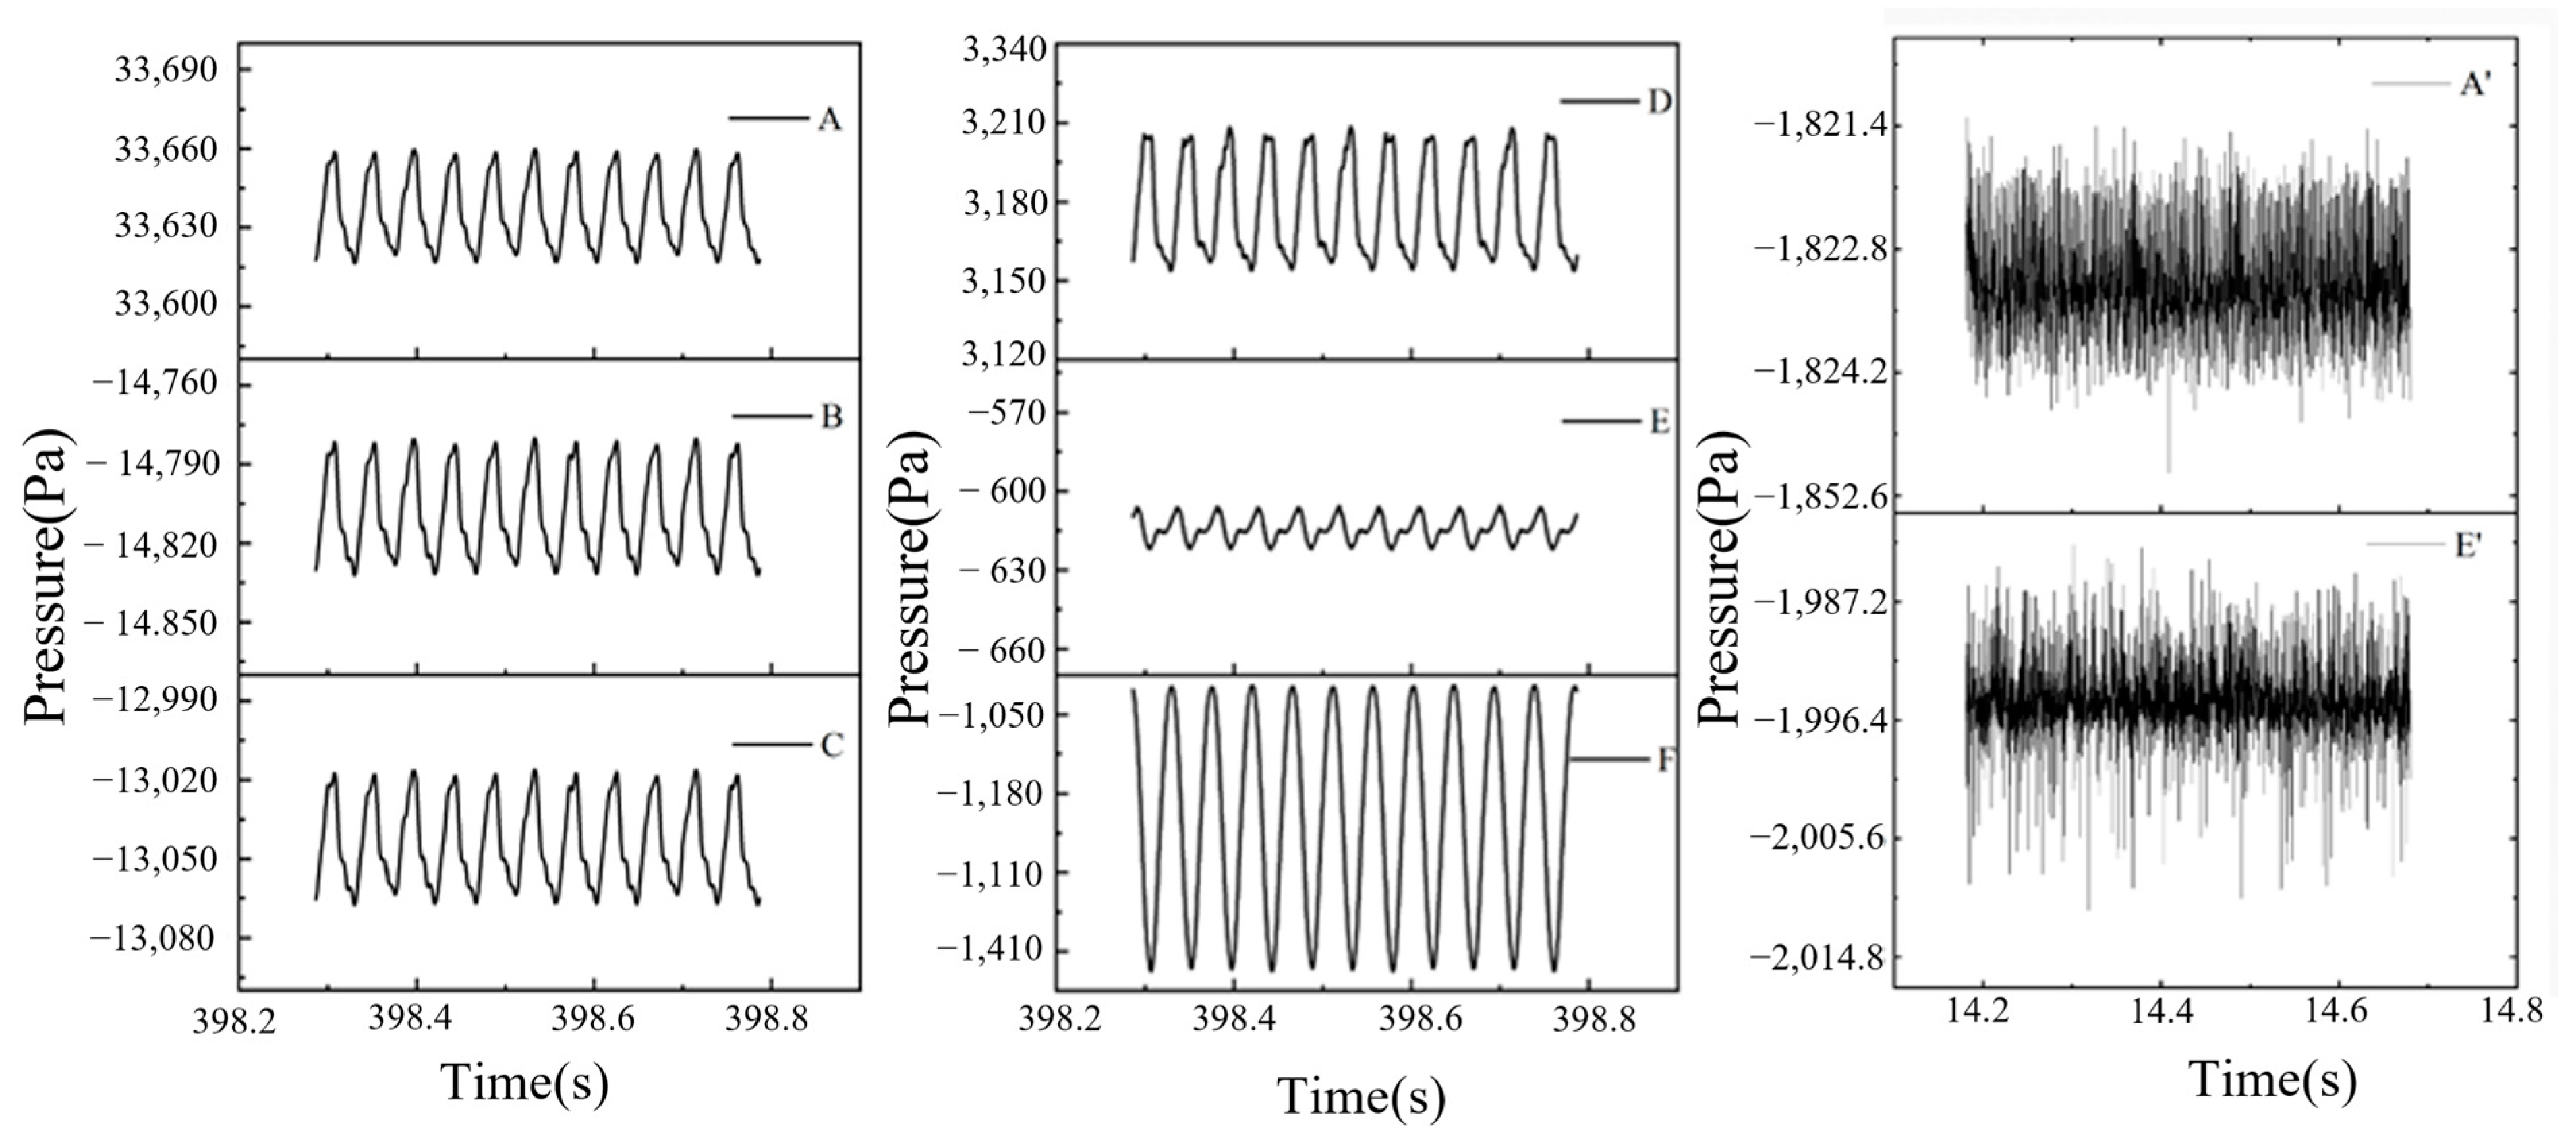
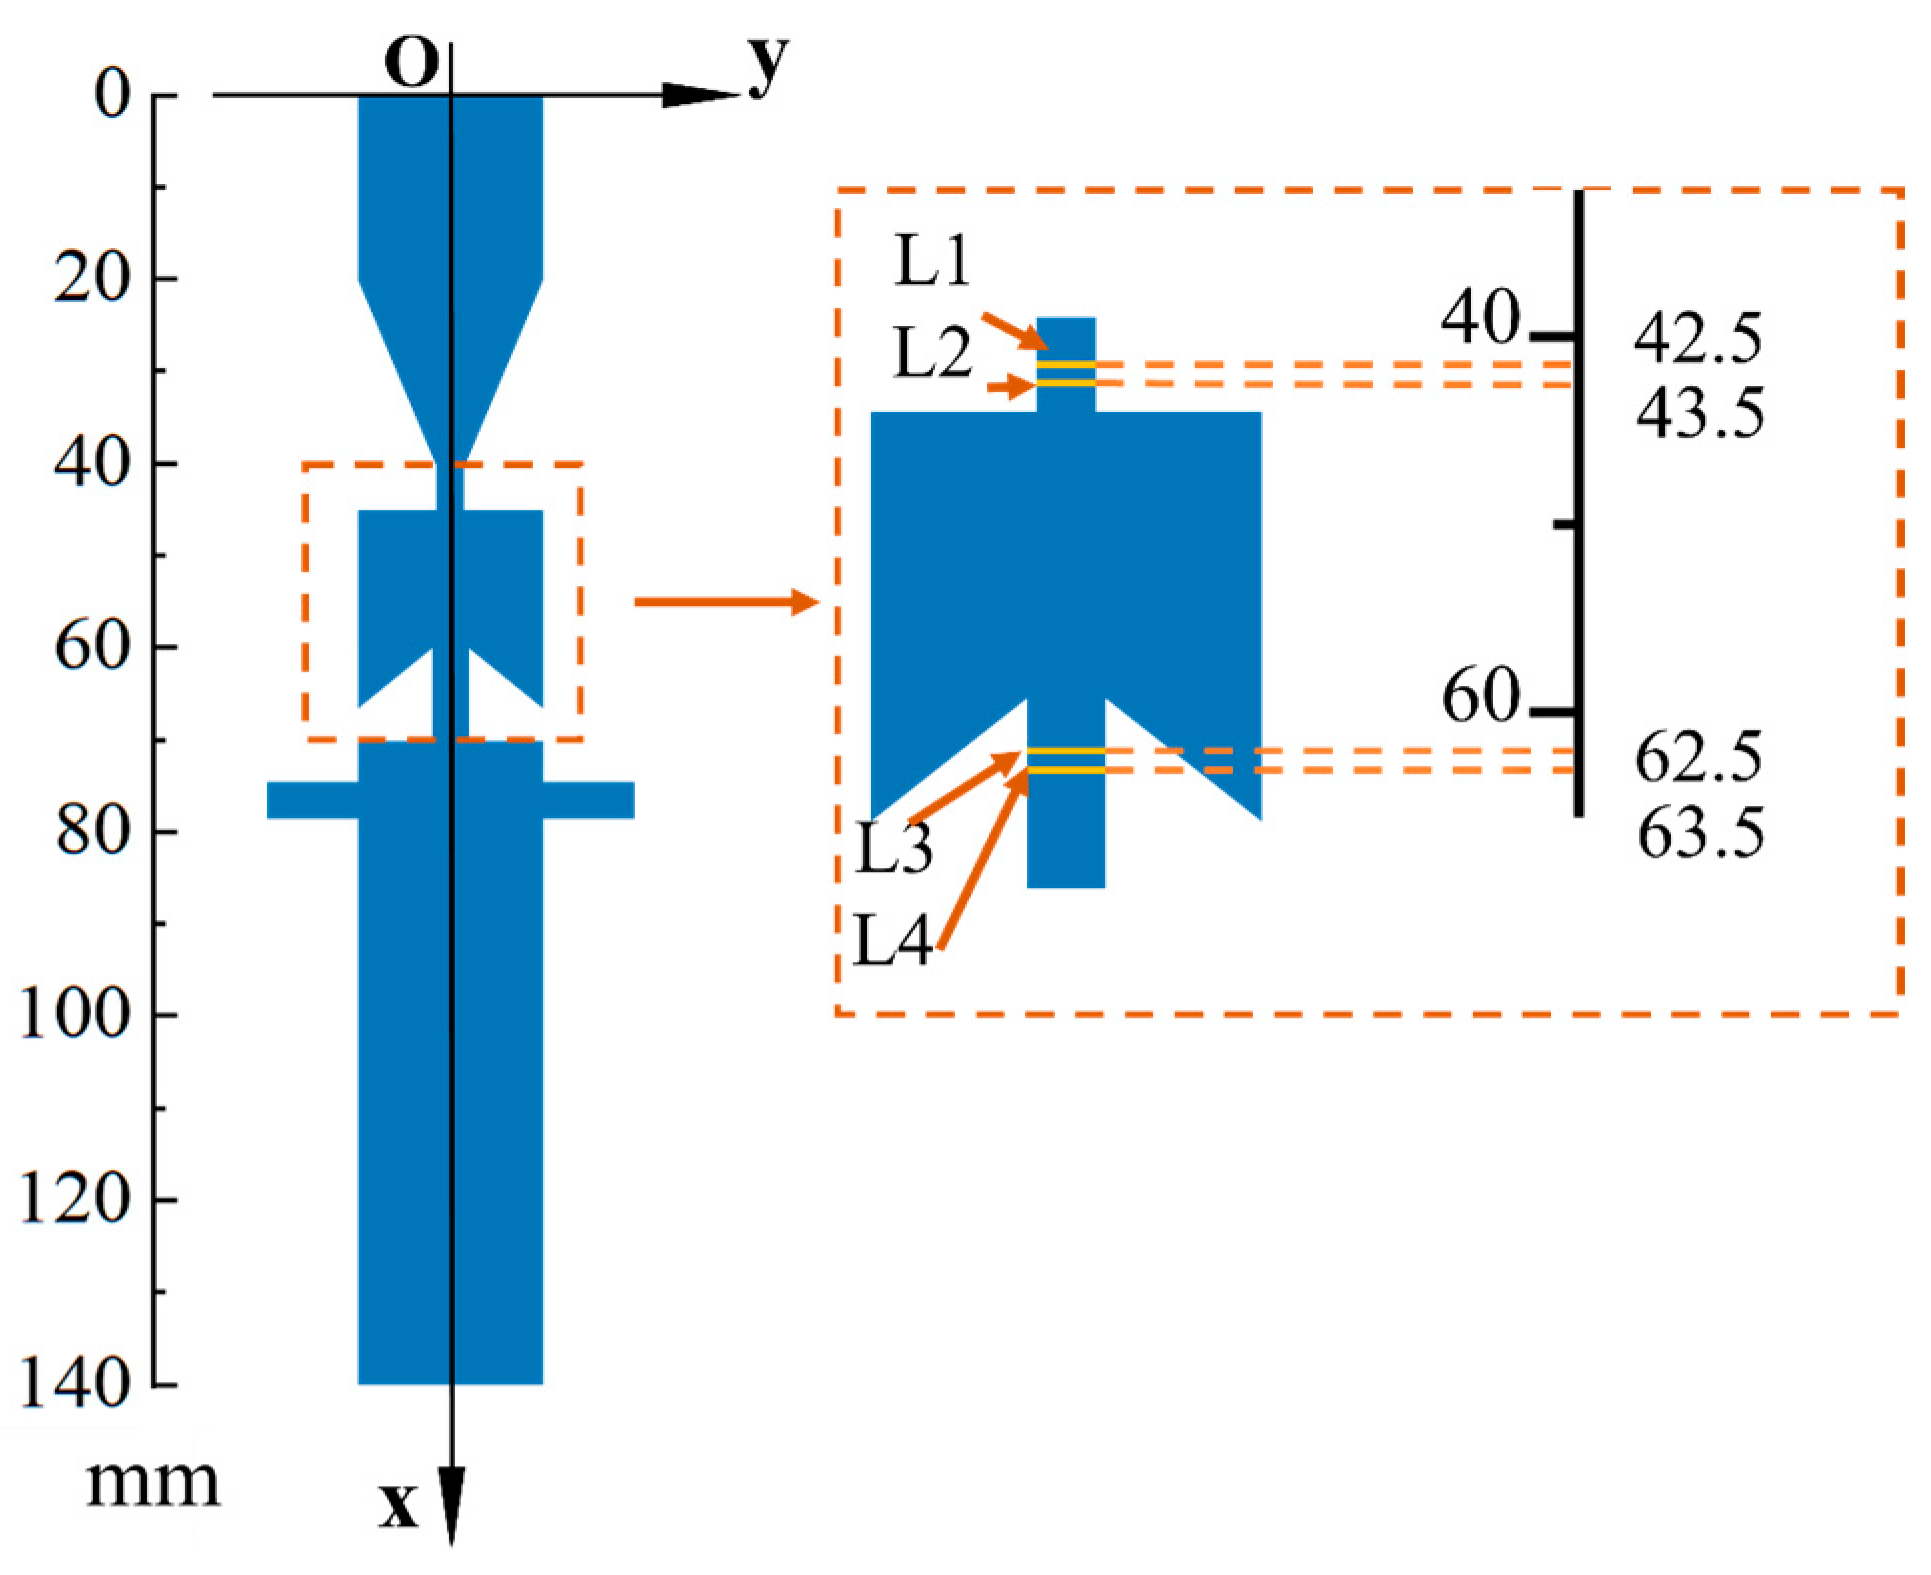
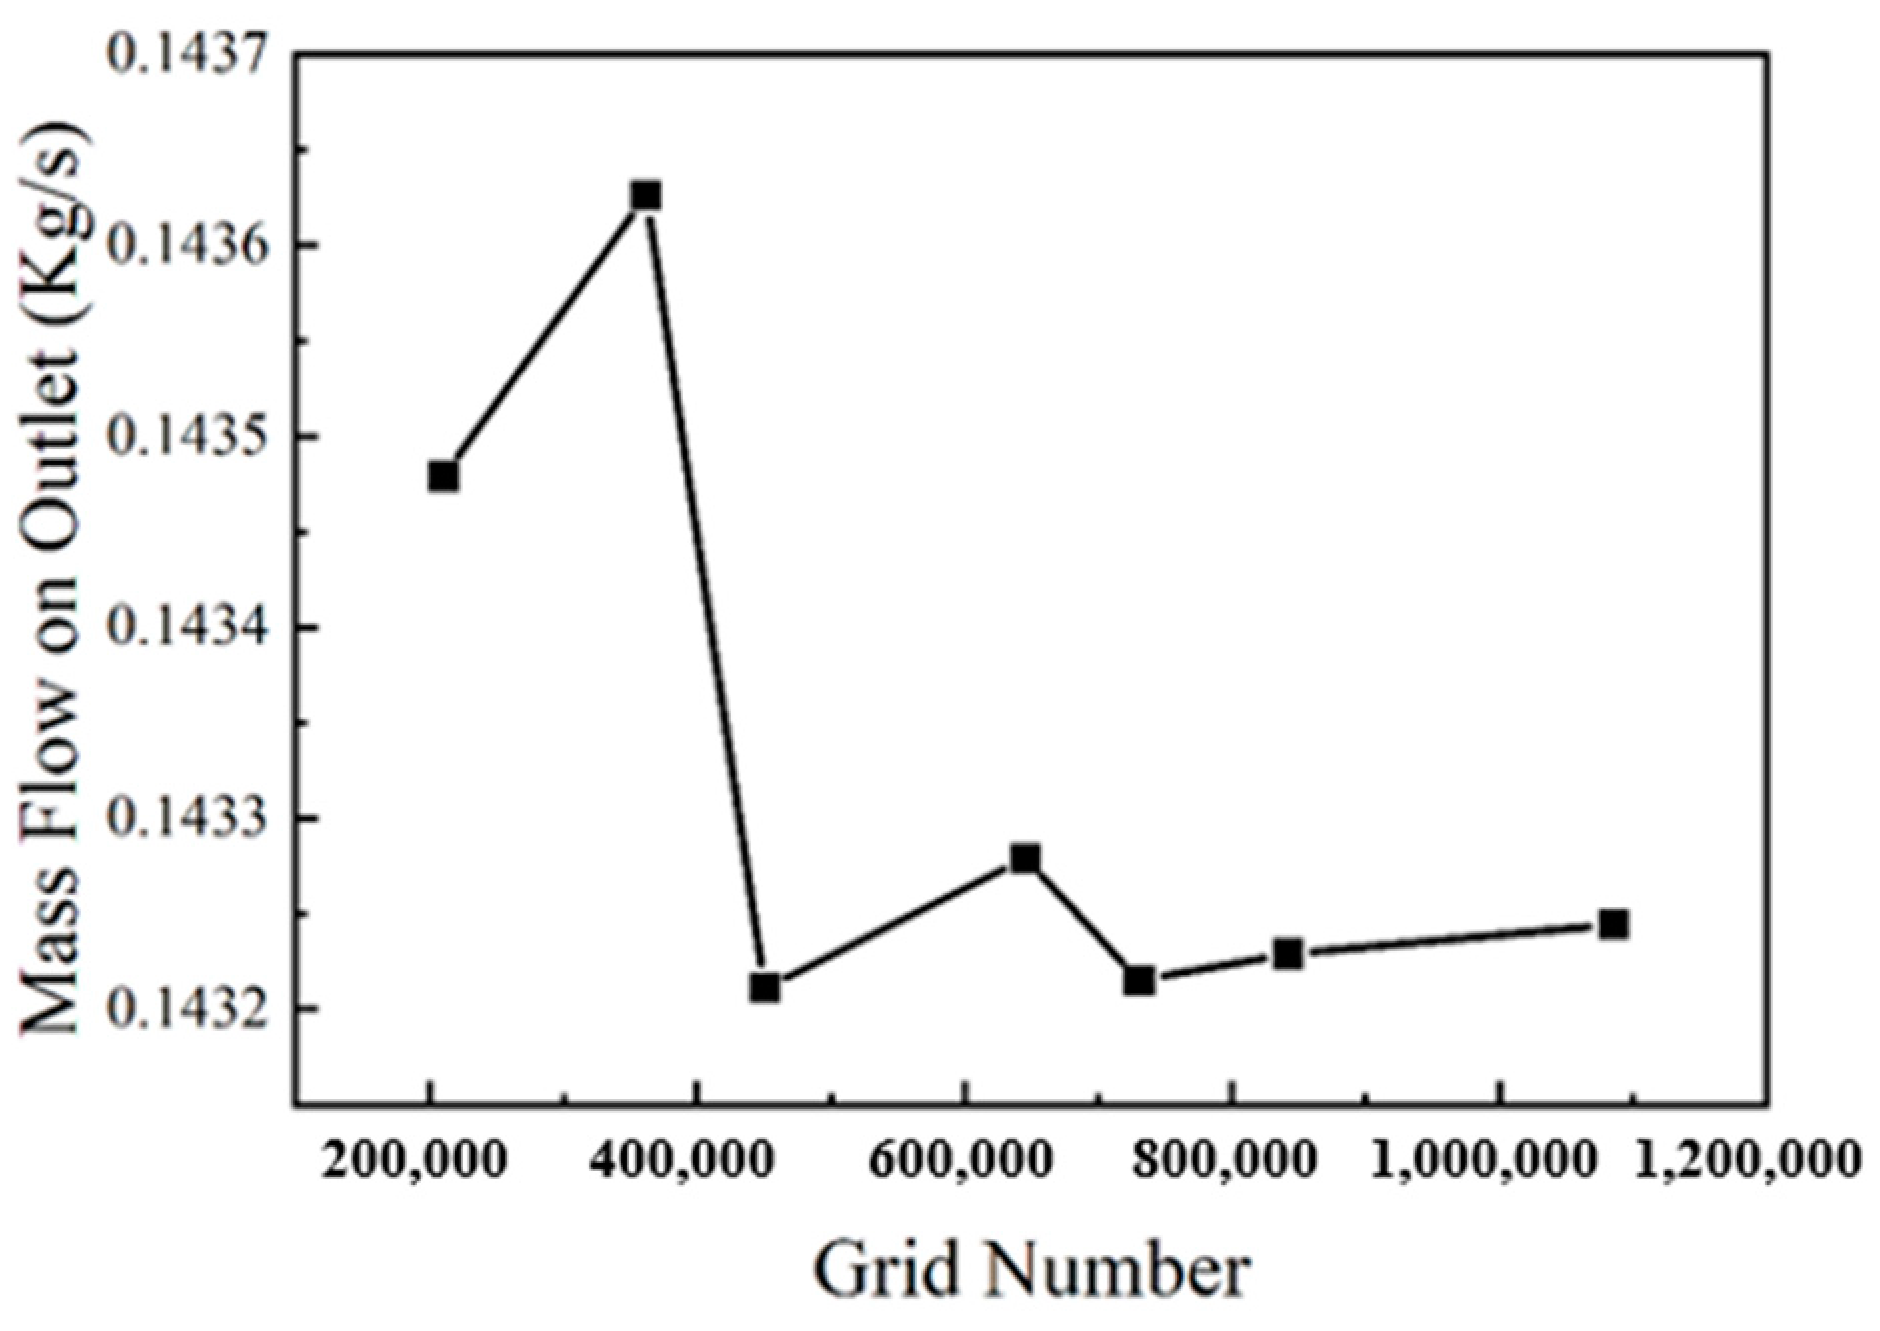
To investigate the transient flow characteristics within the bubble generator of the PJFM and to monitor the variation in velocity and pressure with time at different locations within the flow field, the plane of the symmetry axis of the bubble generator was trapped. We established a right-angle coordinate system, as shown in
Figure 5, with the middle axis of the bubble generator set as the
x-axis and the midpoint of the liquid-phase inlet set as the origin. Several lines were established along the
y-axis for the upper nozzle, pulse cavity, lower nozzle, and nozzle outlet of the bubble generator. Monitoring points were placed on each line segment to track pressure changes in each structure. To ensure accuracy, representative points were selected based on the research method outlined in [
20]. The coordinates of these points are listed in
Table 1.
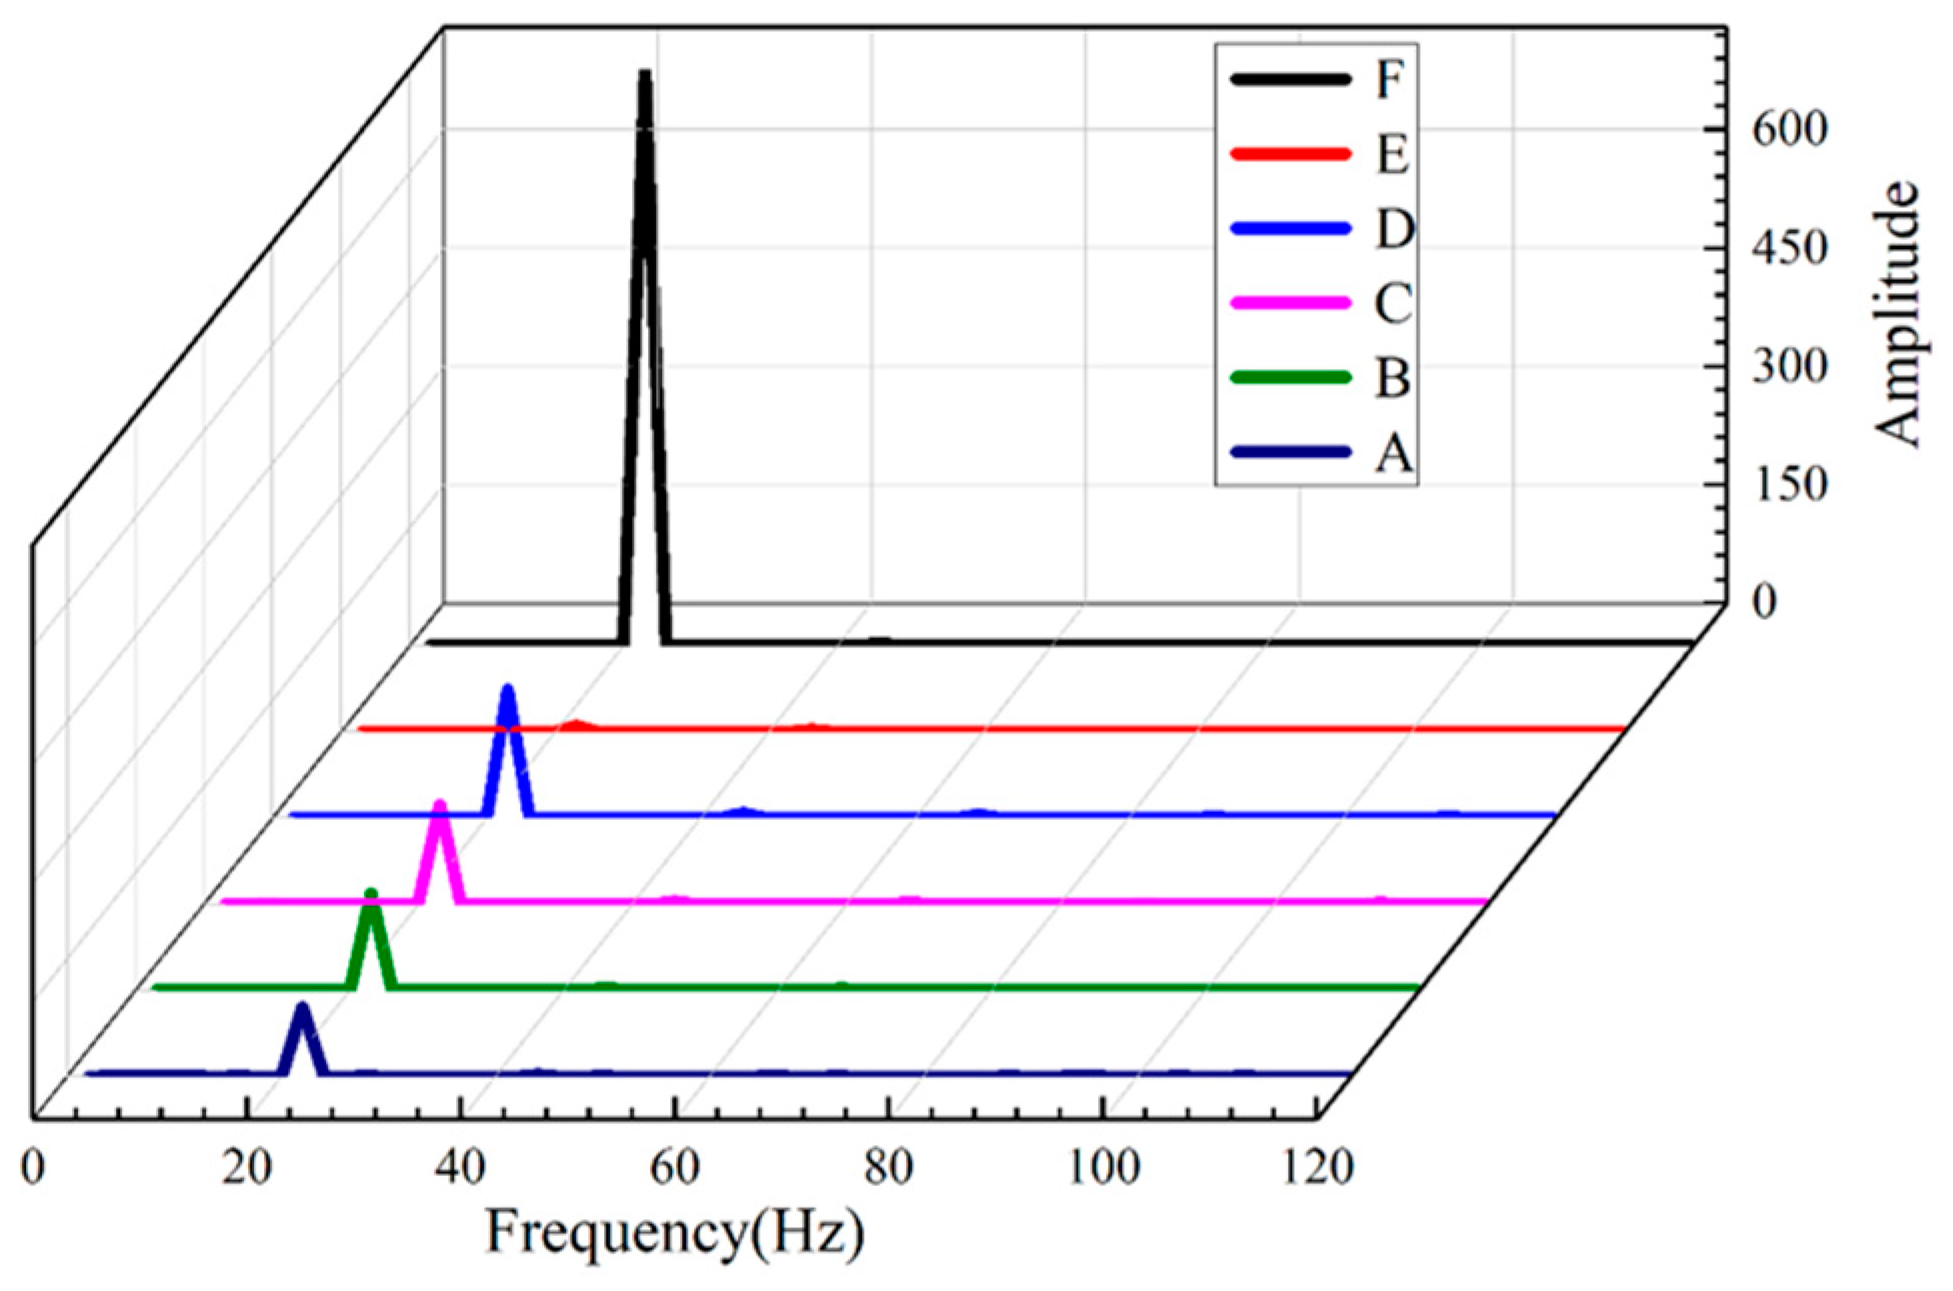
Figure 6 illustrates the variation in pressure pulsation at each monitoring point in the PJFM. The figure shows that pulsation is evident at every position inside the pulse jet bubble generator, and a stable self-oscillating jet is formed. The pulsation amplitude is smallest at the monitoring point on the central axis compared to other monitoring points on the same cross-section. The pulsation of the fluid at the upper nozzle is minimal. As the jet passes through the pulse cavity, it produces a pulse, and the pulsation gradually increases during outflow through the lower nozzle. In contrast, the pressure changes do not create regular pulsation in the standard nozzle.
Figure 7 displays the frequency domain of pressure variation obtained by applying the FFT (Fast Fourier Transform) to the time domain of pressure variation at each monitoring point in the PJFM. The Fourier spectrum displays sharp peaks at the same frequency, indicating better pulse characteristics [
13]. The pressure pulsation amplitude at the outlet of the upper nozzle is approximately 90. As the fluid enters the pulse cavity and flows out from the lower nozzle, the amplitude of the pulsation gradually increases. At the point of maximum negative pressure at the lower nozzle F, the amplitude is close to 700. This indicates that the pulsation intensity of the fluid generated by the resonant cavity gradually increases as it passes through the pulse cavity and finally outflows from the lower nozzle.
Based on
Figure 6 and
Figure 7, it can be concluded that the transient flow in the pulse jet bubble generator exhibits typical resonance characteristics that occur in self-oscillating jets. This resonance property can significantly enhance the cavitation performance of the bubble generator [
12], resulting in the unique flotation performance of the PJFM.
3.2. Jet Velocity Expansion Characteristics Analysis
To examine the impact of the pulse cavity on jet velocity, two lines were established at the upper and lower nozzles, respectively. Several points on the lines were selected to observe the jet velocity characteristics in the tangential direction. The location and coordinates of the focused plane lines are presented in
Figure 8.
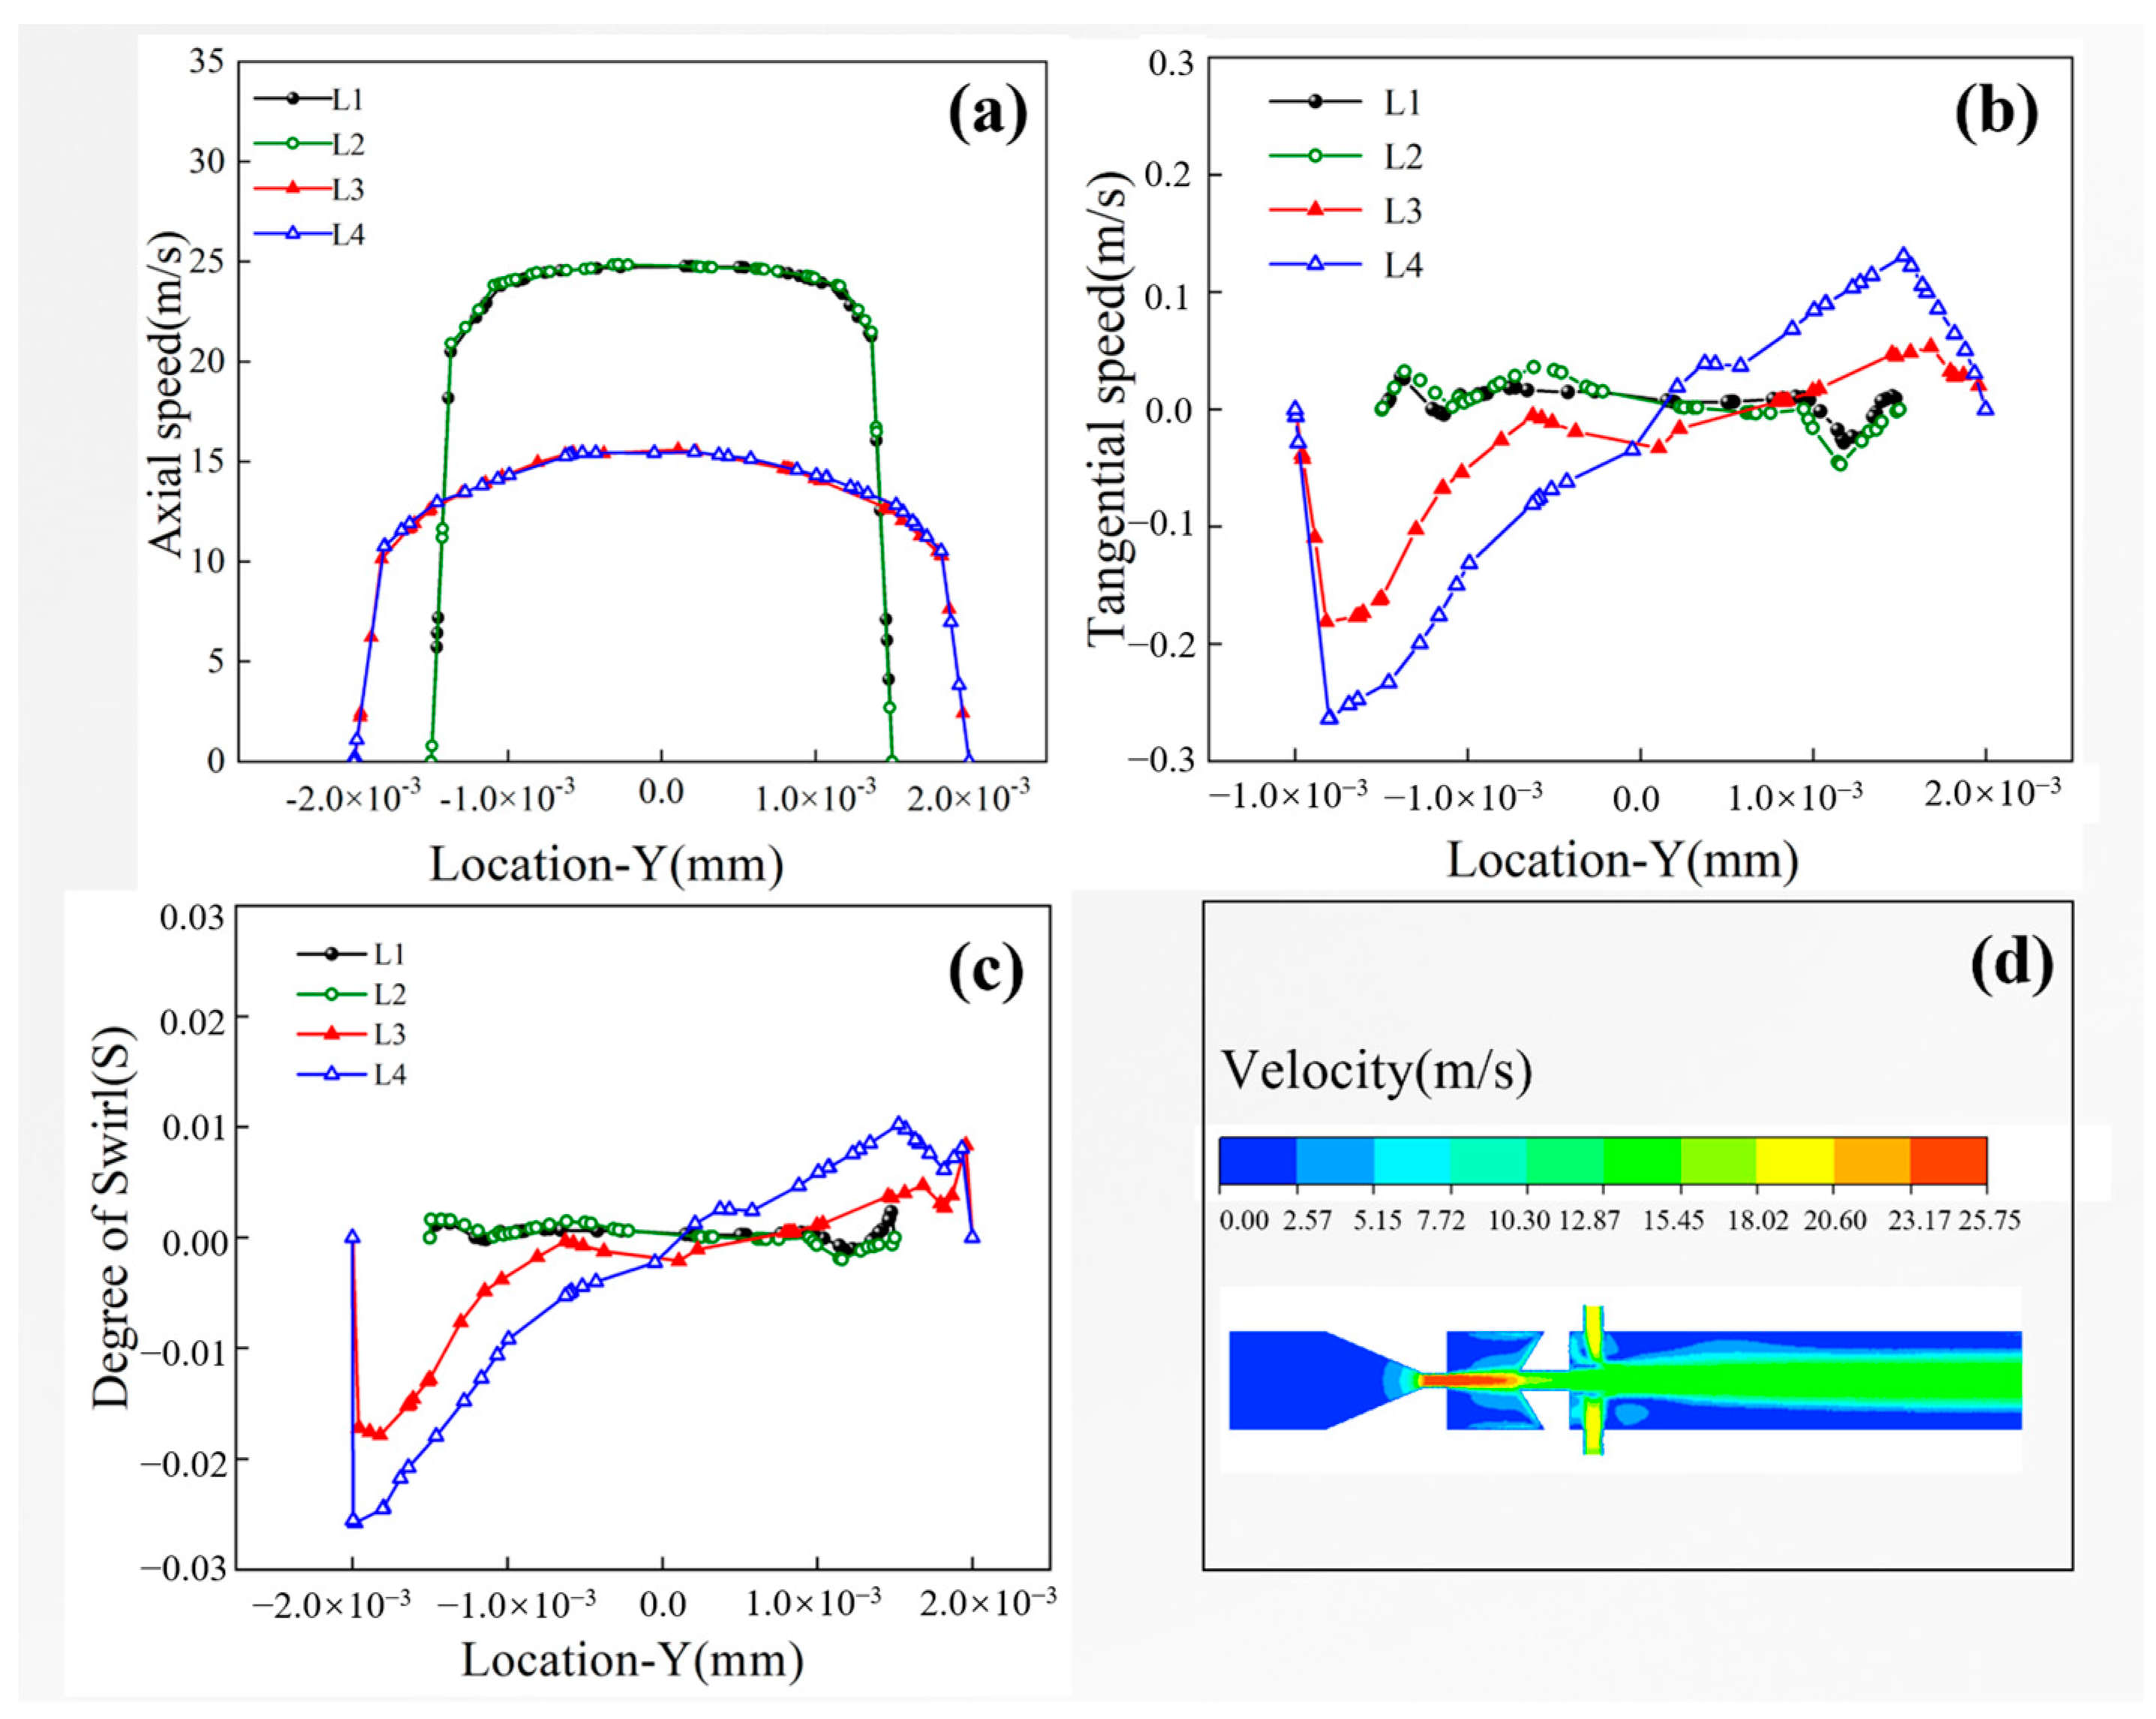
Figure 9a shows the axial velocities at the upper and lower nozzles. The axial velocity of the jet is distributed symmetrically in a peak shape, with the maximum velocity at the axis of the jet. This ensures a consistent velocity magnitude throughout the main section of the jet, creating the necessary velocity conditions for smooth expansion and continuous mixing. The pulse cavity experiences a loss of fluid energy, which is then converted into the energy necessary for its normal operation. This provides power for slurry mixing and mineralization.
Figure 9b displays the tangential velocities at the upper and lower nozzles. At the symmetrical position from the axis, the direction of velocity is opposite, which affects the vortex structure of the jet. This increases the twisting and folding between the fluids and strengthens the effect of the jet’s winding suction and the effect of shearing air, favoring the production of smaller bubbles.
The patterns of tangential velocity variation at the upper and lower nozzles suggest that the normal jet will experience greater tangential velocity and fluctuations after passing through the pulse cavity, resulting in a significantly rotating jet. The degree of swirl of the rotating jet S is defined as follows [
21]:
where
is the tangential velocity in m/s, and
is the axial velocity in m/s.
Equation (8) was used to determine the degree of swirl distribution at the upper and lower nozzles, as shown in
Figure 9c. Additionally,
Figure 9d displays the velocity contour of the pulse nozzle. It is clear that the nonrotating jet at the upper nozzle developed into a rotating jet with low axial rotation and high peripheral rotation after passing through the pulse cavity. The rotation of the jet beam readily involves the surrounding stationary fluid into the jet beam, thereby enhancing the jet mixing process. The rotating jet produced in the PJFM is a low-rotation rotating jet that is subject to the working pressure.
The volume suction capacity
Ke varies linearly with the rotation degree
, which can be calculated using the following equation [
22].
Equation (9) implies that a higher degree of swirl in the jet results in a stronger coiling ability. The pulse structure is responsible for synthesizing the jet, and the coupling of various jet forms, such as the pulse jet and rotary jet, broadens the form of the jet flotation machine and strengthens its coiling and suction performance, bubble generation performance, and gas–liquid mixing performance.
3.3. Cavitation Characteristics of Pulse Jets
Figure 10 illustrates the cavitation phenomenon in the pulse cavity and normal nozzle. The cavitation area in the normal nozzle is concentrated only at the wall of the nozzle runner in the shrinkage section due to the Venturi effect caused by the velocity gradients between the fluid layers. In contrast, the inter-fluid shear in a normal jet is not as strong, resulting in limited and localized cavitation.
The pulse cavity experiences cavitation in a larger area, resulting in the formation of a gas–liquid two-phase flow. Water vapor surrounding the boundary between the shear layer of the jet beam and the cavity acts as a compression volume due to the cavitation effect. The surrounding gas is compressed and expanded periodically due to the periodic pulsation of the shear layer in the transverse direction, creating a mechanism similar to a ‘gas spring’ [
23]. This forms an oscillating system in the cavity. Pulse nozzles have a significantly larger cavitation area compared to ordinary nozzles. The flotation machine benefits from a stronger cavitation effect, which enhances its ability to generate microbubbles and improve flotation performance by modifying mineral particle surfaces through cavitation erosion.
3.4. Motion Analysis of Pulsed Jet Vortices
The PJFM is aerated primarily through the jet coiling phenomenon. To analyze this phenomenon, we studied the expansion law and analyzed the jet velocity.
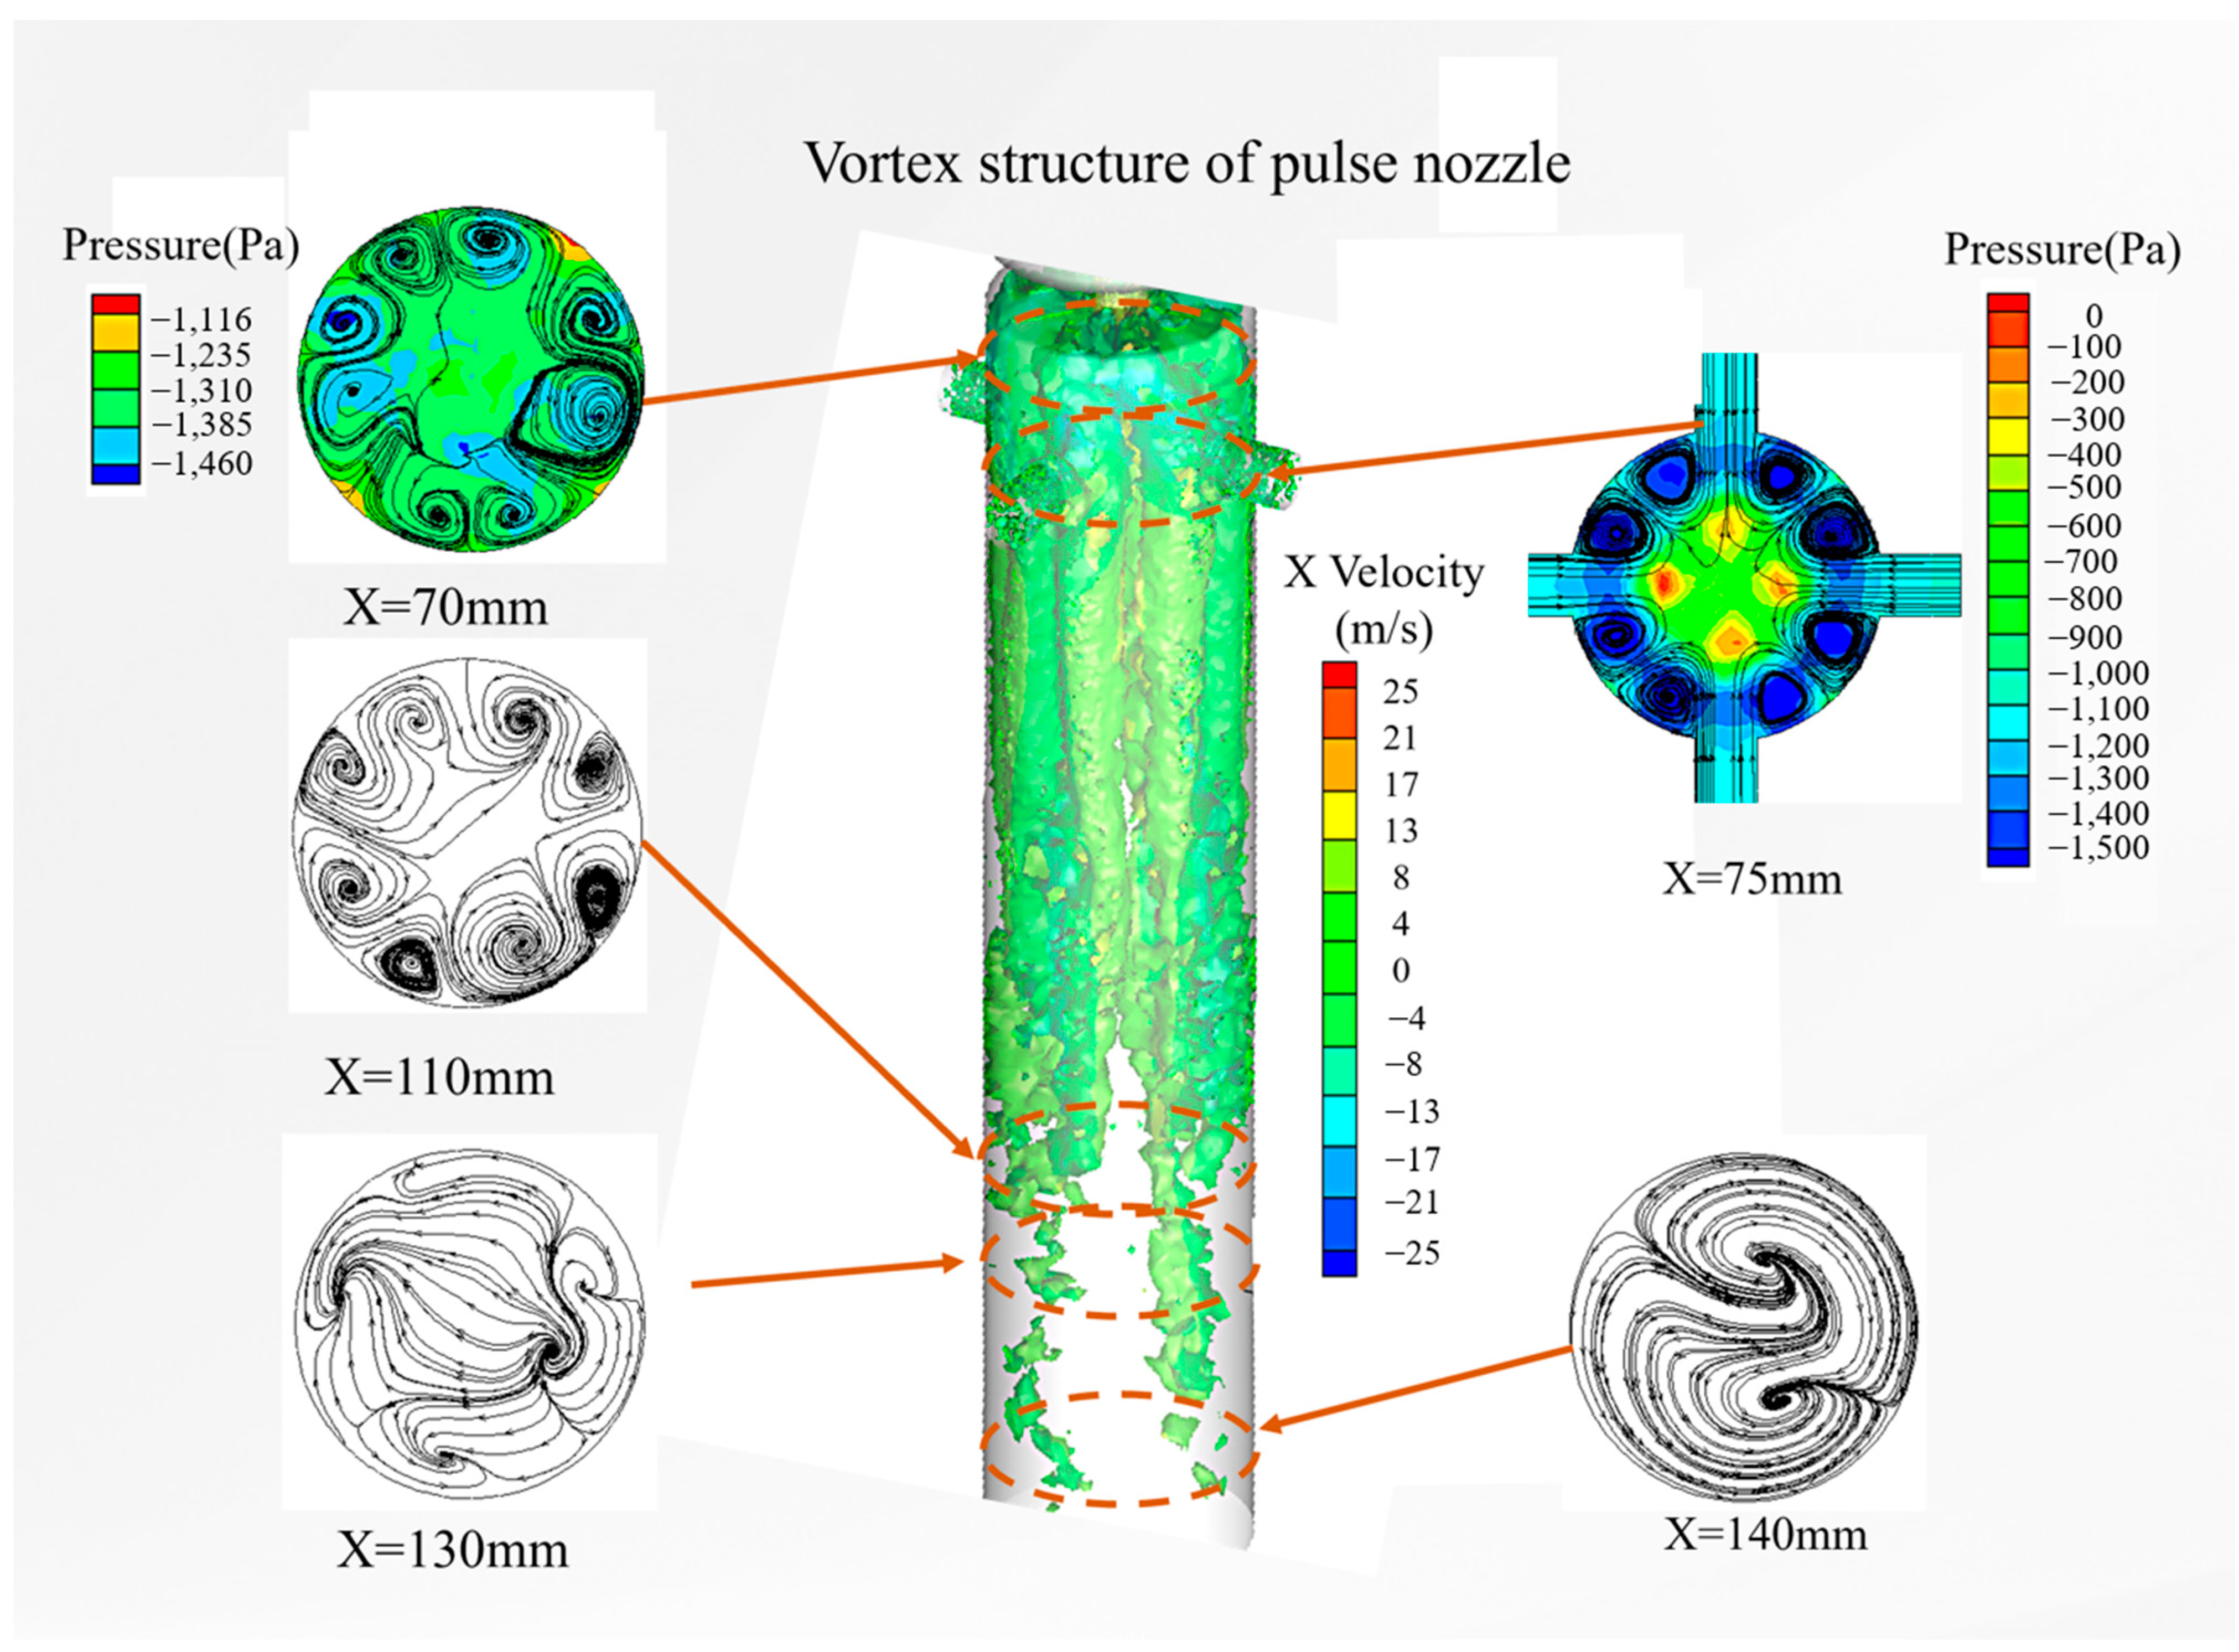
Figure 11 shows the axial vortex volume distribution of the generator for pulsed jet bubbles. The majority of the vortex volume is concentrated in the negative pressure chamber, which corresponds to the velocity gradient value.
We used Q-discriminant to identify pulsating nozzle vortex structures.
Figure 11 shows the equivalent surface (coordinate system same as in
Figure 8) when Q is 60,000. Large, continuous vortex structures are visible inside the pulse jet bubble generator, concentrated in the nozzle discharge, negative pressure chamber, inlet opening, and front of the mixing chamber. The flow direction vortex and the spreading vortex are two essential forms in the vortex structure. They represent the law of change in vortex volume parallel and perpendicular to the flow direction, respectively.
At X = 70 mm in the mixed layer, an asymmetrically arranged, counter-rotating vortex structure is formed. As the vortex structure advances and the mingling of gas and liquid intensifies, the spreading vortex structure grows larger, and the suction effect on the gas becomes stronger. At X = 75 mm, the spreading vortex structure transforms into a symmetrically arranged, counter-rotating vortex structure. The central region of slurry gasification is the vortex core area. In the X = 75 mm cross-section, eight symmetrically arranged, counter-rotating vortex tunnels are formed. These tunnels intensify the gas–liquid mixture and the cutting and crushing of the gas through the interaction between the counter-rotating, twisting, and folding vortex tubes. Moving to the X = 130 mm and X = 140 mm sections, the structure of the spreading vortex gradually fuses and dissipates. At this point, the erosion of gas towards the potential flow nucleus increases, coating the gas jet and progressively homogenizing the gas–liquid mixture.
Figure 11 shows the typical appearance of eight vortex tubes in the flow direction, from the nozzle discharge to the front of the mixing chamber, which appear between four adjacent inlets designed on the pulse jet bubble generator. During development, adjacent vortex structures interact and influence each other, causing the distortion and deformation of the vortex. As the jet cross-section advances, the large-scale flow-direction vortex tube structure breaks down into smaller flow-direction vortex structures.
The proposed sequence structure of the jet comprises a large number of propagating vortex and flow vortex structures within the pulsed jet bubble generator due to the Kelvin–Helmholtz instability and circumferential three-dimensional instability. The structure of the vortex undergoes a process of development from two-dimensional to three-dimensional and from symmetric to asymmetric. This process is accompanied by a large number of vortex structure fragmentations and reorganizations in the jet flow field, as well as in the gas–liquid mixture. The vortex in the flow direction plays a significant role in the winding and mingling of the ambient fluid for the pulsed jet bubble generator jet.
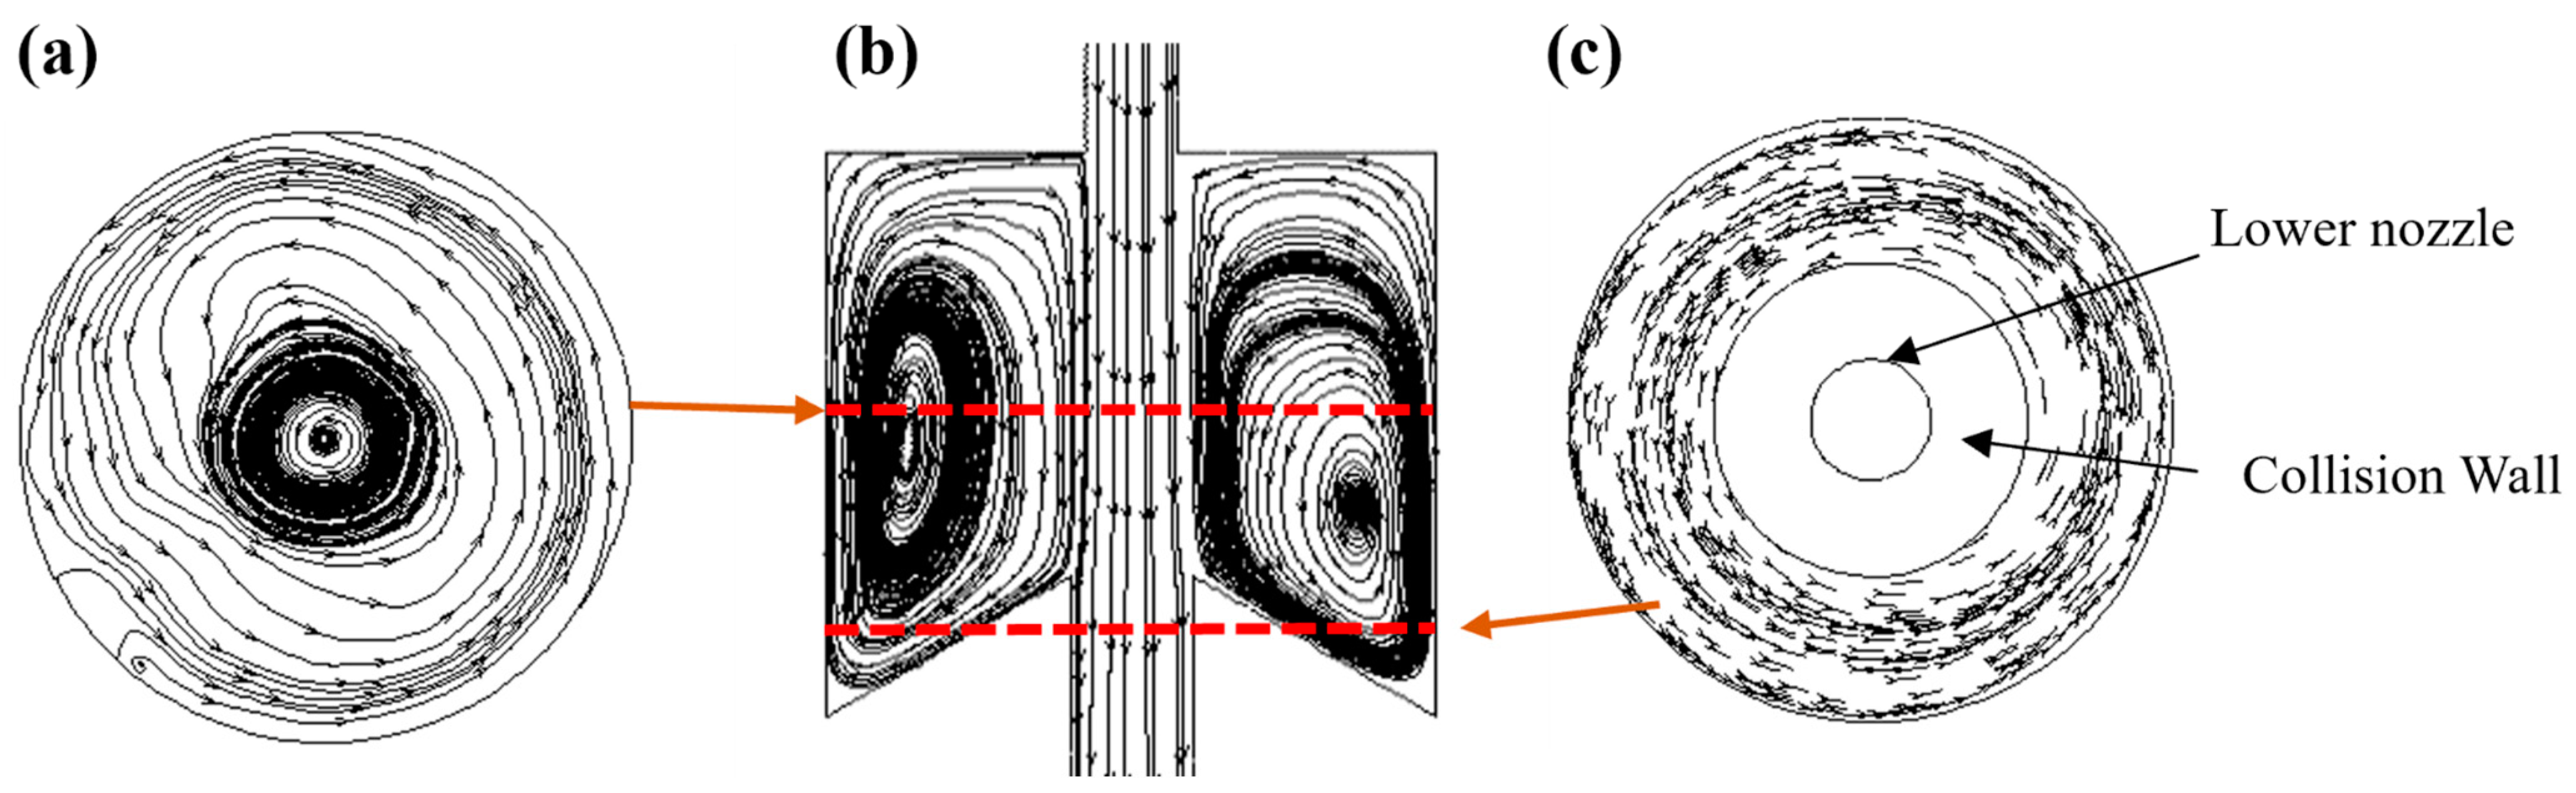
3.5. Comprehensive Mineralization Mechanism of the Pulse Jet
The vorticity is high, and the vortex lines are tightly packed in the middle part, while there are fewer vortex lines in the surrounding area, resulting in a lower vortex volume (
Figure 12a).
Figure 12b presents the distribution of vortex lines in the pulse cavity. A transverse annular air vortex is generated within the pulse structure due to the presence of the cavitation phenomenon. Due to the pulse structure, the fluid that enters from the upper nozzle cannot be fully ejected in a short time. As a result, the fluid concentration in the vicinity of the lower nozzle distributes the transverse vortex volume in a certain gradient. Additionally, the axial annular fluid (vortex) also affects the vortex generated in the pulse cavity, causing it to not be on the same horizontal plane. The annular fluid is affected by the collision wall and creates a strong vortex in the collision wall area, as depicted in
Figure 12c. The axial and lateral vortices in the pulse cavity work together to increase momentum exchange between materials, leading to improved slurry mixing and mineralization. The mineralization process is explained as vortex mineralization and cavitation mineralization.
After mineralization in the pulse cavity, the slurry is ejected from the lower nozzle at a certain speed and enters the negative pressure chamber, where it mixes with the surrounding gas. Upon entering the negative pressure chamber, the jet expands and transforms into a discontinuous and unstable velocity discontinuity fluid. Due to the high velocity of the jet, it rapidly removes the surrounding gas, creating a local negative pressure state within the chamber. The gas surrounding the slurry jet is initially sheared, cut, and crushed, resulting in the generation of numerous bubbles.
The analysis indicates that the pulp mineralization mechanism in the pulse jet inflatable mixing device, which enters from the upper nozzle, primarily involves vortex mineralization, shear contact mineralization, and cavitation mineralization. The combination of multiple mineralization modes increases the chance of contact and collisions between mineral particles and bubbles, resulting in improved mineralization efficiency and the preparation of the medium for flotation separation.
3.6. Aeration Performance
3.6.1. Aeration Rate Measurement
The PJFM relies on jet entrainment to achieve the self-absorption of air, which is then uniformly distributed through the slurry distributor. According to MT/T652-1997 “Test Methods and Judgment Rules for Clear Water Performance of Flotation Machines for Coal” [
24], the aerating performance of the PJFM was tested under different feed pressures. The air filling volume and the air inflation uniformity factor are calculated using the following equations:
where
is the average unit air inflation volume of the flotation machine in m
3/(m
2·min),
is the unit air inflation volume at measurement point in m
3/(m
2·min), n is the number of measurement points, and
is the air inflation uniformity factor in %.
3.6.2. Bubble Distribution Characteristics Analysis
A comparison test was conducted between the pulse nozzle and the normal nozzle to investigate the effect of the pulse structure on bubble distribution characteristics. The tests were carried out in clear water to obtain a clear picture of the bubbles and facilitate an analysis of their distribution inside the flotation machine. The study determined bubbles using the UCT (University of Cape Town) bubble size tester [
24]. The volume of the PJFM was more than 10 times that of a conventional laboratory single tank flotation machine. To reflect bubble size distribution characteristics in a more practical way, bubble images were obtained through direct photography using a method described in [
25]. Afterwards, the size distribution and shape characteristics of the bubbles were analyzed. The method for acquiring bubbles is shown in
Figure S1.
To analyze the bubble distribution in the flotation cell more effectively, bubble diameters less than 1000 μm were statistically categorized and classified into specified size classes using multiple photographs. Image processing was performed using Image-Pro Plus whose version is 6.0. The software calculated and extracted the arithmetic diameter (D
b) of a single bubble, which was then screened based on its size. The average size of the bubbles, referred to as the soot diameter (D
32), was calculated using Equation (12).
where
is the number of bubbles with a specified diameter, and
is the bubble diameter in μm.
3.7. Coal Flotation Property Improvement
3.7.1. Coal Slime Sample Properties
The coal slime used in this research was the flotation feed of the Guandi coal preparation plant, and the results of the proximate analysis are as follows: M
ad = 1.66%, A
d = 18.43%, V
daf = 20.17%. The grain size of coal slimes was determined by wet screening (
Figure 13).
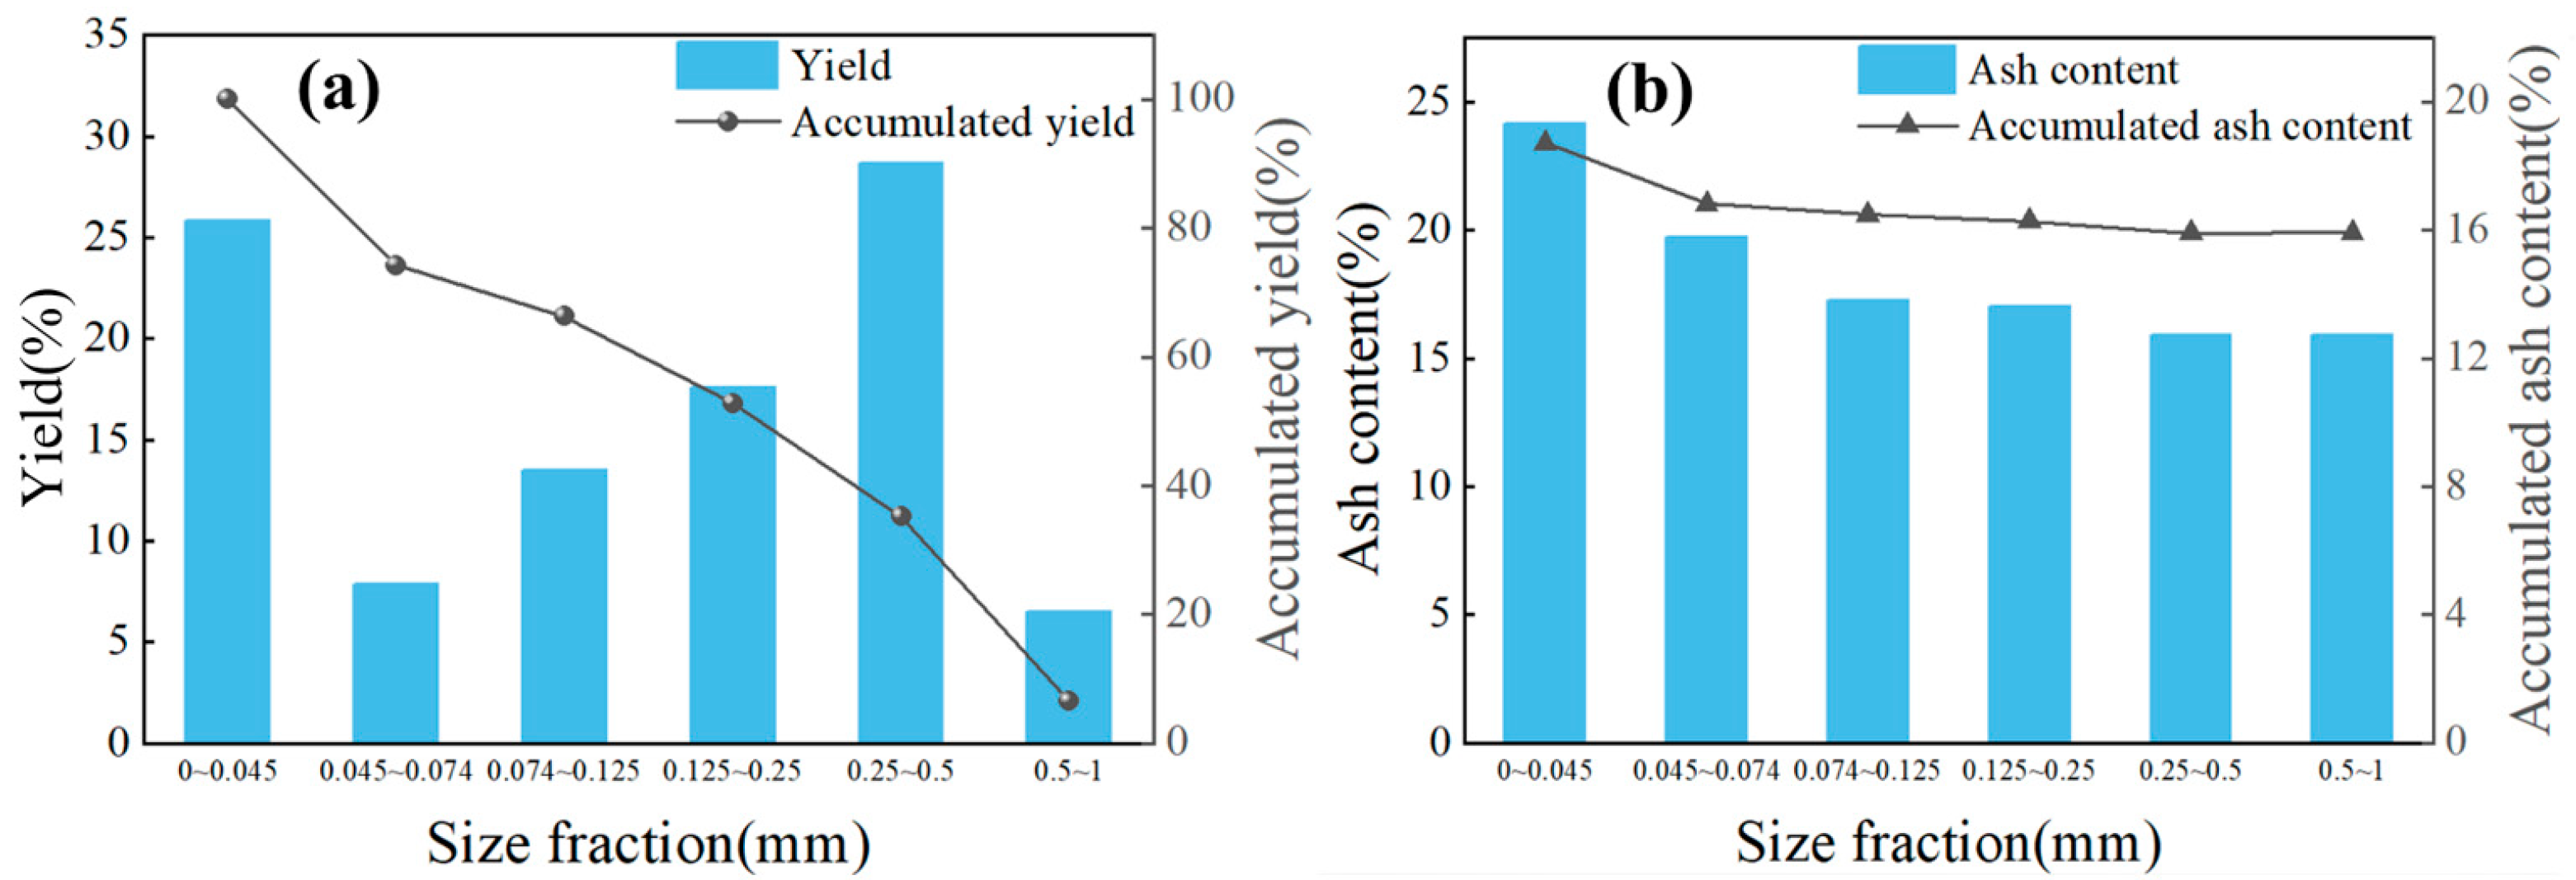
Figure 13 shows that the coal has a low ash grade, with a weighted average ash content of 18.73%. There is a significant difference between the ash content of each size range and the total ash content of the coal sample, indicating non-uniform coal quality. Additionally, the distribution of each grain level is uneven, with the suitable grain level for flotation of 0.5~0.074 mm accounting for 59.78% of the sample. The coal sample had a high ash content, which increased gradually, especially for the fine slime of −0.045 mm, accounting for 25.81% of the sample. This high proportion of fine mud with high ash content could seriously deteriorate the flotation effect and affect the ash content of the final flotation fine coal.
3.7.2. Flotation Tests
The coal slime was modified by circulating and stirring it in the pulse cavity and common jet for 15 min, respectively, followed by filtering and drying. For each sample, electrical potential analysis was conducted with six duplicate tests and five measurements at the same pH. The final ζ-potential of the sample at that pH condition was determined by taking the average value of the six tests. The electrical potential test was performed using an Omec NS-90Z nanoparticle size and potential analyzer.
The study compared and analyzed the floatability of raw coal slime (RC) and modified coal slime that had been separately pretreated using a pulse jet (PJC) and normal jet (NJC). Step-released flotation experiments were conducted on the RC, PJC, and NJC under identical flotation conditions. The feed pulp concentration was fixed at 40 g/L, the collector kerosene dosage was 1200 g/t, and the frothing agent octanol dosage was 120 g/t.
Figure S2 shows the stepwise release flotation process. The flotation tests were conducted using a lab-scale single flotation cell (XFD) with a capacity of 1.5 L.
To analyze the flotation rate of coals of various sizes and comprehensively evaluate the sorting performance of PJFM, we conducted an additional analysis to determine the sorting situation under 0.22 MPa feed pressure. The feed concentration was 40 g/L, and the dosage of kerosene and octanol was 1200 g/t and 120 g/t, respectively. Sampling was performed at different flotation times. The flotation times were 1 min, 5 min, 15 min, 20 min, 30 min, and 40 min from the start of experiment.
3.8. Flotation Performance Test Results and Analysis
3.8.1. Aeration Performance of the PJFM
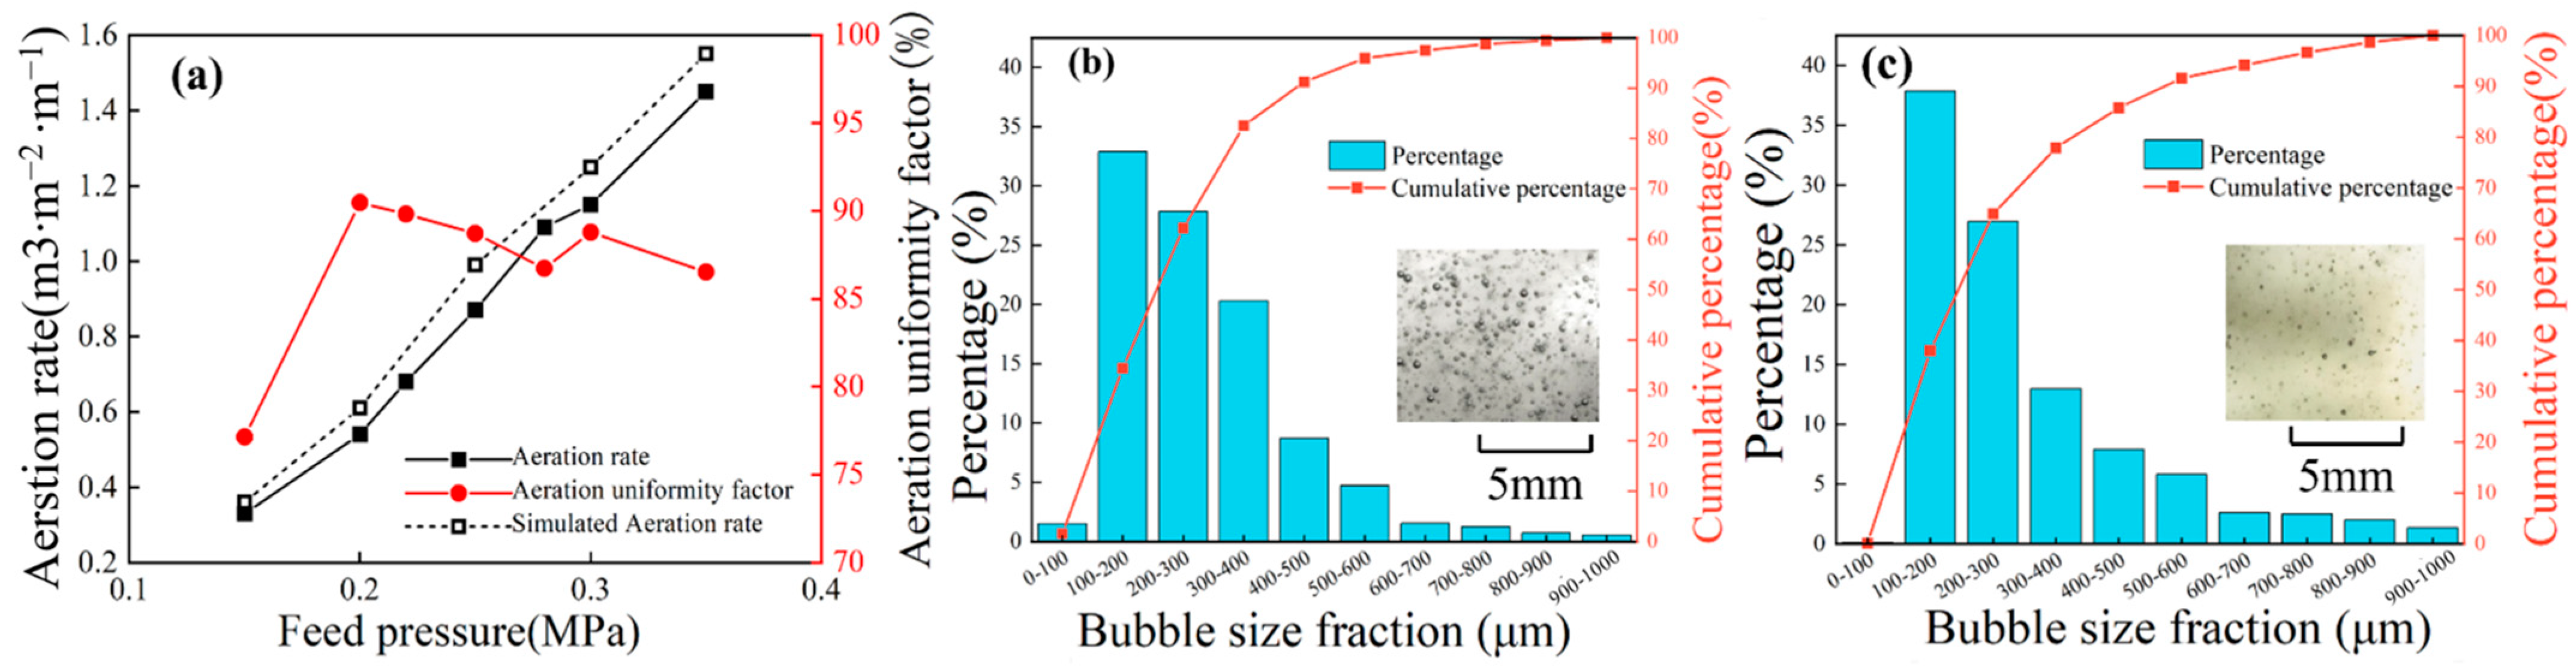
In addition to experimental tests, we also simulated the aeration rate of the PJFM.
Figure 14a shows the influence of feed pressure on aeration performance. The numerical simulation’s inflation volume is consistent with the experimental inflation volume, verifying the simulation’s correctness. The inflation uniformity coefficient is greater than 70% when the feeding pressure is higher than 0.15 MPa. When the feed pressure exceeds 0.25 MPa and the aerating rate is above 0.8 m
3/(m
2·min), the inflatable performance of the PJFM exceeds the requirement of MT/T652-1997, which stipulates the inflatable performance index of the flotation machine. The PJFM has a large adjustable range of inflation volume, indicating wide applicability.
Figure 14b,c show images of the bubbles and the bubble size distribution of the pulse nozzle and normal nozzle, respectively. The numerical simulation analysis concurs with the experimental results that the bubbles produced by the pulse nozzle are more numerous and denser than those produced by the normal nozzle. Noticeable differences in bubble size distribution rates were observed between the normal nozzle and pulse nozzle in the flotation cell. However, the dominant bubble sizes for both nozzles were 100–200 m and 200–300 m. The pulse nozzle was able to produce bubbles as small as 100 μm with a more uniform distribution of bubble sizes.
The pulse jet nozzle generates a cavitation jet that creates vacuoles in the pulp flow. These vacuoles preferentially adsorb to the surface of particles with better hydrophobicity, improving sorting accuracy. Additionally, the oscillating nature of the pulse jet enables periodic high-speed cutting of the surrounding gas, further refining the bubbles and increasing their density. Compared to normal nozzles, pulse nozzles expand the area and size of cavitation, providing more opportunities to generate vacuoles. This improves the microbubble distribution of the PJFM.
3.8.2. Effect of the Pulse Jet on Coal Floatability
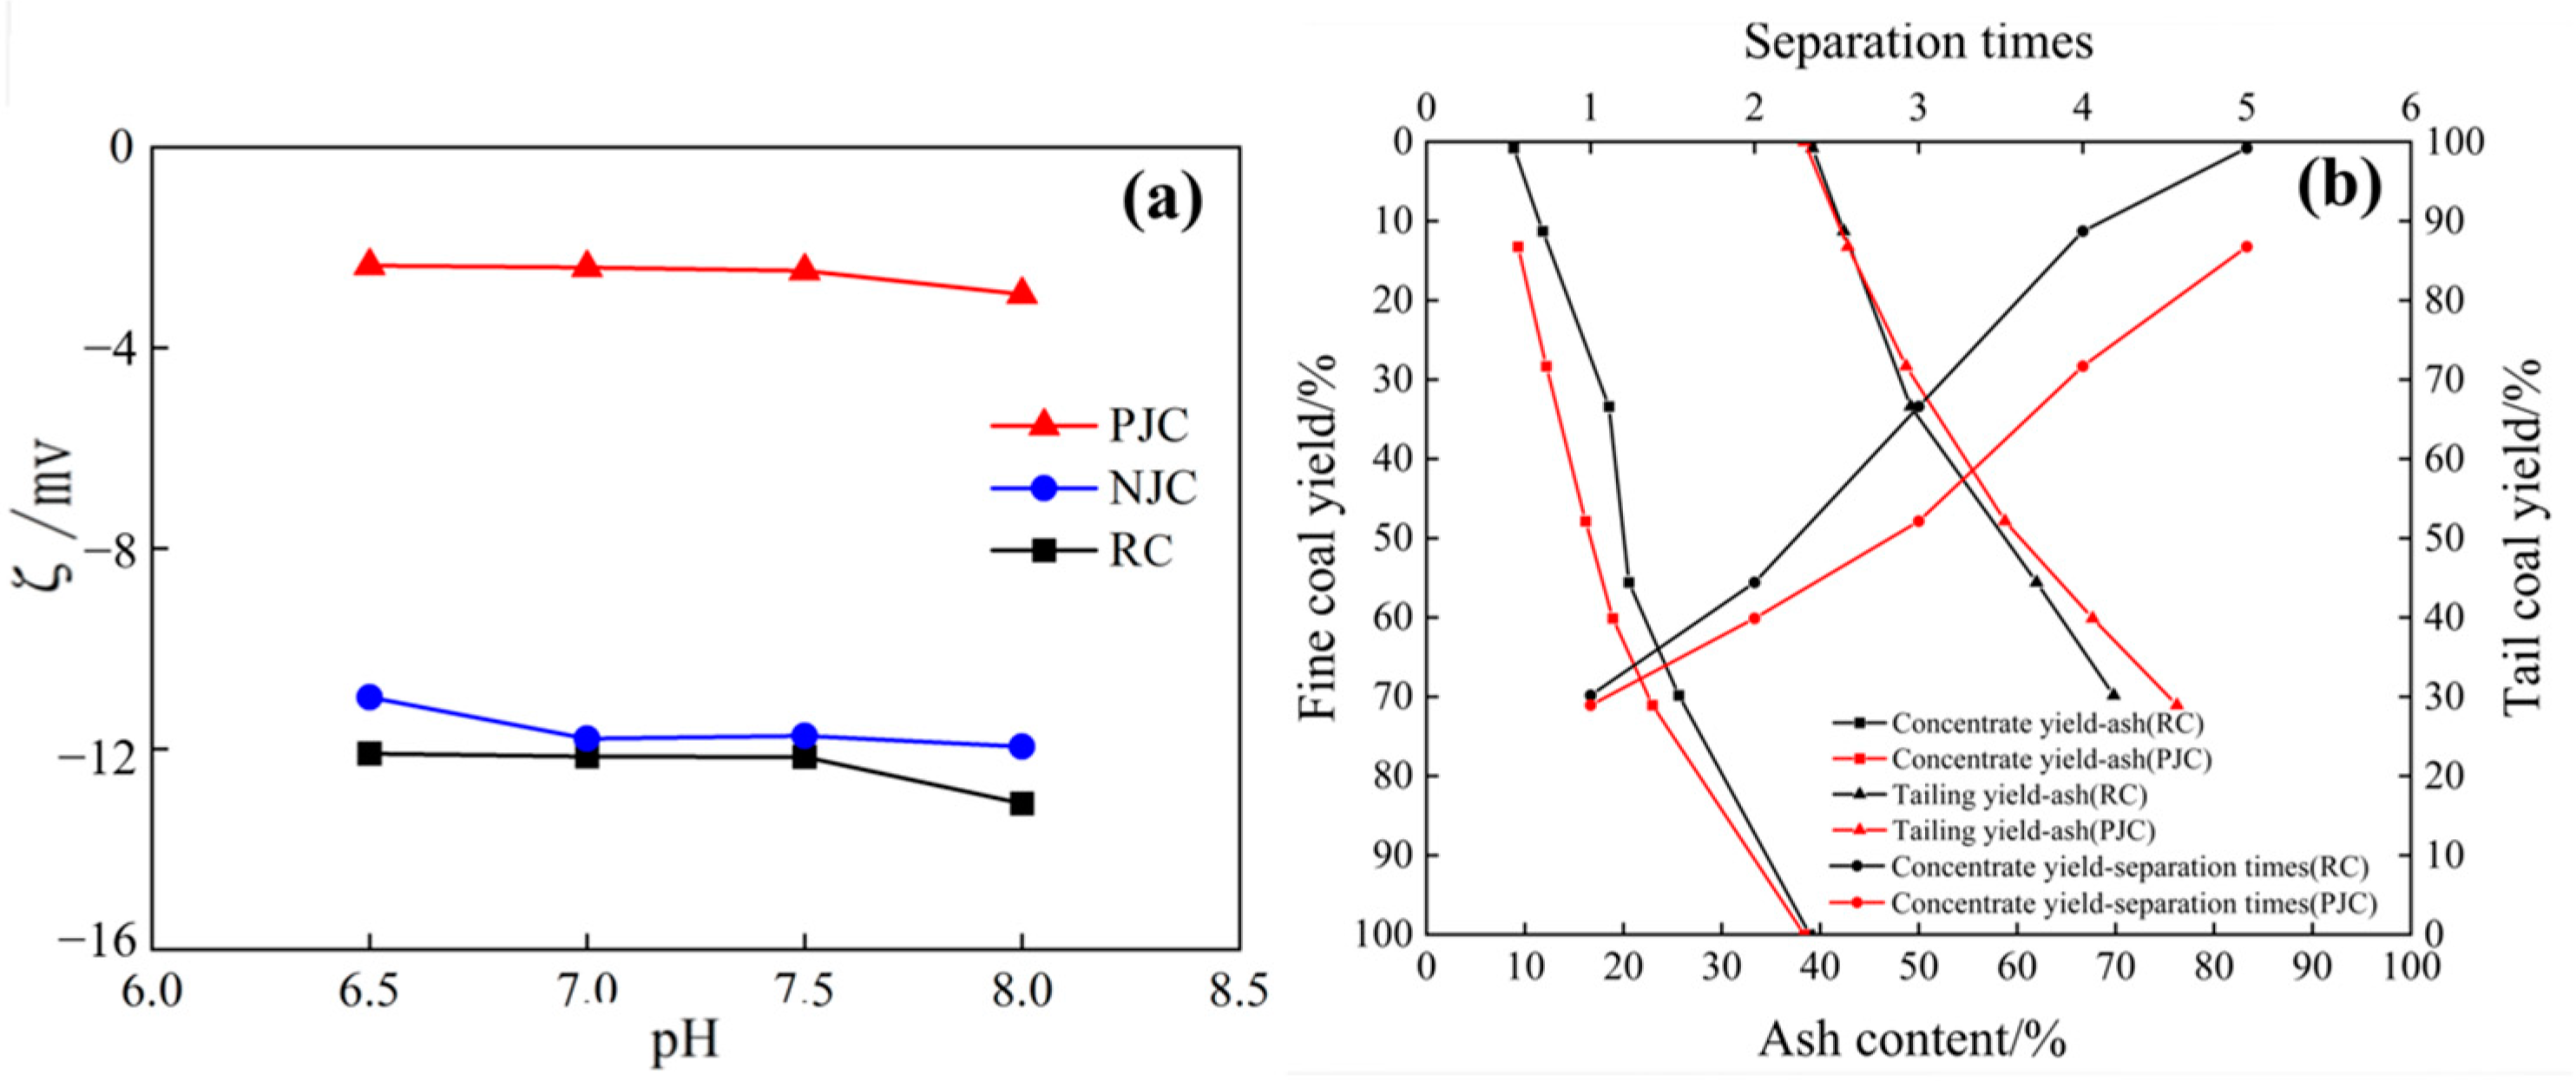
Figure 15a illustrates the difference in electric potential between raw coal and coal that has undergone normal jet pretreatment or pulse jet preparation at the same slurry pH. The electric potential of the normal jet-pretreated coal decreased only slightly compared to the original coal, while that of the pulse jet-prepared coal decreased significantly.
These results were mainly due to the scale of cavitation of the different jet-forming structures. As previously stated, the cavitation jet created by the pulse nozzle generates numerous vacuoles in the slurry flow. This high-speed cavitation jet has a significant impact on the solid surface, resulting in exfoliation [
26], which can affect the surface properties of mineral particles.
Upon comparing the magnitude of the change in electric potential values, it becomes evident that the cavitation region inside the pulse jet nozzle is the most dominant and influential region with respect to the electric potential values of the coal. This is due to the cavitation property, which results in the coal having a lower electric potential. The collapse of vacuoles during coal particle exfoliation enhances hydrophobicity, promoting the adsorption of collecting agents on mineral particle surfaces. This strengthens mineral floatability and improves flotation effectiveness.
Figure 15b presents the results of the stepwise release flotation. The concentrate yield of RC is relatively high at 69.83%, but the ash content of the roughing concentrate is also high at 25.62%. After three rounds of concentration, the ash content of the concentrate decreased to 11.82%, but the concentrate yield dropped to 11.26%. It is worth noting that the floatability of RC is poor. In contrast to RC, the yield of primary roughing concentrate and combustible body recovery increased by 1.23% and 3.86%, respectively, for the PJC. Additionally, the ash content decreased by 2.66%. The concentrate yield of the three selections increased by 17.05%, but the ash content increased by 0.35%. After four concentrations, a concentrate with a yield of 13.22% and ash content of 9.30% was obtained. Furthermore, the tailing yield of PJC flotation was lower than that of RC. Additionally, the ash contents of the tailings were higher than that of RC in each flotation test.
The flotation results demonstrate that pretreatment with a pulse jet can significantly improve the natural floatability of coal, reduce the proportion of hard-to-float coal, and significantly increase the yield of the flotation concentrate with a less negative impact on the quality of the concentrate. The enhancement of coal floatability through the use of the pulse jet is primarily due to the cavitation effect of the pulse structure. As a result, the PJFM is better suited for separating challenging-to-float coal.
3.8.3. Study of the Flotation Rate of the PJFM
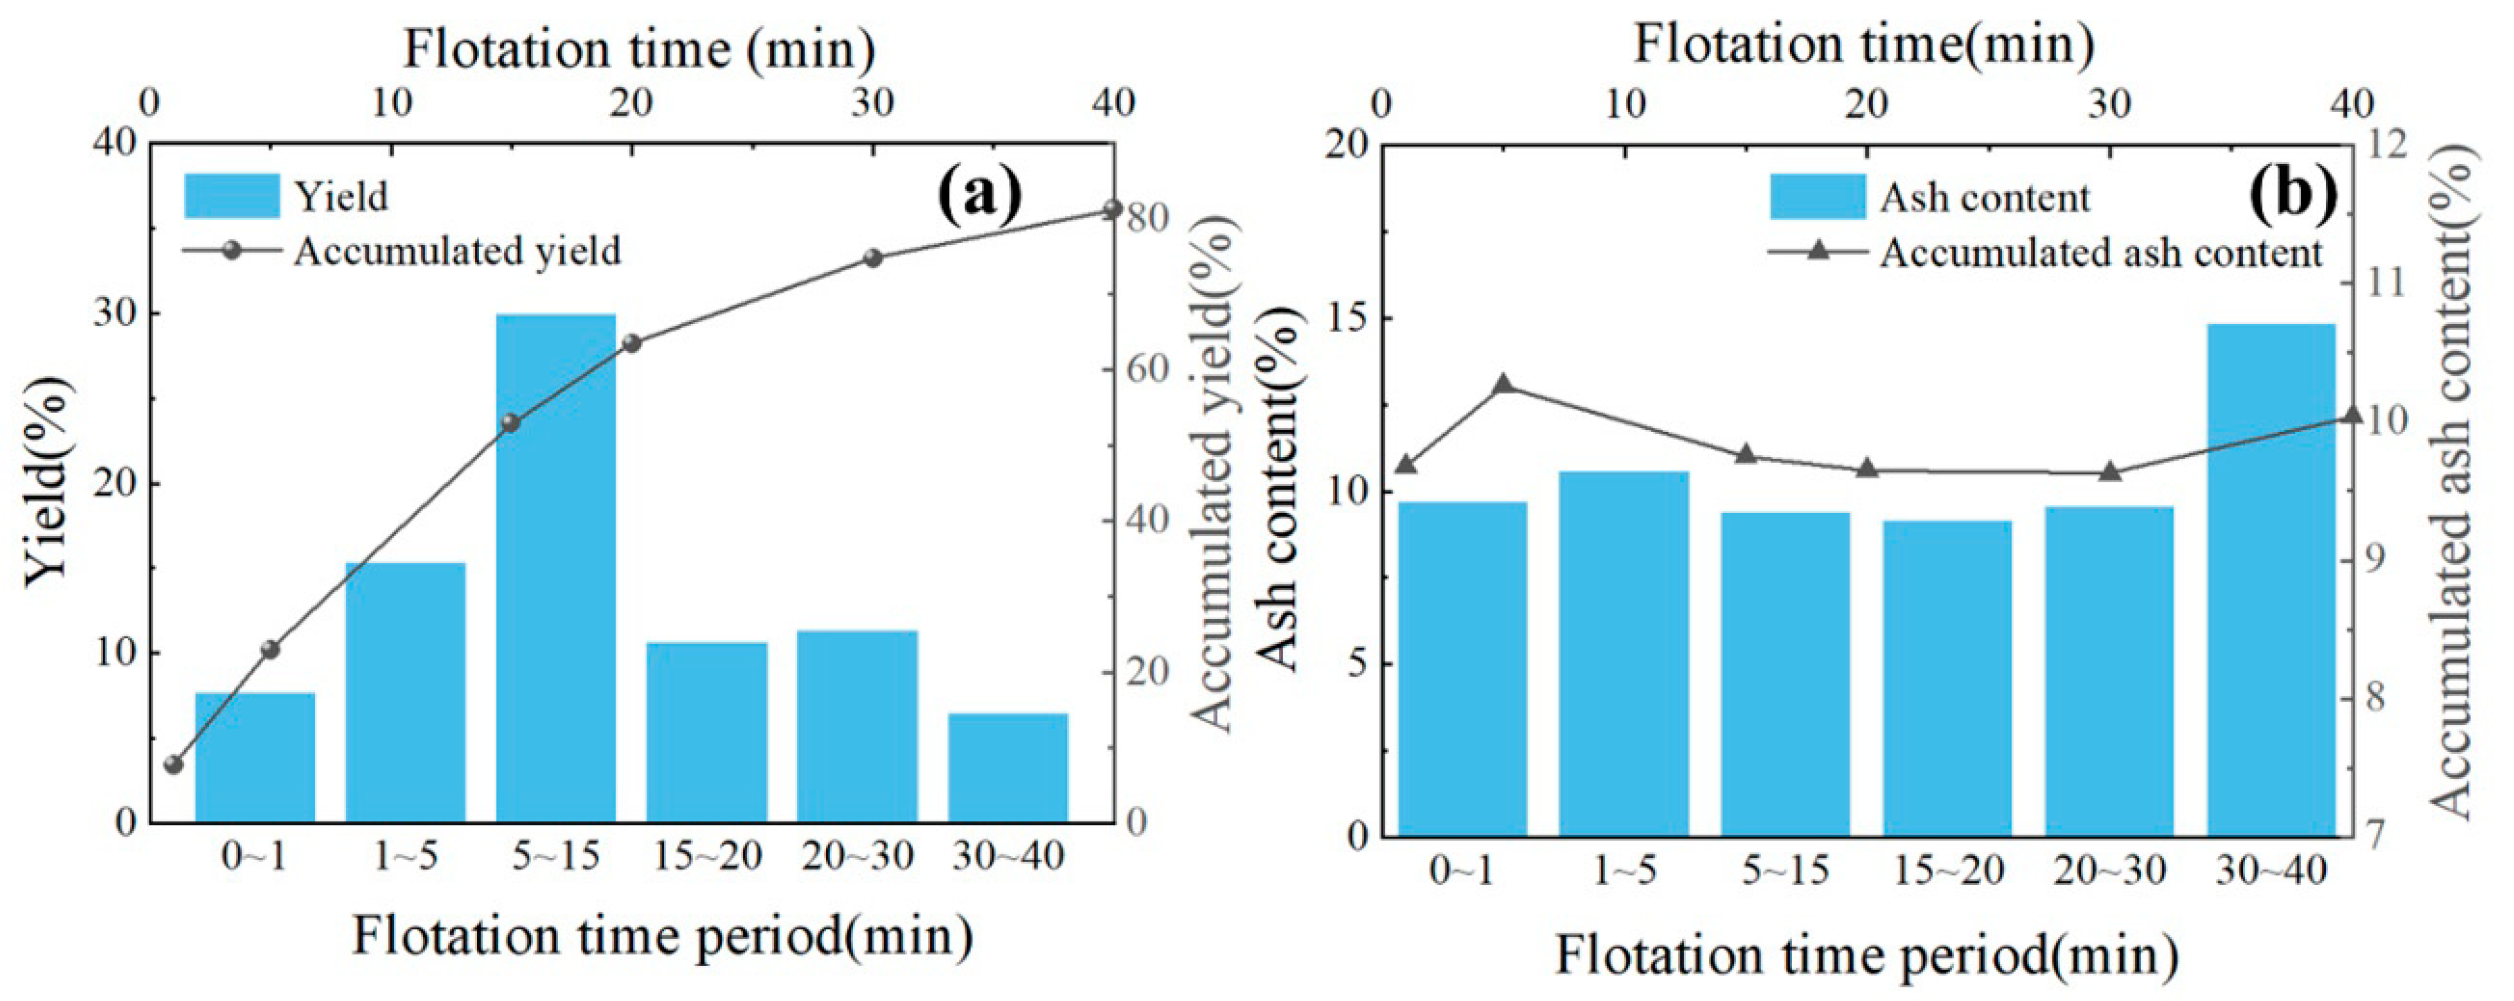
Figure 16 shows the flotation results. Due to differences in particle size, hydrophobicity, and other properties, particles with different sizes exhibit distinct flotation behavior, even with the varying selectivity of the PJFM for each grain size in full-size flotation. To determine how the flotation machine separates each particle size, additional sieving experiments were conducted on refined coal products obtained at various flotation times.
The results of the tests (shown in
Figure 17a) indicate that when the flotation time is 1 min, the predominant particle size in the refined coal products is −0.045 mm with a proportion of 32.24%, and the second particle size is 0.25~0.5 mm with a proportion of 18.79%. When the flotation time was 5 min, the predominant particle size of the refined coal remained 0~0.045 mm with a proportion of 40.38%, and the following particle size was 0.25~0.5 mm with a proportion of 17.11%. This indicates that these two particle categories are floated preferentially and at a rapid rate during the pre-flotation period. When the flotation duration reaches 15 min, the predominant particle size of refined coal products at 5~15 min, 15~20 min, 20~30 min, and 30~40 min is 0.5~0.25 mm, and the proportion of low ash coarse particle size (0.5~1 mm) that is floated out increases.
To further investigate the sorting kinetics of the flotation machine, the flotation behavior of the flotation machine for various particle sizes was investigated based on the above experimental findings.
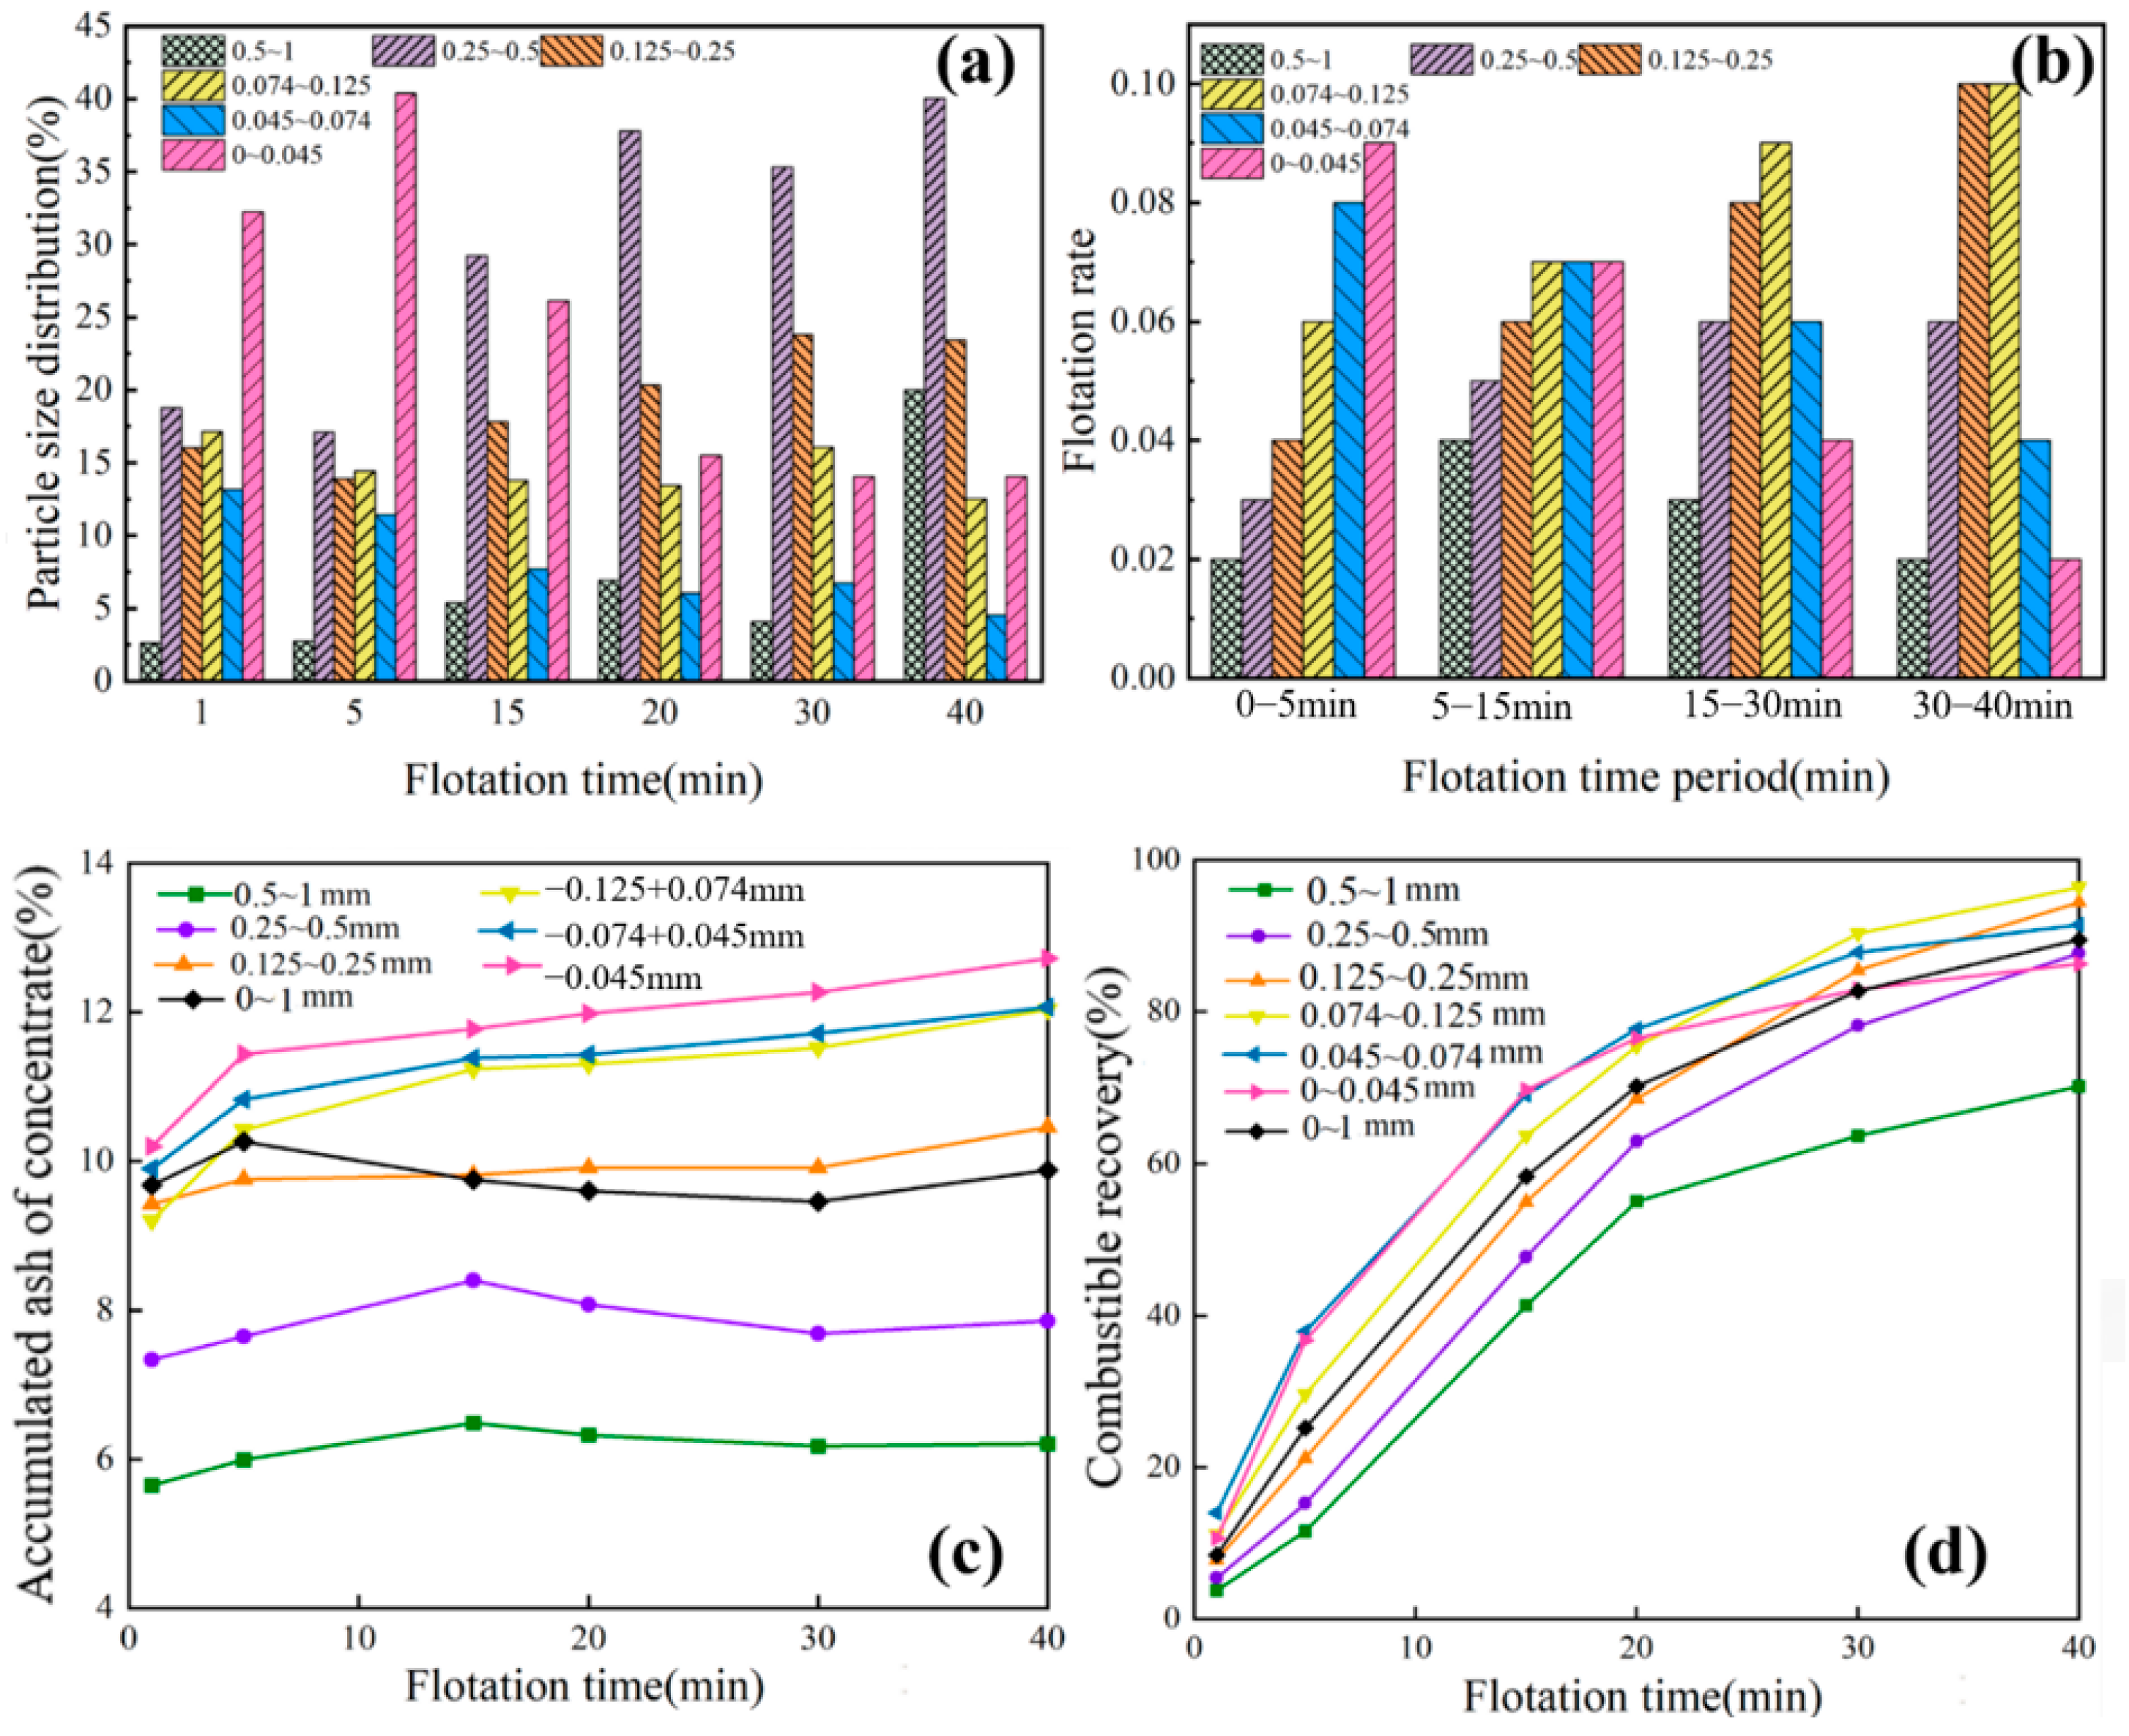
Figure 17c depicts the relationship between flotation rate and flotation time for six combustible grades with narrow particle sizes and variable flotation times. In accordance with
Figure 17a, the flotation time was processed by segmentation analysis in conjunction with coal flotation kinetics, and a first-order kinetic equation was fitted to determine the flotation rate values of different particle grades in different flotation time periods; the results are displayed in
Figure 17b. The flotation rate of fine-grained material decreases with time, whereas the flotation rate of coarse-grained material increases. The 15 min flotation time revealed that fine particle size contributed the most to the rate of volatile body recovery. The above results reveal that the PJFM has a high degree of particle size selectivity. The PJFM balances the flotation of both coarse and fine particles, which is related to the aeration performance, mineralization mode, and bubble size distribution characteristics of the flotation machine, which directly affect the attachment and separation of particles and bubbles [
27,
28,
29,
30].
Figure 17d depicts the cumulative ash content of each grain grade concentrate as a function of flotation time, with the ash content of the complete grain grade concentrate fluctuating around 10%. Within 30 min of flotation, the total ash content of the six narrow grain grades of fine coal is within 12%, particularly for particles larger than 0.5 mm. When the flotation duration exceeds 30 min, the coal quality and ash content of the incoming coal deteriorate, but there is no significant change in the ash content of the refined coal floated at a later stage, indicating that the PJFM is capable of sorting materials with poor coal quality.
4. Conclusions
This study delved into examining the flow field characteristics and flotation performance inherent in a novel PJFM. Its main conclusions are as follows:
The pulse cavity functions as a synthetic jet, combining different jet forms such as a cavitation jet, pulse jet, and rotating jet. This strengthens the characteristics of the jet flow field, enhancing jet coiling, bubble generation, and gas–liquid mixing.
The combination of the axial vortex ring and transverse vortex within the pulse structure, along with cavitation, results in vortex mineralization and cavitation mineralization processes. It increases the probability of contact between bubbles and particles, improving the mineralization efficiency.
When the feed pressure exceeds 0.25 MPa and the aeration rate is higher than 0.8 m3/(m2·min), the aeration uniformity should be higher than 70%. This indicates that the aeration performance of the PJFM is superior to the aeration index of traditional coal flotation machines.
When comparing the pulse nozzle to the normal nozzle, it was found that the pulse jet nozzle produces a higher ratio of fine-sized bubbles despite the dominant bubble sizes being 100–200 μm and 200–300 μm.
The pulse jet method for pretreating coal leads to a significant decrease in electric potential and an increase in floatability. During the initial flotation stage, particles ranging from 0 to 0.045 mm in size exhibit the highest flotation rate. This research will lay the foundation for the large-scale design and industrial application of flotation machines for fine-grained coal sorting.


