Abstract
With the increasing exploitation of mineral resources by humans, exploring non-traditional areas for hidden resources such as deep earth and sediment-covered regions has become a significant challenge in the field of mineral exploration. Geochemical data, as a crucial information carrier of geological bodies, serves as one of the direct and effective sources for quantitative analysis of regional geological evolution and mineralization prediction studies. It plays an indispensable role in geographic information system (GIS)-based mineral exploration. Due to the neglect of spatial distribution characteristics and the variability of statistical features with spatial metrics in traditional statistical methods, this paper employs fractal/multifractal and the local singularity analysis to identify geochemical anomalies from background and characterize geochemical distributions associated with porphyry Cu-Au mineralization in the Duolong mineral district, Tibet, China. A novel algorithm for estimating the singularity index, which takes anisotropy into consideration, is proposed and practically applied to the Duolong district. By comparing with the isotropic singularity index, this new method objectively identifies anisotropic geochemical signatures and investigates non-linear behaviors of ore-forming elements, making it more practical and effective in geo-anomaly extraction. Furthermore, the current method is capable of indicating variations in geochemical distributions at different scales through directional arrows marking analytical windows. The summed-up direction of these multi-scale vectors effectively demonstrates migration trends of ore materials at each location within the study area. The new method can pinpoint the location of ore-forming element accumulation and migration directions, unlocking valuable insights from complex datasets. This promises to revolutionize our understanding of how minerals are formed and distributed within the Earth’s crust.
1. Introduction
Mineral resources are crucial material foundations for maintaining economic and social development and have long been a major concern. However, over the past two decades, as governments and industries continue to invest in mineral exploitation, it has become increasingly difficult to discover new resources that are preserved at alike depths [1]. The practical challenge of discovering new resources in non-traditional exploration territories, such as deep earth and covered areas, is a topic that garners attention from both academia and industry in the field of mineral resource exploration [2,3,4]. With the rapid development of computer-based information technology, geographic information systems (GIS) have become extensively utilized for data management and information processing in geological and mineral exploration [5,6,7]. The capability to identify anomalies associated with mineralization preserved in depth has been greatly improved, and GIS-based prospectivity modeling is now considered a routine operation in mineral exploration [5,8,9,10].
Hydrothermal mineralization is a typical cascade process that involves the migration of hydrothermal fluids bearing minerals through the Earth’s crust, their filling, or metasomatism of fluid and surrounding rock under specific physical and chemical conditions. It ultimately results in the precipitation of minerals within various favorable structures and rocks, as well as the accumulation of certain elements or metals [8,11]. These processes are often accompanied by irregular geological, geochemical, and geophysical signatures known as geo-anomalies [8,12,13,14]. Geochemical signatures associated with mineralization, preserved in exploratory data, often reflect different types of mineralization from their surroundings. As an important geological information carrier in support of mineral exploration, geochemical data that record multi-element concentrations across space can provide a relatively direct indication of the mineral endowment. In the past few decades, various statistical models such as principal component analysis (PCA), multiple regression, and factor analysis [15] have been used to process geochemical exploratory data. These models have made significant contributions in characterizing geochemical patterns and identifying correlations among elemental distributions, which has greatly enhanced our understanding of elemental dispersion processes. According to Tobler’s First Law of Geography [16], geochemical exploratory data are often assumed to have spatial correlation. Based on this assumption, certain methods utilizing space technology such as inverse distance weighting (IDW) [17] have been proposed and effectively utilized in analyzing geochemical data. However, they may be limited in some special cases, such as when there is substantial overlap between background and outliers or weak outliers are hidden within the strong variance of the background [8]. Consequently, it is important to find and/or develop appropriate analytical methods to extract and separate anomalies from complex background fields and practically apply them in the geochemical data processing [18].
Ever since Mandelbrot introduced the idea of fractals to the world back in 1967 [19], it has taken root and flourished throughout a wide range of disciplines. After decades of rapid development, it has now become a crucial branch of nonlinear science. In the field of Earth science, modeling techniques based on fractals/multifractals have been widely discussed and frequently used to explore the nonlinearity of the Earth system. Natural phenomena such as cloud formation [20], rainfall [21], floods [22], landslides [23], and earthquakes [24] can be effectively characterized using fractal/multifractal methods. Magmatic hydrothermal activities in the Earth’s crust, which exhibit nonlinearity [25], can lead to the formation of deposits. This often results in anomalous energy release or accumulation of ore materials within narrow spatial and temporal intervals. Nonlinear methods are therefore suitable for investigating mineralization and its related controlling factors, in order to identify areas with highly concentrated ore materials by characterizing their inherent fractal or multifractal properties [8,26,27,28,29,30]. For example, the grade-tonnage model and the size-frequency distribution of giant deposits are typical fractal methods applied [31].
The advancements in computer science since the 21st century have greatly improved geographic information systems (GIS), enabling more efficient analysis of analytical data within the GIS platform [32]. Various geological exploratory data, such as geological mapping, geochemical analysis, geophysical surveys, and remote sensing information, can be effectively organized and managed within GIS-based geo-databases, and fractal/multifractal methods in support of mineral prospectivity modeling are benefited and more extensively promoted [33,34,35,36]. Starting from the viewpoints of generalized self-similarity and scale invariance, various fractal/multifractal models were proposed and introduced in charactering geo-anomalies informative of mineralization, e.g., concentration-area (C-A) model [6], the spectral-area (S-A) model [37], and local singularity analysis (LSA) [27]. The LSA was proposed by Cheng (2007) [27] and has been applied to characterize mineralization-related geochemical anomalies. Its high efficiency in enhancing and identifying weak anomalies from a high variance of background is due to its good characterization of singular geological events and/or processes. The LSA is a nonlinear method embraced in the GIS environment, which explores singularity by analyzing spatial neighborhood windows. The LSA avoids the problem of assuming globally optimal thresholds that apply to every location, which is a limitation of traditional statistical methods. It has been widely used in geosciences for identifying weak anomalies and enhancing GIS data in various geological conditions [38,39,40]. As previously mentioned, the discovery of mineralization at shallow depths has been widespread and exciting. However, there is a growing expectation for new resources to be found in non-traditional exploration territories. While traditional geo-anomalies can still be effective in locating mineral resources, it is becoming increasingly important to innovate both deep exploration technology and descriptive pattern recognition techniques in order to uncover deeply buried mineral systems. Therefore, in addition to identifying ore material accumulation, fractal/multifractal methods have recently been further developed and focused more on detecting patterns that describe or provide information about deeply buried mineralization.
In this context, the field of fractal/multifractal models has made significant advancements in recent years, due to continuous efforts dedicated to improving these algorithms. By upgrading models and fusing algorithms, there has been progressive improvement in understanding the complexity and precision of mineralization preserved in these mathematical structures [41,42,43,44,45]. Using anisotropy as an example, it represents variations of properties measured along different directions. Anisotropic patterns identified or characterized from various geo-anomalies will be of great benefit to the inversion of mineralization-related knowledge, e.g., fluid migration and ore-controlling structure. In other words, the analytical outputs of fractal/multifractal models aim not only to locate areas with ore material accumulation but also to express the anisotropic nature of geo-anomalies.
In previous studies, the original algorithm of LSA was jointly developed with many other spatial analysis methods. The primary focus of discussion in LSA is the analytical window, which has been integrated with buffer analysis and defined as a series of square windows oriented towards fault segments. A fault-oriented singularity algorithm was proposed to investigate anisotropic geochemical anomalies, based on which new fault properties were derived from the geochemical variation around fault segments [12,46]. The idea of the directional window in LSA was discussed [47,48]. The directions of analytical windows were utilized as a practical representation of anisotropy conducive to pattern interpretation. Furthermore, the original analytical square window was also updated according to intergrade with the algorithm of U statistics. Results derived from new LSA not only well characterize the spatial variation of geo-anomalies but also provide patterns indicative of anisotropy [49,50,51]. Due to the crucial information represented by anisotropic characteristics, this study proposes a new algorithm for detecting anisotropic singularities as a successor to our previous studies [12,48,50,51], which will provide more representation of anisotropic geo-anomalies. A case study in the Duolong mineral district, Tibet, China is demonstrated to characterize Cu and Au geochemical anomalies and informative patterns in support of new discoveries of Cu-Au deposits.
2. Study Area and Datasets
The Duolong copper–gold mineral district located in the Ali district of northwest Tibet, China, about 100 km away from the northwest of Gerze County lies in the western part of the Bangongco–Nujiang suture zone (BNSZ), and the Mesozoic tectonic magmatic arc lies at the southern margin of the southern Qiangtang terrane (Figure 1a). Preliminary conclusions can be inferred from previous studies that the formation of the BNSZ is attributed to the northward subduction of the Bangongco–Nujiang Tethyan Ocean [52,53,54]. The BNSZ spans over 2000 km across the central Tibetan Plateau extending from Bangong Lake in the west to the Nujiang River in the east. This region is primarily composed of a large-scale ophiolite and melange belt, accompanied by near EW folding structures and Yanshanian basic and intermediate-felsic rocks. This area represents the remnants of the Bangongco–Nujiang Tethyan Ocean [55]. The ages of ophiolites and radiolarians in this region suggest the existence of the Bangongco–Nujiang ocean from the Carboniferous to Early Cretaceous [56,57,58,59] which likely underwent closure at approximately 100 Ma [60,61,62].
The Duolong mineral district extends in an east–west direction, spanning approximately 30 km in length and 10 km in width from north to south. It hosts several large and ultra-large porphyry Cu-Au, high-sulfidation epithermal Cu-Au, and gold placer deposits, including the Tegelongnan, Duobuza, Bolong, and Naruo deposits (Figure 1b). The cumulative proven copper reserves in the area exceed 20 million tons, with associated gold resources exceeding 420 tons, indicating a world-class ultra-large copper and gold deposit [63].

Figure 1.
(a)Tectonic framework of the Tibetan Plateau [64]; (b) simplified geological map of the Duolong mineral district [65]. JSSZ: Jinshajiang suture zone; LSLSZ: Longmucuo–Shuanghu–Lancangjiang suture zone; BNSZ: Bangong–Nujiang suture zone; IYZSZ: Indus–Yalung Zangbo suture zone.
The Duolong mineral district is primarily composed of Mesozoic marine sedimentary rock strata, with partially exposed Cenozoic strata. These belong to a set of generally disordered and locally ordered non-Smith strata [66]. The Upper Triassic Riganpeicuo Formation (T3r) only appears as a broken block outcrop on the northeast side of the mine area, representing a set of land shelf shallow marine carbonate constructions. The main lithology consists of tuff for the oldest outcrop unit in the Duolong mineral district. It is overlain by the Lower Jurassic Quse Formation (J1q) and the Middle Jurassic Seva Formation (J2s), which constitute the primary stratigraphic framework of the mine area, serving as the main ore-bearing enclosing rocks in this region. For instance, the Sena and Naruo deposits have been identified as potential sources of mineral resources. However, due to the limited scale and deep-seated nature of ore bodies in the Sena deposit, it poses a significant challenge for exploration efforts [67]. The Quse Formation, occurring predominantly in the central and southwestern regions of the mineralization, represents a subaqueous shelf-basin slope complex composed of clastic lithologies [68], primarily comprising interbedded sandstones, siltstones, and cherts. The Middle Jurassic Seva Formation is generally spreading in the northeastward direction. It consists of a sub-deep-sea shelf-basin slope complex with a clastic-marble-like structure, primarily composed of interbedded sandstones and siltstones. Both Quse and Sewa Formations have undergone low-grade metamorphism from 121 Ma to 115 Ma [69], resulting in the transformation of some siltstone into slate. The Lower Cretaceous Meiriqiecuo Formation (K1m), which is distributed in a linear and punctiform manner within the mineralization area, is a suite of terrestrial calc-alkaline volcanic strata that underwent multiple rotations and eruptions [70]. Its unconformity overlies the Quse and Sewa Formations Jurassic strata and is of great significance to the preservation of the Tiegelongnan deposit after mineralization [71]. The Upper Cretaceous Abushan Formation (K2a) is extensively distributed in the northwest and northeast regions of the mining area. It represents a terrestrial millerite sedimentary assemblage, primarily composed of sandstone, conglomerate, sandstone, and mudstone. It represents a tectonic uplift event on the southern margin of the Qiangtang Massif during the Late Cretaceous, signifying an intracontinental evolutionary stage of crustal thickening in the South Qiangtang Basin during the Late Cretaceous-Paleocene period [70,72,73].
The faults within the Duolong mineral district are well-developed and exhibit characteristics of multiple stages, primarily manifesting in three groups oriented towards the northeast (NE), northwest (NW), and nearly east–west (EW) directions. These faults have effectively segmented the Duolong mineral district into a “diamond” tectonic framework. According to the sequence of fault activity, it can be inferred that the NE and NW faults were formed prior to the EW faults. The EW reverse fault was generated subsequent to the mineralization stage and exerted a destructive influence on the ore body [74].
The magmatic activity in the Duolong ore concentration area is characterized by multi-stage porphyry, gabbro, and diorite intrusions, which are integral to the evolution process of the Bannu Ocean basin. The gabbro is primarily located in the central mining area and extends east-westward in vein-like outcrops. The diorites occur as rock strains within the mine area but have a limited overall distribution. The porphyry body is intimately associated with mineralization in this region and predominantly occurs along NE and NW reverse faults within the Quse or Sewa Formation, with a diagenetic ages range of 116–120 Ma [75]. Volcanic rocks such as basalt, andesite, and basaltic andesite are widely distributed in the Duolong mineral district. These volcanic rocks are unconformably overlying the Jurassic strata, which is of significant importance for the preservation of mineralized ore bodies.
Exploratory datasets, which include geological and geochemical data at a scale of 1:50,000, are currently being utilized. The geochemical data collected from stream sedimentary sampling consist of 3358 samples with a sampling density of 4 samples per square kilometer. Concentration values for 15 trace elements (Cu, Pb, Zn, Cr, Ni, Mn, Ag, Sn, W, Mo, As, Sb, Bi, Hg, Au) were measured. More detailed descriptions of these datasets can be found in Wang et al. [76]. In this study, only the concentrations of the two primary ore elements Cu and Au were analyzed to characterize mineralization anomalies and to demonstrate the application of the proposed method. Table 1 presents a comprehensive compilation of essential statistical parameters derived from the current analysis of Cu and Au geochemical data. The results indicate that the distribution of Cu and Au elements is positively skewed, as evidenced by their median values being less than the corresponding mean values. Raw geochemical data with a skewness greater than zero indicate a non-normal distribution. Furthermore, large coefficients of variation (CV) suggest significant tectonic activity in the study area. In order to investigate the spatial distribution characteristics of Cu and Au elements, four samples were collected in a 1 km area (i.e., one at 0.25 km2). The geochemical data were initially analyzed at a spatial resolution of 0.5 km using the inverse distance weighting method to ensure that only one sample was present in a 0.5 × 0.5 km area.

Table 1.
Descriptive statistics of Duolong data.
3. Methods
3.1. Fractal/Multifractal Theory
Fractal/multifractal models serve as effective tools for characterizing the complex nature of physical processes. The power–law relationship, which follows scale invariance and generalized self-similarity, can be utilized to investigate intricate processes, as evidenced by the end products of singular processes [77,78]. Assuming that there is an object or pattern with irregular shapes, fractal dimension is the parameter effective in characterizing the fractal structure and attribute properties of the object. In general, it can be estimated through the box-counting (BC) method [79]. During the estimation, a series of windows with different scales (εi) are firstly defined. For each window series with scales εi, the number of windows that fully cover the object can be determined as N(εi). A power–law relationship between εi and N(εi) can be expressed as:
where ∝ represents proportionality, c is a constant, and D is the fractal dimension estimated by the box-counting method. The Koch curve, first introduced by Koch in 1904, is a prototypical fractal curve. It is divided into squares as shown in Figure 2. Using the BC method (Table 2), the fractal dimension can be calculated as D = 1.2. Objects with irregular and complex geometry generally exhibit a non-integer (fractal) dimension [80]. Essentially, this means that the intricacy of an object directly correlates with its fractal dimension. In simpler terms, the more intricate and complex an object appears to be, the higher its fractal dimension will be.
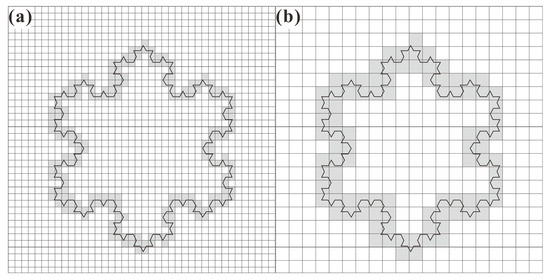
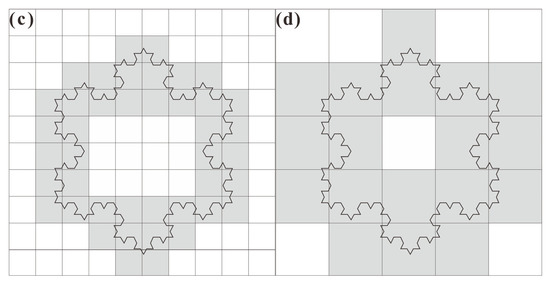
Figure 2.
A sampling process of BC method applied to calculate the fractal dimension of Koch curve. (a) The cell size is 1; (b) the cell size is 2; (c) the cell size is 4; (d) the cell size is 8.
Table 2.
Box size and box numbers of Koch curve.
As a natural extension of the self-similarity measure defined in space by fractal geometric points [81], multifractals can be regarded as fractals where successive fractal dimensional spectra are intertwined in space [82]. The multifractal spectra are frequently employed to characterize multifractals, similar to the use of fractal dimension for characterizing fractals. Different sets of self-similar fractals defined on the same complex pattern can be interrelated by means of the multifractal theory.
Without loss of generality, the modeling is carried out in two dimensions as an example. Assume that in the two-dimensional plane, the i-th box of the mineralizing element with edge length ε has measure μi(ε), and the measure μi(ε) is the total content of that element within the box. Thus, the total content of a local element can be represented by the measure on the i-th box of size. The measure of the grid in space with length ε is μi(ε). Let ε be the length of the i-th box containing a mineralizing element with measure μi(ε), which represents the total content of that element within the box. Therefore, the measure on each i-th box with size ε can represent the total content of a local element. The measure of the space grid with length ε is also μi(ε), and a power–law relation can be expressed as follows.
where αi is called the Coarse Holder exponent (also known as singularity index) [81]. After determining the number of boxes with identical values on the fractal as Nα(ε), a power–law relationship can be observed with respect to the given value of α.
The function f(α) is referred to as the multifractal spectra function, which corresponds to the box dimension with the same α in fractals. Different subsets of α values have different fractal dimensions represented by f(α).
Since the introduction of the first-dimensional spectral function by Halscy et al. [83], a series of methods have been developed for the calculation of the spectral function, e.g., the methods of the partition function, the fractal interpolation, the multifractal trended fluctuation analysis, the empirical mode decomposition, and the wavelet transform modulus maxima [84,85,86]. Among these progresses, the moment method is the one frequently discussed. In order to clarify the distribution characters of f(α), the allocation function χq(ε) needs to be firstly constructed.
where q is an arbitrary real number representing μi(ε) statistical moment order. Negative q serves as an amplifier for smaller content boxes, while positive q accentuates the significance of larger content boxes. If the measure μi(ε) exhibits multifractal properties, then χq(ε) and ε follow a power–law relationship for all values of q.
where τ(q) denotes the mass exponent, a convex function about q, and reaches the maximum curvature at q = 1. It can reveal whether or not multifractality is present. Furthermore, the relationship between the singularity index α and the multifractal spectra f(α) can be obtained through the Legendre transform as
A convex function that resembles a parabola will be shown on the graph by plotting α and f(α), referred to as the multifractal spectra of measures. From the spectra, there are generally four parameters for geological knowledge interpretation [87]. The first parameter is the value of Holder exponent α(q) at q = 0 where f(α) attains its maximum, denoted as α0. The second is the asymmetry index defined as . R > 1 indicates a left-skewed multifractal spectra, implying local enrichment of ore-forming materials. Conversely, R < 1 represents a right-skewed spectrum and corresponds to the local depletion of ore-forming materials. The case of R = 1 indicates a completely symmetric multifractal spectrum. The third is the spectra width denoted as ∆α = αmax − αmin. The wider the curve of f(α), the more heterogeneously distributed the measurements are in space, and vice versa, as indicated by a higher value of ∆α. The fourth parameter is the height of the multifractal spectra, which is denoted as ∆f = f(αmin) − f(αmax). This parameter mainly reflects the difference in proportion between the maximum and minimum subsets of measurements under various scales (ε). When ∆f > 0, the multifractal spectra exhibit a left-skewed shape. It means that as the scale changes, the rate of change in the number of subsets corresponding to the minimum singularity index αmin is slower than that of the maximum singularity index αmax. It indicates an enrichment region at a small scale. When ∆f < 0, the multifractal spectra exhibit a shape. It indicates the rate of change in the number of subsets corresponding to the minimum singularity αmin being faster than that of the maximum singularity index αmax as the scale increases. It results in relatively large areas of enrichment. When ∆f ≈ 0, the multifractal spectra exhibit a symmetrical shape. As the scale changes, the number of subsets corresponding to both the minimum singularity index αmin and maximum singularity index αmax change at a similar rate, indicating that there are regional enrichment and/or deficit at the same scale.
3.2. Local Singularity Analysis
As per the detailed explanation provided by Cheng [8], the LSA is a novel approach to analyzing complex mineralization systems that exhibit singular behavior at certain points or regions. Choosing the two-dimensional geochemical data as an example, the key parameters and singularity index in the local singularity analysis can be derived from the power–law relationship between the total amount of metal substance μ(A) and its concentration c(A).
where A represents the 2D, and c is a constant. α is the singularity index, the value of which can be used to characterize irregular and complex geochemical distribution associated with non-linear mineralization. When α = 2, representing a linear distribution, the concentrations of elements are uniform. A value of α < 2 indicates a gradual decrease in element concentrations from the center to its surroundings, while a positive singularity (α) denotes an enrichment of elements. Conversely, when α > 2, there is a gradual increase in element concentration from the center to its periphery, and this negative singularity implies the depletion of elements.
In practice, the most commonly utilized approach for estimating the singularity index is the square window-based algorithm proposed by Cheng and Agterberg (1996) (Figure 3) [28]. Initially, a series of square windows with varying sizes (Ai = εi2) is defined as centered on a specific location. By plotting the window sizes εi and their corresponding concentrations C[A(εi)] on a log–log graph, one can estimate the singularity index based on the slope (k = α − 2) of the linear relation between εi and C[A(εi)]. By implementing these steps throughout the area, it is possible to delineate the spatial distribution of singularity indices and characterize qualitative and quantitative variations in geochemical distributions.
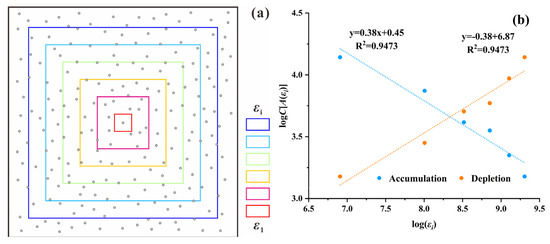
Figure 3.
Schematic diagram of the square window-based singularity mapping method. (a) Set of square windows with various sizes (εi) at a sample location; (b) log–log graph of window sizes (εi) and concentrations C[A(εi)] to estimate singularity index [51].
3.3. Anisotropic Singularity Algorithm
As previously discussed, the analytical window is a square shape that exhibits isotropic properties rather than anisotropic. While it remains effective in identifying target areas with ore material accumulation, it may not be suitable for more delicate investigations. Therefore, building upon our previous research, the current study presents a novel anisotropic singularity index estimation algorithm based on practical application in the Duolong mineral district, Tibet, China. A general estimation process (Figure 4) includes the following:
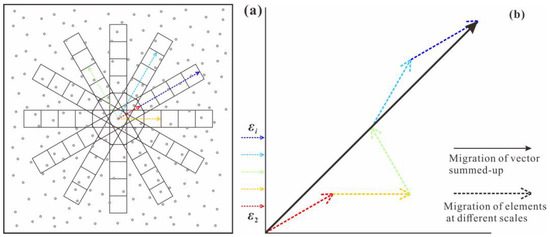
Figure 4.
The anisotropic singularity estimation algorithm. (a) An estimation process; (b) different scale migration of vector summed-up.
- (1)
- Select a representative sample as the centroid and designate the initial rectangular window as A1 (A = ε1 × ε1, where ε1 can be any length depending on scales of analyzed exploratory data). Subsequently, generate a sequence of rectangular windows extending northward from the original window with sizes of ε1 × εi (where εi can be defined by practical application scenarios);
- (2)
- At each scale εi, firstly orient the rectangular window in the north direction (0°), and then rotate the azimuth at an interval. The interval (0°–360°) is predefined depending on the scales of analyzed data as well. Calculate average elemental concentrations within each directional windows C[A(εi)].
- (3)
- As geochemical behaviors such as accumulation and depletion cannot be predetermined prior to analysis, both the maximum and minimum element concentrations within their corresponding rotation window and azimuths at each scale are selected. This results in two (i.e., maximum and minimum) sets of determined element concentrations.
- (4)
- At each scale, plot the concentrations C[A(εi)] and window sizes εi corresponding to the sets of maximum and minimum on a log–log plot, respectively. The slopes k on the log–log graph can be estimated by the least squares method. Among the slopes at all scales, the one with the largest absolute value is chosen to estimate the anisotropic singularity index, k = α − 1.
- (5)
- In contrast to the isotropic singularity estimation algorithm, the new method represents the azimuths of selected windows at each scale as vectors with arrows (from low to high concentration), effectively illustrating multi-scale migration trends of elements. Additionally, these vectors at each scale can be summed to comprehensively depict anisotropic geochemical behaviors of geochemical distributions.
- (6)
- Similar to the square window-based algorithm, the aforementioned steps are executed for every location within the entire study area, thereby generating a spatial distribution of the singularity index across the space.
4. A Case Study in the Duolong Mineral District
4.1. Geochemical Distributions of Ore Elements
The geochemical data for Cu and Au elements were initially interpreted as grid maps using the inverse distance weighted method (IDW). The resulting geochemical distributions effectively demonstrated that most of the geochemical anomalies are consistent with occurrences of discovered deposits such as Duobuza, Naruo, etc. However, there are still some deposits located in areas with weak anomalies. After reviewing the distribution maps of Cu and Au (Figure 5), several observations can be made. Firstly, the Cu anomalies align roughly along the NE trend and distributed in close proximity to the NE trending faults within the mineralization area. This is consistent with the extent of porphyry bodies exposed in this region, indicating that intrusion and fracture tectonics play important roles in influencing mineralization. The distribution of Au anomalies is sporadic and lacks significant enrichment on a large scale, indicating weak overall mineralization potential compared to Cu. Quaternary sediments to the south of the district exhibit high levels of Au enrichment, likely influenced by weathered and transported flood deposits. Enrichment in both Cu and Au in the Naruo and other zones suggests that this area represents a deposit associated with both metals.
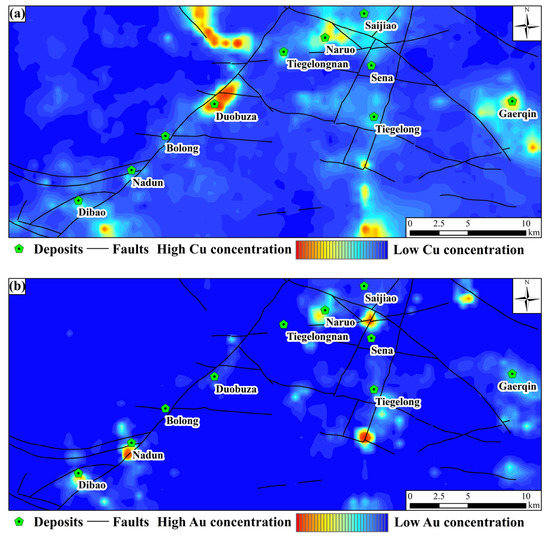
Figure 5.
Geochemical distributions of ore elements interpolated by IDW: (a) Cu and (b) Au.
4.2. Multifractal Analysis
The analysis of multifractals typically involves selecting a range of moments q centered on zero, which serve as weighting factors to amplify the distinct contributions of singularities. In this study, the moment range is defined from −10 to 10. Building upon the aforementioned introduction, the multifractal spectra for Cu and Au elements in the study area can be obtained (Figure 6).
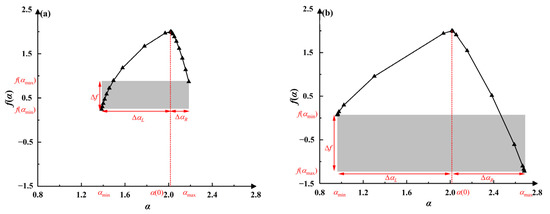
Figure 6.
Multifractal spectra of ore elements: (a) Cu and (b) Au.
The complexity of the multifractal spectra can be represented as a four-component vector (α(0), R, ∆α, and ∆f(α)) (Table 3) [88]. The spatial distribution of Cu and Au elements in the study area exhibits multifractality. They all exhibit asymmetrically up-convex curves, indicating varying degrees of local superposition in the geochemical distributions of ore metals. The α(0) values of these two elements exhibit only minor fluctuations around the Euclidean dimension 2 of the plane, indicating their similarity. The other three parameters, R, ∆α, and ∆f(α), are further investigated to interpret the geochemical distributions of ore elements and their associations. There are two parameter characteristics that may indicate the presence of various geological processes leading to local patterns of enrichment or deficit. Geochemists are primarily interested in multifractal spectra that exhibit significant left-skewed deviations and large widths. The values of R for both Au and Cu elements exceed 1, indicating an asymmetric pattern of the multifractal spectra with a left-skewed distribution for both elements. The values of Cu elements are significantly higher than those of Au elements, with the latter exhibiting a more pronounced left-skewness. This suggests that Cu is preferentially enriched in this region while Au is predominantly present in weakly enriched zones. These findings are consistent with the observed distribution patterns of Cu and Au concentrations within this area. Compared to Cu, Au exhibits a broader multifractal spectra width ∆α and a positive ∆f value, indicating a higher likelihood of being enriched with a relatively narrow range. Joint interpretation of the aforementioned three parameters suggests that Cu is only enriched over a large area, while Au exhibits significant super-enrichment in a localized region.
Table 3.
Characteristic parameters of multifractal spectra of Cu and Au distributions for symmetrical moment range (−10 ≤ q ≤ 10).
4.3. Anisotropic Singularity
As previously mentioned, the implementation of the currently proposed anisotropic singularity algorithm in the study area encompasses the following:
- (1)
- By selecting a geochemical sampling location, the initial rectangular window is designated as A1 (A = ε1 × ε1, ε1 = 1 km). Subsequently, a series of northward trending rectangular windows are defined with dimensions of ε1 × εi (εi = 1 km, 2 km, 3 km, 4 km, 5 km, and 6 km) (where εi ranges from 1 to 6 km);
- (2)
- At each scale εi, a window rotation interval of 10° is defined to count the average elemental concentrations within directional windows C[A(εi)];
- (3)
- The maximum and minimum sets of element concentrations can be determined from all directional windows;
- (4)
- The anisotropic singularity index can be estimated in a similar manner as the aforementioned steps;
- (5)
- Vectors with arrows are used to mark all azimuths of selected windows at each scale, which are then summed up to represent the anisotropic migration and/or distributions of ore elements;
- (6)
- By implementing these steps at all sampling locations, the anisotropic nature of ore elements can be depicted in both grid and vector forms, revealing spatial variations.
The anisotropic singularity index interpolation maps exhibit greater continuity and aggregation compared to the isotropic singularity index map which displays dispersion and point-like shapes (Figure 7 and Figure 8). Additionally, it demonstrates improved predictive accuracy with a significant number of positive singularity indices in the northwestern region of mineralization concentration, indicating the higher potential for mineralization in this area.
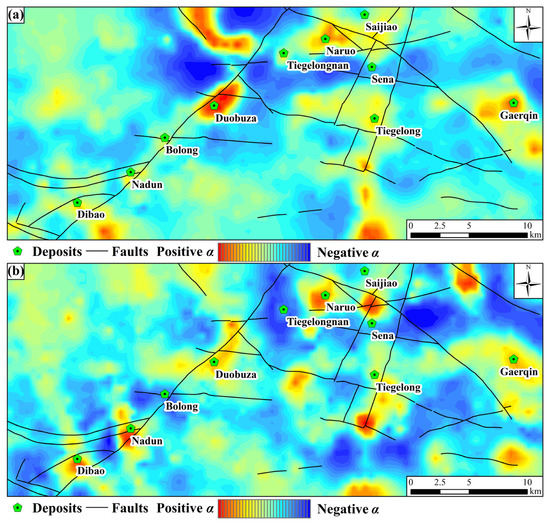
Figure 7.
Singularity patterns of (a) Cu and (b) Au obtained using the square window-based method.
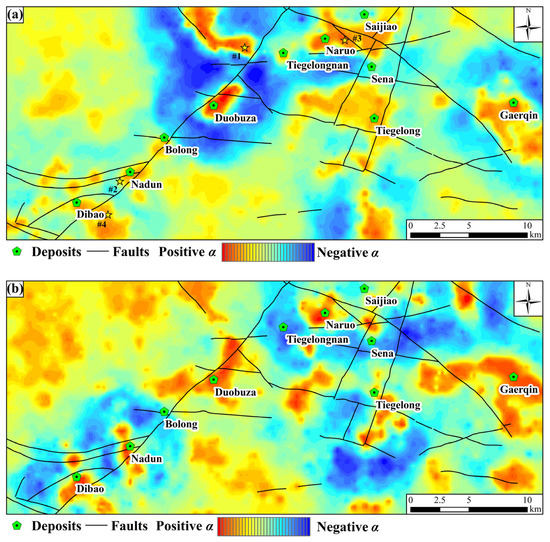
Figure 8.
Singularity patterns of (a) Cu and (b) Au obtained using the anisotropic window-based method.
The anisotropic singularity not only provides stronger ideation but also enhances the overall quality of analysis. Each sampling location is assigned an anisotropic direction, which indicates the final migration direction of ore materials. This direction is determined by fitting the window’s direction selected at different scales using the vector summed-up method (Figure 4b), as previously mentioned. If the singularity index α is less than 1 (α < 1) at a given sample location, it indicates enrichment of ore elements in the local area, with changing behavior from high to low as one moves towards the sample location from outside (Figure 9). Conversely, if α is greater than 1 (α > 1), there is a loss of elements at that location, and the variation in ore element behavior changes from low to high as one moves away from the sample location. The novel approach emphasizes the impact of fracture tectonics and magmatic rocks on the geochemical behavior of ore elements by considering the anisotropic nature of mineralization. For the low-temperature copper element, both forward and backward arrows effectively demonstrate that mineralization is primarily controlled by NE trending faults. Additionally, enrichment patterns (indicated by red arrows) are located at fault intersections. The NW trending faults predominantly intersect the depletion patterns (indicated by blue arrows), indicating their post-mineralization origin and dominance in the fracturing and/or reconstruction of ore deposits within this region. That provides compelling evidence for the significance of the proposed anisotropic singularity estimation method in delineating mineralization-related geochemical fields and elucidating elemental transport pathways. The locations with Cu-Au mineralization potentials in the Duolong mineral district are delineated by enrichment patterns of ore elements, which spatially match discovered deposits and outcropped porphyries at the intersection of NE and NW trending faults. This coincidence supports previous geological knowledge that mineralization in this district is highly associated with a mesh-like fault system with a rhombus shape. It is also predicted that the southern and northwestern of the district may have similar potentials for mineralization. Most of discovered mineral deposits including Duobuza, Nadun, Dibao, and Garqin are located in areas with positive singularity values while the Tiegelongnan and Sena are situated in areas of negative ones. The presence of volcanic strata, specifically the Meiriqiecuo formation, not only aids in the preservation of the Tiegelongnan deposit but also obstructs positive geochemical anomalies [71]. Due to the small scale and deep burial of ore bodies in the Sena deposit [67], the current analysis of geochemical data collected from secondary media may not effectively identify its affected areas. Therefore, while the current algorithm is effective in narrowing down the target area, limitations in the analyzed data (i.e., geo-information carrier) are also evident.
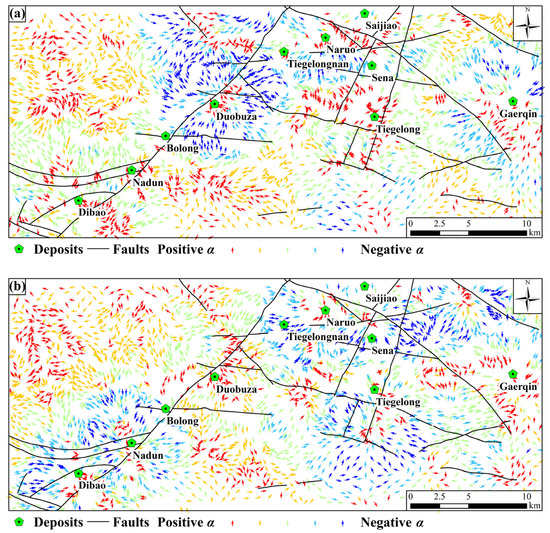
Figure 9.
Migration directions of ore elements based on anisotropic singularity indices of (a) Cu and (b) Au.
4.4. Results and Discussion
The anisotropic nature of ore-forming materials has been characterized based on the presented isotropic and anisotropic singularity patterns. To further demonstrate the superiority of this new algorithm, four sampling locations are currently selected for demonstration (Figure 8a). As illustrated in these four multi-scale anisotropic windows and arrows (Figure 10), the dominant migration pathways of ore metals at various scales can be visually delineated. Within smaller analytical windows, the arrows indicating the migration of ore materials exhibit greater irregularity and complexity (Figure 11). Conversely, larger analytical windows with higher εi values yield more stable arrow trends and interpretable migration patterns, indicative of regional factors dominating and influencing migration at higher scales. In other words, arrow patterns at higher scales are more appropriate for representing and indicating the migration of ore materials associated with mineralization in the district.
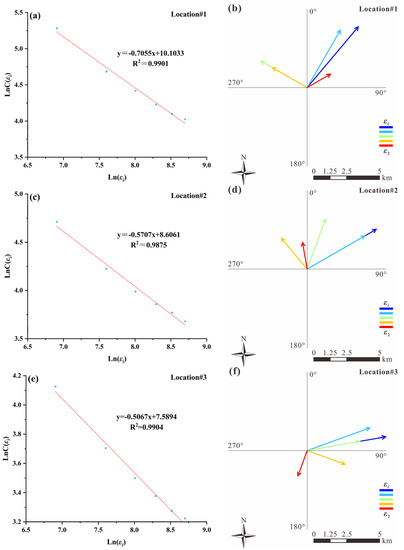
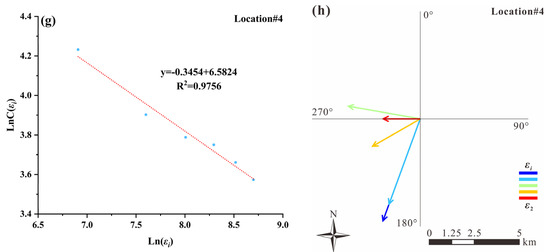
Figure 10.
Log–log graphs and multi-scale elliptical windows for estimating singularity indices of Cu at the four locations marked in Figure 8a: (a,b) Location#1; (c,d) Location#2; (e,f) Location#3; and (g,h) Location#4.
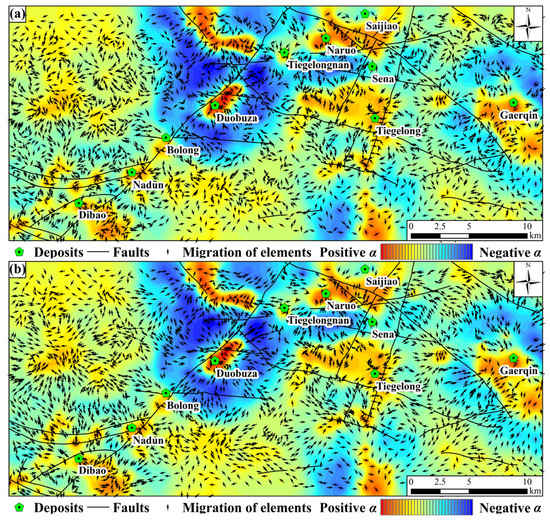
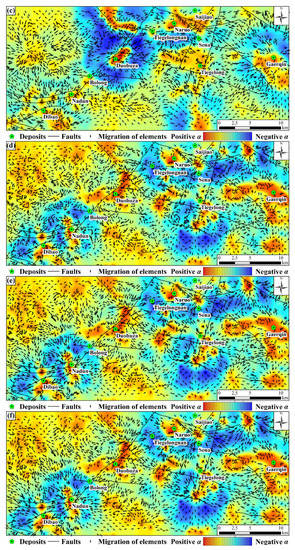
Figure 11.
Migration directions of ore elements based on different scales windows and the base map are obtained using the anisotropic window-based method. (a) Cu of 2000 m; (b) Cu of 4000 m; (c) Cu of 6000 m; (d) Au of 2000 m; (e) Au of 4000 m; (f) Au of 6000 m.
As the current exploratory geochemical data are derived from sediment samples, it is theoretically founded that geochemical halos can record and preserve variations of ore materials caused by mineralization. However, these halos should be regarded as a projection of buried geological information onto the surface, and the geochemical samples are often subjected to weathering and leaching. In essence, the ore-forming elements within the orebodies were redistributed and infiltrated into soils, stream sediments, and other third-party media. As a result, the preserved geo-information associated with mineralization is often weakened and difficult to identify without advanced geochemical anomaly extraction methods. It is crucial to bear in mind that such data offer indirect indications that may be subject to external influences, such as the correlation between negative singularity indices and the Tiegelongnan and Sena deposits (Figure 11). Therefore, it is noteworthy that lithogeochemical data can accurately depict the factual variations of ore elements through primary halos. Future research could consider sampling media containing faults, joints, and fractures to facilitate the migration and precipitation of hydrothermal fluids bearing ores.
5. Summary and Conclusions
This paper explores the distribution of ore-forming elements and their interrelationships through multifractal analysis. During the lengthy geological evolution, geochemical fields have inevitably undergone various degrees of multi-stage and multi-phase geological processes or other natural modification processes that result in inherent fractal and/or multifractal natures. As a powerful tool for characterizing variations in geochemical distributions, the multifractal spectra play a crucial role in revealing the statistical properties across different scales and investigating the spatial patterns of geochemical distributions. The asymmetry index of R plays a crucial role in assessing the mineralization potential of an area. When R > 1, the left-hand side opening is larger than the right-hand side, indicating that the high-content value fraction exhibits greater variation in mean density than the low-content fraction across different sub-regions, thereby promoting enrichment mineralization. The value range of multifractal spectra can assess the potential of mineralization. The higher value indicates a more dispersed distribution of elements that is favorable for mineralization. Both geochemical distributions of Cu and Au in the Duolong mineral district exhibit mineralization-favored patterns. Further interpretation of parameters through multifractal analysis reveals that Cu elements are weakly enriched at a regional scale, while Au elements are highly enriched at a local scale.
A novel singularity index estimation algorithm that accounts for anisotropy is proposed in this paper and practically applied to characterize spatial variations of ore-forming elements in the Duolong mineral district, Tibet, China. It not only enhances the identification of weak anomalies, but also characterizes changes in geochemical distributions. By summing up the directions with the most significant variation at different scales, it is possible to determine the migration direction of ore-forming elements. The results indicate that NE trending faults are the main controlling structures for mineralization in the study area, and intersections between NE and NW faults are favorable locations for mineralization. The new anisotropic singularity method serves as a reliable indicator for tracking the source of ore materials and predicting mineralization potential. Ultimately, these methods can pinpoint the location of ore-forming element accumulation and migration directions, unlocking valuable insights from complex datasets. This promises to revolutionize our understanding of how mineral resources are formed and distributed within the Earth’s crust.
Author Contributions
Writing—original draft, J.T. and W.W.; writing—review and editing, W.W.; data analysis, J.T., W.W. and C.Y. All authors have read and agreed to the published version of the manuscript.
Funding
This research was funded by the National Natural Science Foundation of China, grant number 41822206 and 41772353.
Data Availability Statement
Not applicable.
Acknowledgments
The authors sincerely thank three anonymous reviewers for their critical reviews and constructive comments which have improved the manuscript.
Conflicts of Interest
The authors declare no conflict of interest.
References
- Chen, H.Y.; Zhang, J.L. What is the Future Road for Mineral Exploration in the 21st Century? J. Earth Sci. 2022, 33, 1328–1329. [Google Scholar] [CrossRef]
- Agterberg, F.P. Aspects of Regional and Worldwide Mineral Resource Prediction. J. Earth Sci. 2021, 32, 279–287. [Google Scholar] [CrossRef]
- Zhao, P.D.; Chen, Y.Q. Digital Geosciences and Quantitative Mineral Exploration. J. Earth Sci. 2021, 32, 269–275. [Google Scholar] [CrossRef]
- Chen, H.Y.; Cheng, J.M.; Zhang, J.L. Multidimensional study of ore deposits: Current status and future prospects. Bull. Geol. Sci. Technol. 2022, 41, 1–4. [Google Scholar]
- Carranza, E.J.M. Geochemical anomaly and mineral prospectivity mapping in GIS. Handbook of Exploration and Environmental Geochemistry; Elsevier: Amsterdam, The Netherlands, 2008; Volume 11, 351p. [Google Scholar]
- Cheng, Q.M.; Agterberg, F.P.; Ballantyne, S.B. The separation of geochemical anomalies from background by fractal methods. J. Geochem. Explor. 1994, 51, 109–130. [Google Scholar] [CrossRef]
- Wang, W.L.; Zhao, J.; Cheng, Q.M. Analysis and integration of geo-information to identify granitic intrusions as exploration targets in southeastern Yunnan District, China. Comput. Geosci. 2011, 37, 1946–1957. [Google Scholar] [CrossRef]
- Cheng, Q.M. Mapping singularities with stream sediment geochemical data for prediction of undiscovered mineral deposits in Gejiu, Yunnan Province, China. Ore Geol. Rev. 2007, 32, 314–324. [Google Scholar] [CrossRef]
- Cheng, Q.M.; Zhao, P.D. Singularity theories and methods for characterizing mineralization processes and mapping geo-anomalies for mineral deposit prediction. Geosci. Front. 2011, 2, 67–79. [Google Scholar] [CrossRef]
- Wang, W.L.; Zhao, J.; Cheng, Q.M.; Zhang, S.Y. Spatially quantitative characterization of geological processes associated with polymetallic Sn-W mineralization in the Malipo mineral district, Southeastern Yunnan, China. Ore Geol. Rev. 2017, 91, 1147–1161. [Google Scholar] [CrossRef]
- Wang, W.L.; Zhao, J.; Cheng, Q.M.; Carranza, E.J.M. GIS-based mineral potential modeling by advanced spatial analytical methods in the southeastern Yunnan mineral district, China. Ore Geol. Rev. 2015, 71, 735–748. [Google Scholar] [CrossRef]
- Wang, W.L.; Zhao, J.; Cheng, Q.M. Fault trace-oriented singularity mapping technique to characterize anisotropic geochemical signatures in Gejiu mineral district, China. J. Geochem. Explor. 2013, 134, 27–37. [Google Scholar] [CrossRef]
- Wang, W.L.; Zhao, J.; Cheng, Q.M.; Liu, J.T. Tectonic-geochemical exploration modeling for characterizing geo-anomalies in southeastern Yunnan district, China. J. Geochem. Explor. 2012, 122, 71–80. [Google Scholar] [CrossRef]
- Zhao, P.D. Theory and Practice of Geoanomaly in Mineral Exploration; China University of Geosciences Press: Wuhan, China, 1999. [Google Scholar]
- Eklundh, L.; Singh, A. A comparative analysis of standardized and unstandardized principal components analysis in remote sensing. Int. J. Remote Sens. 1993, 14, 1359–1370. [Google Scholar] [CrossRef]
- Tobler, W.R. A Computer Movie Simulating Urban Growth in the Detroit Region. Econ. Geogr. 1970, 46, 234–240. [Google Scholar] [CrossRef]
- Lam, N.S.N. Spatial interpolation methods: A review. Am. Cartogr. 1983, 10, 129–149. [Google Scholar] [CrossRef]
- Wei, J.H. Preliminary discussion on the theory of ore-forming field and its significant role for mineral exploration. Bull. Geol. Sci. Technol. 2020, 39, 114–129. [Google Scholar]
- Mandelbrot, B.B. How long is the coast of britain? Statistical self-similarity and fractional dimension. Science 1967, 156, 636–638. [Google Scholar] [CrossRef]
- Schertzer, D.; Lovejoy, S.; Schmitt, F.; Chigirinskaya, Y.; Marsan, D. Multifractal cascade dynamics and turbulent intermittency. Fractals-Interdiscip. J. Complex Geom. Nat. 1997, 5, 427–471. [Google Scholar] [CrossRef]
- Veneziano, D.; Furcolo, P. Multifractality of rainfall and scaling of intensity-duration-frequency curves. Water Resour. Res. 2002, 38, 42-1–42-12. [Google Scholar] [CrossRef]
- Malamud, B.D.; Turcotte, D.L.; BARTON, C.C. The 1993 Mississippi River Flood: A One Hundred or a One Thousand Year Event? Environ. Eng. Geosci. 1996, 2, 479–486. [Google Scholar] [CrossRef]
- Malamud, B.D.; Turcotte, D.L.; Guzzetti, F.; Reichenbach, P. Landslide inventories and their statistical properties. Earth Surf. Process. Landf. 2004, 29, 687–711. [Google Scholar] [CrossRef]
- Turcotte, D.L. Fractals and Chaos in Geology and Geophysics; Cambridge University Press: Cambridge, UK, 1997. [Google Scholar]
- Wang, W.L.; Zhao, J.; Cheng, Q.M. Nonlinearity. In Encyclopedia of Mathematical Geosciences; Daya Sagar, B.S., Cheng, Q., McKinley, J., Agterberg, F., Eds.; Springer International Publishing: Cham, Switzerland, 2021; pp. 1–6. [Google Scholar]
- Agterberg, F.P. Multifractal modeling of the sizes and grades of giant and supergiant deposits. Int. Geol. Rev. 1995, 37, 1–8. [Google Scholar] [CrossRef]
- Cheng, Q.M. Multifractal imaging filtering and decomposition methods in space, Fourier frequency, and eigen domains. Nonlinear Process. Geophys. 2007, 14, 293–303. [Google Scholar] [CrossRef]
- Cheng, Q.M.; Agterberg, F.P. Multifractal modeling and spatial statistics. Math. Geol. 1996, 28, 1–16. [Google Scholar] [CrossRef]
- Mandelbrot, B.B. Multifractal measures, especially for the geophysicist. Pure Appl. Geophys. 1989, 131, 5–42. [Google Scholar] [CrossRef]
- Cheng, Q.M.; Agterberg, F.P. Singularity analysis of ore-mineral and toxic trace elements in stream sediments. Comput. Geosci. 2009, 35, 234–244. [Google Scholar] [CrossRef]
- Turcotte, D.L. Fractals in petrology. Lithos 2002, 65, 261–271. [Google Scholar] [CrossRef]
- Bonham-Carter, G.F. Geographic Information Systems for Geoscientists: Modelling with GIS, Computer Methods in the Geosciences, 1st ed; Pergamon: New York, NY, USA, 1994. [Google Scholar]
- Agterberg, F.P. Multifractals and geostatistics. J. Geochem. Explor. 2012, 122, 113–122. [Google Scholar] [CrossRef]
- Cheng, Q.M. Multifractality and spatial statistics. Comput. Geosci. 1999, 25, 949–961. [Google Scholar] [CrossRef]
- Carranza, E.J.M. Geocomputation of mineral exploration targets. Comput. Geosci. 2011, 37, 1907–1916. [Google Scholar] [CrossRef]
- Porwal, A.; Carranza, E.J.M. Introduction to the Special Issue: GIS-based mineral potential modelling and geological data analyses for mineral exploration. Ore Geol. Rev. 2015, 71, 477–483. [Google Scholar] [CrossRef]
- Cheng, Q.M.; Xu, Y.; Grunsky, E. Multifractal power spectrum–area method for geochemical anomaly separation. Nat. Resour. Res 2000, 9, 43–51. [Google Scholar] [CrossRef]
- Cheng, Q.M. Singularity theory and methods for mapping geochemical anomalies caused by buried sources and for predicting undiscovered mineral deposits in covered areas. J. Geochem. Explor. 2012, 122, 55–70. [Google Scholar] [CrossRef]
- Zhang, D.J.; Cheng, Q.M.; Agterberg, F.P.; Chen, Z.J. An improved solution of local window parameters setting for local singularity analysis based on Excel VBA batch processing technology. Comput. Geosci. 2016, 88, 54–66. [Google Scholar] [CrossRef]
- Zuo, R.G.; Wang, J.L. ArcFractal: An ArcGIS Add-In for Processing Geoscience Data Using Fractal/Multifractal Models. Nat. Resour. Res. 2020, 29, 3–12. [Google Scholar] [CrossRef]
- Chen, G.X.; Huang, N.; Wu, G.P.; Luo, L.; Wang, D.T.; Cheng, Q.M. Mineral prospectivity mapping based on wavelet neural network and Monte Carlo simulations in the Nanling W-Sn metallogenic province. Ore Geol. Rev. 2022, 143, 104765. [Google Scholar] [CrossRef]
- Chen, G.X.; Cheng, Q.M.; Puetz, S. Special Issue: Data-Driven Discovery in Geosciences: Opportunities and Challenges. Math. Geosci. 2023, 55, 287–293. [Google Scholar] [CrossRef]
- Cheng, Q.M. Fractal Calculus and Analysis for Characterizing Geoanomalies Caused by Singular Geological Processes. J. Earth Sci. 2021, 32, 276–278. [Google Scholar] [CrossRef]
- Cheng, Q.M.; Chen, Y.Q.; Zuo, R.G. Preface to the Special Issue on Digital Geosciences and Quantitative Exploration of Mineral Resources. J. Earth Sci. 2021, 32, 267–268. [Google Scholar] [CrossRef]
- Zhang, Z.J.; Kusky, T.; Gao, M.; Cheng, Q.M. Spatio-temporal analysis of big data sets of detrital zircon U-Pb geochronology and Hf isotope data: Tests of tectonic models for the Precambrian evolution of the North China Craton. Earth-Sci. Rev. 2023, 239, 104372. [Google Scholar] [CrossRef]
- Xiao, F.; Chen, J.G.; Hou, W.S.; Wang, Z.H.; Zhou, Y.Z.; Erten, O. A spatially weighted singularity mapping method applied to identify epithermal Ag and Pb-Zn polymetallic mineralization associated geochemical anomaly in Northwest Zhejiang, China. J. Geochem. Explor. 2018, 189, 122–137. [Google Scholar] [CrossRef]
- Li, Q.M.; Liu, S.H.; Liang, G.H. Anisotropic singularity and application for mineral potential mapping in GIS environments. Prog. Geophys. 2005, 20, 1015–1020. [Google Scholar]
- Wang, W.L.; Cheng, Q.M.; Zhang, S.Y.; Zhao, J. Anisotropic singularity: A novel way to characterize controlling effects of geological processes on mineralization. J. Geochem. Explor. 2018, 189, 32–41. [Google Scholar] [CrossRef]
- Cheng, Q.M. Spatial and scaling modelling for geochemical anomaly separation. J. Geochem. Explor. 1999, 65, 175–194. [Google Scholar] [CrossRef]
- Wang, W.L.; Zhu, M.Q. Anisotropy of geochemical distributions characterized by irregular window-based local singularity analysis. Geochem.-Explor. Environ. Anal. 2022, 22. [Google Scholar] [CrossRef]
- Wang, W.L.; Zhu, M.Q.; Zhao, J.; Chen, Z.J.; Cheng, Q.M. Joint Modeling Based on Singularity Mapping and U-statistical Methods for Geo-Anomaly Characterization. Nat. Resour. Res. 2022, 31, 1909–1923. [Google Scholar] [CrossRef]
- Li, J.X.; Qin, K.Z.; Li, G.M.; Richards, J.P.; Zhao, J.X.; Cao, M.J. Geochronology, geochemistry, and zircon Hf isotopic compositions of Mesozoic intermediate-felsic intrusions in central Tibet: Petrogenetic and tectonic implications. Lithos 2014, 198, 77–91. [Google Scholar] [CrossRef]
- Zhu, D.C.; Li, S.M.; Cawood, P.A.; Wang, Q.; Zhao, Z.D.; Liu, S.A.; Wang, L.Q. Assembly of the Lhasa and Qiangtang terranes in central Tibet by divergent double subduction. Lithos 2016, 245, 7–17. [Google Scholar] [CrossRef]
- Metcalfe, L. Gondwana dispersion and Asian accretion: Tectonic and palaeogeographic evolution of eastern Tethys. J. Asian Earth Sci. 2013, 66, 1–33. [Google Scholar] [CrossRef]
- Zhu, D.C.; Zhao, Z.D.; Niu, Y.L.; Dilek, Y.; Hou, Z.Q.; Mo, X.X. The origin and pre-Cenozoic evolution of the Tibetan Plateau. Gondwana Res. 2013, 23, 1429–1454. [Google Scholar] [CrossRef]
- Fan, J.J.; Li, C.; Xie, C.M.; Wang, M. Petrology, geochemistry, and geochronology of the Zhonggang ocean island, northern Tibet: Implications for the evolution of the Banggongco-Nujiang oceanic arm of the Neo-Tethys. Int. Geol. Rev. 2014, 56, 1504–1520. [Google Scholar] [CrossRef]
- Shi, R.D. SHRIMP dating of the Bangong Lake SSZ-type ophiolite: Constraints on the closure time of ocean in the Bangong Lake-Nujiang River, northwestern Tibet. Chin. Sci. Bull. 2007, 52, 936–941. [Google Scholar] [CrossRef]
- Pan, G.T.; Wang, L.Q.; Li, R.S.; Yuan, S.H.; Ji, W.H.; Yin, F.G.; Zhang, W.P.; Wang, B.D. Tectonic evolution of the Qinghai-Tibet Plateau. J. Asian Earth Sci. 2012, 53, 3–14. [Google Scholar] [CrossRef]
- Wang, B.D.; Wang, L.Q.; Chung, S.L.; Chen, J.L.; Yin, F.G.; Liu, H.; Li, X.B.; Chen, L.K. Evolution of the Bangong-Nujiang Tethyan ocean: Insights from the geochronology and geochemistry of mafic rocks within ophiolites. Lithos 2016, 245, 18–33. [Google Scholar] [CrossRef]
- Baxter, A.T.; Aitchison, J.C.; Zyabrev, S.V. Radiolarian age constraints on Mesotethyan ocean evolution, and their implications for development of the Bangong-Nujiang suture, Tibet. J. Geol. Soc. 2009, 166, 689–694. [Google Scholar] [CrossRef]
- Liu, W.L.; Xia, B.; Zhong, Y.; Cai, J.X.; Li, J.F.; Liu, H.F.; Cai, Z.R.; Sun, Z.L. Age and composition of the Rebang Co and Julu ophiolites, central Tibet: Implications for the evolution of the Bangong Meso-Tethys. Int. Geol. Rev. 2014, 56, 430–447. [Google Scholar] [CrossRef]
- Zhang, K.J.; Zhang, Y.X.; Tang, X.C.; Xia, B. Late Mesozoic tectonic evolution and growth of the Tibetan plateau prior to the Indo-Asian collision. Earth-Sci. Rev. 2012, 114, 236–249. [Google Scholar] [CrossRef]
- Tang, J.X.; Song, Y.; Wang, Q.; Lin, B.; Yang, C.; Guo, N.; Fang, X.; Yang, H.H.; Wang, Y.Y.; Gao, K.; et al. Geological Characteristics and Exploration Model of the Tiegelongnan Cu (Au-Ag) Deposit: The First Ten Million Tons Metal Resources of a Porphyry-epithermal Deposit in Tibet. Acta Geosci. Sin. 2016, 37, 663–690. [Google Scholar]
- Zhang, T.Y.; Deng, J.H.; Wang, M.; Li, C.; Zhang, L.P.; Sun, W.D. Geochemistry and genesis of the Nadun Nb-enriched arc basalt in the Duolong mineral district, western Tibet: Indication of ridge subduction. Geosci. Front. 2022, 13, 101283. [Google Scholar] [CrossRef]
- Wang, M.; Xie, C.M.; Fan, J.J. 1:50000 Regional Surveys in Duobuza, Gaize County, Tibet; Geological Survey and Research Institute of Jilin University: Changchun, China, 2016. [Google Scholar]
- Li, G.M.; Duan, Z.M.; Liu, B.; Zhang, H.; Dong, S.L.; Zhang, L.J. The discovery of Jurassic accretionary complexes in Duolong area, northern Bangong Co -Nujiang suture zone, Tibet, and its geologic significance. Geol. Bull. China 2011, 30, 1256–1260. [Google Scholar]
- Gao, K.; Tang, J.X.; Fang, X.; Zhang, Z.; Wang, Q.; Yang, H.H.; Wang, Y.Y.; Feng, J. Geological and Geochemical Characteristics and Significance of the Sena Cu-Au Deposit from Duolong Ore-concentration Area, Tibet, China. Acta Mineral. Sin. 2016, 36, 199–207. [Google Scholar]
- Li, Y.B.; Zhong, W.T.; Guo, J.C.; Qin, Z.P.; Zhang, Z.; Li, J.L.; Deng, S.Q.; Li, Y.C. Petrogenesis of igneous rocks and ore_forming material source of the Nating porphyry Cu (Au) deposit in the western section of the Bangong Co-Nujiang metallogenic belt, Tibet. Acta Petrol. Sin. 2019, 35, 1717–1737. [Google Scholar]
- Li, J.; Qin, K.; Li, G.; Xiao, B.; Zhao, J.; Chen, L. Magmatic-hydrothermal evolution of the Cretaceous Duolong gold-rich porphyry copper deposit in the Bangongco metallogenic belt, Tibet: Evidence from U-Pb and 40Ar/39Ar geochronology. J. Asian Earth Sci. 2011, 41, 525–536. [Google Scholar] [CrossRef]
- Wang, Q.; Tang, J.X.; Chen, Y.C.; Hou, J.F.; Li, Y.B. The metallogenic model and prospecting direction for the Duolong super large copper (gold) district, Tibet. Acta Petrol. Sin. 2019, 35, 879–896. [Google Scholar] [CrossRef]
- Yang, H.H.; Wang, Q.; Li, Y.B.; Lin, B.; Song, Y.; Wang, Y.Y.; He, W.; Li, H.W.; Li, S.; Li, J.L.; et al. Geology and mineralization of the Tiegelongnan supergiant porphyry-epithermal Cu (Au, Ag) deposit (10 Mt) in western Tibet, China: A review. China Geol. 2022, 5, 136–159. [Google Scholar]
- Geng, Q.R.; Zhang, Z.; Peng, Z.M.; Guan, J.L.; Zhu, X.P.; Mao, X.C. Jurassic-Cretaceous granitoids and related tectono-metallogenesis in the Zapug-Duobuza arc, western Tibet. Ore Geol. Rev. 2016, 77, 163–175. [Google Scholar] [CrossRef]
- Song, Y.; Yang, H.H.; Lin, B.; Liu, Z.B.; Wang, Q.; Gao, K.; Yang, C.; Fang, X. The preservation system of epithermal deposits in South Qiangtang terrane of central Tibetan Plateau and its significance: A case study of the Tiegelongnan superlarge deposit. Acta Geosci. Sin. 2017, 38, 659–669. [Google Scholar]
- Liu, Z.B.; Wang, W.L.; Song, Y.; Wang, Q. Geo-information extraction and integration of ore-controlling structure in the Duolong ore concentration area of Tibet. Acta Petrol. Sin. 2017, 38, 803–812. [Google Scholar]
- Wei, S.G.; Song, Y.; Tang, J.X.; Liu, Z.B.; Wang, Q.; Lin, B.; Feng, J.; Hou, L.; Dan, Z.; Wang, X. Geochronology, geochemistry, Sr-Nd-Hf isotopic compositions, and petrogenetic and tectonic implications of Early Cretaceous intrusions associated with the Duolong porphyry-epithermal Cu-Au deposit, central Tibet. Int. Geol. Rev. 2018, 60, 1116–1139. [Google Scholar] [CrossRef]
- Wang, W.L.; Cheng, Q.M.; Tang, J.X.; Pubuciren; Song, Y.; Li, Y.B.; Liu, Z.B. Fractal/multifractal analysis in support of mineral exploration in the Duolong mineral district, Tibet, China. Geochem. Explor. Environ. Anal. 2017, 17, 261–276. [Google Scholar] [CrossRef]
- Xie, S.Y.; Ke, X.Z.; Huang, K.J.; Cheng, Q.M.; Bao, Z.Y. Evaluation of ore-forming potential by fractal/multifractal analysis. Geochim. Et Cosmochim. Acta 2010, 74, A1157. [Google Scholar]
- Zuo, R.G.; Wang, J. Fractal/multifractal modeling of geochemical data: A review. J. Geochem. Explor. 2016, 164. [Google Scholar] [CrossRef]
- Russell, D.A.; Hanson, J.D.; Ott, E. Dimension of Strange Attractors. Phys. Rev. Lett. 1980, 45, 1175–1178. [Google Scholar] [CrossRef]
- Mandelbrot, B.B. The Fractal Geometry of Nature; W.H. Freeman and Company: New York, NY, USA, 1983; Volume 495. [Google Scholar]
- Evertsz, C.J.G.; Mandelbrot, B.B. Multifractal Measures. Chaos Fractals 1992, 1992, 922–953. [Google Scholar]
- Stanley, H.E.; Meakin, P. Multifractal phenomena in physics and chemistry. Nature 1988, 335, 405–409. [Google Scholar] [CrossRef]
- Halsey, T.C.; Jensen, M.H.; Kadanoff, L.P.; Procaccia, I.; Shraiman, B.I. Fractal measures and their singularities: The characterization of strange sets. Phys. Rev. A 1986, 33, 1141–1151. [Google Scholar] [CrossRef]
- Ai, T.; Zhang, R.; Zhou, H.W.; Pei, J.L. Box-counting methods to directly estimate the fractal dimension of a rock surface. Appl. Surf. Sci. 2014, 314, 610–621. [Google Scholar] [CrossRef]
- Bashan, A.; Bartsch, R.; Kantelhardt, J.W.; Havlin, S. Comparison of detrending methods for fluctuation analysis. Phys. A Stat. Mech. Its Appl. 2008, 387, 5080–5090. [Google Scholar] [CrossRef]
- Xie, H.P.; Wang, J.A.; Kwasniewski, M.A. Multifractal characterization of rock fracture surfaces. Int. J. Rock Mech. Min. Sci. 1999, 36, 19–27. [Google Scholar] [CrossRef]
- Cheng, Q.M. Generalized binomial multiplicative cascade processes and asymmetrical multifractal distributions. Nonlinear Process. Geophys. 2014, 21, 477–487. [Google Scholar] [CrossRef]
- Xie, S.Y.; Bao, Z.Y. Fractal and multifractal properties of geochemical fields. Math. Geol. 2004, 36, 847–864. [Google Scholar] [CrossRef]
Disclaimer/Publisher’s Note: The statements, opinions and data contained in all publications are solely those of the individual author(s) and contributor(s) and not of MDPI and/or the editor(s). MDPI and/or the editor(s) disclaim responsibility for any injury to people or property resulting from any ideas, methods, instructions or products referred to in the content. |
© 2023 by the authors. Licensee MDPI, Basel, Switzerland. This article is an open access article distributed under the terms and conditions of the Creative Commons Attribution (CC BY) license (https://creativecommons.org/licenses/by/4.0/).