Abstract
Several techniques, such as chemical methods and inductively coupled plasma mass spectrometry (ICP-MS), are available to accurately determine element content. However, they are time-consuming, labor-intensive, or expensive. Portable X-ray fluorescence spectrometry (pXRF) can be applied in various scenarios, with significantly higher efficiency and cost-effectiveness than laboratory methods. However, it also has limitations such as lower detection capability, relatively high detection limits, and lower accuracy than laboratory methods. In this study, we focused on applying pXRF to determine the elemental content of sediment samples and investigate its use in mineral exploration. A variety of factors influencing the results of pXRF analysis were analyzed. Our results showed that pXRF could detect more than 30 elements in stream sediments. The reliability of pXRF’s measurements was affected by factors such as the kind of element, sediment particle size, sample grinding treatment, count time, averaged element content, standard deviation of content, and range of content variation. The combination of pXRF analysis and laboratory analysis of partial samples is adequate for establishing a multi-element content inference equation. With this equation, it is possible to effectively infer the content gradient of elements, which will provide valuable support for mineral resource exploration.
1. Introduction
Stream sediment is one of the most commonly used sampling media in mineral resource exploration and environmental scientific research [1,2,3] since they represent large areas and particularly reflect the element background within specific catchment basins. The International Association of Geochemistry for Exploration conducted extensive research and discussion around sampling media and when conducting large-scale geochemical surveys across many countries, stream sediment was the most widely used sampling medium [4,5,6]. However, in areas with poorly developed water systems, such as deserts, particularly the Gobi desert, stream sediment is not an effective sampling medium. Correspondingly, lag materials or rock debris are used as the sampling medium instead [7]. Some scholars believe that stream sediment cannot represent the situation in the source area, whereas more scholars think that stream sediment is a good medium [8,9]. Stream sediment has been identified as the main sampling medium in China’s national geochemical mapping project [10]. Thus far, China’s geochemical exploration has covered more than 6.5 million square kilometers. Based on these geochemical exploration data, several geochemical anomalies have been discovered, which has prompted the discovery of several deposits [11]. This example supports the use of stream sediment samples to explore mineral resources effectively.
Considering geochemical anomalies in mineral exploration, not all areas with large-scale element anomalies and high anomaly intensity have valuable mineral resources. Scholars have found through statistical analysis that a small percentage of all geochemical anomaly areas confirmed by field exploration contain valuable mineral deposits, whereas most other geochemical anomaly areas do not contain any discovered deposits [12]. This finding may be due to low sampling density or insufficient attention paid to the field exploration of geochemical anomalies. This situation has long troubled exploration geologists. To verify the large number of geochemical anomalies based on low-density geochemical sampling, conducting more detailed field investigations of each anomalous area is necessary. One effective method is to collect more samples from the anomalous areas and perform element content analysis. The more samples collected, the better. However, analyzing the element content of multiple samples is very costly. In addition, mineral resource exploration itself is a high-risk investment activity characterized by large investments, long-term cycles, high risks, and high potential returns. Therefore, analyzing the element content of multiple samples from anomalous areas is often impractical. However, pXRF makes this seemingly impractical method feasible. pXRF has been used in mineral resource exploration [13,14] and environmental evaluation [15,16], and many other fields. It can analyze sample types including rock [17,18], soil [19,20,21], plants [22,23], bone [24], alloys [25], artworks [26,27], etc. Stream sediment is the most commonly used sample medium in mineral resource exploration. However, there are few studies on the use of pXRF in analyzing stream sediment. In addition, in situ measurements were not conducted in the field due to our focus on the investigation of various factors influencing the results of pXRF analysis, rather than direct field application. Instead, a comprehensive laboratory analysis of the application effectiveness of pXRF in analyzing stream sediments was conducted. In this study, we aimed to provide methodological guidance for verifying geochemical anomalies.
2. Materials and Methods
2.1. Sample Collection and Processing
The stream sediment samples in this study were collected from three different areas. Table 1 shows basic information about the three sampling areas.

Table 1.
Basic information about samples.
The Hatu study area is located northwest of the Junggar Basin, Xinjiang, about 80 km from Karamay City. It is an important area for gold resources in Xinjiang, and the largest gold deposit in the area is the Hatu gold deposit. According to 1:200,000 geochemical exploration data, multiple element anomalies such as Au, Cu, and As are found in this area [28]. The sediment samples used in this study were collected from natural valleys around the Hatu gold mine, covering an area of approximately 70 square kilometers. The Moyu study area is located in the Southern Tarim basin of Xinjiang, about 60 km from Hetian City. Due to the limited number of samples involved in the 1:200,000 geochemical exploration work in this area, only a few samples were available. No obvious geochemical anomalies were found based on these limited samples. To further understand the mineralization potential of this area, fieldwork was conducted on a sampling area covering approximately 100 square kilometers. The Hongliutan study area is located deep in the Kunlun mountain, about 150 km from Hetian City. Huge lithium mineral resource potential has been discovered in this area in recent years [29]. According to geochemical analysis data in the area, there are also lithium anomalies. To clarify the dispersion and migration of multiple elements such as lithium in the lithium mining area and downstream sediment samples, we conducted a field investigation. All of the samples were obtained from valleys downstream of the known lithium mines. Although pXRF cannot be used to measure elements with smaller atomic masses, such as lithium, it measuring major elements and some trace elements in these samples using pXRF is still possible. Therefore, we used these samples in this study.
Samples from the three areas were directly collected from the inside bend of the stream backflow at the bottom of the natural valleys, where coarse and fine materials were concentrated. The samples were placed in polyethylene plastic bags.
2.2. Analyzing Method by pXRF
After sample collection, natural air drying took place indoors. The stream sediments were then sieved into four different particle sizes using a set of sieves. In this study, these four particle size samples were referred to as par1, par2, par3, and par4, with particle diameters (d) of d > 380 μm, 150 μm < d < 380 μm, 75 μm < d < 150 μm, and d < 75μm, respectively. Each sample of different particle sizes was placed in a polyethylene self-sealing bag. All samples were placed on a sample testing platform. An energy-dispersive pXRF (Thermo Fisher Scientific Niton XL3t 950 GOLDD+; Waltham, MA, USA) was used to analyze the samples. The instrument’s analysis mode was set to ore copper and zinc. Based on the distribution of various element contents obtained by pXRF analysis, some samples were selected from stream sediment samples. For each selected sample, the pXRF analysis time was set to 40 s, 80 s, 120 s, and 160 s, respectively, to obtain element content data for each sample. Consequently, multi-element content data from different particle size samples under different analysis test times were obtained.
2.3. Laboratory Analysis Method
The selected samples were entrusted to a professional third-party analytical laboratory and ground using a grinder until the particle size was <75 μm. The content of other elements was determined using inductively coupled plasma mass spectrometry (ICP-MS, Agilent 7900, agilent technologies, Tokyo, Japan) and inductively coupled plasma optical emission spectrometry (ICP-OES, Agilent 5110, agilent technologies, Mulgrave VIC 3170, Australia) with four-acid (nitric, hydrochloric, perchloric, and hydrofluoric acids) digestion. After laboratory analysis, most of the analyzed samples still had remaining material, which was also ground. The elemental content of these remaining samples was analyzed again using pXRF, and the instrument’s various parameter settings were consistent with those used above (Section 2.2).
3. Results
3.1. The Elemental Detection Capability of pXRF
A total of 683 records of pXRF analysis results were collected from stream sediment samples collected from three different regions. We counted the number of samples detected by pXRF for each element. The results are shown in Figure 1. Among all the samples in this study, 36 elements were detected by pXRF. pXRF could not detect 56 elements from atomic numbers 1–92 in the periodic table. These undetectable elements include light elements with atomic numbers 1–11, rare earth elements with atomic numbers 57–71, all noble gas elements, nearly all radioactive elements with atomic numbers 84–92 (except Th and U), and 18 other elements (Co, Ga, Ge, Se, Br, Y, Tc, Ru, Rh, In, I, Re, Os, Ir, Pt, Au, Hg, and Tl).
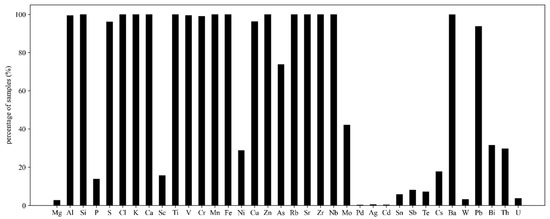
Figure 1.
The ability of pXRF to detect various elements in stream sediment samples.
3.2. Correlation Analysis between pXRF and Laboratory Analysis Results
To evaluate the reliability of each element content obtained by pXRF analysis, we studied the correlation between pXRF and laboratory analysis results for 36 elements (Figure 1). They are compared and analyzed in Table 2. Since the Si, Cl, Ag, and Pd element results were not included in the laboratory analysis results, we could not compare the reliability of elements determined by pXRF. The correlation coefficients of various elements measured by laboratory and pXRF methods showed relatively reliable results from the pXRF analysis of 19 elements (the shaded part) such as Mg, S, and Ca (i.e., combined with the laboratory analysis results, Pearson’s correlation coefficient was >0.5). By contrast, the correlation coefficient between pXRF and laboratory analysis results was lower for the other 13 elements (the unshaded part). Therefore, the pXRF analysis results for these elements are unreliable.
Table 2.
Correlation coefficient (corr) between pXRF and laboratory analysis.
3.3. Influence of Sample Size on Element Detection Results
In this section, 59 original samples are involved. A total of 236 data sets were analyzed since each sample was screened into four different particle sizes. Figure 1 shows various element concentrations in the study samples that were too low for pXRF detection. Therefore, these elements will not be discussed in this section. Therefore, we only evaluated the influence of sample size on pXRF detection results by comparing the elements in Table 3.
Table 3.
Correlation coefficients between pXRF and laboratory results for samples with different particle sizes.
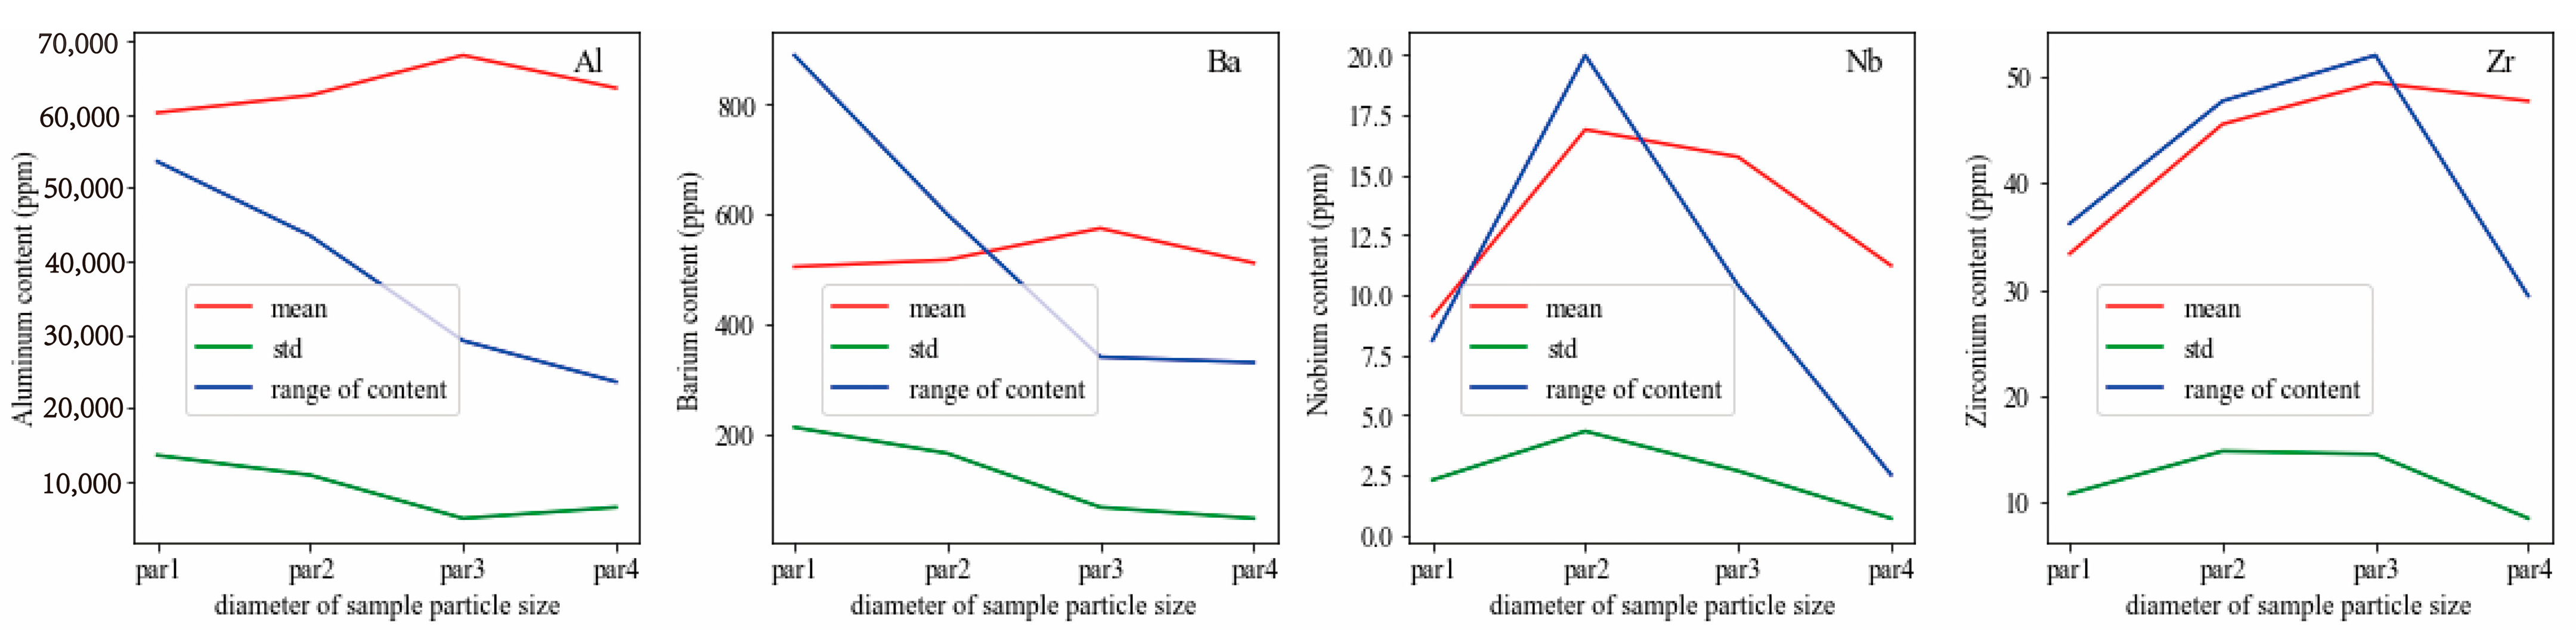
Each value in Table 3 represents Pearson’s correlation coefficient between the pXRF and laboratory analysis results. With the decrease in sample particle size, the pXRF results for most elements were more reliable because the correlation coefficient showed an increasing trend. However, with the reduced sample particle size, the results of Al, Ba, and Nb elements measured by pXRF tended to be less reliable. Through further analysis of the content characteristics of these three elements in different particle sizes, we found that the content variation range and variance of these three elements in fine-grained samples was lower than in coarse-grained samples despite the average content of these three elements in fine-grained samples not being significantly lower than in coarse-grained samples. Table 3 also shows that the correlation between Zr content measured by pXRF in samples of various particle sizes and the laboratory analysis results is low (i.e., the correlation coefficient is <0.5). However, the pXRF analysis results for medium particle sizes (par2 and par3) are relatively reliable (i.e., the correlation coefficient is higher than 0.3). Further analysis showed that the mean, standard deviation, and content range of Zr in the coarse (par1) and fine-grained (par4) samples were lower than those in medium-grained (par3 and par4) samples (Figure 2).
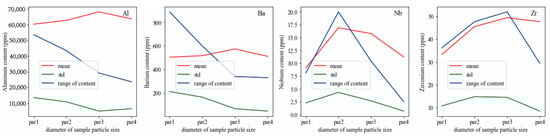
Figure 2.
Comparison of basic statistical parameters for Al, Nb, Ba, and Zr in samples with different particle sizes. par1, par2, par3, and par4 represent the particle diameters (d) in the sample, which are d > 380 μm, 380 μm < d < 150 μm, 75 μm < d < 150 μm, and d < 75 μm, respectively.
3.4. Effect of Sample Grinding on pXRF Analysis
As mentioned above, the samples were sifted into four different particle sizes after the stream sediment samples were naturally dried. We first analyzed each sample using pXRF and set the test time to 80 s. We selected 252 samples and entrusted them to ALS Minerals (Guangzhou, China). They determined various elemental contents using inductively coupled plasma mass spectrometry and inductively coupled plasma optical emission spectrometry. Finally, pXRF was used to analyze samples used in the laboratory analysis. In this study, we compared and analyzed the data obtained by three different methods. We measured pXRF data before and after the sample was crushed and compared them to the laboratory analysis results. Table 4 shows Pearson’s correlation coefficient. In general, the correlation coefficient between the pXRF analysis results measured after grinding and the laboratory analysis results was better, indicating that grinding improves the reliability of the pXRF analysis results. Grinding treatment also influences the pXRF analysis results of different elements. Grinding treatment significantly improved the reliability of pXRF analysis results for Al, K, Mn, Nb, Pb, S, and Ti elements (shaded part). pXRF analysis results for the other elements (unshaded part) also slightly improved. Grinding treatment even slightly decreased the reliability of pXRF analysis results for the Ba element.
Table 4.
Correlation coefficients between elements measured by pXRF and the laboratory before and after grinding.
3.5. Influence of Count Time on the Analysis Results
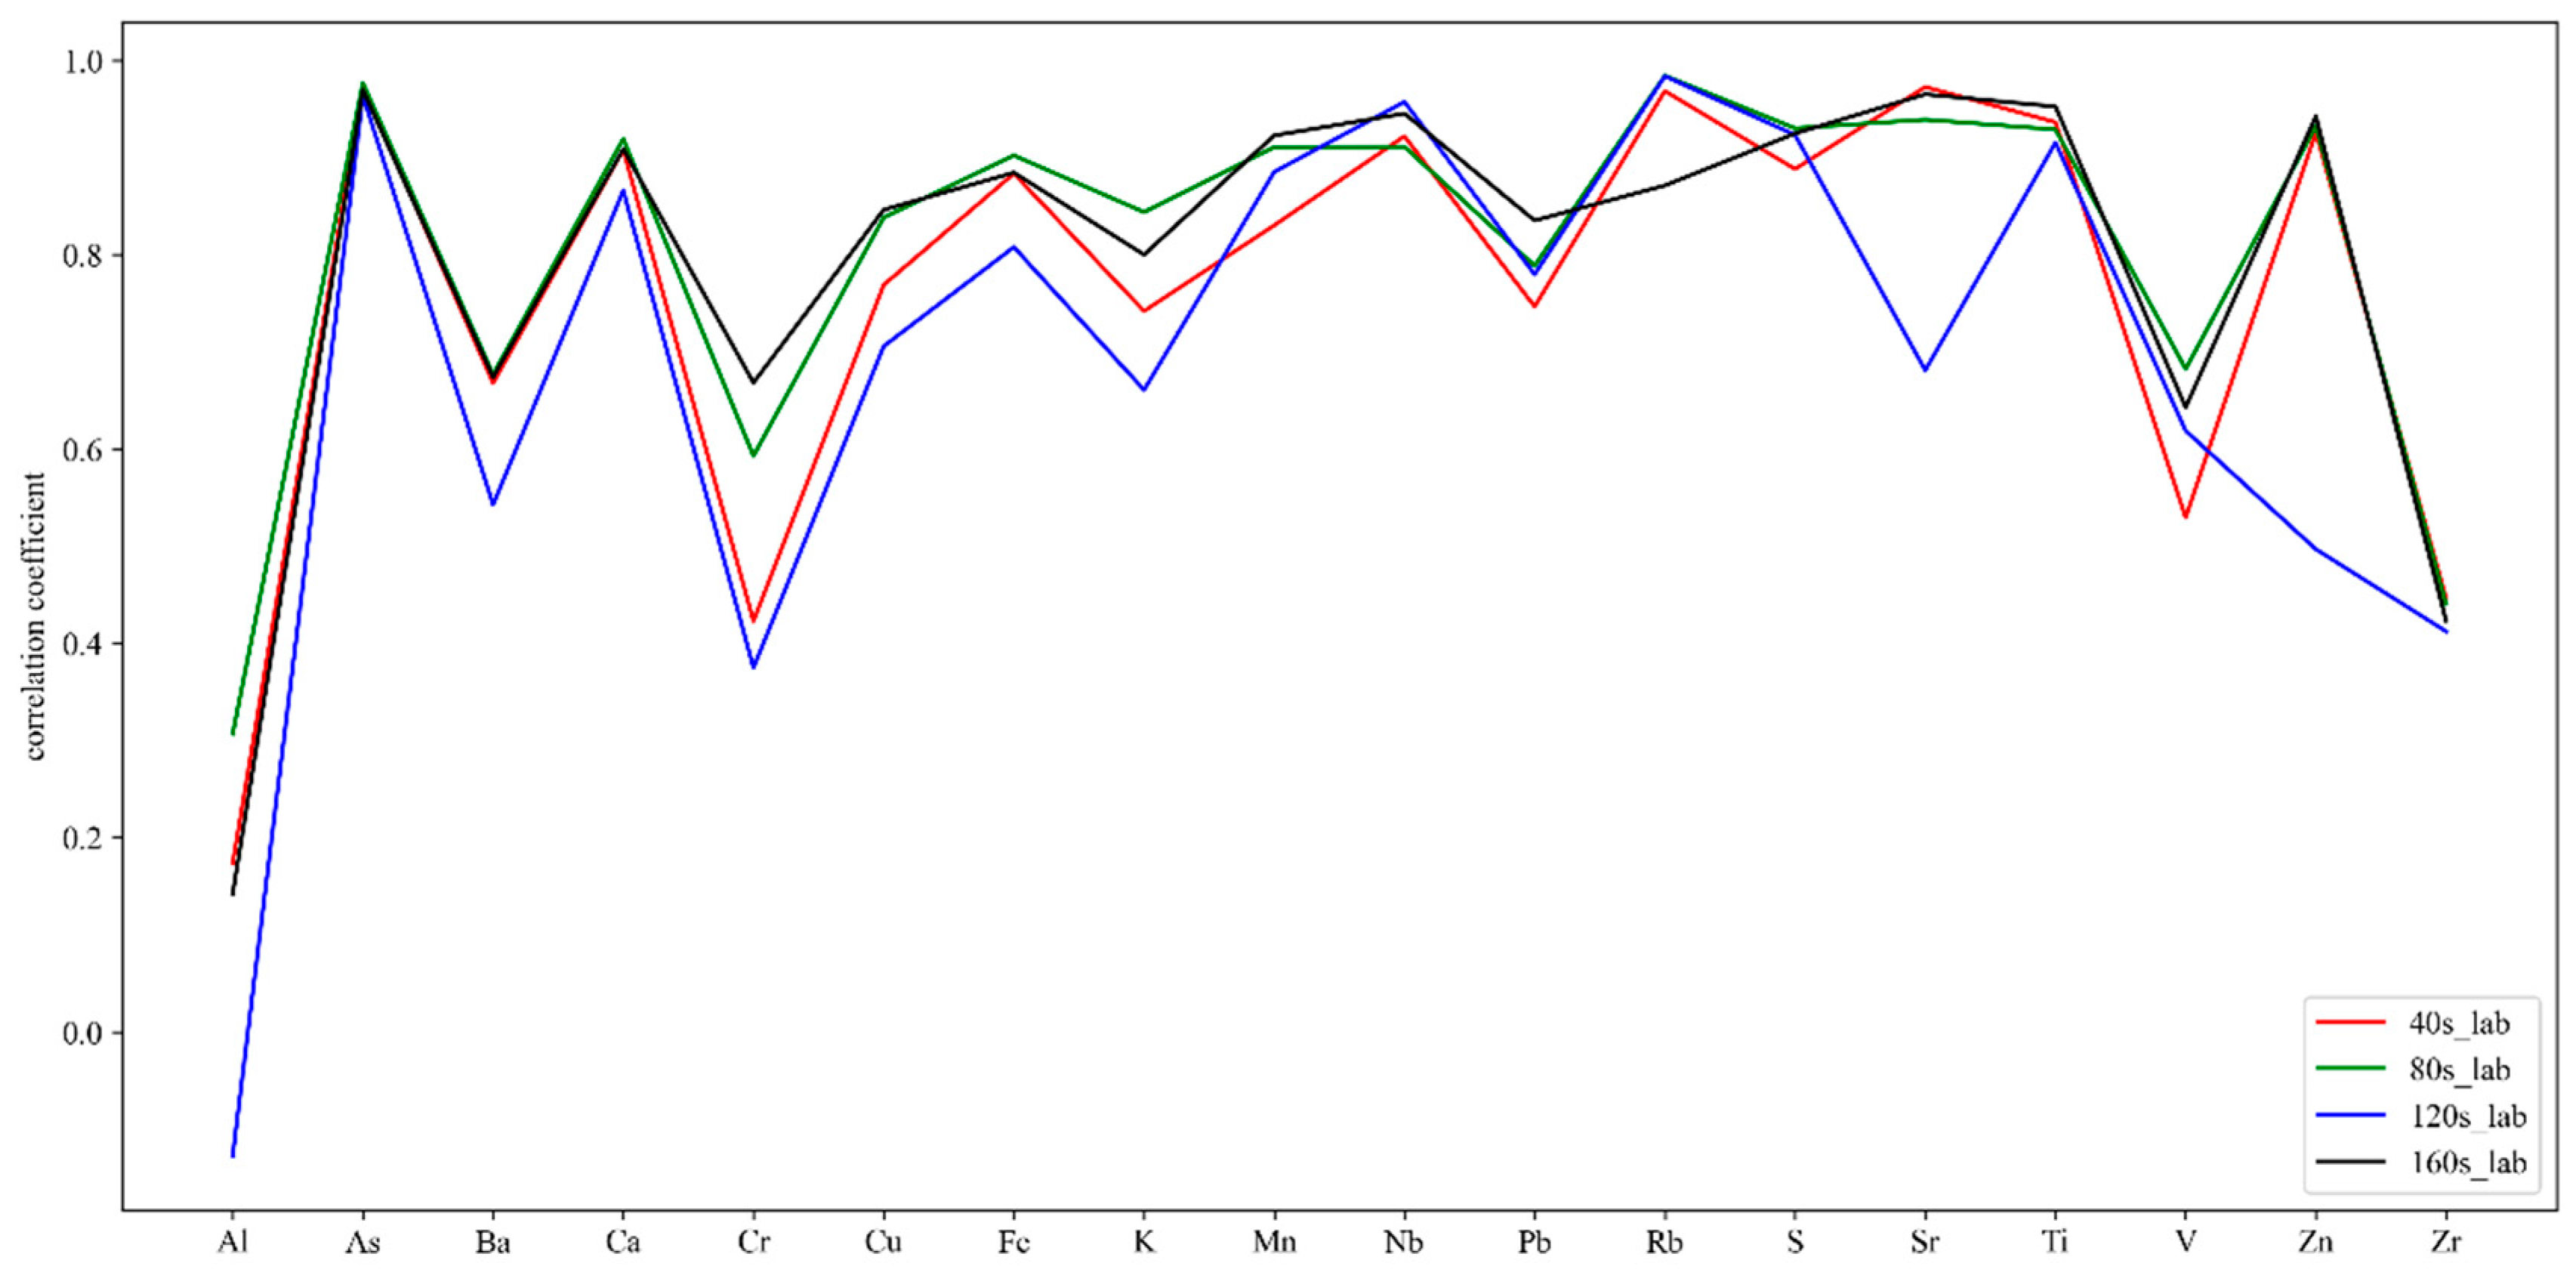
By comparing various elements obtained from four different pXRF count times (i.e., 40 s, 80 s, 120 s, and 160 s) to the laboratory analysis results (Figure 3), we found some differences between pXRF analysis results obtained from different count times. However, the difference was slight for some of the elements. However, according to the pXRF analysis results for 40 and 160 s, the correlation coefficient of 160 s_lab (black line) for most elements was higher than 40s_lab (red line), indicating that the reliability of pXRF results tends to increase with the increase in count time. For different elements, the reliability of analysis results did not necessarily improve with the increase in pXRF count time because the correlation coefficient of 120s_lab (blue line) for some elements (e.g., Al, Ba, Cr, et al.) was lower than 40s_lab (red line) and 80s_lab (green line). Overall, the influence of different pXRF count times on different elements was also different. Al, Ba, Cr, Cu, Fe, K, Mn, Sr, V, and Zn were relatively affected by count time. As, Ca, Nb, Pb, Rb, S, Ti, and Zr were less affected by count time.
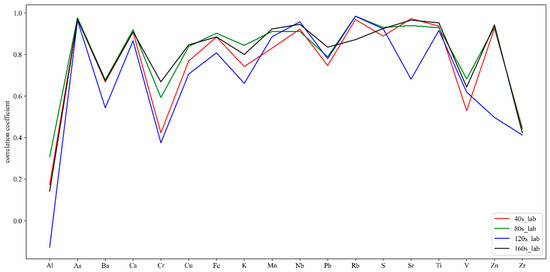
Figure 3.
Correlation coefficients between pXRF and laboratory results at different count times. 40s_lab, 80s_lab, 120s_lab, 160s_lab represent the correlation coefficient between pXRF and laboratory results when the pXRF count times are 40 s, 80 s, 120 s, and 160 s, respectively.
3.6. Influence of Element Content on Error of pXRF Analysis
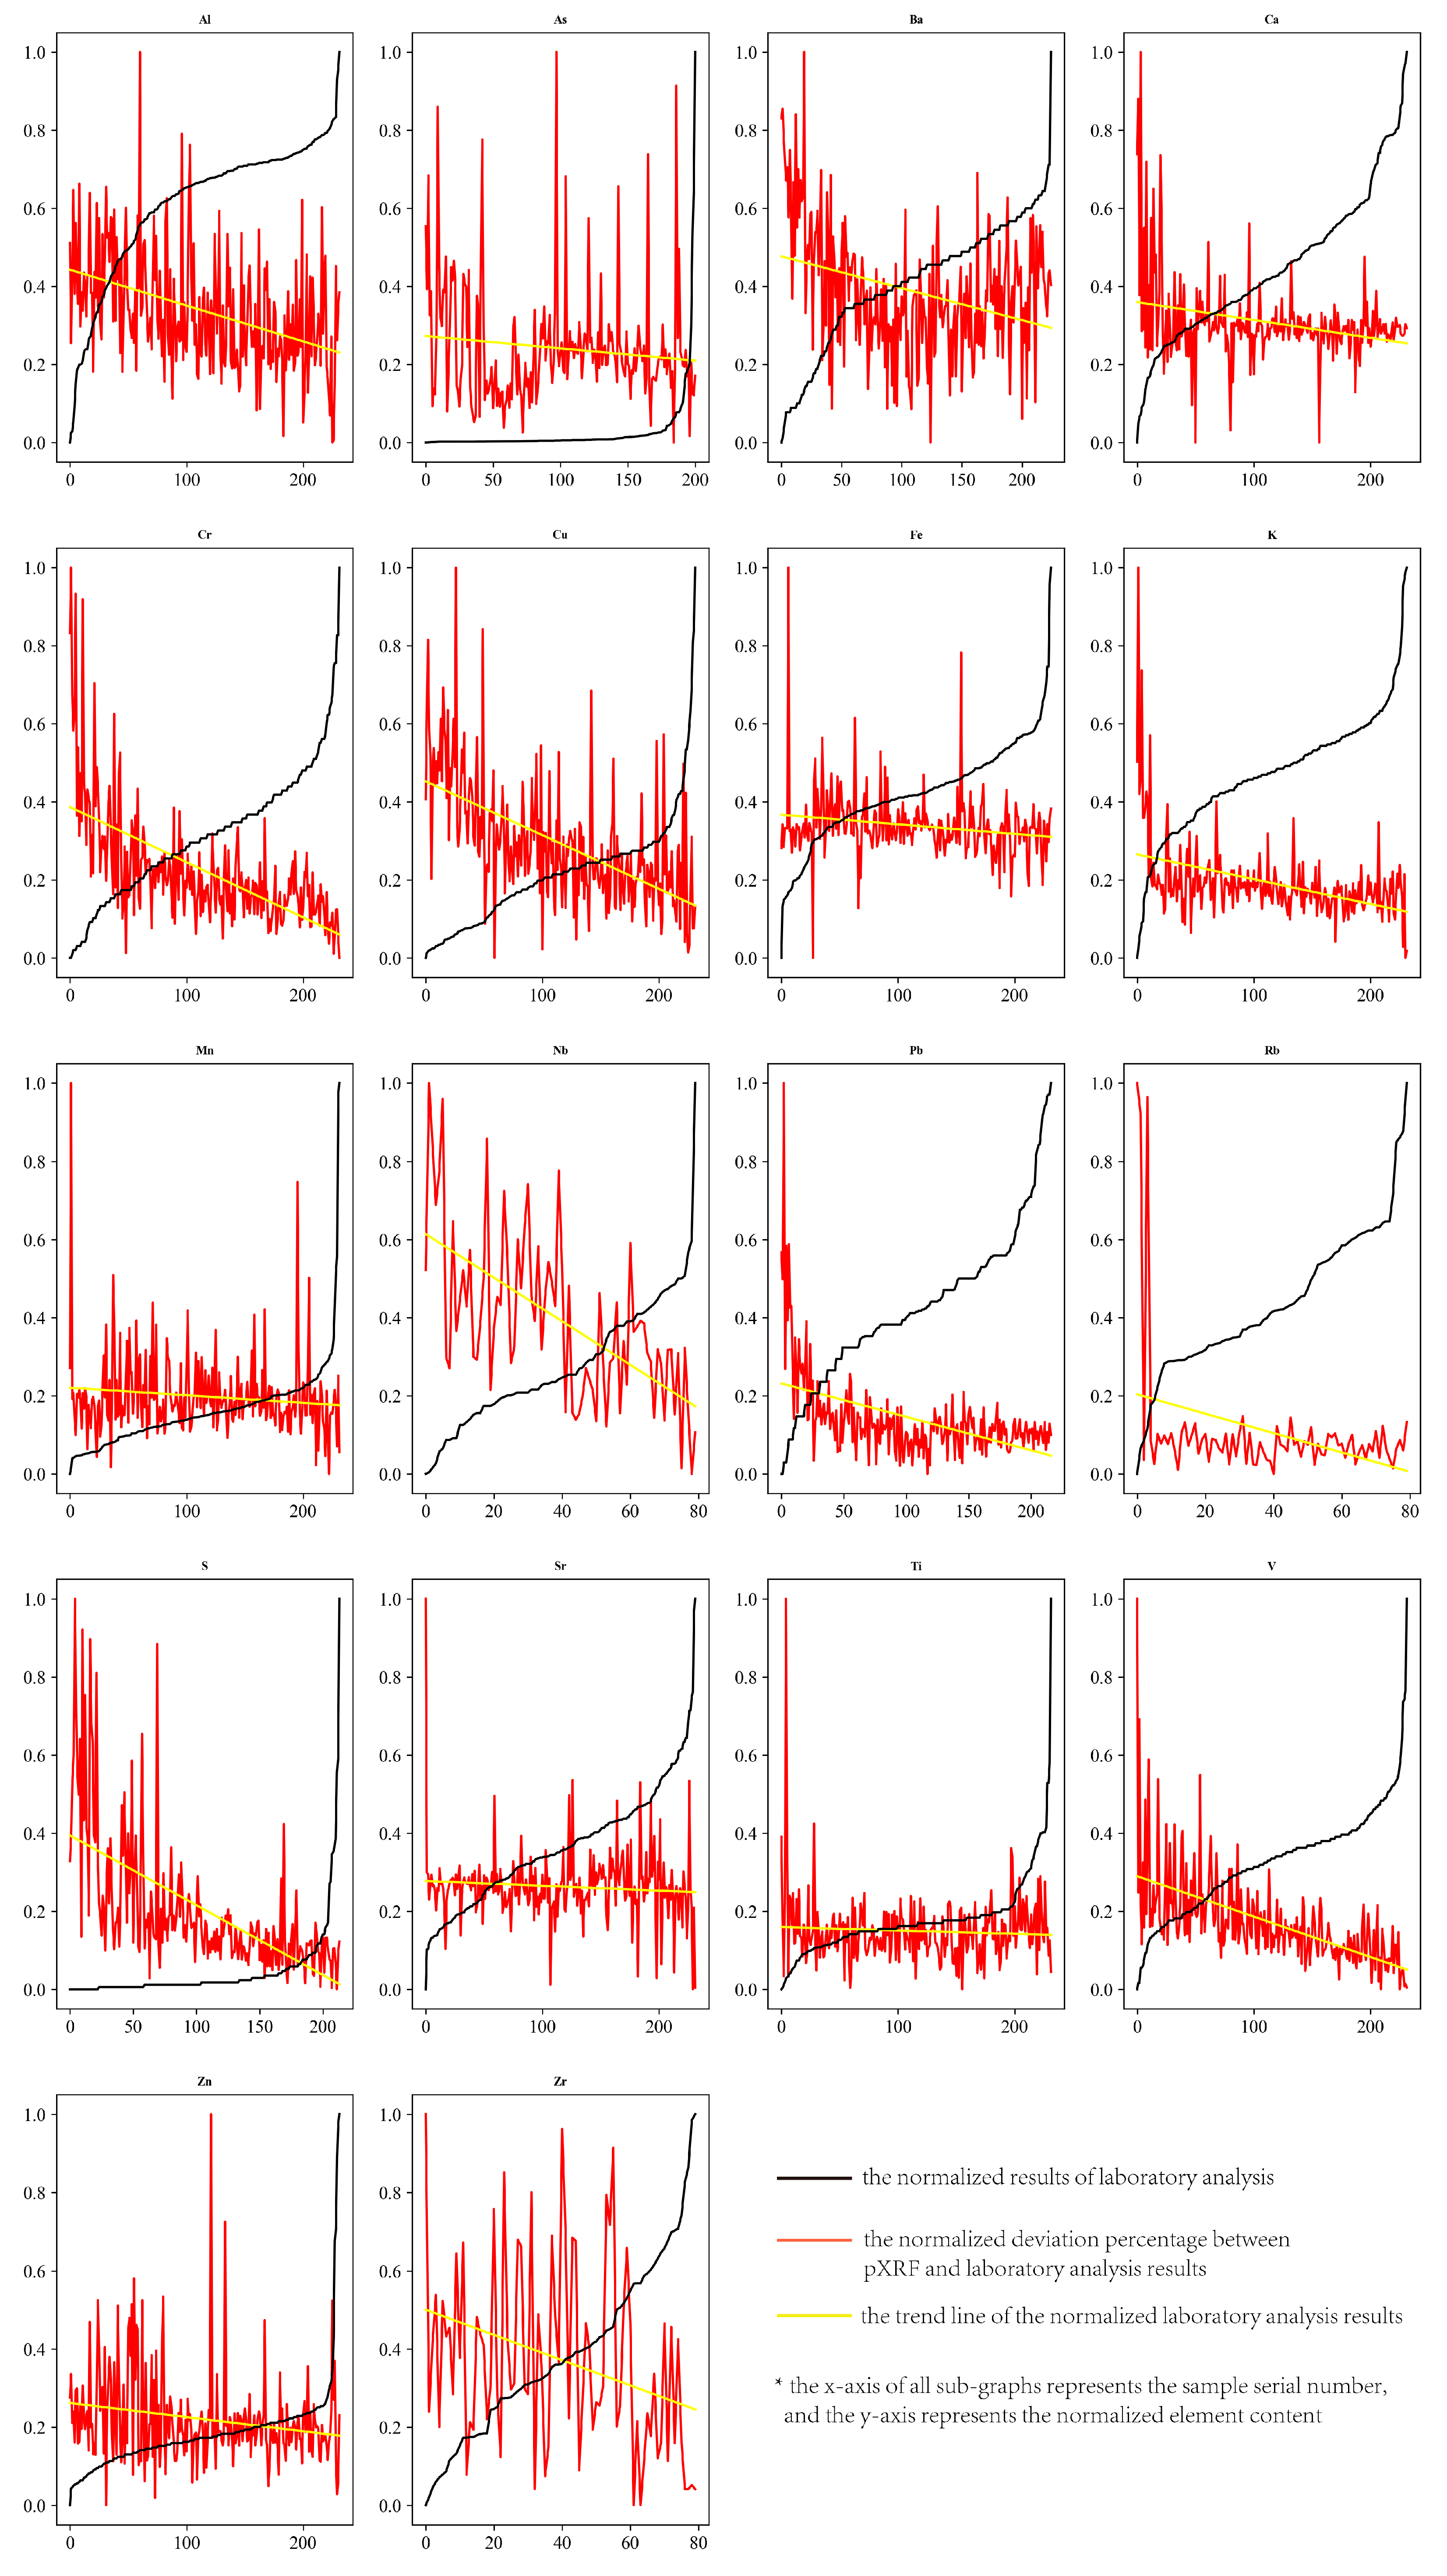
To determine the influence of certain elements’ true content on pXRF analysis errors, we compared the pXRF results to the accurate laboratory results at a count time of 160 s. For certain elements, all samples participating in the comparative analysis were sorted from low to high according to the laboratory analysis results. Secondly, we normalized the organized laboratory results using the min–max normalization method and drew them into lines (black lines in Figure 4). Thirdly, the sorting results of the first step were treated as a reference. The difference percentage between the pXRF and laboratory analysis results for each sample was calculated successively. In the fourth step, the error percentage calculated in the third step was normalized using the min–max normalization method and drawn as a line (red line in Figure 4). In the fifth step, a trend line (yellow line in Figure 4) was added to the error percentage line.

Figure 4.
Influence of the true content of elements on pXRF analysis errors.
For all elements, Figure 4 shows that the error of pXRF results tends to decrease with the increase in the sample’s element content. However, this trend is different in different elements. For example, with the increase in Al, Cr, Ca, and other elements in the sample, the pXRF errors decrease significantly. As Mn, Sr, and Ti content increases in the sample, the error reduction of pXRF results is relatively insignificant. In addition, according to Ca, Cr, S, and V element errors in pXRF analysis, when the element content of the sample is low, both the error and fluctuation of error are high, indicating that the poor reliability of pXRF analysis when the element content of the sample is low.
4. Discussion
In all stream sediment samples in this study, a total of 36 elements were detected using pXRF. Multiple elements (14 element kinds) were detected in no more than 30% of sample species (LPE—low proportion of detectable elements). By calculating the correlation coefficients between pXRF and laboratory analysis results, we found that only Mg and Th in LPE had high correlation coefficients (0.58 and 0.89, respectively). By contrast, the correlation coefficients of other elements were all very low (<0.3 or <0.1), indicating the unreliability of pXRF in analyzing the element content of stream sediments, especially if certain elements are detected in <30% of all samples. These results are consistent with the conclusions of Zhou et al. [18] and should be considered during application. In addition, pXRF cannot be used to detect all rare earth and noble gas elements, most radioactive elements (except Th and U), and 18 other elements (Co, Ga, Ge, Se, Br, Y, Tc, Ru, Rh, In, I, Re, Os, Ir, Pt, Au, Hg, and Tl), possibly because the content of these elements in the samples was too low and beyond the detection capability of pXRF. Specific causes must be further explored.
The reliability of element content obtained from samples of different particle sizes by pXRF differs due to the heterogeneity of elements in samples with different particle sizes and the different enrichment characteristics of various elements in stream sediments [30,31]. In general, the pXRF results of most elements are more reliable in fine particle size samples because the correlation coefficient between the pXRF analysis results of fine-grained samples and the laboratory analysis results is higher. However, some elements are relatively reliable in coarse particle size samples (e.g., Al, Ba, and Nb) or medium particle size samples (e.g., Pb and Zr). Considering different geological and ecological environment conditions, the enrichment trend of different elements in different particle sizes of stream sediment is different. Therefore, when using pXRF to analyze the contents of various elements in stream sediment samples, it is necessary to determine the most suitable sample particle size based on the environmental conditions of the sampling site and the enrichment law of specific elements. In general, using pXRF to analyze stream sediments of moderate size may be a more practical strategy.
Some elements have very low correlation coefficients between the pXRF and laboratory results, or pXRF did not detect the element in all samples. However, this does not imply that pXRF cannot be applied to element content analysis in stream sediments. Reasons for this result may include two of the following aspects: (1) The element content in all the tested samples was lower than the detection limit of pXRF; (2) although the element content in all the samples was higher than the detection limit of pXRF, the content difference between each sample was too small, and pXRF cannot distinguish this difference. In the first case, pXRF cannot be used to detect these elements in stream sediment in general; however, this inference is only based on the samples in this study. Stream sediment from other areas may contain high levels of certain elements, making pXRF an effective method to detect these elements. In the second case, the fitting equation between pXRF and laboratory analysis results cannot be established, considering the limited value of pXRF results. Therefore, the actual element content in the sample cannot be inferred from pXRF analysis results. We suggest increasing the sampling area as much as possible to increase the variation range of a certain target element in the samples.
Although there is a significant difference between the absolute value of pXRF and laboratory analysis results for many elements, the fitting equation between pXRF and laboratory analysis results can often be established. In other words, the relative content of elements can be effectively inferred from pXRF analysis results. Furthermore, the elements’ spatial trends can be identified based on the sampling location, and the content gradient can be divided. The content gradient of elements is similar to the true content of elements, which is valuable for mineral resource exploration.
To clarify the distribution of an element over a wide area, scientists usually collect geochemical samples with a low sampling density and analyze the contents of various elements with accurate element content analysis methods. This protocol is reasonable in the early stages of mineral resource exploration. However, with the development of mineral resource exploration, the focus has changed to the detailed dissection of some geochemical anomaly areas in the hope of locating the deposit, which often requires several samples at a high density and analyzing the element content. Analyzing the elements indiscriminately is costly and reduces work efficiency, which is not an advisable strategy. At this point, pXRF can be used to quickly analyze the sample. To analyze the element content accurately based on preliminary analysis results, a relatively small number of samples can be selected to accurately analyze the element content. The fitting equation of pXRF and laboratory analysis results can then be established. Estimating the real content of various elements can be made based on the equation and all pXRF analysis results. In this way, working methods can be shifted from the high-precision analysis of small samples to the low-precision analysis of large samples. This method not only saves funds but also significantly improves working efficiency.
5. Conclusions
When using pXRF for stream sediment element content analysis, if a specific element is detected only in <20% or even 30% of all the samples, the pXRF results for that element are generally unreliable (except for the Th element in this study). Alternatively, we can argue that the tested samples generally do not contain or contain very small amounts of a specific element, indicating no significant anomalies for this element in the study area.
Most fine-grained samples have more reliable pXRF analysis results. However, a small number of coarse- or intermediate-grained samples also have relatively reliable pXRF analysis results. The main factors affecting the fitting equation of pXRF and laboratory analysis results include the mean value, standard deviation, and variation range of element content in the analyzed samples. The higher the element content, the larger the standard deviation of the element content and the variation range of the element content. Hence, it is more favorable for establishing the fitting equation between pXRF and laboratory analysis results.
Generally, the grinding treatment of stream sediment samples can improve the reliability of pXRF analysis results. However, the impact of grinding treatment on the analysis results of different elements varies. pXRF can be used directly to measure stream sediments of medium particle size (particle diameter is between 75 and 380 μm) if preliminarily clarifying an element’s distribution within a sample is the only goal.
This study shows that pXRF can effectively detect the contents of various elements in stream sediment samples. The measured element contents of many elements using pXRF differed from the results obtained from laboratory analysis. However, there was a strong (correlation coefficient > 0.5) or very strong (correlation coefficient 0.98) correlation between pXRF and laboratory analysis results. In other words, the pXRF analysis results could effectively distinguish between different element content gradients, which has practical significance for mineral resource exploration.
Author Contributions
Conceptualization, S.Z.; funding acquisition, J.W. and S.W.; investigation, S.Z., J.W. and Y.B.; project administration, W.W.; resources, S.Z. and J.W.; software, S.Z.; writing—original draft, S.Z. All authors have read and agreed to the published version of the manuscript.
Funding
This research was funded by the Third Xinjiang Scientific Expedition Program (grant number 2022xjkk1306), the Natural Science Foundation of Xinjiang Uygur Autonomous Region (grant number 2022D01E095), the National Natural Science Foundation of China (grant number 41902307), and the Science and Technology Major Project of Xinjiang Uygur Autonomous Region, China (grant number 2021A03001-3).
Data Availability Statement
The data presented in this study are available on request from the corresponding author. The data are not publicly available because other members of our research team will be using these data in the near future.
Acknowledgments
The authors are grateful for anonymous reviewers’ constructive comments and suggestions.
Conflicts of Interest
The authors declare no conflict of interest.
References
- Cheng, Q. Mapping singularities with stream sediment geochemical data for prediction of undiscovered mineral deposits in Gejiu, Yunnan Province, China. Ore Geol. Rev. 2007, 32, 314–324. [Google Scholar] [CrossRef]
- Yousefi, M.; Kamkar-Rouhani, A.; Carranza, E.J.M. Geochemical mineralization probability index (GMPI): A new approach to generate enhanced stream sediment geochemical evidential map for increasing probability of success in mineral potential mapping. J. Geochem. Explor. 2012, 115, 24–35. [Google Scholar] [CrossRef]
- Krippner, A.; Meinhold, G.; Morton, A.C.; Schoenig, J.; von Eynatten, H. Heavy minerals and garnet geochemistry of stream sediments and bedrocks from the Almklovdalen area, Western Gneiss Region, SW Norway: Implications for provenance analysis. Sediment. Geol. 2016, 336, 96–105. [Google Scholar] [CrossRef]
- Xiang, J.; Xia, P.; Xiao, K.; Carranza, E.J.M.; Chen, J. Single-element Anomaly Mapping from Stream Sediment Geochemical Landscapes Aided by Digital Terrain Analysis. Acta Geol. Sin.-Engl. Ed. 2023, 97, 149–162. [Google Scholar] [CrossRef]
- Behera, S.; Panigrahi, M.K. Mineral prospectivity modelling using singularity mapping and multifractal analysis of stream sediment geochemical data from the auriferous Hutti-Maski schist belt, S. India. Ore Geol. Rev. 2021, 131, 104029. [Google Scholar] [CrossRef]
- Ghezelbash, R.; Maghsoudi, A.; Carranza, E.J.M. Mapping of single- and multi-element geochemical indicators based on catchment basin analysis: Application of fractal method and unsupervised clustering models. J. Geochem. Explor. 2019, 199, 90–104. [Google Scholar] [CrossRef]
- Xie, X.; Wang, X.; Zhang, Q.; Zhou, G.; Cheng, H.; Liu, D.; Cheng, Z.; Xu, S. Multi-scale geochemical mapping in China. Geochem. Explor. Environ. Anal. 2008, 8, 333–341. [Google Scholar] [CrossRef]
- Xie, X. Global geochemical mapping-Historical development and suggestions of future work. Geol. China 2008, 35, 357–374, (In Chinese with English Abstract). [Google Scholar]
- Ranasinghe, P.N.; Fernando, G.W.A.R.; Dissanayake, C.B.; Rupasinghe, M.S.; Witter, D.L. Statistical evaluation of stream sediment geochemistry in interpreting the river catchment of high-grade metamorphic terrains. J. Geochem. Explor. 2009, 103, 97–114. [Google Scholar] [CrossRef]
- Xie, X.; Mu, X.; Ren, T. Geochemical mapping in China. J. Geochem. Explor. 1997, 60, 99–113. [Google Scholar]
- Zhang, B. Advances in the research of geochemical exploration methods in special landscape areas of western China. Geophys. Geochem. Explor. 2008, 32, 473–476, (In Chinese with English Abstract). [Google Scholar]
- Xi, X.; Li, M. Summary of modern exploration geochemistry scientific system: Commentary on exploration achievements obtained in the period of ‘12th Five-Year Plan’. Geophys. Geochem. Explor. 2017, 41, 779–793, (In Chinese with English Abstract). [Google Scholar]
- Sarala, P. Comparison of different portable XRF methods for determining till geochemistry. Geochem. Explor. Environ. Anal. 2016, 16, 181–192. [Google Scholar] [CrossRef]
- Sterk, R.; Gazley, M.F.; Wood, M.P.; Collins, K.S.; Collis, G. Maximising the value of Portable XRF data in exploration: An example from Marirongoe, Mozambique. Geochem. Explor. Environ. Anal. 2018, 18, 142–154. [Google Scholar] [CrossRef]
- Radu, T.; Diamond, D. Comparison of soil pollution concentrations determined using AAS and portable XRF techniques. J. Hazard. Mater. 2009, 171, 1168–1171. [Google Scholar] [CrossRef]
- Havukainen, J.; Hiltunen, J.; Puro, L.; Horttanainen, M. Applicability of a field portable X-ray fluorescence for analyzing elemental concentration of waste samples. Waste Manag. 2019, 83, 6–13. [Google Scholar] [CrossRef]
- Vonopartis, L.C.; Booysen, R.; Nex, P.A.M.; Kinnaird, J.A.; Robb, L.J. Combined satellite and portable XRF exploration mapping of the Zaaiplaats tin field, South Africa. S. Afr. J. Geol. 2022, 125, 45–60. [Google Scholar] [CrossRef]
- Zhou, S.; Wang, J.; Wang, W.; Liao, S. Evaluation of Portable X-ray Fluorescence Analysis and Its Applicability as a Tool in Geochemical Exploration. Minerals 2023, 13, 166. [Google Scholar] [CrossRef]
- Walser, S.L.L.; Sirkovich, E.C.C.; Richardson, J.B.B.; McStay, A.E.E.; Perdrial, N. Moisture, organic matter, and large particle correction for accurate Pb portable X-ray fluorescence assessment in urban soils. X-Ray Spectrom. 2022, 52, 72–82. [Google Scholar] [CrossRef]
- Nawar, S.; Richard, F.; Kassim, A.M.; Tekin, Y.; Mouazen, A.M. Fusion of Gamma-rays and portable X-ray fluorescence spectral data to measure extractable potassium in soils. Soil Tillage Res. 2022, 223, 105472. [Google Scholar] [CrossRef]
- Stockmann, U.; Cattle, S.R.; Minasny, B.; McBratney, A.B. Utilizing portable X-ray fluorescence spectrometry for in-field investigation of pedogenesis. Catena 2016, 139, 220–231. [Google Scholar] [CrossRef]
- McGladdery, C.; McGladdery, C.; Weindorf, D.C.; Chakraborty, S.; Li, B.; Paulette, L.; Podar, D.; Pearson, D.; Kusi, N.Y.O.; Duda, B. Elemental assessment of vegetation via portable X-ray fluorescence (PXRF) spectrometry. J. Environ. Manag. 2018, 210, 210–225. [Google Scholar] [CrossRef]
- Zhou, S.; Weindorf, D.C.; Cheng, Q.; Ynag, B.; Yuan, Z.; Chakraborty, S. Elemental assessment of vegetation via portable XRF: Sample preparation and methodological considerations. Spectroc. Acta Pt. B-Atom. Spectr. 2020, 174, 105999. [Google Scholar] [CrossRef]
- Zhang, X.; Wells, E.M.; Specht, A.J.; Weisskopf, M.G.; Weuve, J.; Nie, L.H. In vivo quantification of strontium in bone among adults using portable x-ray fluorescence. J. Trace Elem. Med. Biol. 2022, 74, 127077. [Google Scholar] [CrossRef]
- Charalambous, A.; Papasavvas, G.; Kassianidou, V. Enkomi (Cyprus): Using pXRF spectroscopy to identify LBA copper alloys. J. Archaeol. Sci. Rep. 2021, 35, 2726. [Google Scholar] [CrossRef]
- Merkaj, E.; Civici, N. Application of a Portable XRF Spectrometer for In-Situand Nondestructive Investigation of Pigments in Two 15th Century Icons. Open J. Appl. Sci. 2020, 10, 305–317. [Google Scholar]
- Zhang, L.; Sun, Y.; Xu, H.; Hou, F. p-XRF for the Detection of the Elemental Content in the Glaze Layer of Chinese Glazed Tiles. Int. J. Archit. Herit. 2022, 1–14. [Google Scholar] [CrossRef]
- Zhou, S.; Zhou, K.; Cui, Y.; Wang, J.; Ding, J. Exploratory data analysis and singularity mapping in geochemical anomaly identification in Karamay, Xinjiang, China. J. Geochem. Explor. 2015, 154, 171–179. [Google Scholar]
- Zhou, B.; Zhang, Z.; Shi, Z.; Song, H.; Yu, L. Geochemistry, Geochronology, and Prospecting Potential of the Dahongliutan Pluton, Western Kunlun Orogen. Appl. Sci. 2022, 12, 11591. [Google Scholar] [CrossRef]
- Babek, O.; Grygar, T.M.; Famera, M.; Hron, K.; Novakova, T.; Sedlacek, J. Geochemical background in polluted river sediments: How to separate the effects of sediment provenance and grain size with statistical rigour? Catena 2015, 135, 240–253. [Google Scholar] [CrossRef]
- Darwish, M.A.G.; Poellmann, H. Geochemical exploration for gold in the Nile Valley Block (A) area, Wadi Allaqi, South Egypt. Geochemistry 2010, 70, 353–362. [Google Scholar] [CrossRef]
Disclaimer/Publisher’s Note: The statements, opinions and data contained in all publications are solely those of the individual author(s) and contributor(s) and not of MDPI and/or the editor(s). MDPI and/or the editor(s) disclaim responsibility for any injury to people or property resulting from any ideas, methods, instructions or products referred to in the content. |
© 2023 by the authors. Licensee MDPI, Basel, Switzerland. This article is an open access article distributed under the terms and conditions of the Creative Commons Attribution (CC BY) license (https://creativecommons.org/licenses/by/4.0/).