Article

Nature of Pigments in Orange and Purple Coloured Chinese Freshwater Cultured Pearls: Insights from Experimental Raman Spectroscopy and DFT Calculations

1
Gemmological Institute, China University of Geosciences, Wuhan 430074, China
2
Institute of Jewelry and Jade Carving, Nanyang Normal University, Nanyang 473000, China
*
Author to whom correspondence should be addressed.
Minerals 2023, 13(7), 959; https://doi.org/10.3390/min13070959
Submission received: 29 April 2023 / Revised: 10 June 2023 / Accepted: 5 July 2023 / Published: 18 July 2023
(This article belongs to the Special Issue Gemstone Analysis by Spectroscopy and Microscopy, Volume II)

Abstract

:
Pearls, a well-known organic gemstone, are popular for their attractive lustre and rich colour. The pigmentation and colour of pearls have never been clearly explained. Understanding the pigments and colour origin of pearls can be a guide for artificial cultivation and rational conservation. In this study, Chinese freshwater cultured pearls were collected as research samples. The appearance and colour characteristics of pearls were characterised using D65 standard light source photography and UV–Vis spectroscopy, the molecular structure of the pigments in the pearls was characterised using Raman spectroscopy, and Density Functional Theory (DFT) calculations were used to reveal the characteristics of the pigments in the pearls in terms of molecular structure and electronic excitation. It was proposed that freshwater pearls are coloured with polyene pigments, with the chain length of the polyene determining the type of colour and the concentration of the polyene determining the colour intensity of the pearl. The HOMO–LUMO transition of conjugated polyenes is intrinsically responsible for the colour of pearls. Many colour-rich biominerals also have similar Raman spectral features to pearls, and this study has wider implications for understanding the nature of pigments and their colour origins.

1. Introduction

Pearls, an important biomineral composed mainly of calcium carbonate and organic matter, are popular in the jewellery market due to their beautiful lustre and rich colour [1,2]. Pearls can be divided into natural pearls and cultured pearls depending on the reason for their formation, with the majority of pearls on the market being artificially cultured. Pearls can also be divided into freshwater pearls and saltwater pearls, depending on the environment in which they are grown [3]. China has a well-developed pearl aquaculture industry and produces a large number of freshwater cultured pearls, which account for a significant share of the world pearl market. As a result, freshwater cultured pearls produced in China have received a great deal of attention [4,5]. Colour is an important factor in determining the value of Chinese freshwater cultured pearls, and the pigments in the pearls directly determine their colour. Surprisingly, the composition of the pigments in pearls has always been a mystery. We believe that research into the pigments in pearls and understanding the causes of their colour is important not only at a theoretical level but also in two applications: to guide the artificial regulation of the colour of cultured pearls and to provide guidance for the rational conservation and maintenance of pearls, an organic gemstone whose colour is considered to be unstable.
As is generally stated at present, the primary pigments in freshwater pearls are polyenes, including carotenoids and unmethylated polyenes [6,7,8,9,10,11,12,13,14,15]. Pigments containing polyene chains are widespread in nature [16]. Carriers include phytoplankton, calcareous skeletons such as some mollusc shells, vegetables such as carrots, bird feathers and even macular pigments of the human retina [17,18,19,20,21,22,23,24,25,26,27,28,29,30,31,32,33,34,35,36]. The vast majority of these pigments belong to the carotenoid family. Due to the unique spectral characteristics in the Raman spectrum of polyene, Raman spectroscopy is an important tool for researching polyenes [37,38]. There are two very strong Raman peaks in the range of 1450–1600 cm−1 (C=C stretching) and 1100–1200 cm−1 (C-C stretching) [39,40,41]. This strong spectral enhancement is due to the coupling of electronic transition and vibrational transition. Even in pearls, complex biominerals, polyenes can be detected at very low concentrations [42]. Therefore, Raman spectroscopy is an effective characterisation technique for studying the pigments in pearls.
In published studies [7,8,9,10,11,12,13,14,15], scholars have attempted to characterise the pigments in pearls using Raman spectroscopy with UV–Vis spectroscopy to infer the colour of pearls that may be due to polyenes or carotenoids. This approach is relatively indirect, with little detailed study of the spectroscopic properties of the molecules postulated and little in-depth discussion of the colour of pearls at the molecular level. Although some evidence from Raman spectroscopy has been proposed for the colour origin of Chinese freshwater cultured pearls, the nature of pigments and colour origin in Chinese freshwater cultured pearls are still not well understood. In this study, we collected experimental Raman and UV–Vis spectra of freshwater cultured pearls of different colours while we simulated theoretical Raman and UV–Vis spectra of possible polyene molecules in pearls using high-precision DFT calculations. Upon comparing the experimental spectra with the results of the theoretical calculations, we speculated on the pigments in pearls and explained the chromogenic mechanism of polyene pigments at the level of electronic excitation of the molecules, providing a further understanding of the colour of freshwater pearls.

2. Materials and Methods

2.1. Materials

This research was carried out on 8 untreated Chinese freshwater cultured pearls from Hyriopsis cumingi, covering a wide range of colours typical for this material. The pearl samples are divided into three main types according to colour: yellow–orange pearls (marked as CF-1, CF-2 and CF-3), purple pearls (marked as CF-4, CF-5 and CF-6), and orange–purple mixed-colour pearls (marked as CF-7 and CF-8). We used alcohol wipes to clean the surface of the pearls before experimental characterisation.

2.2. Methods

In order to better show the colours of pearl samples, we use a standard D65 light source in the lightbox to take photographs. Before photographing the pearl samples, we calibrated the camera using a grey plate under a standard D65 light source.
The UV–Vis spectra of the pearls were collected by Skyray Gem UV-100 ultraviolet–visible spectrophotometer (Skyray Instrument, Kunshan, China). Before collecting the UV–Vis spectra of the pearls, we calibrated the equipment with a white plate (Polytetrafluoroethylene material), which was considered to have 100% reflectivity. For collecting the UV–visible spectrum of pearls, we used the reflection method. The spatial resolution of the UV–Vis spectrophotometer was 2 mm. Thus, relatively smooth surfaces of the pearl samples were selected for testing as far as possible to reduce the influence of the mineral structure of the pearl surface on the spectrum and to better characterise the absorption characteristics of the different coloured pearls in the visible region. The regions with pure colour and smooth surfaces of yellow–orange pearls (CF-1, CF-2, CF-3) and purple pearls (CF-4, CF-5, CF-6) were chosen as the measured regions. In order to observe the visible absorption characteristics of mixed-colour pearls and to compare them with pure colour pearls, the regions with mixed colour and smooth surfaces of orange–purple mixed-colour pearls were chosen as measured regions. The spectral range was 350–800 nm, the resolution of wavelength in the UV–Vis spectrum was 3 nm, the integration time was 100 ms, and the average number of scans was 8. Without considering the transmission of the sample, the reflection spectrum was converted to the absorption spectrum using the conversion formula: A (Absorbance) = 1-R (Reflectance). Integration of UV–Vis absorbance bands was completed using the program SpectraGryph 1.2 (Friedrich Menges, Oberstdorf, Germany).
Raman spectra were collected using a ThermoFisher DXR™2xi Raman spectrometer (ThermoFisher Scientific, Waltham, MA, USA). Before collecting the Raman spectra of the pearls, we used single-crystal silicon to correct the Raman shifts. For pure yellow–orange colour pearl samples (CF-1, CF-2, CF-3) and pure purple colour pearl samples (CF-4, CF-5, CF-6), the Raman spectra were collected at smoother positions on the surface. For orange–purple mixed-colour pearls (CF-7 and CF-8), the Raman spectra were collected at different positions: for CF-7, the Raman spectrum of the more prominent orange position was collected as CF-7-1 and the Raman spectrum of the more prominent purple position was collected as CF-7-2. The same was performed for CF-8, the Raman spectrum of the more prominent orange position was collected as CF-8-1, and the Raman spectrum of the more prominent purple position was collected as CF-8-2. The incident laser excitation was provided by a YAG laser source operating at 532 nm, and the power at the sample was 15 mW. The spatial resolution of the Raman spectrometer was 500 nm. The spectra were acquired with a resolution of 4 cm−1, with an acquisition time of 30 s, and 1000 scans were accumulated. The scan range of the Raman shift was 600–1600 cm−1. All tests were performed at 25 °C, and the Raman spectra were baseline corrected. The normalisation of the Raman spectra of pearls was conducted using the program OMNIC 9, and the peak fitting of the Raman spectra of pearls was completed using the program Origin. Integration of Raman peaks was completed using the program SpectraGryph 1.2.
The colour of a pearl may be closely related to the chain length of the polyene [3], so attention needs to be paid to the spectroscopic properties of polyenes of different chain lengths. To simplify the discussion, we assume a simple structural model, i.e., the polyene chain with only C=C double bonds and C-C single bonds. We choose polyenes with 4 C=C double bonds up to polyenes with 14 C=C double bonds. For convenience, we label the polyene molecule with n C=C double bonds as Cn polyene. DFT calculation is a method used to study the electronic structure of multi-electron systems. It can be used to study various properties of molecules and crystals. It is one of the most commonly used methods in the field of quantum chemistry. We used the quantum chemical program Gaussian 16 (Gaussian, Inc., Wallingford, CT, USA) to complete DFT calculations [43]. We analysed the results obtained from DFT calculations using the wave function analysis program Multiwfn (Beijing Kein Research Centre for Natural Sciences, Beijing, China) [44]. In DFT calculations, the accuracy of the calculation results is closely related to the theoretical methods used, and the theoretical methods applicable to different molecular systems also vary. Thus, selecting appropriate functional and basis sets is very important. Before the spectroscopic properties of the molecule can be calculated, the molecular structure of the polyene needs to be optimised. We used B3LYP, a widely applicable functional, with basis sets 6-31G (d) to optimise the molecular structures of polyenes, and we also calculated the theoretical Raman spectra of polyenes at this level [45]. In the simulation of the Raman spectrum, the wavenumber is often overestimated, so it needs to be corrected. At this calculated level, the Raman shifts were scaled by 0.9614 to obtain a high-quality theoretical spectrum [46]. Structure optimisation and simulated Raman spectra of these polyenes were also calculated at functional B3LYP with larger basis sets 6-311G(d,p) to make the results more reliable. The applicable factors for Raman wavenumber correction vary at different calculated levels. The simulated Raman shifts calculated at B3LYP/6-311G(d,p) level were scaled by 0.9729 [47]. We finally obtained theoretical Raman spectra from C4 polyene to C14 polyene. We found possible polyene pigments by comparing theoretical Raman spectra with experimental Raman spectra of pearls and then calculated their theoretical UV–Vis spectra and compared them with experimental UV–Vis spectra of pearls to explain the colour origin of pearls further. Theoretical UV–Vis spectra of polyene molecules can be obtained from electronic excitation calculations. For electronic excitation calculations of conjugated molecules, the functional PBE0 is much used and appropriate. We used commonly used functional PBE0 with the 6-311G(d,p) basis sets to calculate the first 10 excited states of the optimised structure of these polyenes based on time-dependent DFT (TDDFT) theory to attain their simulated visible absorption spectra [48].

3. Results and Discussion

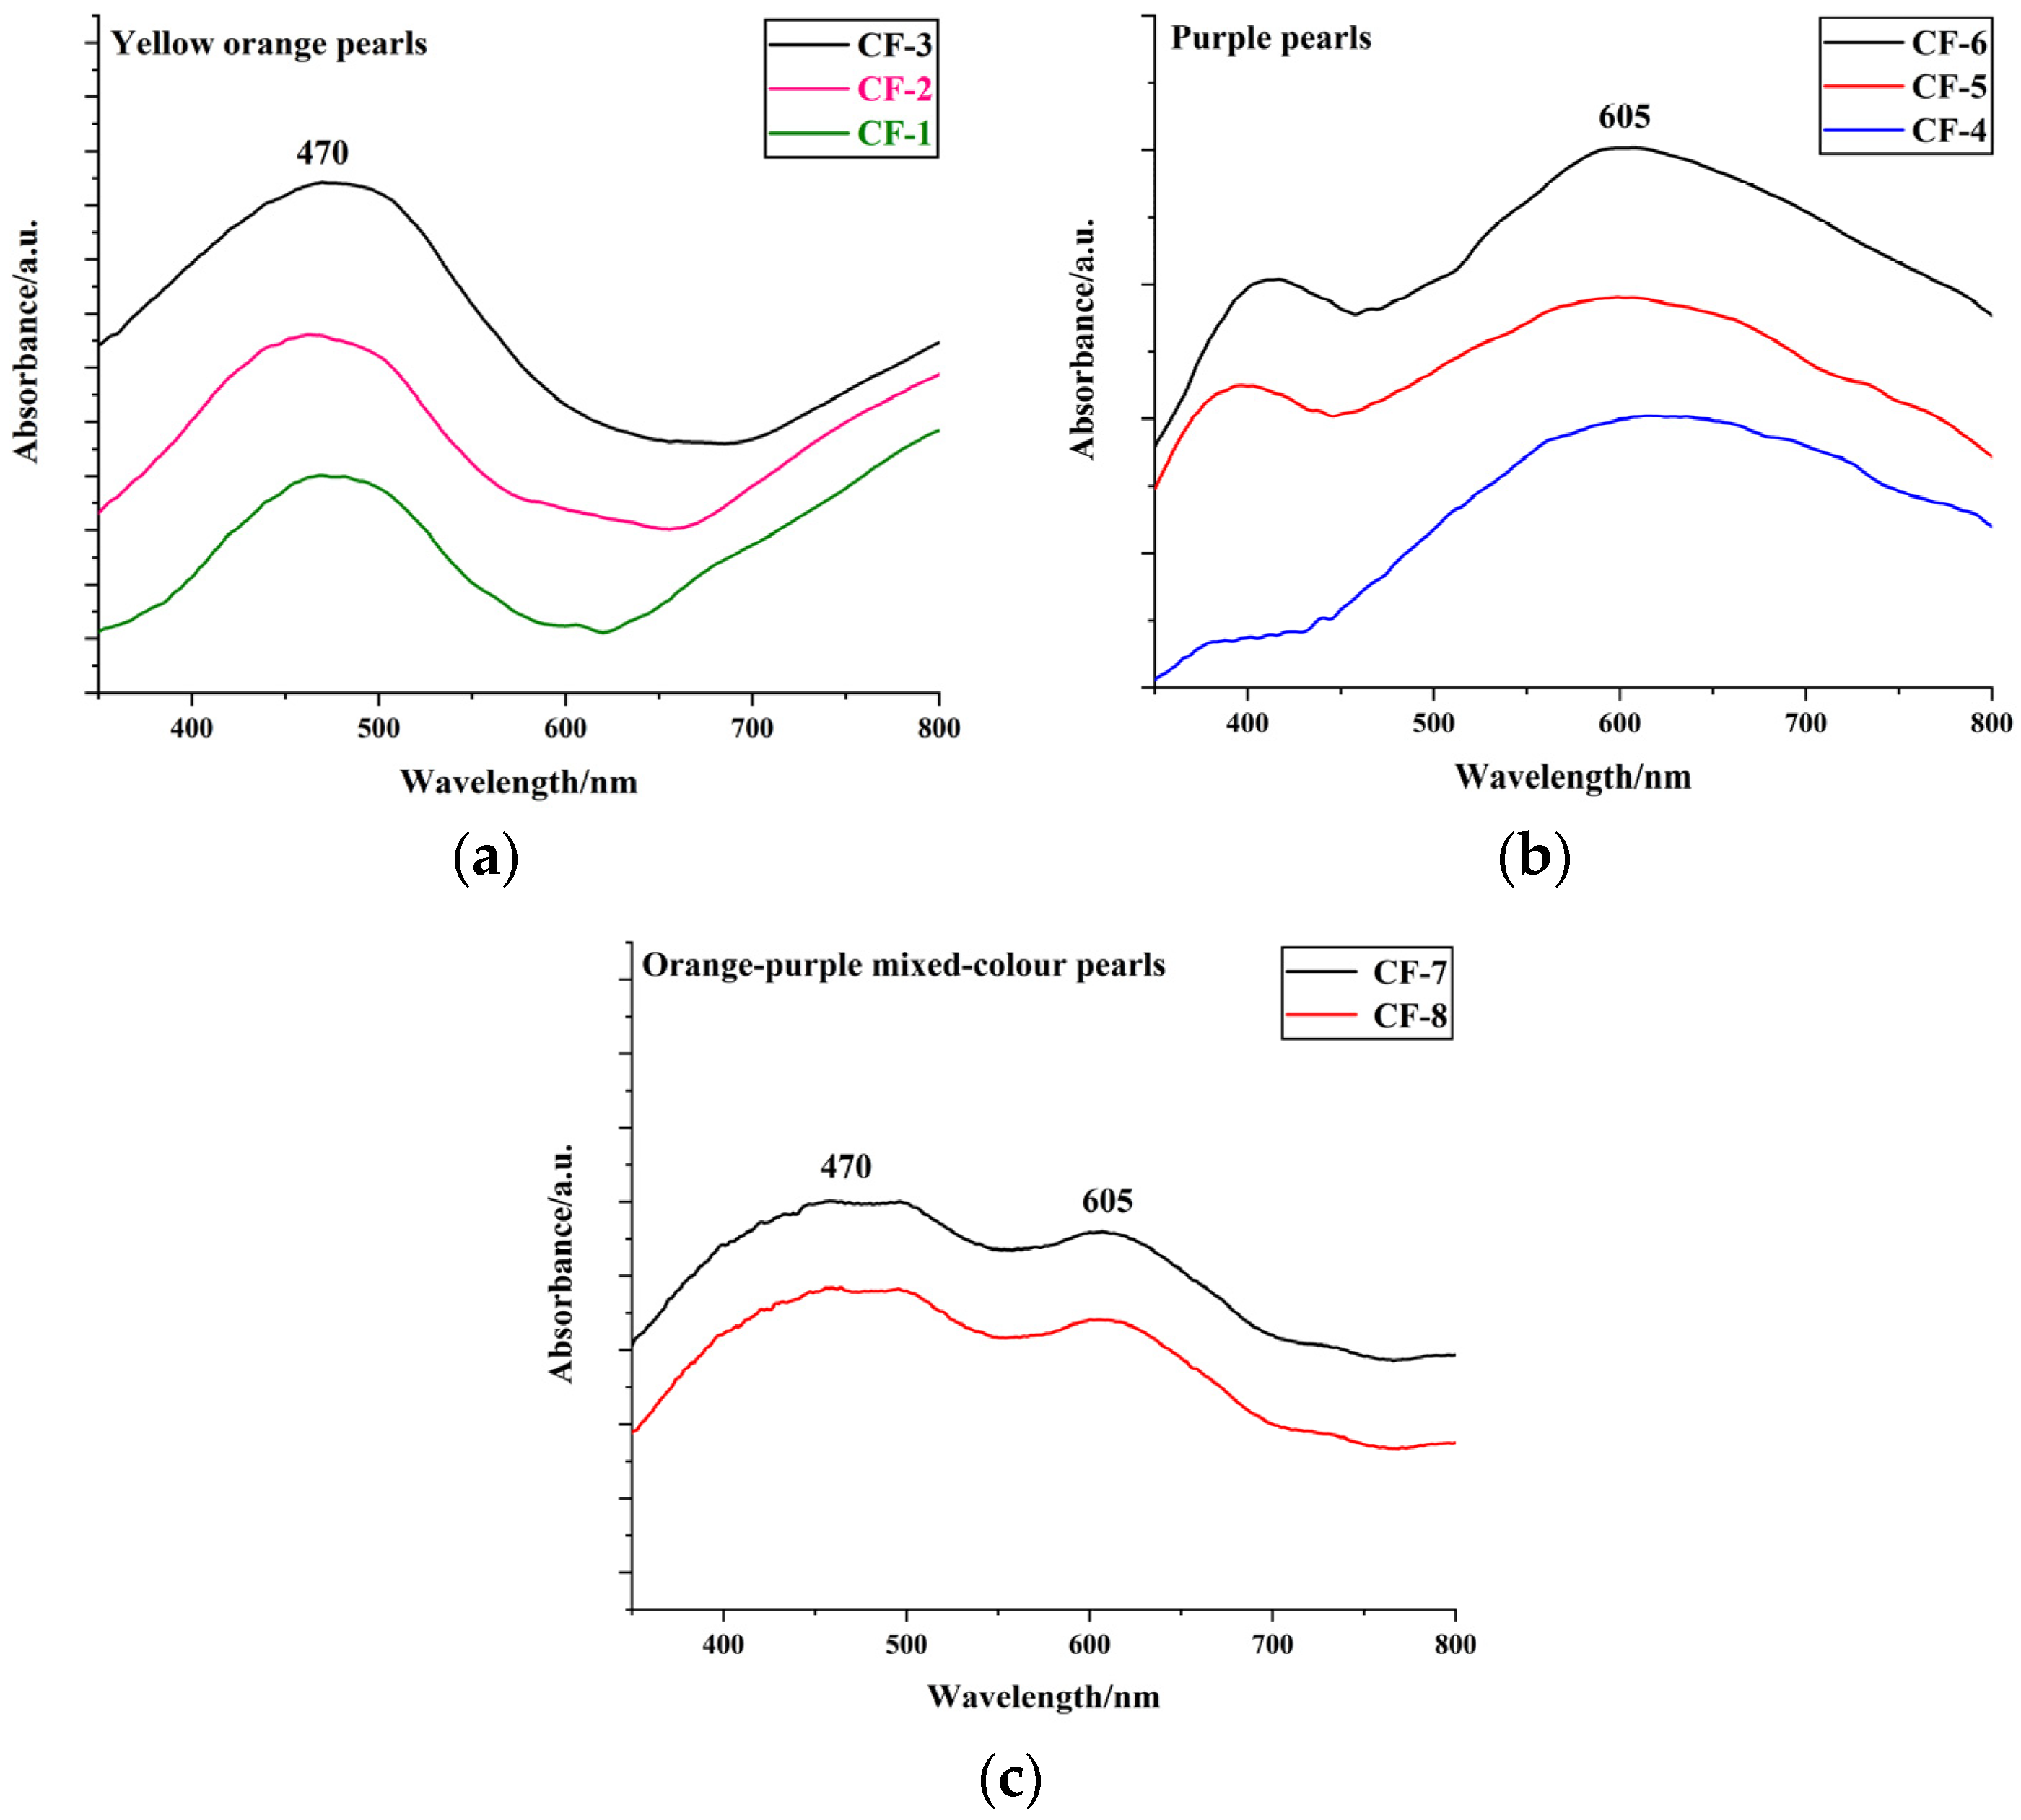
3.1. Colour Characterisation of the Pearls

For the colour characterisation of pearls, on the one hand, we use photographs taken under a standard D65 light source in a lightbox to visualise the colour of the pearls, and on the other hand, we use the UV–Vis spectrum to characterise the absorption characteristics of pearls in the visible region, which in turn allows us to discuss the causes of the colour of the pearls.
All the samples are shown in Figure 1, and the sample number is displayed underneath each sample in order to facilitate discussion of the experimental test results of different colour pearls.
The UV–Vis spectra of the orange–yellow pearls (CF-1, CF-2, CF-3), purple pearls (CF-4, CF-5, CF-6) and orange–purple mixed-coloured pearls (CF-7 and CF-8) are shown in Figure 2a–c, respectively. We marked the peak position at the highest position of the largest absorption band in the visible region, as shown in Figure 2a,b. All yellow–orange pearls have an obvious absorption band centred at 470 nm, and all purple pearls have an obvious absorption band centred at 605 nm. These two absorption bands are probably produced by the orange–yellow pigment and the purple pigment in the pearls, respectively. At the same time, these two absorption bands are also present in the UV–Vis spectra of orange–purple mixed-colour pearls, as shown in Figure 2c. This suggests that the two pigments may be present in the mixed-colour pearls.
As can be seen from Figure 2a, the UV–visible spectra of samples CF-1, CF-2 and CF-3 all have an absorption band centred at about 470 nm that is mainly located in the blue light region. The absorption of purple–blue light is far higher than that of orange light, which makes the pearl appear orange. It is noticeable that the more intense the orange–yellow colour of the sample, the stronger the corresponding absorption band. We have integrated this absorption band and compared it with the colour of the pearl, as shown in Table 1. It is also noticeable that the more intense the orange–yellow colour of the sample, the larger the corresponding integral intensity of this absorption band. This suggests that this absorption band at 470 nm is closely related to the production of yellow–orange colour of the pearl.
From Figure 2b, it can be seen that there is an absorption band centred at 605 nm that is mainly located at the orange–red light region in the UV–Vis spectra of purple pearls. The absorption of orange–red light is much stronger than that of purple–blue light, which makes the pearl appear purple. It is noticeable that the more intense the purple colour of the sample, the stronger the corresponding absorption band. We have integrated this absorption band and compared it with the colour of the pearl, as shown in Table 2. It is also observed that the more intense the purple colour of the sample, the larger the corresponding integral intensity of this absorption band. This suggests that this absorption band at 605 nm is closely related to the production of the purple colour of the pearl.

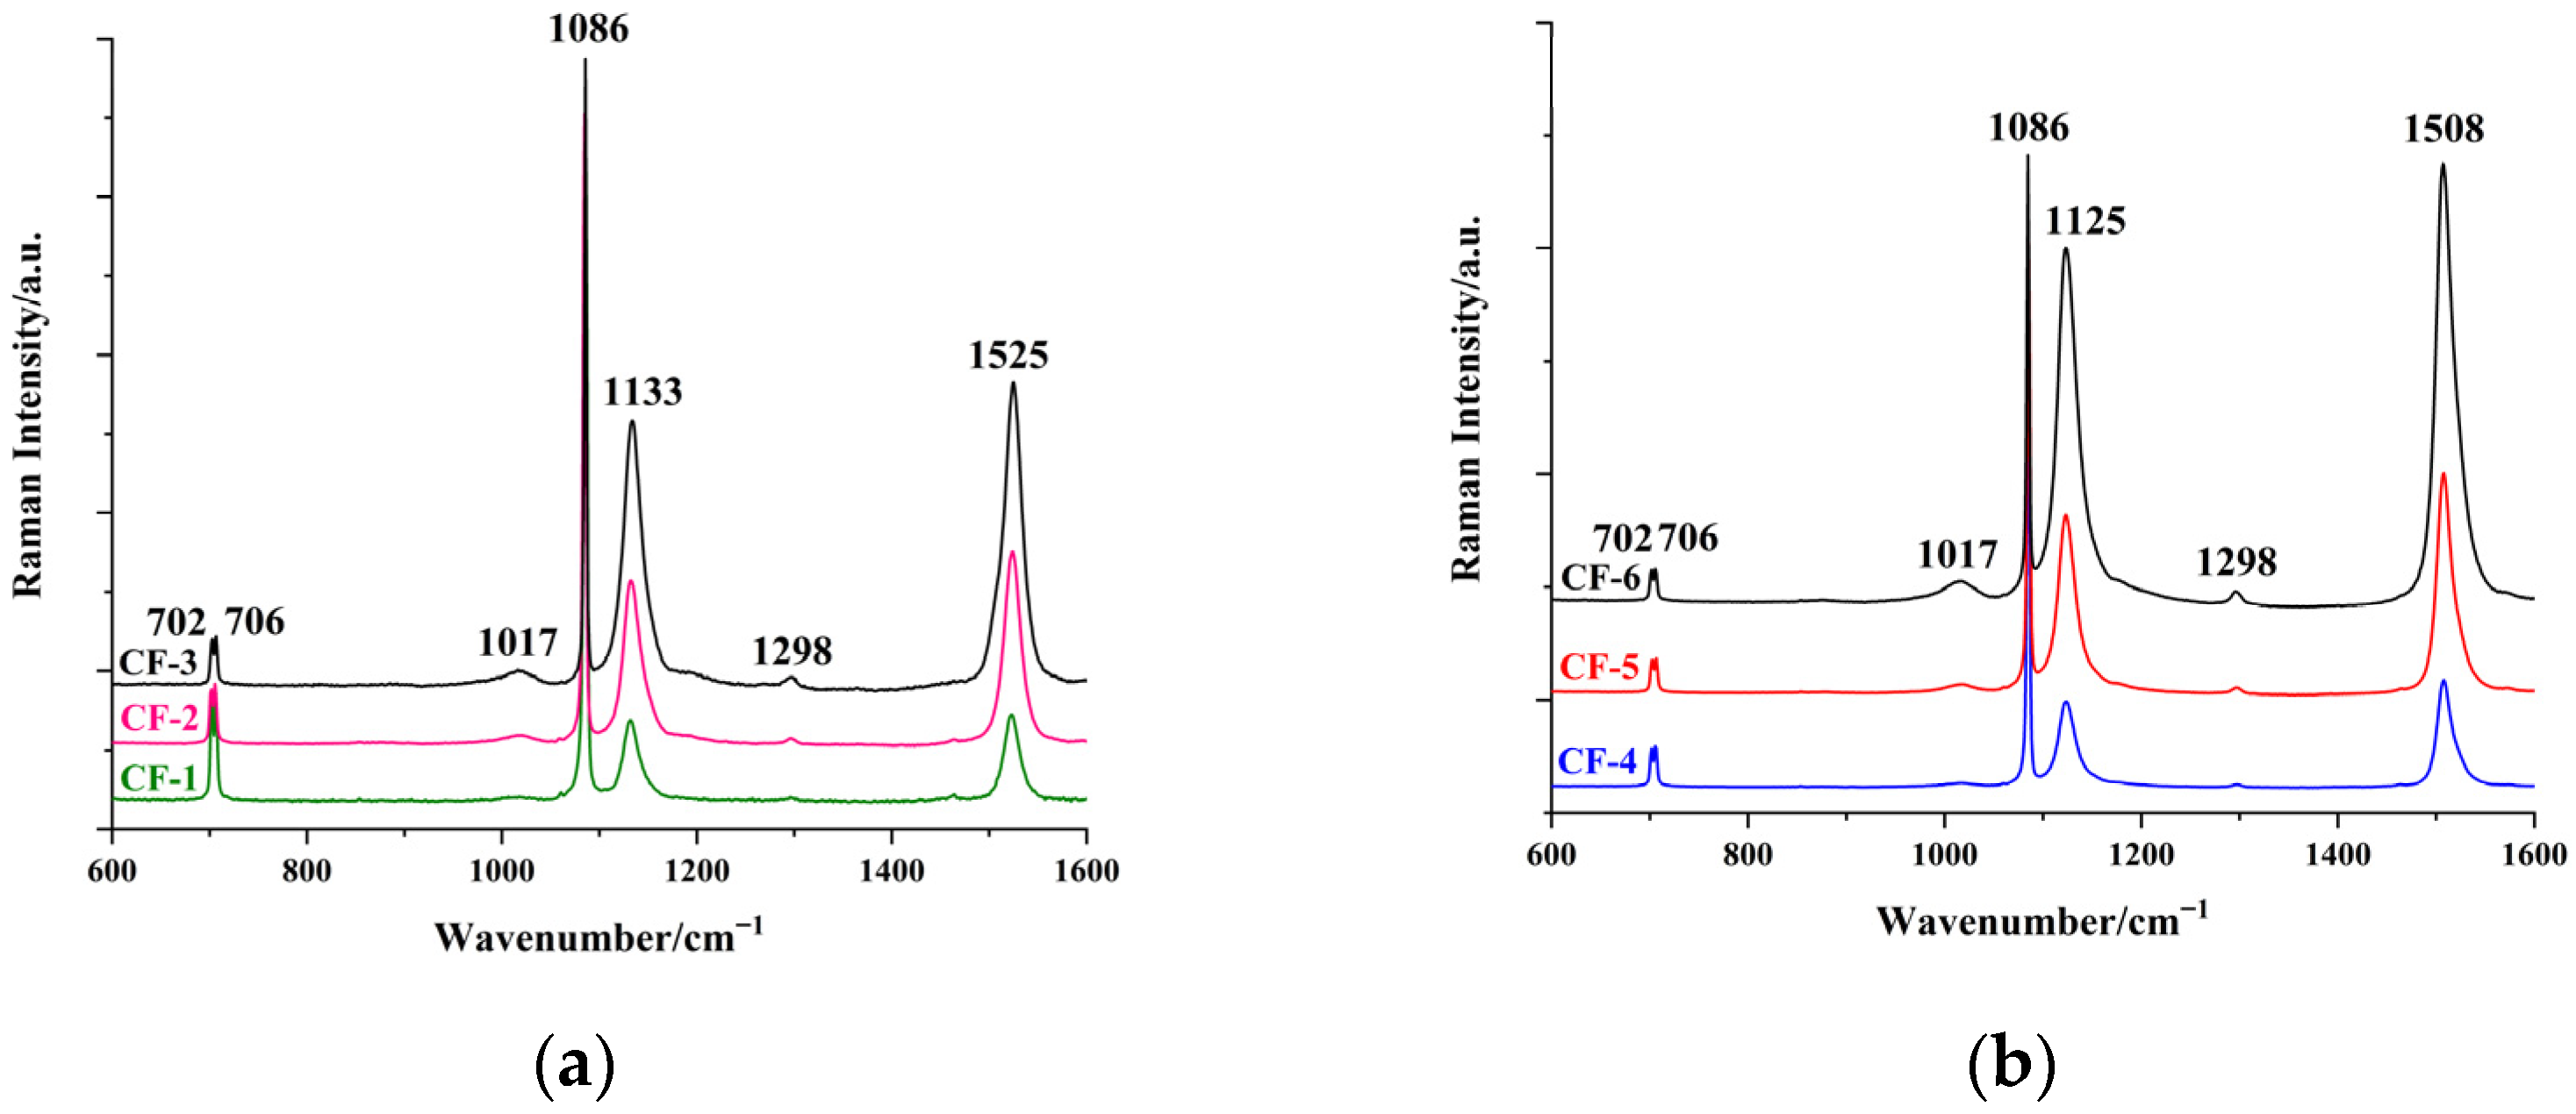
3.2. Characterisation of Pigments in Pearls by Raman Spectroscopy

The Raman spectra in the range of 600–1600 cm−1 of all pearl samples of different colours are summarised in Figure 3. Raman spectra of pearls are shown according to colour classification. Raman spectra of yellow–orange pearls (CF-1, CF-2, CF-3) and purple pearls (CF-4, CF-5, CF-6) are shown in Figure 3a,b, respectively. Raman spectra of orange–purple mixed-colour pearls (CF-7 and CF-8) are shown in Figure 3c,d. In the Raman spectra of freshwater pearls, the Raman peaks at 1086, 706, and 702 cm−1, which are stable regardless of the colour in the pearl, are assigned to the ν1 symmetric and ν4 in-plane binding modes of carbonate ions (CO32−) in aragonite [11]. Except for the Raman peaks of aragonite, other Raman peaks may be due to the presence of organic compounds [3]. All Raman peaks have been normalised to the peak at 1086 cm−1 and shifted for clarity so that the relative intensity of the pigment signals can be better compared. There are two strong Raman peaks located at about 1500 to 1550 cm−1 and about 1100 to 1150 cm−1. They belong to the stretching vibrations of the C=C double bond (ν1 close to 1500 cm−1) and the C-C single bond (ν2 close to 1130 cm−1) in polyene [37,38]. Actually, in the system of conjugated C-C bonds in polyenes, there are no single- and double-bonds: there are alternating shorter and longer C-C bonds, all having multiplicities, intermediate between 1 and 2. The “C=C double bond” is a shortened C-C bond with a multiplicity n in the range 1.5 < n < 2. The “C-C single bond” is also conjugated with a multiplicity in the range 1 < n < 1.5. In this research, “C=C double bond” and “C-C single bond” are used for simplicity.
Raman spectra of the pure colour pearls are discussed first. In Figure 3a, there are peaks at 1525, 1298, 1133 and 1017 cm−1 in the Raman spectra of the orange pearl in addition to the peaks of aragonite. The ν1 (C=C stretching) is at 1525 cm−1, and the ν2 (C-C stretching) is at 1133 cm−1. Judging by the intensity of the peaks, CF-3 is the strongest, followed by CF-2, and CF-1 is the weakest. The orange colour also becomes weaker from CF-3 to CF-1. Thus, the peaks at 1525, 1298, 1133, and 1017 cm−1 may belong to the orange polyene pigment. It can be seen from Figure 3b that peaks are located at 1508, 1298, 1125, and 1017 cm−1 in the Raman spectra of purple pearls, the ν1 (C=C stretching) is located at 1508 cm−1 and the ν2 (C-C stretching) is located at 1125 cm−1. Judging by the intensity of the peaks, CF-6 is the strongest, followed by CF-5, and CF-4 is the weakest. The purple colour also becomes weaker from CF-6 to CF-5. The positions of the two Raman peaks are affected by the chain length of the polyene [3], indicating that the conjugated chain length of the orange polyene pigment is different from that of the purple polyene pigment, which affects the absorption in the visible light region, resulting in the different colours in pearls [49,50]. As for the peaks at 1298 and 1017 cm−1, the peak at 1298 cm−1 could be assigned to C-H bending, and the peak at 1017 cm−1 may be assigned to the CH out-of-plane wagging or CH3 rocking [12]. There is currently some controversy over the assignment on the peak at 1017 cm−1 [12].
It can be clearly seen from Figure 3c,d that ν1 (C=C stretching) is apparently formed by the composite of two peaks located at 1525 cm−1 and 1508 cm−1, respectively. According to the previous analysis, the peak at 1525 cm−1 represents the orange polyene pigment, and the peak at 1508 cm−1 represents the purple polyene pigment. As for CF-7-1 and CF-8-1, orange is the dominant colour, and purple is the non-dominant colour, so the content of orange polyene pigment may be higher than that of purple polyene pigment. The 1525 cm−1 Raman peak intensity is stronger than the 1508 cm−1 one. On the other side, for CF-7-2 and CF-8-2, the purple colour is more dominant than the orange colour; thus, the content of purple polyene pigment may be higher than that of orange pigment. The 1508 cm−1 Raman peak intensity is stronger than the 1525 cm−1 one.
In order to better show the characteristics of ν1 (C=C stretching), the samples CF-7 and CF-8 were selected for peak fitting, as shown in Figure 4. The peak at 1508 cm−1 represents the purple polyene plotted by the purple curve and marked as Peak 1, and the peak at 1525 cm−1 represents the orange polyene plotted by the orange curve and marked as Peak 2. Figure 4a,c show that the peak intensity of Peak 2 is higher than that of Peak 1 in the dominant orange position of mixed-colour pearls, indicating that the concentration of orange polyene is significantly higher than that of purple polyene. While Figure 4b,d clearly show that the peak intensity of Peak 1 is higher than that of Peak 2 in the purple dominant position of mixed-colour pearl, implying that the concentration of purple polyene is higher than that of orange polyene.
The distribution of pigments on the pearl surface of sample CF-7 was analysed by Raman mapping. The intensity of peaks located at 1525 and 1508 cm−1 were used approximately to represent the concentration of orange polyene and purple polyene, respectively. The intensity ratio of the peaks at 1525 and 1508 cm−1 represents the distribution of pigments on the pearl surface. Figure 5a shows the colour characteristics of the pearl surface taken by micrograph. It can be seen that the colour in the upper left corner is purple, and the colour in the lower right corner is orange. The colour gradually changes from purple to orange from the upper left to the lower right corner. Figure 5b shows the distribution of the 1525 cm−1/1508 cm−1 peak intensity ratio. The peak intensity ratio increases from blue to red. It can be observed from Figure 5b that the distribution of peak intensity ratio shows a tendency of gradual increase from the upper left corner to the lower right corner, meaning that the proportion of 1525 cm−1 peak intensity increases from the upper left corner to the lower right corner and the proportion of 1508 cm−1 peak intensity decreases. This Raman mapping result shows that the proportion of orange polyene increases from the upper left corner to the lower right corner, and the proportion of purple polyene decreases, which is very consistent with the colour distribution characteristics of orange–yellow from the upper left corner to the lower right corner of the pearl surface. The Raman mapping technology can show well the distribution of the pigment on the pearl surface.
To further illustrate the relationship between the colour of the pearls, the major visible absorption bands and the major Raman peak positions of the polyene pigments, the major absorption bands in the UV–Vis spectrum and the major Raman peaks of the polyene pigments were integrated and compared to the colour of the pearls as shown in Table 3 and Table 4.
As can be seen from Table 3 and Table 4, in the pure colour pearls, the integration of the main visible absorption bands increases with increasing colour intensity, as does the integral intensity of the main Raman peaks of the polyene pigments, indicating a positive correlation between colour intensity, visible absorption bands, and the main Raman peaks of the polyene pigments. Therefore, we can perform DFT calculations on polyene pigments to understand the colour origin of pearl in greater depth.

3.3. Theoretical Analysis of Pigments and Colour Origin of Pearls

Based on the UV–Vis and Raman spectra, the Raman spectra of pearls, there may be polyenes with different chain lengths in pearls of different colours. To further explain the spectral properties and colour origin of pearls, we simulated the Raman spectrum of polyenes by DFT calculation and calculated the electronic excitation of polyenes by TDDFT to obtain their theoretical UV–Vis spectra. The molecular structures of polyenes in different colours of pearls were investigated by comparing the theoretical Raman spectra with the experimental Raman spectra of pearls. Then the potential structures were selected for the electron excitation calculation based on TDDFT, and the theoretical UV–Vis spectra of polyenes were obtained to discuss the colour of the pearl further.
According to previous research results, the B3LYP function is more applicable to calculating the vibrational frequency of polyenes. Even if a small basis set is used, as long as a reasonable frequency correction factor is used, highly accurate results can be achieved. The Raman shifts of the C=C double bond stretching vibration of the polyenes with various chain lengths were calculated under different calculation conditions (B3LYP/6-31G(d) and B3LYP/6-311G(d,p)). In Figure 6, the number of C=C double bonds of each polyene molecule was taken as the abscissa and the Raman shift of the C=C stretching was taken as the ordinate. An orange line and a purple line were drawn horizontally at 1525 cm−1 and 1508 cm−1, respectively.
From Figure 6, it can be noticed that the Raman shifts calculated by the same functional (B3LYP) with different basis sets (6-31G(d) and 6-311G(d)) are very close to each other as long as the frequency correction factor is reasonable. This result is relatively ideal. From the abscissa value corresponding to the intersection of the orange line with the curve, we can see that the number of C=C double bonds contained in the orange polyene is 10 (C10 polyene). Similarly, we could determine that the number of C=C double bonds contained in the purple polyene is 12 (C12 polyene). According to the experimental Raman spectra of pearls and the theoretical Raman shifts of polyenes, we tentatively speculate that the orange and purple pearls are produced by C10 polyene and C12 polyene, respectively.
We have calculated the electronic excited states of C10 polyene and C12 polyene by TDDFT to obtain their theoretical UV–Vis spectra. PBE0 is a function commonly used to calculate the UV–Vis spectra of polyenes. The theoretical UV–Vis spectra of the two polyenes are shown in Figure 7a and Figure 7b, respectively.
There is an absorption band centred at 452 nm in the theoretical UV–Vis spectrum of C10 polyene, as shown in Figure 7a. This absorption band mainly absorbs purple–blue light and transmits orange light, so C10 polyene may appear orange–yellow. This absorption band is very close to the absorption band at 470 nm in the experimental UV–Vis spectrum of orange pearl, indicating that C10 polyene is the main structure that colours the orange pearl. There is an absorption band centred at 572 nm in the theoretical UV–Vis spectrum of C12 polyene in Figure 7b. This absorption band mainly absorbs the orange light and transmits the purple light, causing the polyene to appear purple. The position of this theoretical absorption band is close to the absorption band at 605 nm in the experimental UV–Vis spectrum of purple pearl. The theoretical absorption characteristics of polyenes are close to the experimental absorption characteristics of pearl. The colour origin of the pearls could be interpreted by explaining the theoretical absorption band of polyene.
The molecular orbital transition (MO transition) is commonly used to discuss the characteristics of electron excitation, but it usually involves many MO pairs. When the contribution of the MO transition is absolutely dominant, the electron excitation can be described by the properties of these molecular orbitals. The main absorption band is dominated by the MO transition between the HOMO and LUMO. Diagrams of the HOMO and LUMO of C10 polyene and C12 polyene were drawn using the Multiwfn program (as shown in Figure 8). The electron excitation could be divided into local excitation and charge transfer excitation based on the distribution area of electrons before and after excitation. We could find that the MO transitions from HOMO to LUMO of the two polyenes do not obviously change the distributions of electrons, as shown in Figure 8, so the excitation types of these two polyenes are both local excitations.
Although MO transition could be used to discuss the feature of electron excitation, hole-electron analysis theory can present a unique distribution of hole and electron. The hole describes where the excited electron leaves, and the electron describes where the excited electron goes [51]. The electron and hole for the main absorption bands between the excited state and ground state of polyene chains were drawn using the program Multiwfn, as shown in Figure 9.
It can be observed that the isosurfaces of the HOMO and LUMO are almost the same as the isosurfaces of hole and electron, respectively. Through hole-electron analysis, we could find that the distribution of electrons is similar before and after excitation, and there is no obvious change in the distribution of electrons from Figure 9. It can also be concluded from the hole-electron analysis that the excitations of the two polyenes belong to local excitation. Then, we conclude that the absorption bands centred at 452 nm and 572 nm of simulated UV–Vis of polyenes are mainly caused by the HOMO→LUMO transition in the polyene chains, and they are both local excitations. Therefore, the orange colour of freshwater pearls is mainly caused by the HOMO–LUMO transition of polyene with 10 shortened C–C bonds with a multiplicity n in the range 1.5 < n < 2; similarly, the purple colour of freshwater pearls is mainly caused by the HOMO–LUMO transition of polyene with 12 shortened C–C bonds with a multiplicity n in the range 1.5 < n < 2, and the orange–purple mixed colour is caused by the HOMO–LUMO transitions of the two polyene structures together.

4. Conclusions

The Raman spectra of freshwater pearls of different colours show the characteristics of polyene pigments: a strong Raman peak at approximately 1500 cm−11 C=C stretching) and a strong Raman peak at approximately 1130 cm−12 C-C stretching). The specific positions of ν1 and ν2 will vary among different coloured pearls. The ν1 and ν2 of pure orange pearls are located at 1525 cm−1 and 1133 cm−1. The ν1 and ν2 of pure purple pearl are located at 1508 cm−1 and 1125 cm−1. At the same time, the Raman spectral peaks of the orange–purple mixed-colour pearls show the mixed character of these peaks. Through the simulated Raman spectra obtained by DFT calculation, it was found that the exact position of ν1 depends on the number of C=C double bonds. Orange and purple pearls are caused by the polyene with 10 C=C double bonds (10 shortened C-C bonds with the multiplicity n in the range 1.5 < n < 2) and the polyene with 12 C=C double bonds (12 shortened C-C bonds with a multiplicity n in the range 1.5 < n < 2), respectively. The colour of the orange–purple mixed colour mainly depends on the proportion of the content of these two polyene structures. According to the experimental UV–Vis spectra of pearls and the electronic excitation calculation of polyenes based on TDDFT, we believe that the colour of pearls is mainly caused by the HOMO–LUMO transition of the conjugated structure of polyene.

Author Contributions

Conceptualization, C.C. and A.H.S.; methodology, C.C.; software, C.C.; validation, J.Y. and C.Z.; formal analysis, C.C. and X.Y.; writing—original draft preparation, C.C.; writing—review and editing, C.C. and A.H.S. All authors have read and agreed to the published version of the manuscript.

Funding

This research was funded by the Fundamental Research Funds for National University, China University of Geosciences (Wuhan), grant number CUGDCJJ202225 and the financial support from the Center for Innovative Gem Testing Technology, China University of Geosciences (Wuhan), grant number CIGTXM-02-202101.

Data Availability Statement

Data is available from the corresponding authors.

Acknowledgments

The authors thank Xiaosong Li (Department of Chemistry, University of Washington, Seattle, WA, USA) for his helpful suggestions.

Conflicts of Interest

The authors declare no conflict of interest.

References

  1. Scarratt, K.; Moses, T.; Akamatsu, S. Characteristics of Nuclei in Chinese Freshwater Cultured Pearls. Gems Gemol. 2000, 36, 98–109. [Google Scholar] [CrossRef]
  2. Kiefert, L.; Moreno, D.M.; Arizmendi, E.; Hnni, H.A.; Elen, S. Cutured Pearls from the Gulf of California, Mexico. Gems Gemol. 2004, 40, 26–38. [Google Scholar] [CrossRef] [Green Version]
  3. Karampelas, S.; Fritsch, E.; Mevellec, J.Y.; Gauthier, J.P.; Sklavounos, S.; Soldatos, T. Determination by Raman Scattering of the Nature of Pigments in Cultured Freshwater Pearls from the Mollusk Hyriopsis cumingi. J. Raman Spectrosc. 2007, 38, 217–230. [Google Scholar] [CrossRef]
  4. Fiske, D.; Shepherd, J. Continuity and Change in Chinese Freshwater Pearl Culture. Gems Gemol. 2007, 43, 138–145. [Google Scholar] [CrossRef] [Green Version]
  5. Akamatsu, S.; Zansheng, L.T.; Moses, T.M.; Scarratt, K. The Current Status of Chinese Freshwater Cultured Pearls. Gems Gemol. 2001, 37, 96–113. [Google Scholar] [CrossRef] [Green Version]
  6. Zhang, G.; Xie, X.; Wang, Y. Raman spectra of Carotenoid in the Nacre of Hyriopsis cumingii (Lea) Shell. Acta Mineral. Sin. 2001, 21, 389–392. (In Chinese) [Google Scholar] [CrossRef]
  7. Yang, M.; Guo, S.; Shi, L.; Wang, W. Study on Compositions and Colouring Mechanism of Freshwater Cultured Pearls. J. Gems Gemol. 2004, 6, 10–13. (In Chinese) [Google Scholar] [CrossRef]
  8. Gao, Y.; Zhang, B. Research on Relationship between Colour and Raman Spectrum of Freshwater Cultured Pearl. J. Gems Gemol. 2001, 3, 17–20. (In Chinese) [Google Scholar] [CrossRef]
  9. Hao, Y.; Zhang, G. In situ Resonance Raman Spectra of Organic Pigments in Freshwater Cultured Pearls. Spectrosc. Spect. Anal. 2004, 26, 78–80. (In Chinese) [Google Scholar]
  10. Qin, Z.; Ma, H.; Mu, S.; Tong, Z. Research on Relationship between color and Raman Spectrum of Freshwater Cultured Pearl of Good Quality. Acta Mineral. Sin. 2007, 27, 73–76. (In Chinese) [Google Scholar] [CrossRef]
  11. Urmos, J.; Sharma, S.K.; Mackenzie, F.T. Characterization of Some Biogenic Carbonates with Raman Spectroscopy. Am. Mineral. 1991, 76, 641–646. [Google Scholar]
  12. Soldati, A.L.; Jacob, D.E.; Wehrmeister, U.; Hger, T.; Hofmeister, W. Micro-Raman Spectroscopy of Pigments Contained in Different Calcium Carbonate Polymorphs from Freshwater Cultured Pearls. J. Raman Spectrosc. 2008, 39, 525–536. [Google Scholar] [CrossRef]
  13. Bergamonti, L.; Bersani, D.; Csermely, D.; Lottici, P.P. The Nature of the Pigments in Corals and Pearls: A Contribution from Raman Spectroscopy. Spectrosc. Lett. 2011, 44, 453–458. [Google Scholar] [CrossRef]
  14. Shi, L.; Liu, X.; Mao, J.; Han, X. Study of Coloration Mechanism of Cultured Freshwater Pearls from Mollusk Hyriopsis cumingii. J. Appl. Spectrosc. 2014, 81, 97–101. [Google Scholar] [CrossRef]
  15. Karampelas, S.; Fritsch, E.; Makhlooq, F.; Mohamed, F.; Al-Alawi, A. Raman Spectroscopy of Natural and Cultured Pearls and Pearl Producing Mollusc Shells. J. Raman Spectrosc. 2020, 51, 1813–1821. [Google Scholar] [CrossRef]
  16. Kupka, T.; Buczek, A.; Broda, M.A.; Szostak, R.; Lin, H.M.; Fan, L.W.; Wrzalik, R.; Stobiński, L. Modeling Red Coral (Corallium rubrum) and African Snail (Helixia aspersa) Shell Pigments: Raman Spectroscopy versus DFT Studies. J. Raman Spectrosc. 2016, 47, 908–916. [Google Scholar] [CrossRef]
  17. Finkel’shtein, E.I. Modern Methods of Analysis of Carotenoids (Review). Pharm. Chem. J. 2016, 50, 96–107. [Google Scholar] [CrossRef]
  18. Williams, S.T.; Ito, S.; Wakamatsu, K.; Goral, T.; Edwards, N.P.; Wogelius, R.A.; Henkel, T.; De Oliveira, L.F.C.; Maia, L.F.; Strekopytov, S.; et al. Identification of Shell Colour Pigments in Marine Snails Clanculus pharaonius and C. margaritarius (Trochoidea; Gastropoda). PLoS ONE 2016, 11, e0156664. [Google Scholar] [CrossRef] [Green Version]
  19. Bergamonti, L.; Bersani, D.; Mantovan, S.; Lottici, P.P. Micro-Raman Investigation of Pigments and Carbonate Phases in Corals and Molluscan Shells. Eur. J. Mineral. 2014, 25, 845–853. [Google Scholar] [CrossRef]
  20. Barnard, W.; De Waal, D. Raman Investigation of Pigmentary Molecules in the Molluscan Biogenic Matrix. J. Raman Spectrosc. 2006, 37, 342–352. [Google Scholar] [CrossRef]
  21. Stemmer, K.; Nehrke, G. The Distribution of Polyenes in the Shell of Arctica Islandica from North Atlantic Localities: A Confocal Raman Microscopy Study. J. Molluscan Stud. 2014, 80, 365–370. [Google Scholar] [CrossRef]
  22. Thompson, C.M.; North, E.W.; Kennedy, V.S.; White, S.N. Classifying Bivalve Larvae Using Shell Pigments Identified by Raman Spectroscopy. Anal. Bioanal. Chem. 2015, 407, 3591–3604. [Google Scholar] [CrossRef] [PubMed]
  23. Kantha, S.S. Carotenoids of Edible Molluscs: A Review. J. Food Biochem. 1989, 13, 429–442. [Google Scholar] [CrossRef]
  24. Llansola-Portoles, M.J.; Pascal, A.A.; Robert, B. Electronic and Vibrational Properties of Carotenoids: From in Vitro to in Vivo. J. R. Soc. Interface 2017, 14, 20170504. [Google Scholar] [CrossRef] [PubMed] [Green Version]
  25. Choe, C.S.; Ri, J.R.; Schleusener, J.; Lademann, J.; Darvin, M.E. The Non-Homogenous Distribution and Aggregation of Carotenoids in the Stratum Corneum Correlates with the Organization of Intercellular Lipids in Vivo. Exp. Dermatol. 2019, 28, 1237–1243. [Google Scholar] [CrossRef]
  26. de Oliveira, V.E.; Castro, H.V.; Edwards, H.G.M.; de Oliveiraa, L.F.C. Carotenes and Carotenoids in Natural Biological Samples: A Raman Spectroscopic Analysis. J. Raman Spectrosc. 2010, 41, 642–650. [Google Scholar] [CrossRef]
  27. Maia, L.F.; Fernandes, R.F.; Lobo-Hajdu, G.; De Oliveira, L.F.C. Conjugated Polyenes as Chemical Probes of Life Signature: Use of Raman Spectroscopy to Differentiate Polyenic Pigments. Philos. Trans. R. Soc. A Math. Phys. Eng. Sci. 2014, 372, 1–11. [Google Scholar] [CrossRef] [Green Version]
  28. Merlin, J.C.; Delé-Dubois, M.L. Resonance Raman Characterization of Polyacetylenic Pigments in the Calcareous Skeleton. Comp. Biochem. Physiol. Part B Biochem. 1986, 84, 97–103. [Google Scholar] [CrossRef]
  29. Fritsch, E.; Karampelas, S. Comment on: Determination of Canthaxanthin in the Red Coral (Corallium rubrum) from Marseille by HPLC Combined with UV and MS Detection (Cvejic et al. Mar Biol 152:855-862, 2007). Mar. Biol. 2008, 154, 929–930. [Google Scholar] [CrossRef]
  30. Peebles, B.A.; Gordon, K.C.; Smith, A.M.; Smith, G.P.S. First Record of Carotenoid Pigments and Indications of Unusual Shell Structure in Chiton Valves. J. Molluscan Stud. 2017, 83, 476–480. [Google Scholar] [CrossRef] [Green Version]
  31. Brambilla, L.; Tommasini, M.; Zerbi, G.; Stradi, R. Raman Spectroscopy of Polyconjugated Molecules with Electronic and Mechanical Confinement: The Spectrum of Corallium rubrum. J. Raman Spectrosc. 2012, 43, 1449–1458. [Google Scholar] [CrossRef]
  32. Darvin, M.E.; Meinke, M.C.; Sterry, W.; Lademann, J. Optical Methods for Noninvasive Determination of Carotenoids in Human and Animal Skin. J. Biomed. Opt. 2013, 18, 061230. [Google Scholar] [CrossRef] [PubMed]
  33. Maoka, T. Recent Progress in Structural Studies of Carotenoids in Animals and Plants. Arch. Biochem. Biophys. 2009, 483, 191–195. [Google Scholar] [CrossRef]
  34. McGraw, K.J.; Nogare, M.C. Carotenoid Pigments and the Selectivity of Psittacofulvin-Based Coloration Systems in Parrots. Comp. Biochem. Physiol.-B Biochem. Mol. Biol. 2004, 138, 229–233. [Google Scholar] [CrossRef]
  35. Vershinin, A. Biological Functions of Carotenoids—Diversity and Evolution. BioFactors 1999, 10, 99–104. [Google Scholar] [CrossRef] [PubMed]
  36. Lavelli, V.; Zanoni, B.; Zaniboni, A. Effect of Water Activity on Carotenoid Degradation in Dehydrated Carrots. Food Chem. 2007, 104, 1705–1711. [Google Scholar] [CrossRef]
  37. Withnall, R.; Chowdhry, B.Z.; Silver, J.; Edwards, H.G.M.; De Oliveira, L.F.C. Raman Spectra of Carotenoids in Natural Products. Spectrochim. Acta-Part A Mol. Biomol. Spectrosc. 2003, 59, 2207–2212. [Google Scholar] [CrossRef] [PubMed]
  38. Macernis, M.; Sulskus, J.; Malickaja, S.; Robert, B.; Valkunas, L. Resonance Raman Spectra and Electronic Transitions in Carotenoids: A Density Functional Theory Study. J. Phys. Chem. A 2014, 118, 1817–1825. [Google Scholar] [CrossRef]
  39. Saito, S.; Tasumi, M.; Eugster, C.H. Resonance Raman Spectra (5800–40 cm−1) of All-trans and 15-cis Isomers of Β-carotene in the Solid State and in Solution. Measurements with Various Laser Lines from Ultraviolet to Red. J. Raman Spectrosc. 1983, 14, 299–309. [Google Scholar] [CrossRef]
  40. Saito, S.; Tasumi, M. Normal-coordinate Analysis of Retinal Isomers and Assignments of Raman and Infrared Bands. J. Raman Spectrosc. 1983, 14, 236–245. [Google Scholar] [CrossRef]
  41. Okamoto, H.; Saito, S.; Hamaguchi, H.-O.; Tasumi, M.; Eugster, C.H. Resonance Raman Spectra and Excitation Profiles of Tetradesmethyl-β-Carotene. J. Raman Spectrosc. 1984, 15, 331–335. [Google Scholar] [CrossRef]
  42. Hoskins, L.C.; Alexander, V. Determination of Carotenoid Concentrations in Marine Phytoplankton by Resonance Raman Spectrometry. Anal. Chem. 1977, 49, 695–697. [Google Scholar] [CrossRef]
  43. Frisch, M.; Trucks, G.; Schlegel, H.; Scuseria, G.; Robb, M.; Cheeseman, J.; Scalmani, G.; Barone, V.; Petersson, G.; Nakatsuji, H. Gaussian 16, Revision C. 01; Gaussian, Inc.: Wallingford, CT, USA, 2019. [Google Scholar]
  44. Lu, T.; Chen, F. Multiwfn: A Multifunctional Wavefunction Analyzer. J. Comput. Chem. 2012, 33, 580–592. [Google Scholar] [CrossRef]
  45. Stephens, P.J.; Devlin, F.J.; Chabalowski, C.F.; Frisch, M.J. Ab Initio Calculation of Vibrational Absorption and Circular Dichroism Spectra Using Density Functional Force Fields. J. Phys. Chem. 1994, 98, 11623–11627. [Google Scholar] [CrossRef]
  46. Scott, A.P.; Radom, L. Harmonic Vibrational Frequencies: An Evaluation of Hartree-Fock, Møller-Plesset, Quadratic Configuration Interaction, Density Functional Theory, and Semiempirical Scale Factors. J. Phys. Chem. 1996, 100, 16502–16513. [Google Scholar] [CrossRef]
  47. Kashinski, D.O.; Chase, G.M.; Nelson, R.G.; Di Nallo, O.E.; Scales, A.N.; Vanderley, D.L.; Byrd, E.F.C. Harmonic Vibrational Frequencies: Approximate Global Scaling Factors for TPSS, M06, and M11 Functional Families Using Several Common Basis Sets. J. Phys. Chem. A 2017, 121, 2265–2273. [Google Scholar] [CrossRef] [PubMed]
  48. Adamo, C.; Barone, V. Toward Reliable Density Functional Methods without Adjustable Parameters: The PBE0 Model. J. Chem. Phys. 1999, 110, 6158–6170. [Google Scholar] [CrossRef]
  49. Schügerl, F.B.; Kuzmany, H. Optical Modes of Trans-Polyacetylene. J. Chem. Phys. 1981, 74, 953–958. [Google Scholar] [CrossRef]
  50. Schaffer, H.E.; Chance, R.R.; Silbey, R.J.; Knoll, K.; Schrock, R.R. Conjugation Length Dependence of Raman Scattering in a Series of Linear Polyenes: Implications for Polyacetylene. J. Chem. Phys. 1991, 94, 4161–4170. [Google Scholar] [CrossRef] [Green Version]
  51. Liu, Z.; Lu, T.; Chen, Q. An Sp-Hybridized All-Carboatomic Ring, Cyclo[18]Carbon: Electronic Structure, Electronic Spectrum, and Optical Nonlinearity. Carbon 2020, 165, 461–467. [Google Scholar] [CrossRef]
Figure 1. Freshwater cultured pearl samples (yellow–orange pearls CF-1, CF-2, CF-3, purple pearls CF-4, CF-5, CF-6, and orange–purple mixed-colour pearls CF-7, CF-8).
Minerals 13 00959 g001
Figure 2. (a) UV–Vis spectra of yellow–orange pearls (CF-1, CF-2, CF-3); (b) UV–Vis spectra of purple pearls (CF-4, CF-5, CF-6); (c) UV–Vis spectra of orange–purple mixed-colour pearls (CF-7 and CF-8).
Minerals 13 00959 g002
Figure 3. (a) Raman spectra of yellow–orange pearls (CF-1, CF-2, CF-3); (b) Raman spectra of purple pearls (CF-4, CF-5, CF-6); (c) Raman spectra of orange–purple mixed-colour pearl (CF-7); (d) Raman spectra of orange–purple mixed-colour pearl (CF-8).
Minerals 13 00959 g003aMinerals 13 00959 g003b
Figure 4. (ad). The C=C stretching Raman peak decomposition of orange–purple mixed-colour pearls.
Minerals 13 00959 g004
Figure 5. (a) The surface of a pearl characterised by Raman mapping. (b) The intensity distribution of the 1525 cm−1/1508 cm−1 peak intensity ratio. A change from blue to red indicates increasing intensity.
Minerals 13 00959 g005
Figure 6. Relationship between the number of C=C double bonds and simulated positions of C=C stretching Raman peaks at B3LYP/6-31G(d) and B3LYP/6-311G(d,p).
Minerals 13 00959 g006
Figure 7. (a) Simulated UV–Vis spectrum of C10 polyene. (b) Simulated UV–Vis spectrum of C12 polyene. The red curve represents the molar absorption coefficient broadened by excitation energy and oscillator strength, shown as black spikes.
Minerals 13 00959 g007
Figure 8. Dominant contribution of MO transitions (HOMO and LUMO) to the absorption band at 452 nm of C10 polyene and dominant contribution of MO transitions (HOMO and LUMO) to the absorption band at 572 nm of C12 polyene. The isosurface exhibit MO wavefunctions; the green and blue parts correspond to isovalues of 0.05 and −0.05, respectively.
Minerals 13 00959 g008
Figure 9. The real space representation of electron and hole for the absorption band at 452 nm of C10 polyene and the real space representation of electron and hole for the absorption band at 572 nm of C12 polyene. Green and blue isosurfaces correspond to electron and hole distributions, respectively. Isovalue is set to 0.002.
Minerals 13 00959 g009
Table 1. Comparison of the colour of yellow–orange pearl with the integral intensity of UV–Vis absorbance band at 470 nm.
SampleColourIntegral Intensity of UV–Vis Absorbance Band at 470 nm
(Boundary: 350 nm to 600 nm)
CF-1Yellow10,770
CF-2orange15,060
CF-3Intense orange17,440
Table 2. Comparison of the colour of purple pearl with the integral intensity of UV–Vis absorbance band at 605 nm.
SampleColourIntegral Intensity of UV–Vis Absorbance Band at 605 nm
(Boundary: 450 nm to 800 nm)
CF-4Slight purple16,540
CF-5Purple18,600
CF-6Intense purple20,410
Table 3. Comparison of integral intensity of UV–Vis absorbance band at 470 nm with integral intensity of Raman band at 1525 cm−1 in yellow–orange pearls.
SampleColourIntegral Intensity of UV–Vis Absorbance Band at 470 nm (Boundary: 350 to 600 nm)Integral Intensity of Raman Band at 1525 cm−1
(Boundary: 1450 to 1600 cm−1)
CF-1Yellow10,7704.371
CF-2Orange15,0608.124
CF-3Intense orange17,44014.63
Table 4. Comparison of integral intensity of UV–Vis absorbance band at 605 nm with integral intensity of Raman band at 1508 cm−1 in purple pearls.
SampleColourIntegral Intensity of UV–Vis Absorbance Band at 605 nm (Boundary: 450 to 800 nm)Integral Intensity of Raman Band at 1508 cm−1
(Boundary: 1450 to 1600 cm−1)
CF-4Slight purple16,5405.965
CF-5Purple18,60012.62
CF-6Intense purple20,41028.72
Disclaimer/Publisher’s Note: The statements, opinions and data contained in all publications are solely those of the individual author(s) and contributor(s) and not of MDPI and/or the editor(s). MDPI and/or the editor(s) disclaim responsibility for any injury to people or property resulting from any ideas, methods, instructions or products referred to in the content.

