Abstract
As the west rim of an ejective fold zone, the Huaying Mountain fault zone (HMFZ) in the eastern Sichuan Basin (SB) plays an important role in the tectonic evolution of the SB. The distribution and characteristics of HMFZ are strongly associated with tectonic activities and have greatly impacted the distribution of oil and gas reservoirs. However, its distribution and characteristics have remained poorly understood due to a lack of geophysical data, especially areal gravity survey and magnetotellurics (MT) survey, which are admittedly advantageous for detecting the edges of geological structures. Therefore, we carried out the ground geophysical surveys that areal gravity survey and MT survey, and acquired 1:250,000-scale real gravity data and MT data for the first time in this area. Optimized edge-detection methods were adopted to process the areal gravity data, allowing us to characterize the planar distribution of faults more reliably and convincingly. We found that the southern HMFZ is well developed and primarily trends in NNE and NE, whereas the subordinate faults trend in N-S and W-E. Vertical information for the faults extracted using the improved depth from the extreme points method revealed that the fault dominantly dipped to the SE, which was consistent with the results of MT inversion. Based on the spatial distribution of the faults, we further discussed the gravity anomaly, fault distribution, Luzhou palaeo uplift, and the distribution and characteristics of oil-gas resources, and found the convincing evidence to analysis the distribution of oil and gas resources in this region.
1. Introduction
The Sichuan Basin (SB) locates in the northern upper Yangtze Block, along the southern Qinling Mountains in China. This polycyclic superposed basin, which exhibits a rhomboid structure, covers an area of approximately 19 × 104 km2 [1], and is surrounded by typical structural and fault-fold belts. Although the internal structure of the basin is complex, it is commonly partitioned into the following structural units from west to east: (1) west belt area: a low steep belt in the west, (2) north belt area: a low gentle belt in the north, (3) the southeast fold belt: a low gentle fold belt in the southwest, distributed between the Huaying Mountain Faults zone and Qiyao Mountain, (4) central dome area: gentle belt in the centre of SB, locates around the Neijiang, (5) the east fold belt: a high steep faulted fold belt in the east, and (6) the southern fold belt: a low steep curved belt in southern Sichuan [1,2].
Recent interest in the exploration and development of shale gas in China has prompted much research, and the marine strata in the southern Yangtze area has shown great potential for shale gas exploration [3,4]. The SB is already an area of strong interest in terms of shale gas exploration and development in China [5]. Particularly exciting breakthroughs have been achieved in the Ordovician Wufeng Formation and Silurian Longmaxi Formation, including at the national shale gas production zones that in Changning, Weiyuan, Zhaotong, and Peiling [6]. With the continuous progress of shale gas exploration and development, the southern SB has become a new target area for oil and gas exploration. This area is characterized by representative structural deformation and shows abundant oil and gas resources. Commercial development is underway, including along the Yuanba–Puguang, Jiashiba, Pingqiao, Dingshan, and Chishu faults, which have critical areas of impacted shale gas preservation. Therefore, assessing the styles and geometries of tectonic patterns in the southern SB, the functions and structural control on the accumulation of shale gas is necessary to understand the conditions under which Palaeozoic shale gas has been retained and enriched. Such an assessment should provide powerful support for optimizing resource exploration in this area.
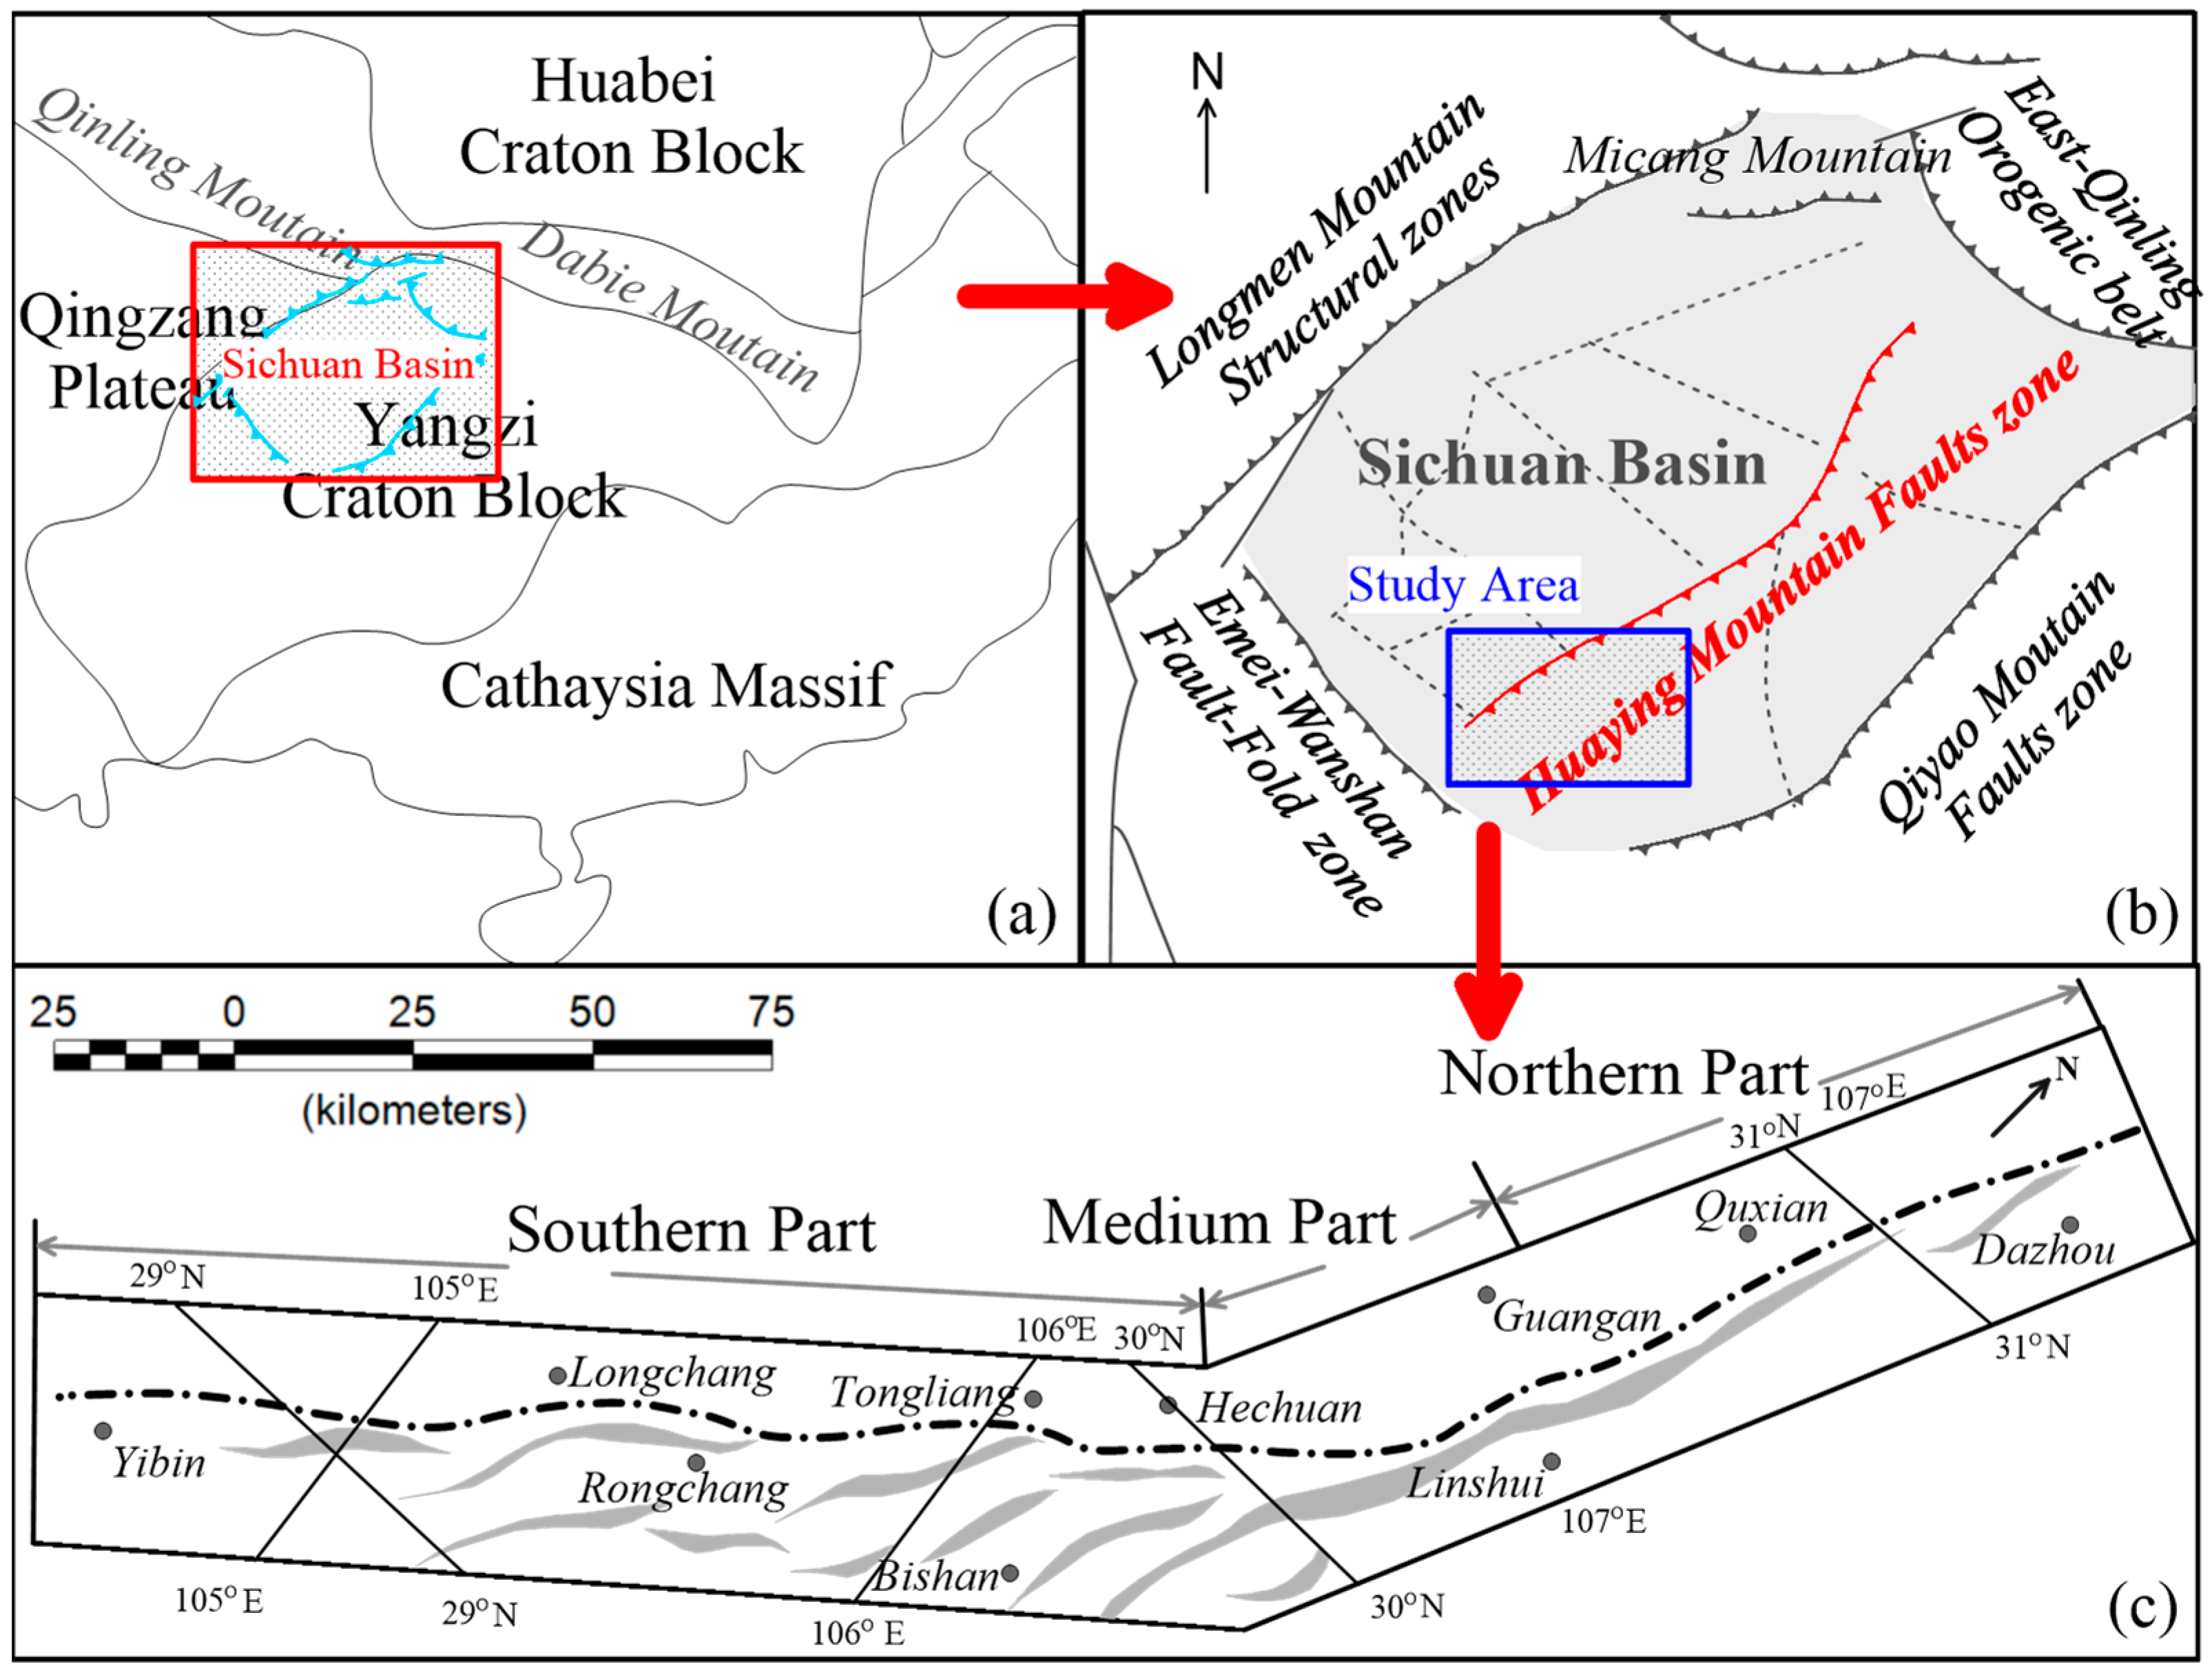
As the largest fault zone in the SB, Huaying Mountain fault zone (HMFZ) (Shown in Figure 1) forms the boundary between the central Sichuan dome and southeast fold zone, the area considered in this study also covers these two important tectonic units (shown with the blue rectangle in Figure 1a).
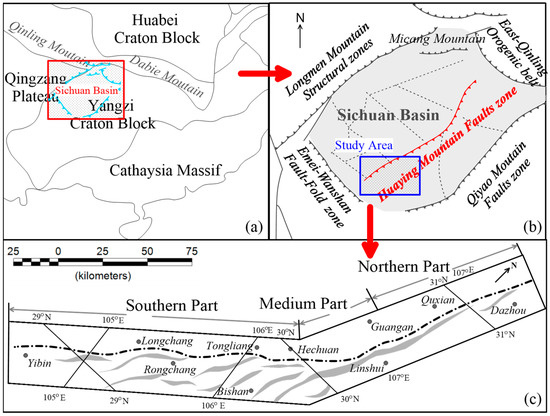
Figure 1.
Location Map of Huaying Mountain Faults Zone. (a) is the tectonic outline map of Yangtze craton (The revision from Li et al., 2019 [7]), the red rectangle is the range of (b), the blue line is the scope of the Sichuan Basin; (b) is the tectonic outline map of Sichuan Basin (revision from He et al., 2011), the blue rectangle is the study area in this paper; (c) is the distribution of the Huaying Mountain fault, which is shown in red line in (b) (revision from Wang et al., 2018 [8]).
HMFZ is a typical fault zone containing many great scale and depth faults that have meaningfully driven the tectonic evolution of southeast Sichuan meaningfully. Thus, HMFZ has been critical to the research on tectonic evolution and distribution of oil and gas reservoirs in this region [9,10,11]. Moreover, the development of an ejective fold in eastern Sichuan has been linked to many tectonic events (e.g., the Caledonian-Hercynian and Indosinian cycles) and many faults, including basement and thrust faults, were produced. These provided migration pathways and traps for Triassic and Jurassic carbon, making the region is attractive for petroleum exploration [9]. Many studies have been conducted on the formation and distribution of oil and gas resources and seismogenic conditions in the region [12,13,14,15,16,17,18,19,20,21,22,23].
Despite being a valuable study area for tectonic evolution and shale gas in the SB, the fault characteristics of the southern HMFZ remain poorly understood. Geophysical data can provide invaluable insights into the distribution of faults, which are essential for understanding the regional tectonics, deformation mechanisms, seismogenic conditions, and the occurrence of oil and gas. Gravity survey is advantageous because of its high horizontal resolution for linear structures [24,25], and magnetotellurics survey (MT) provides better result for the vertical extents of structures [26,27,28,29,30]. Some geophysical work involving seismic reflection profiles and seismic relocation methods [12] has been undertaken in the study area to reveal the characteristics of local geological structures, including the Heishui-Xiu Mountain crust seismic profile [8] and the Hechuan-Changshou seismic exploration profile [31]. However, the persistent lack of areal geophysical data has limited our understanding of the tectonics and reservoir dynamics of this region. Clearly, additional data is needed, particularly gravity data, which can detect the edges of geological structures and reliably reveal their planar distributions and characteristics, and MT data, which is superior for understanding the vertical extents of structures.
Therefore, in this study, we aimed to detect further details about the tectonic characteristics of Huaying Mountain fault zone, and we took two measurements: (1) We conducted a real gravity survey and MT survey in this research, and both gravity and MT exploration points are measured in area, the high precious geophysical data is the powerful basis to recognize the geophysical characterization reliably. (2) we adopted some typical methods to process the gravity data, and choose the optimized result as the evidence to infer the geological details, which can improve the reliability of the inferred results. Furthermore, based on the newly geological recognition of HMFZ, this paper discussed the relationships among the oil gas reservoirs, gravity anomaly and faults’ distribution, and found the convincing evidence for the distribution characteristics of the oil and gas resources in this region, which will be helpful for the next stage of resource exploration.
2. Geological Setting
2.1. Tectonics
The study area locates at the southern margin of Sichuan Basin (SC), and it covers the junction of Qingzang Plateau, Huabei Craton Block and Yangtze Craton Block, as shown in Figure 1a obviously, under the jointly promotion of these geological units, the study area becomes so meaningful to the research about the geological movement, SB evolution, resources’ distribution, etc. SB is surrounded by Longmen Mountain Tectonic zones, Micang Mountain, East Qinling Orogennic belt, Qiyao Mountain Faults zone and Emei-Wanshan Fault–Fold zone. (Figure 1b) [10,32,33] The HMFZ extends from Daxian in the north to Yibin in the south of SB (Figure 1c), trends 40–45° NE, is inclined by 30–70° SE, and is associated with compressive thrusting. The structural framework is dominated by the Huaying Mountain composite anticline (HMCA), with subordinate folds and structures developing in the region.
In this process, the HYMZ developed as the large basement fault with inherited activity. Faults in this area are commonly accompanied by folds, which are mainly developed along the axis or steep wing of the HMCA [31] and involve oblique or parallel faults whose scales vary from meters to kilometers. In the planar view, the fault zone converges in the north, diverges in the south, and contains a deep basement fault [34,35]. In this paper, we focus on the south part of HYMZ that runs from Bishan to Yibin.
2.2. Stratigraphy
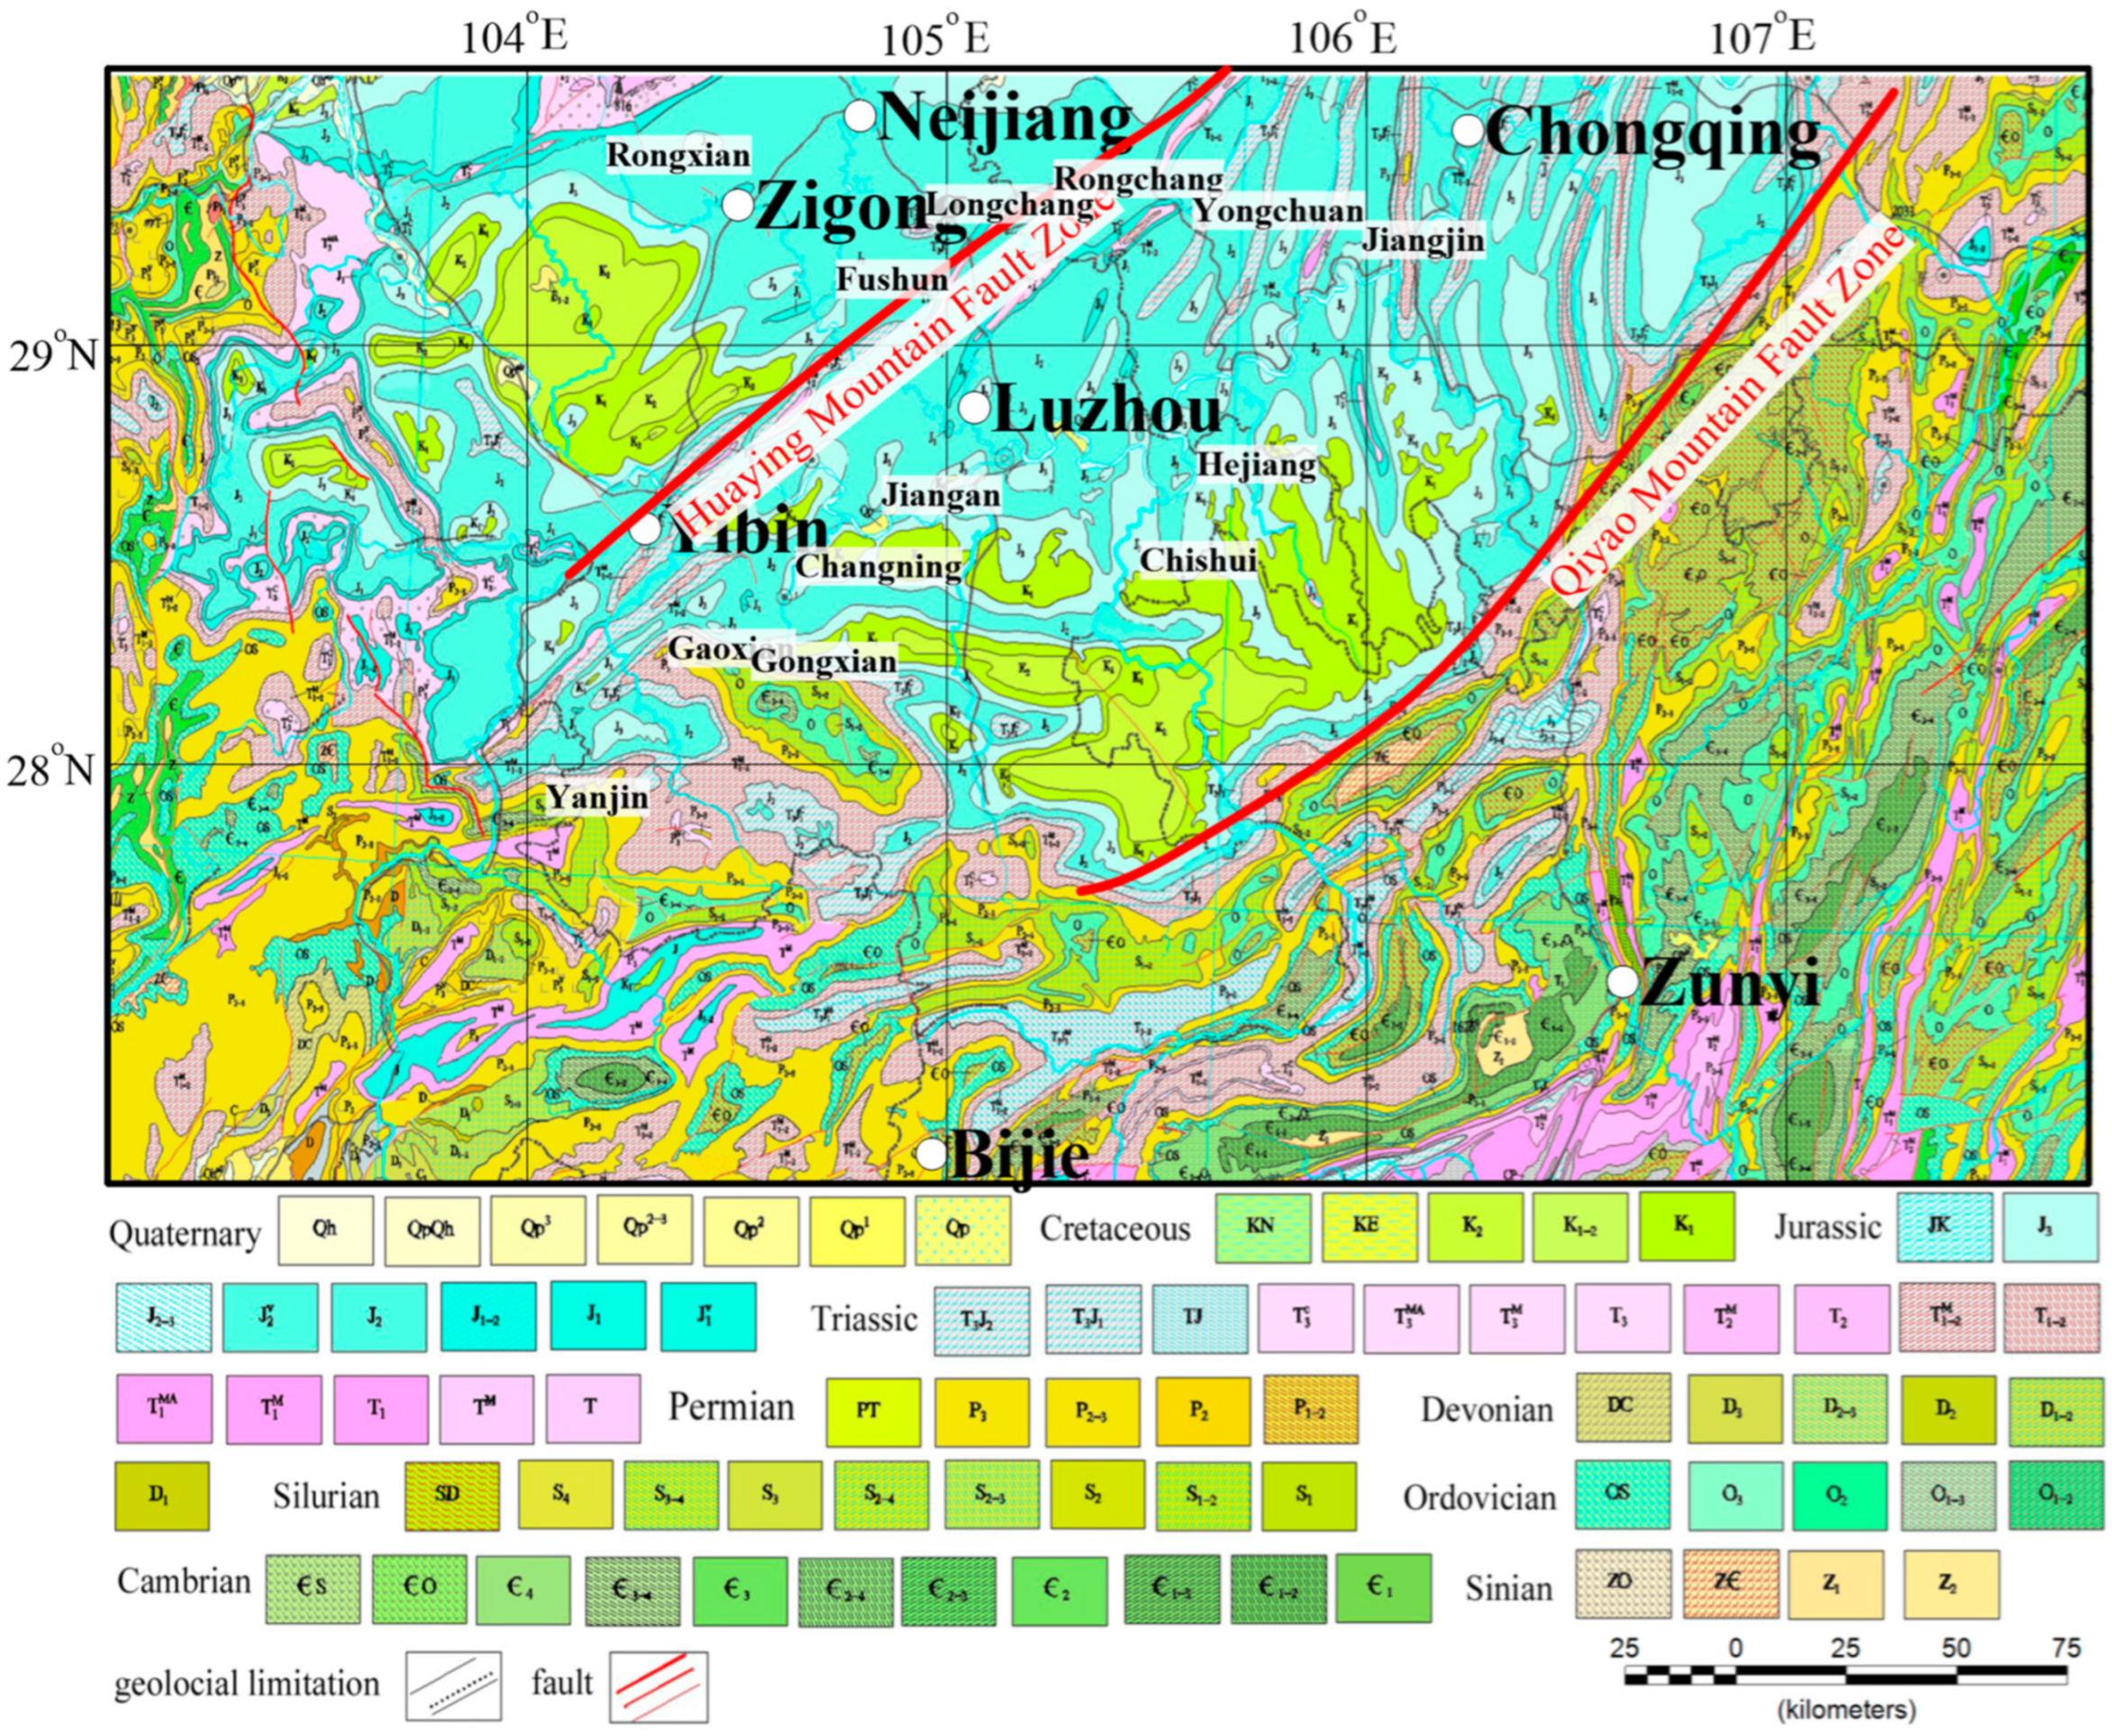
The Huaying Mountain fault zone (HMFZ) is a major inherited basement fault that separates the central Sichuan dome from the NE-trending, a high and steep structural belt in the north-eastern SB. The HMFZ was mainly extensional from the Early Palaeozoic to the early Middle Triassic, which altered the stratal thicknesses and lithofacies on both sides of the fault and influenced the distribution of source and reservoirs rocks (Figure 2). Compared to the regions in western and eastern Sichuan, the basement in central Sichuan is more stable as it is far away from the surrounding active zones. The HMFZ and Lower Cambrian gypsum weakened the stress generated by orogenesis in the east, and the formative compressive stresses produced little structural deformation, as evidenced by gentle folds that are restricted to shallow rock layers. Therefore, the distribution of the Lower Cambrian gypsum layer greatly affected the development of folds in the east and south during the tectonic evolution of the SB. In fact, this layer primarily controlled the formation and evolution of the decollement fold belt in the east of the basin [36].
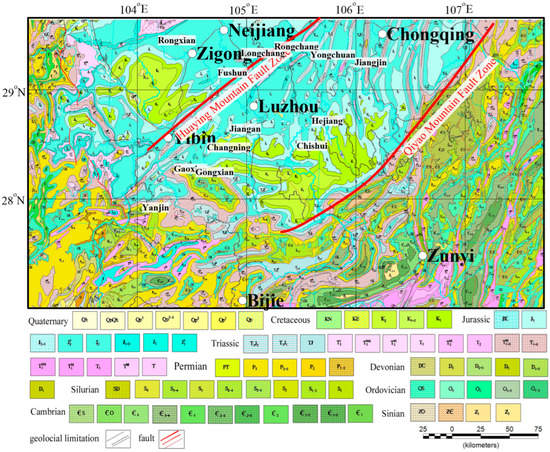
Figure 2.
1:2,500,000 geological map of study area (revised from the Development Research Center of China Geological Survey).
The study area is largely part of the Yangtze stratigraphic area, except the Devonian, Middle Proterozoic to Quaternary, the stratum rocks are present to varying extents. Ordovician, Permian, and Triassic rocks are the most widely distributed and gives the most powerful evidence to revel the marine deposition. In northern Guizhou, the Middle Proterozoic is represented by marine volcano-sedimentary strata associated with pillow basalts. However, the Lower Proterozoic to Lower Sinian are dominated by terrigenous and volcaniclastic deposits. The Upper Sinian to Middle Triassic is dominated by marine carbonates, whereas the Middle to Late Triassic is mostly represented by terrigenous clastics. In the southern SB, the pre-Sinian is primarily represented by medium-and low-grade metamorphic rocks with thicknesses ranging from 5785 to 20,349 m. The Lower Sinian series comprise continental volcanic rocks, arenaceous conglomerates, and glacial rocks and vary in thickness from 499–11,147 m. Sandstones and carbonates ranging in thickness from 17 to 1754 m dominate the Upper Sinian, whereas Palaeozoic strata vary in thickness from 1243 to 20,293 m and mainly include carbonates and clastics. Although the Triassic is mostly represented by clastic and carbonate rocks, tuffaceous materials are locally present, and stratal thicknesses range from 1000 to 8174 m. Conversely, the Jurassic Tertiary is mainly represented by continental iron-rich sediments, with thicknesses ranging from 1766 to 11,548 m. The Quaternary includes many genetic types and large stratal thicknesses [37].
3. Data and Methods
3.1. Data
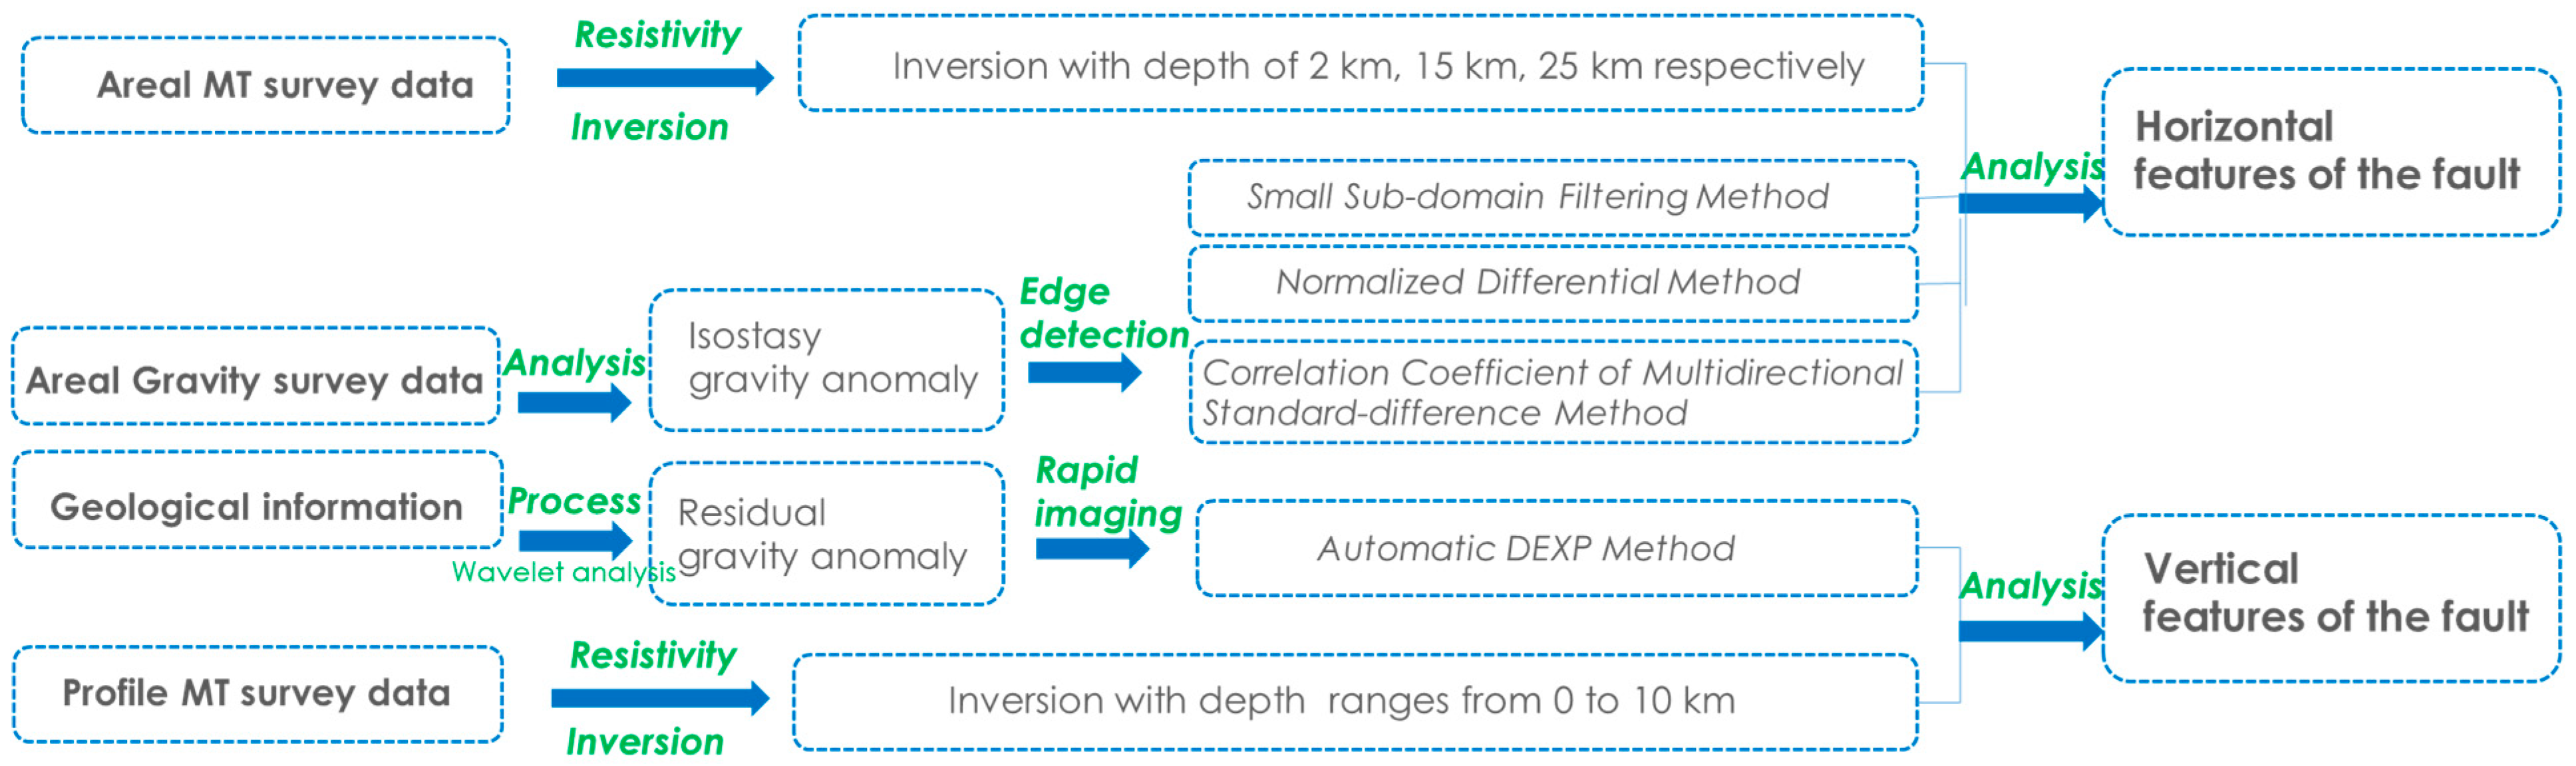
The gravity survey and MT survey were both the ground measurements in this research. The area of the real gravity data was measured at 1:250,000-scale is about 27,300 km2, the grid distance is 2 × 2 km, it was acquired from 2019 to 2021, using CG-5 and CG-6 gravity metres (Scintrex Ltd., Concord, ON, Canada). The accuracy is 0.023 mGal which is obviously superior to the technological standard (The technological standard is “The Standard of 1:250,000-scale Areal Gravity Prospecting”, it is published by Ministry of Natural Resources of the People’s Republic of China, it clearly demands the accuracy should be superior to 0.150 mGal). Furthermore, for the reason that such extensive survey area, we set the number of 34 gravity base points which constitutes 9 gravity loops, and the gravity conjunction was measured based on the technological standard, and the accuracy is 0.028 mGal which also guarantee the reliability of gravity survey greatly. With the geological characterize of research target that Huaying Mountain Faults, in the processing of gravity data, we interpolated the data with grid distance 1 km, which is believed to be reliable referring the technological standard generally. MT data were obtained in 2019 using a V5-2000 electromagnetic instrument (Phoenix Geophysical Co., Toronto, ON, Canada). The point distance of the measured MT profile was 2.5 km, and the grid distance of the measured areal MT data was 20 × 20 km. The accuracy satisfactary the demand of MT survey technology standard (be superior to 5%), its most worst standard deviation is 4.98%. The methods used to identify the geological structures in the southern HMFZ are shown in Figure 3. Based on real gravity and MT data, as well as other geological information, the features of individual faults were identified. Measured MT data were used to perform resistivity inversion, and different-depth planes were constructed using the inversion results. The results enabled us to characterize the planar distribution of fault structures in the HMFZ.
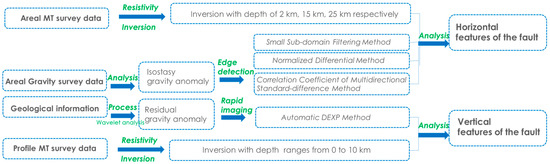
Figure 3.
Flow chart of technical route.
3.2. Methods
Multi-scale wavelet analysis isa widely used and effective gravity field data separated method [38,39], it adopts different mother wavelet and window size to acquire the separated gravity data. In this paper, our interpretation of the faults’ planar distributions depended on the isostatic gravity anomalies and residual anomalies obtained via multi-scale wavelet analysis with COIF2-5 transformation (mother wavelet is COIF2, the window size is 5). The edge-detection method is one classic branch of gravity-exploration data processing, this paper uses it to obtain preliminary information on the planar distributions of the faults. Here, we identify and describe the planar characteristics of the faults in the HMFZ based on a series of experiments using different edge-detection methods. The technical route of this paper is shown as Figure 3.
3.2.1. Small Sub-Domain Filtering Method (SSDF Method)
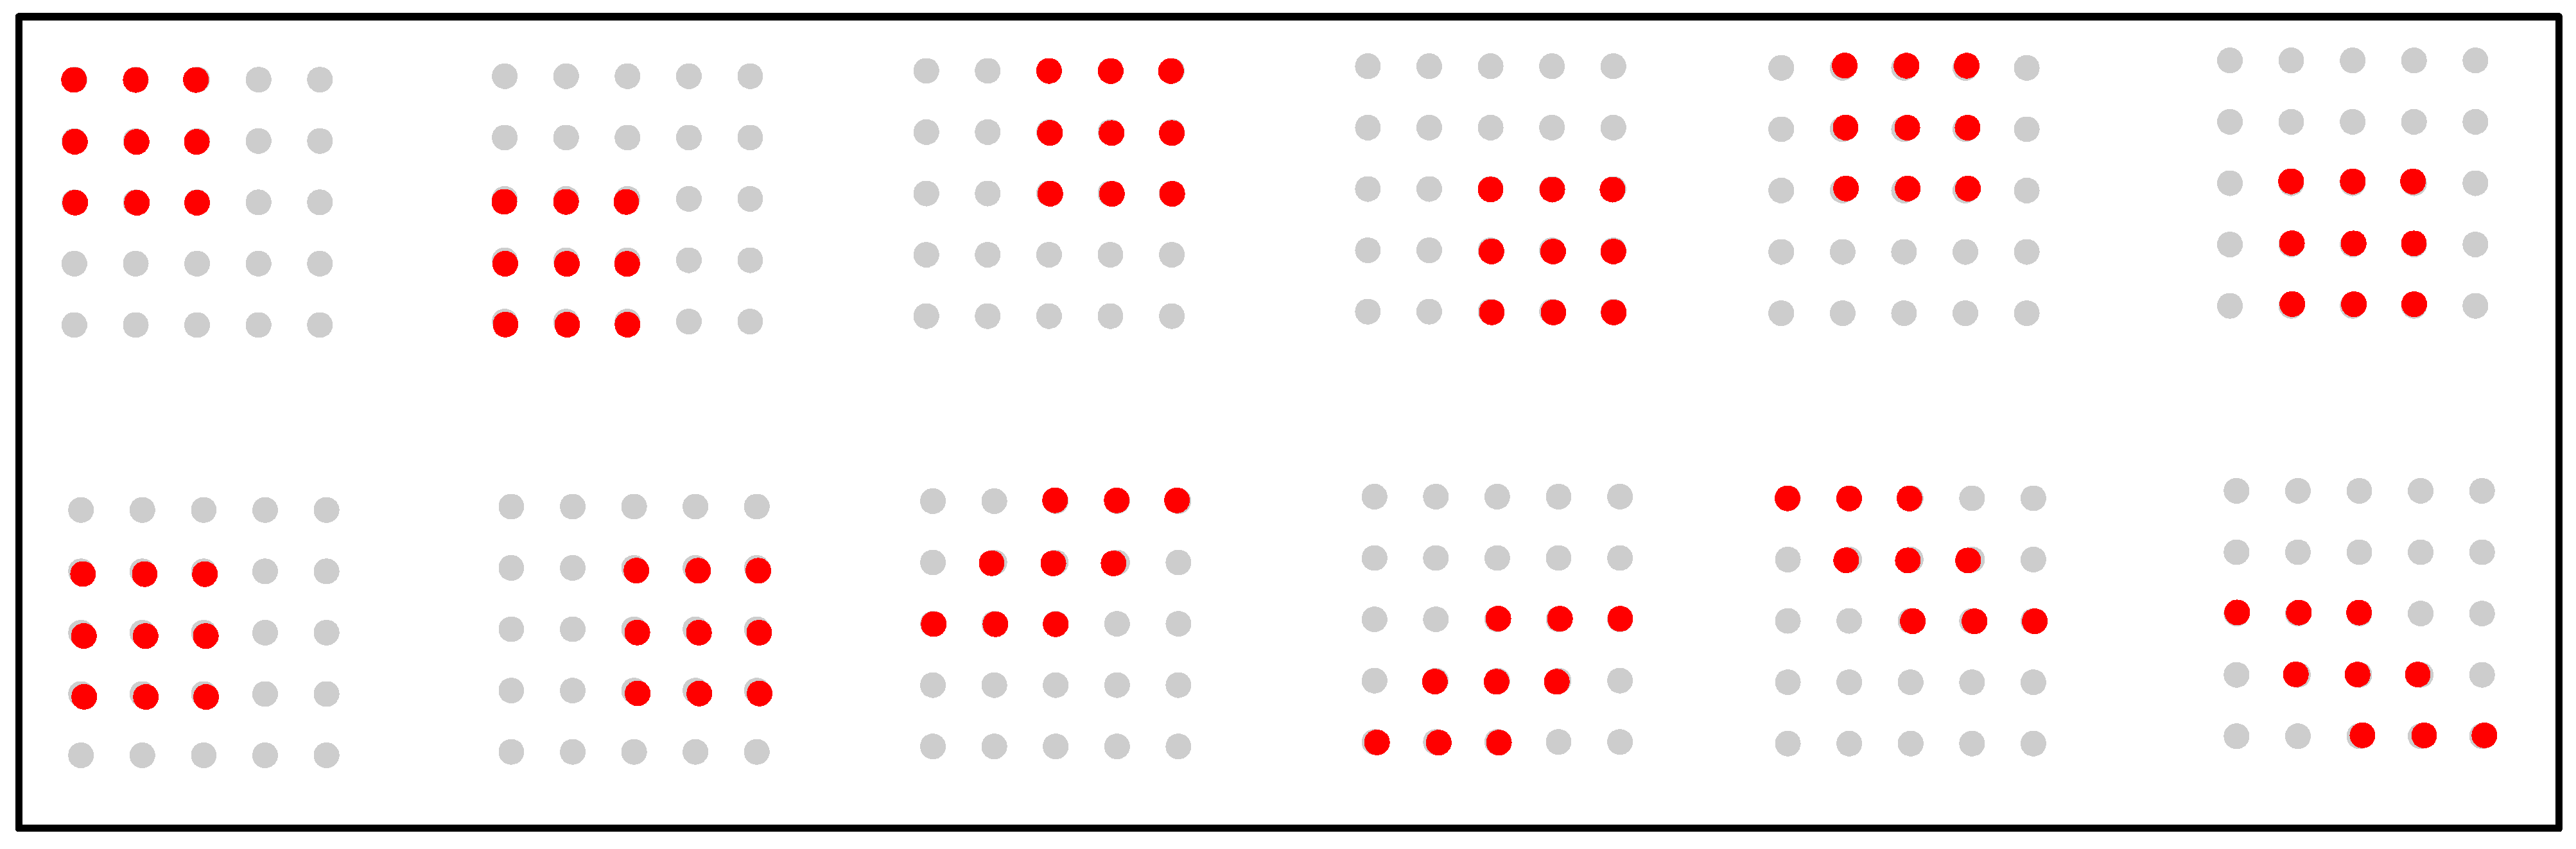
Yang et al. (1995) [40] proposed a subdomain filtering method which is characteristic with low-pass filtering, and this effectively improved the resolution of edge detection and avoided the overage loss of high-frequency information. Jiang et al. (2012) [41] advanced an improved subdomain method, which enhanced the reliability of the edge detail and was minimally affected by the strike of geological boundary. The detail of this method is following:
For M × M (M is an odd number) window size, the specific calculation steps are: (1) The anomaly mean and standard deviation values are calculated for each sub-domain. As Equations (1) and (2):
In Equations (1) and (2), is the i-th sub-domain anomaly mean, is the j-th sub-domain anomaly of the i-th sub-domain, is the i-th sub-domain standard deviation, and N = [(M + 1)/2]2 is the number of anomaly points in each sub-domain. (2) Determine the smallest of . (3) Take the sub-domain mean value corresponding to as the center point filtered value of the window. (4) Move the filter window to the next point and repeat steps 1 to 3 until the entire calculation region is covered. The sub-domain style is shown in Figure 4.
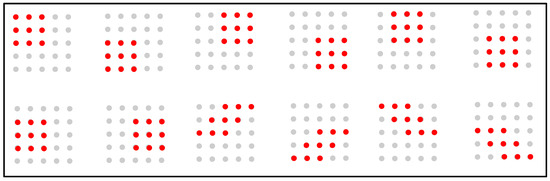
Figure 4.
The Sub-domain style of SSDF method.
3.2.2. Normalized Differential Method (ND Method)
The normalized differential method proposed by Wang (2013) [42] is based on the relationship between the finite difference method and geological edges. It highlights edge characteristics involving an n-order differential expression in the x-, y-, and z-directions. With the normalised result, the stepping zone can be strengthened to enhance the detecting of edges. The detail of this method is following:
The n order difference operator of in -x, -y, -z direction can be expressed as in Equations (3)–(5):
- –
- -x direction:
- –
- -y direction:
- –
- -z direction:
Here, is the 90° phase shifting of , is the 90° phase shifting of , it means as Equation (7):
So, the stepping zone of An can be strengthened to enhance the detecting of edges.
3.2.3. Multidirectional Standard Difference Method Correlation Coefficients (CCMS Method)
Multidirectional Standard Difference Method (CCMS method) was proposed by Xu (2015) [43]. The characteristics of this algorithm include the following: simplicity and stability, elevated feature identification, good detection to edges of geological bodies at varying depths, advanced retention to edge shape, and low sensitivity to noise. The detail of this method is following:
This is the 2D data which distributes in plane, and is the coordinate of the data, a represents the data set, the value of point is . First, Window is centered with the point of , all the points covered by build the set of . The mean-square deviation of is calculated with Equation (8).
where is the mean value of , is the number of the covered points by , is the number of covered point by the half-radius of in x direction, is the number of covered point by the half-radius of in y direction. Then, to slip the window point by point until it achieves mean square deviation for all windows.
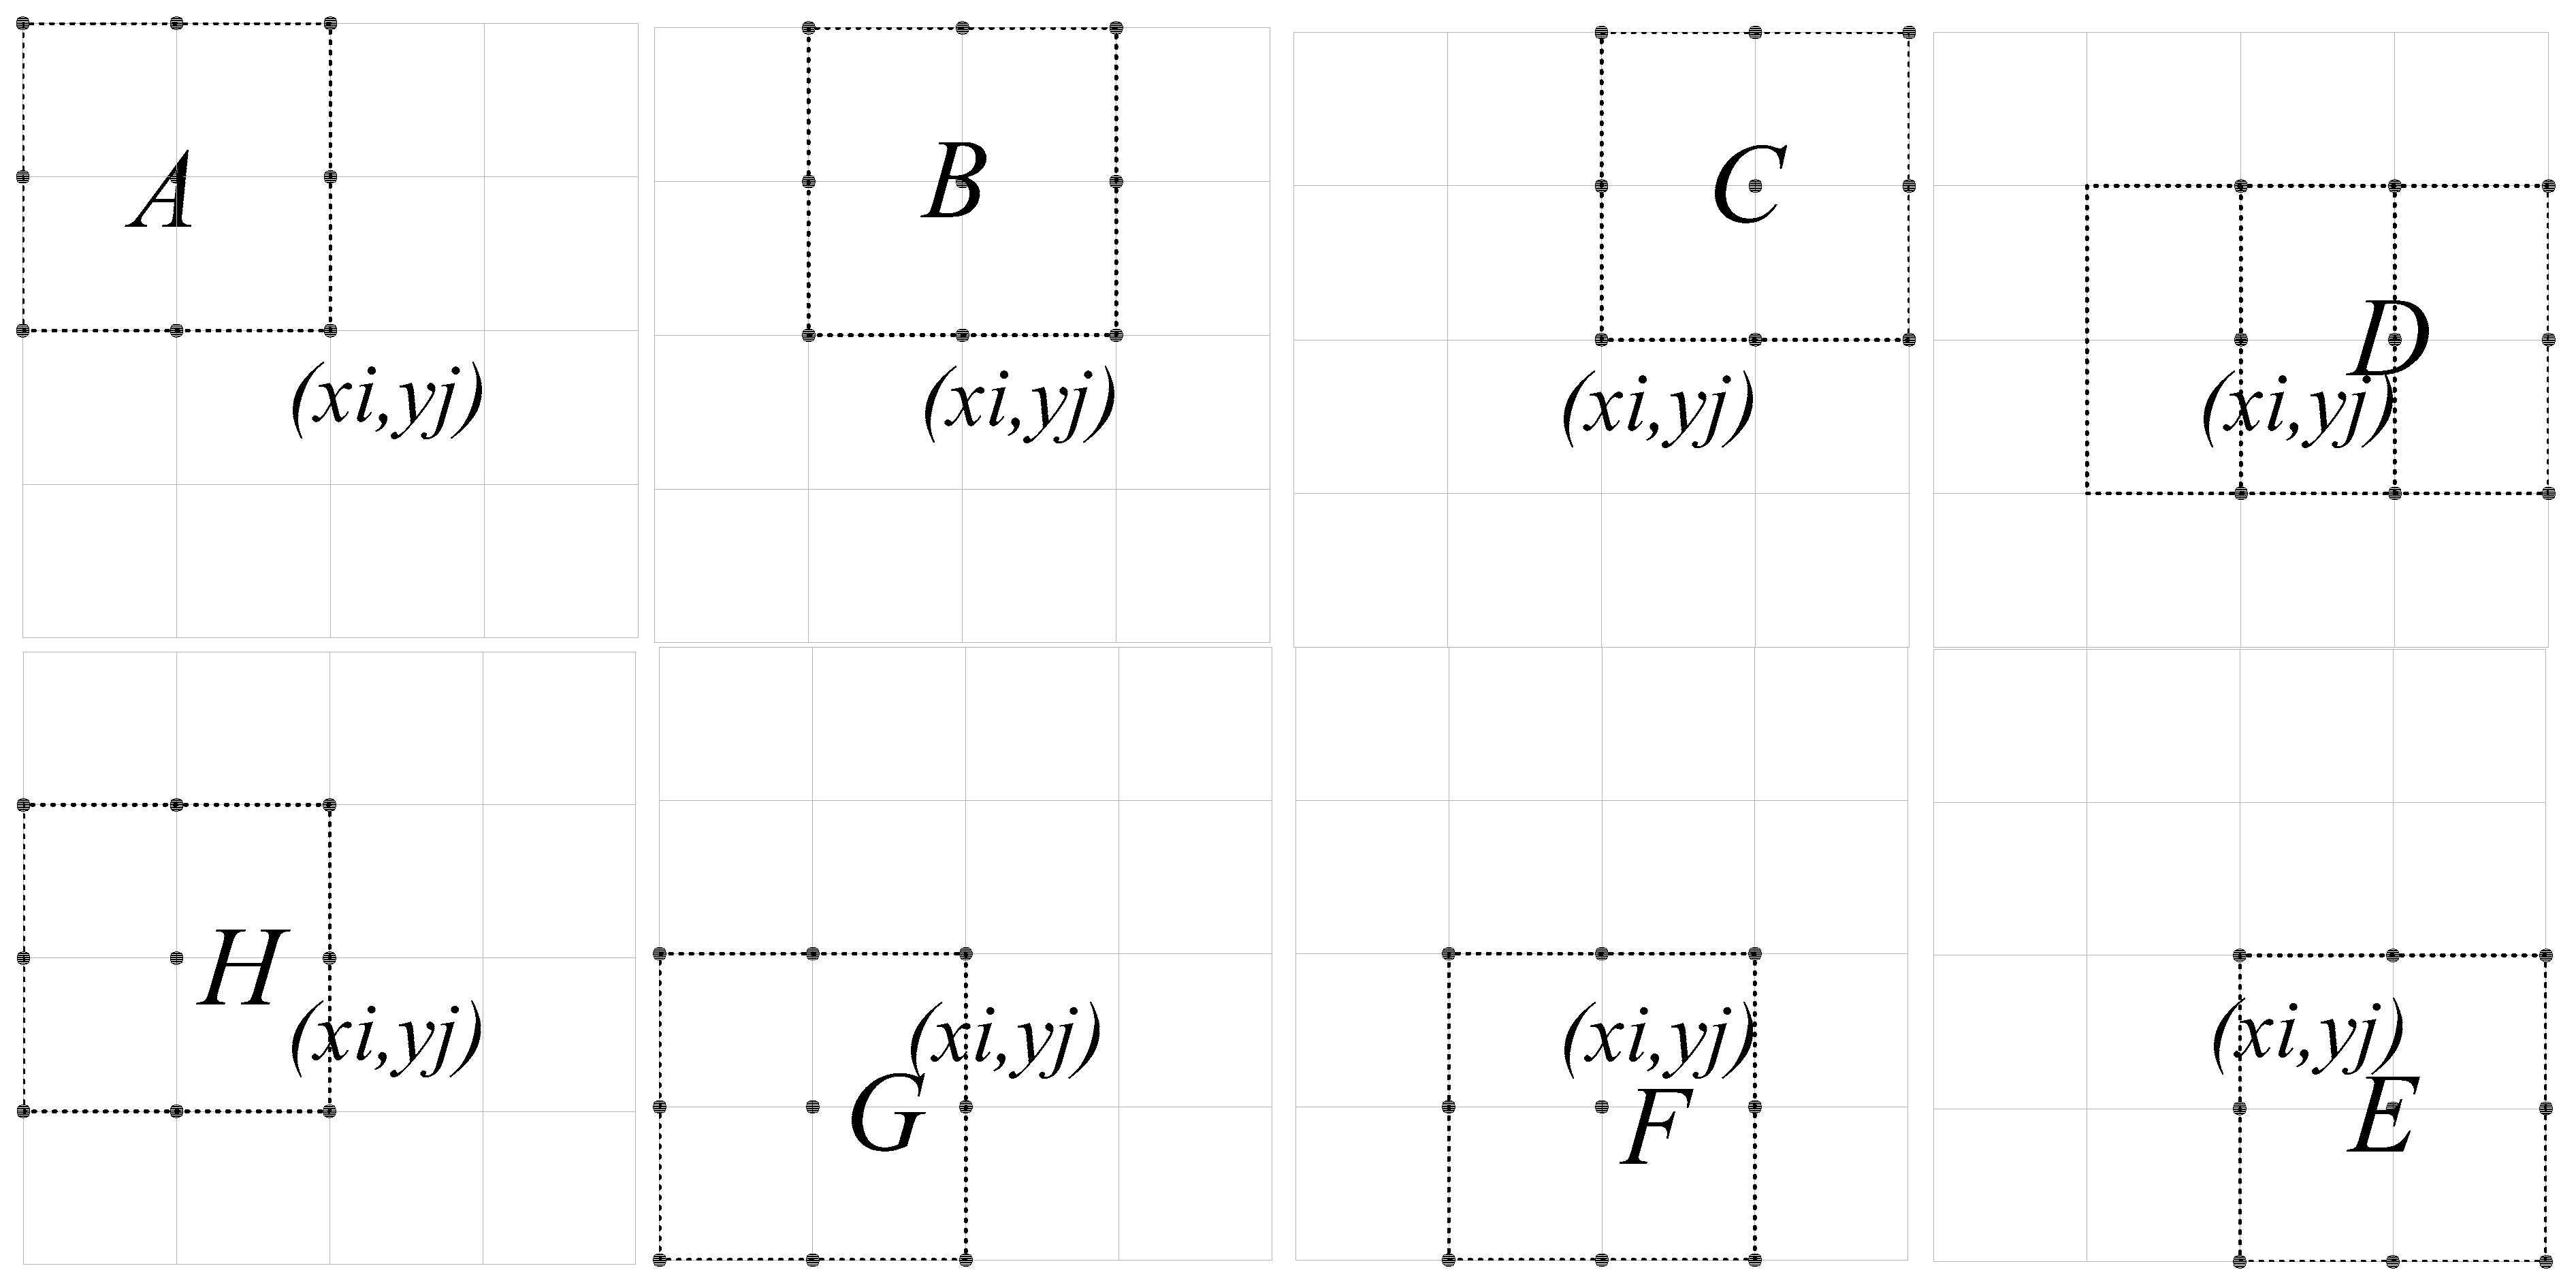
All the covered by build the set , at the same time, there are eight windows surrounding the window , named by , , , , , , , (Figure 5), and the mean square-deviation values covered by these windows build the corresponding sets, including , , , , , , , , respectively.
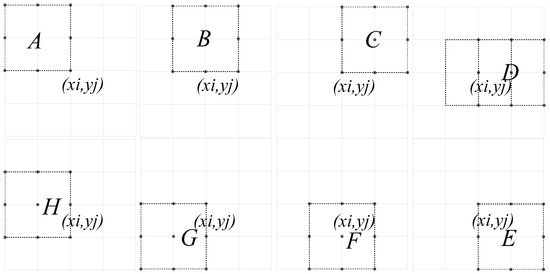
Figure 5.
The cartogram of the window splitting in 8 directions.
The correlation is evaluated between and , , , , , , , , respectively. Here, it proposes to adopt the correlation coefficient as the criterion; the eight correlation coefficients include , , , , , , , , as shown in Equation (9):
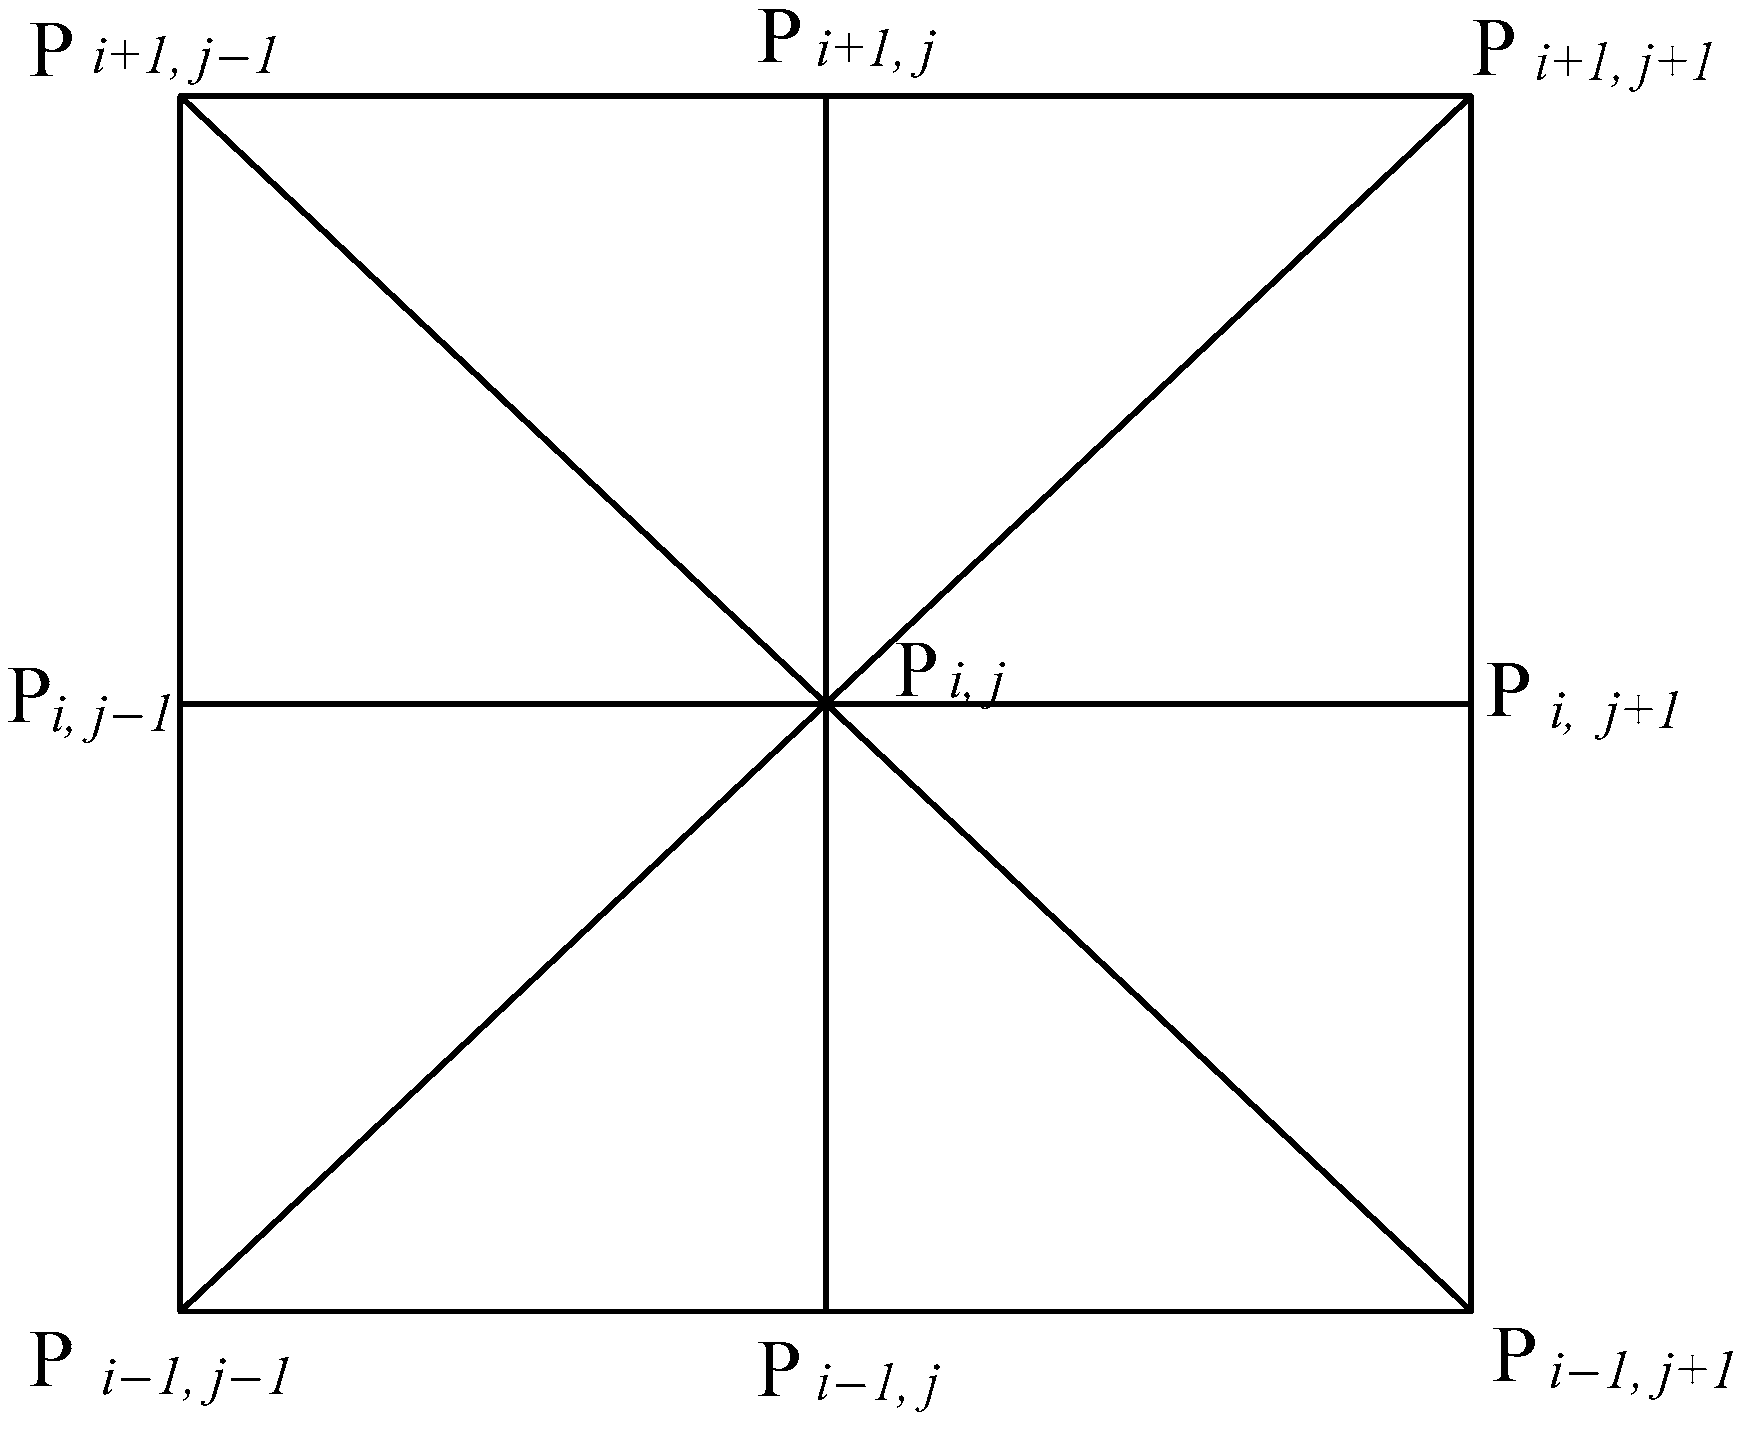
Then, it establishes the inequalities along four directions (the horizontal direction, vertical direction and two diagonal directions) as Figure 6, then calculate the number of the establish-inequality which equals to , where is the significance level that ranges from 0 to 4 (Equations (11)–(13)).
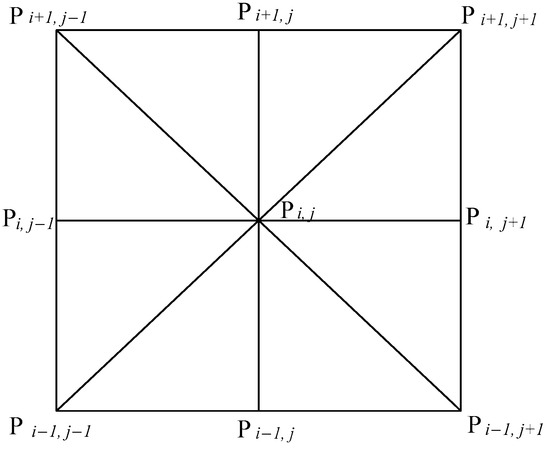
Figure 6.
The location of and the points about it.
In the window , is the significance level of , and is the significance level of We proposed to define as Equation (13).
The range of is from 0 to 16, the bigger value of , the more reliable to be at the edge location.
3.2.4. Depth from Extreme Points Method (DEXP Method)
The DEXP method was proposed by Fedi (2007) [38], and this approach is advantageous because it enables rapid preliminary inversion to the density distribution, thereby providing a reliable basis for further processing and analyses. Abrass et al. (2014) [44] investigated the existing limitation of selecting a structural index to enable automatic imaging inversion in the DEXP method. Subsequently, derivative ratios were introduced as data sources to replace the structural index, thus ensuring estimation without the specified index and automating the DEXP imaging. The details as follows:
It proposed to build the scale function with two different-order vertical derivatives of a homogenous field . Then, it can achieve and , where and are the respective orders of differentiation. The scaling function is expressed as Equation (14):
Therefore, the general form of DEXP is defined as Equation (15):
Since the exponent is known, the estimation of the depth to the source by the DEXP image is automatic that the structure index is no necessary. However, the division by zero or by a very small number may affect the numerical estimation, Abrass (2014) [44] adopted the method that checks the value of the denominator of by a small amount taken as a fraction of the maximum of at the current depth level, written as Equation (16):
where .
Depth from extreme points (DEXP) method [38] is one rapid imaging method, we further employed the automatic DEXP [44] to process residual isostatic gravity anomalies and obtained density distributions to perform preliminary characterisation of the vertical extents of these features.
4. Results
4.1. Isostatic Gravity Anomalies
On the one hand, here, we achieved the isostatic gravity anomaly which reflects the density distribution of materials in the upper crust generally, on the other hand, multi-scale wavelet analysis as an effective method to separate potential field data into regional and local fields has been widely used [45,46,47,48,49,50], therefore, here it took multi-scale wavelet analysis method to process the isostatic gravity anomaly, which will promote a more reliable residual anomaly. Based on the application of different mother wavelets and scales, with the requirement that a separated anomaly can retain the details that mostly corresponds to the geological map, we conducted a series of experiments using different mother wavelets and scales. Here, the COIF2-5 wavelet transform result was chosen for the residual isostatic gravity anomaly data (Figure 7). Therefore, it is relevant closely to the tectonic area: the north part showing high values in the north corresponds to the uplifted dome in the SB, whereas the large and banded high values along the NE-SW strikes corresponds to Qiyao Mountain, which is the south-east boundary of the SB. The area between the dome and Qiyao Mountain is characterised by low values, which corresponds to the southern Sichuan Depression. A localised area of relatively high values is present near Luzhou and is associated with the Luzhou palaeo uplift. On the west side of the southern Sichuan depression, the area of Sichuan and northern Yunnan is shown as the high gravity anomalies, and it is obviously characterised by a nearly N-S gradient. In the southern part of the study area, especially south of Qiyao Mountain, an area of high values near Bijie represents the Sichuan-Guizhou Plateau and shows linear characteristics obviously. This area is the boundary between the East Sichuan fold belt and the Central Sichuan Block. High anomalies are also observed to the southwest of Qiyao Mountain, whereas low values near Huairen are attributed to a subsidiary depression. Large NE-trending structures dominate the study area, with subordinate, medium-sized NW- and nearly NS-trending faults also occurring.
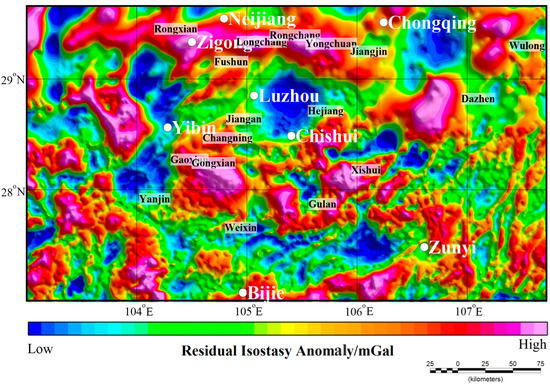
Figure 7.
The map of residual isostatic gravity anomaly map.
Positive and negative gravity anomalies in the area reflect the distribution of deep materials, including high anomalies in the north that indicate the dome, low anomalies in the Chongqing–Luzhou–Yibin area that highlight burial geological body in the southern Sichuan Depression. Additionally, the high-banded values in the Wulong–Daozhen–Xishui–Gulan–Weixin area reflect the strikes of major basement faults, and the transition zone of positive and negative anomalies highlights the direction of subsidiary faults (trending nearly N-S or N-W), whereas the NE-banded anomalies in the southeast indicate the folds were produced by compression.
4.2. Planar Distribution of Fault Structures
In geophysical exploration, gravity methods are useful for identifying the transverse heterogeneity of anomalous bodies. Edge detection is critical to the interpretation of geological structures, geological mapping, and delineating mineral resources [51].
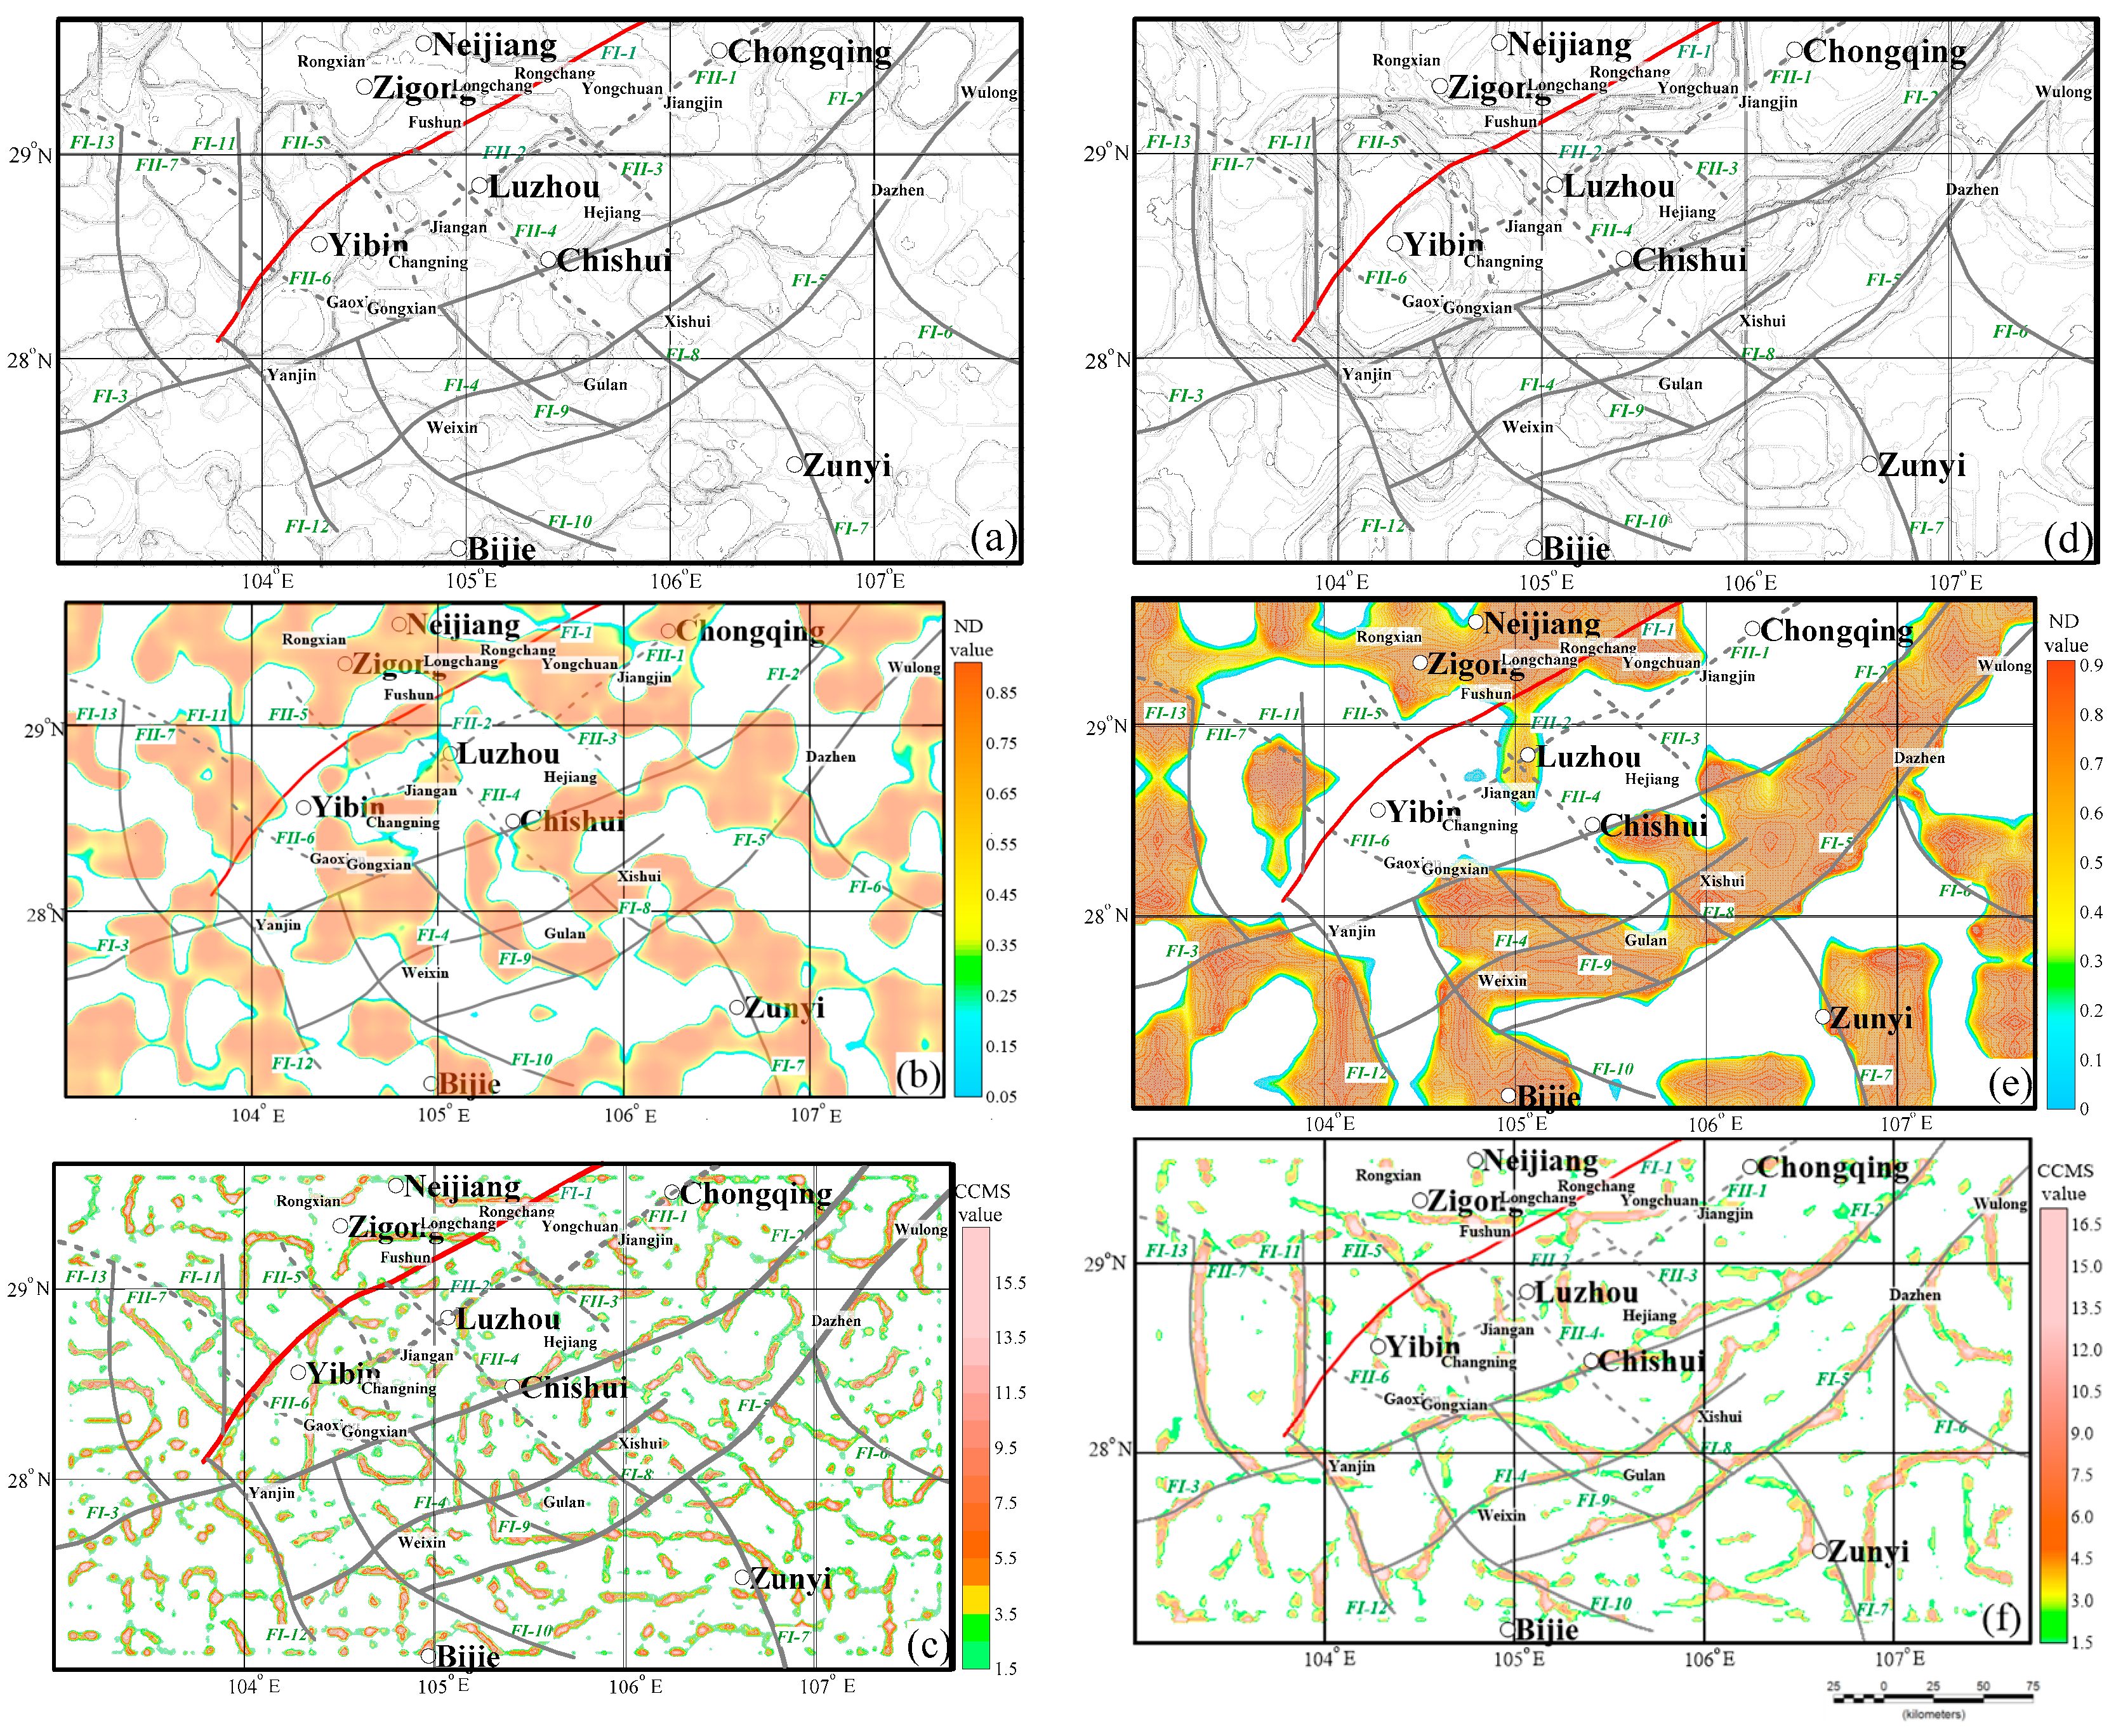
The planar distribution of faults in the study area was preliminarily inferred based on our edge-detected results (Figure 8 and Figure 9). Faults are well developed and mainly trend towards NNE and NE, with a few trending nearly at NNW and NW. Thirteen major deeply buried faults (FI-1 to FI-13) and seven shallowly buried faults (FII-1 to FII-7) were identified in the southern HMFZ. Here, FI-1 represents the southern portion of the HMFZ and trends NE from near Bishan through Rongchang, Yongchuan, Longchang, and Luxian to southern Fushun. This fault also extends southwest through Yibin and Pingshan, where it trends NNE. The inversion results indicate that linear structures likely extended to Suijiang. The inversion results obtained from different methods reveal nearly NS-trending (FI-11) and NW-trending (FI-12) linear anomalies where the linear features of the HMFZ disappear. From this, we inferred that the extension of the southern HMFZ was limited by these two majors deeply buried faults. FI-11 likely corresponds to the boundary of the faulted depression created by regional-scale deep expansion, with an inferred that the depth is greater than that of the HMFZ, although further investigation is needed to demonstrate the morphology vertically. FI-12 trends NNE and this deeply buried fault likely impacts the morphology of the Qiyao Mountain fault (FI-2) at shallow depths. The inversion results from different methods indicate that several medium-scale faults are well developed at shallow depths near the HMFZ (FII-1), and these mostly trend NE (FII-1, FII-2) and NW (FII-3, FII-4, FII-5, FII-6, and FII-7). As known, the tectonic deformation in the eastern Sichuan area went through extensional sag to late compressive deformation and finally settled into an anticlinal closed syncline and open trap fold style. Before the last strongly compressional orogeny (Yanshanian-Himalayan cycle), with the function of several early tectonic movements (Caledonian Hercynian cycle, Indosinian cycle), a series of “former structures” were formed in the belly, that is, the basement fault and the sliding compound thrust fault of the central tectonic layer, and the fault-related folds were formed. These “former structures” provided migration pathways for the gas (oil) peaks in the Triassic and Jurassic in the eastern Sichuan area as the channel and trap. Because of their existence, it promoted the intense extrusion environment of Yanshan–Himalayan cycle was followed. In this environment, the stress first occurs in the place where the basement fault exists, which makes the “former structure” more active and causes upward expansion, where old faults continue to activate old or new faults and new structures appeared), upward expansion, open to the present high and steep anticlinal belts spread in rows on the surface of eastern Sichuan, the evolution of HYMZ movements also gives evidence for the inferred faults above.
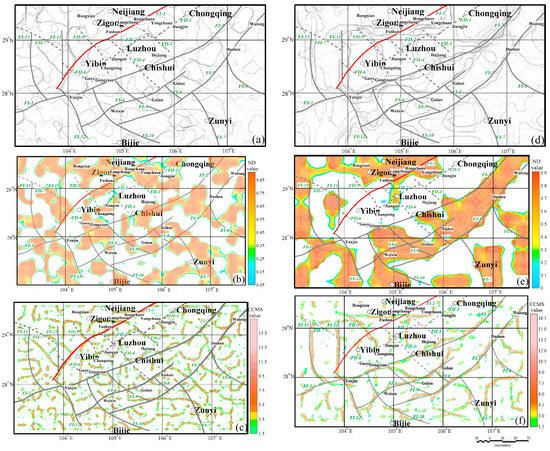
Figure 8.
The result map of different edge-detected methods (a) SSDF, (b) ND and (c) CCMS reflect the shallow information; (d) SSDF, (e) ND and (f) CCMS reflect the deep information.
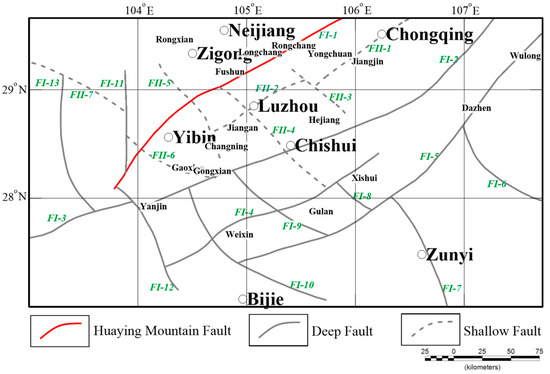
Figure 9.
The inferred results of faults’ planar characteristics.
4.3. Vertical Distribution of Fault Structures
Here, it adopts MT data and the DEXP method’s result to characterize the vertical distribution of fault structures. The inversion result of MT can provide the information about the fault’s striking, inclination and depth. DEXP’s results can also give the support to the infer the fault’s deep information. Therefore, this paper combines their results to give the more reliable inferred evidence to the fault’s vertical structure.
4.3.1. Surface Projection
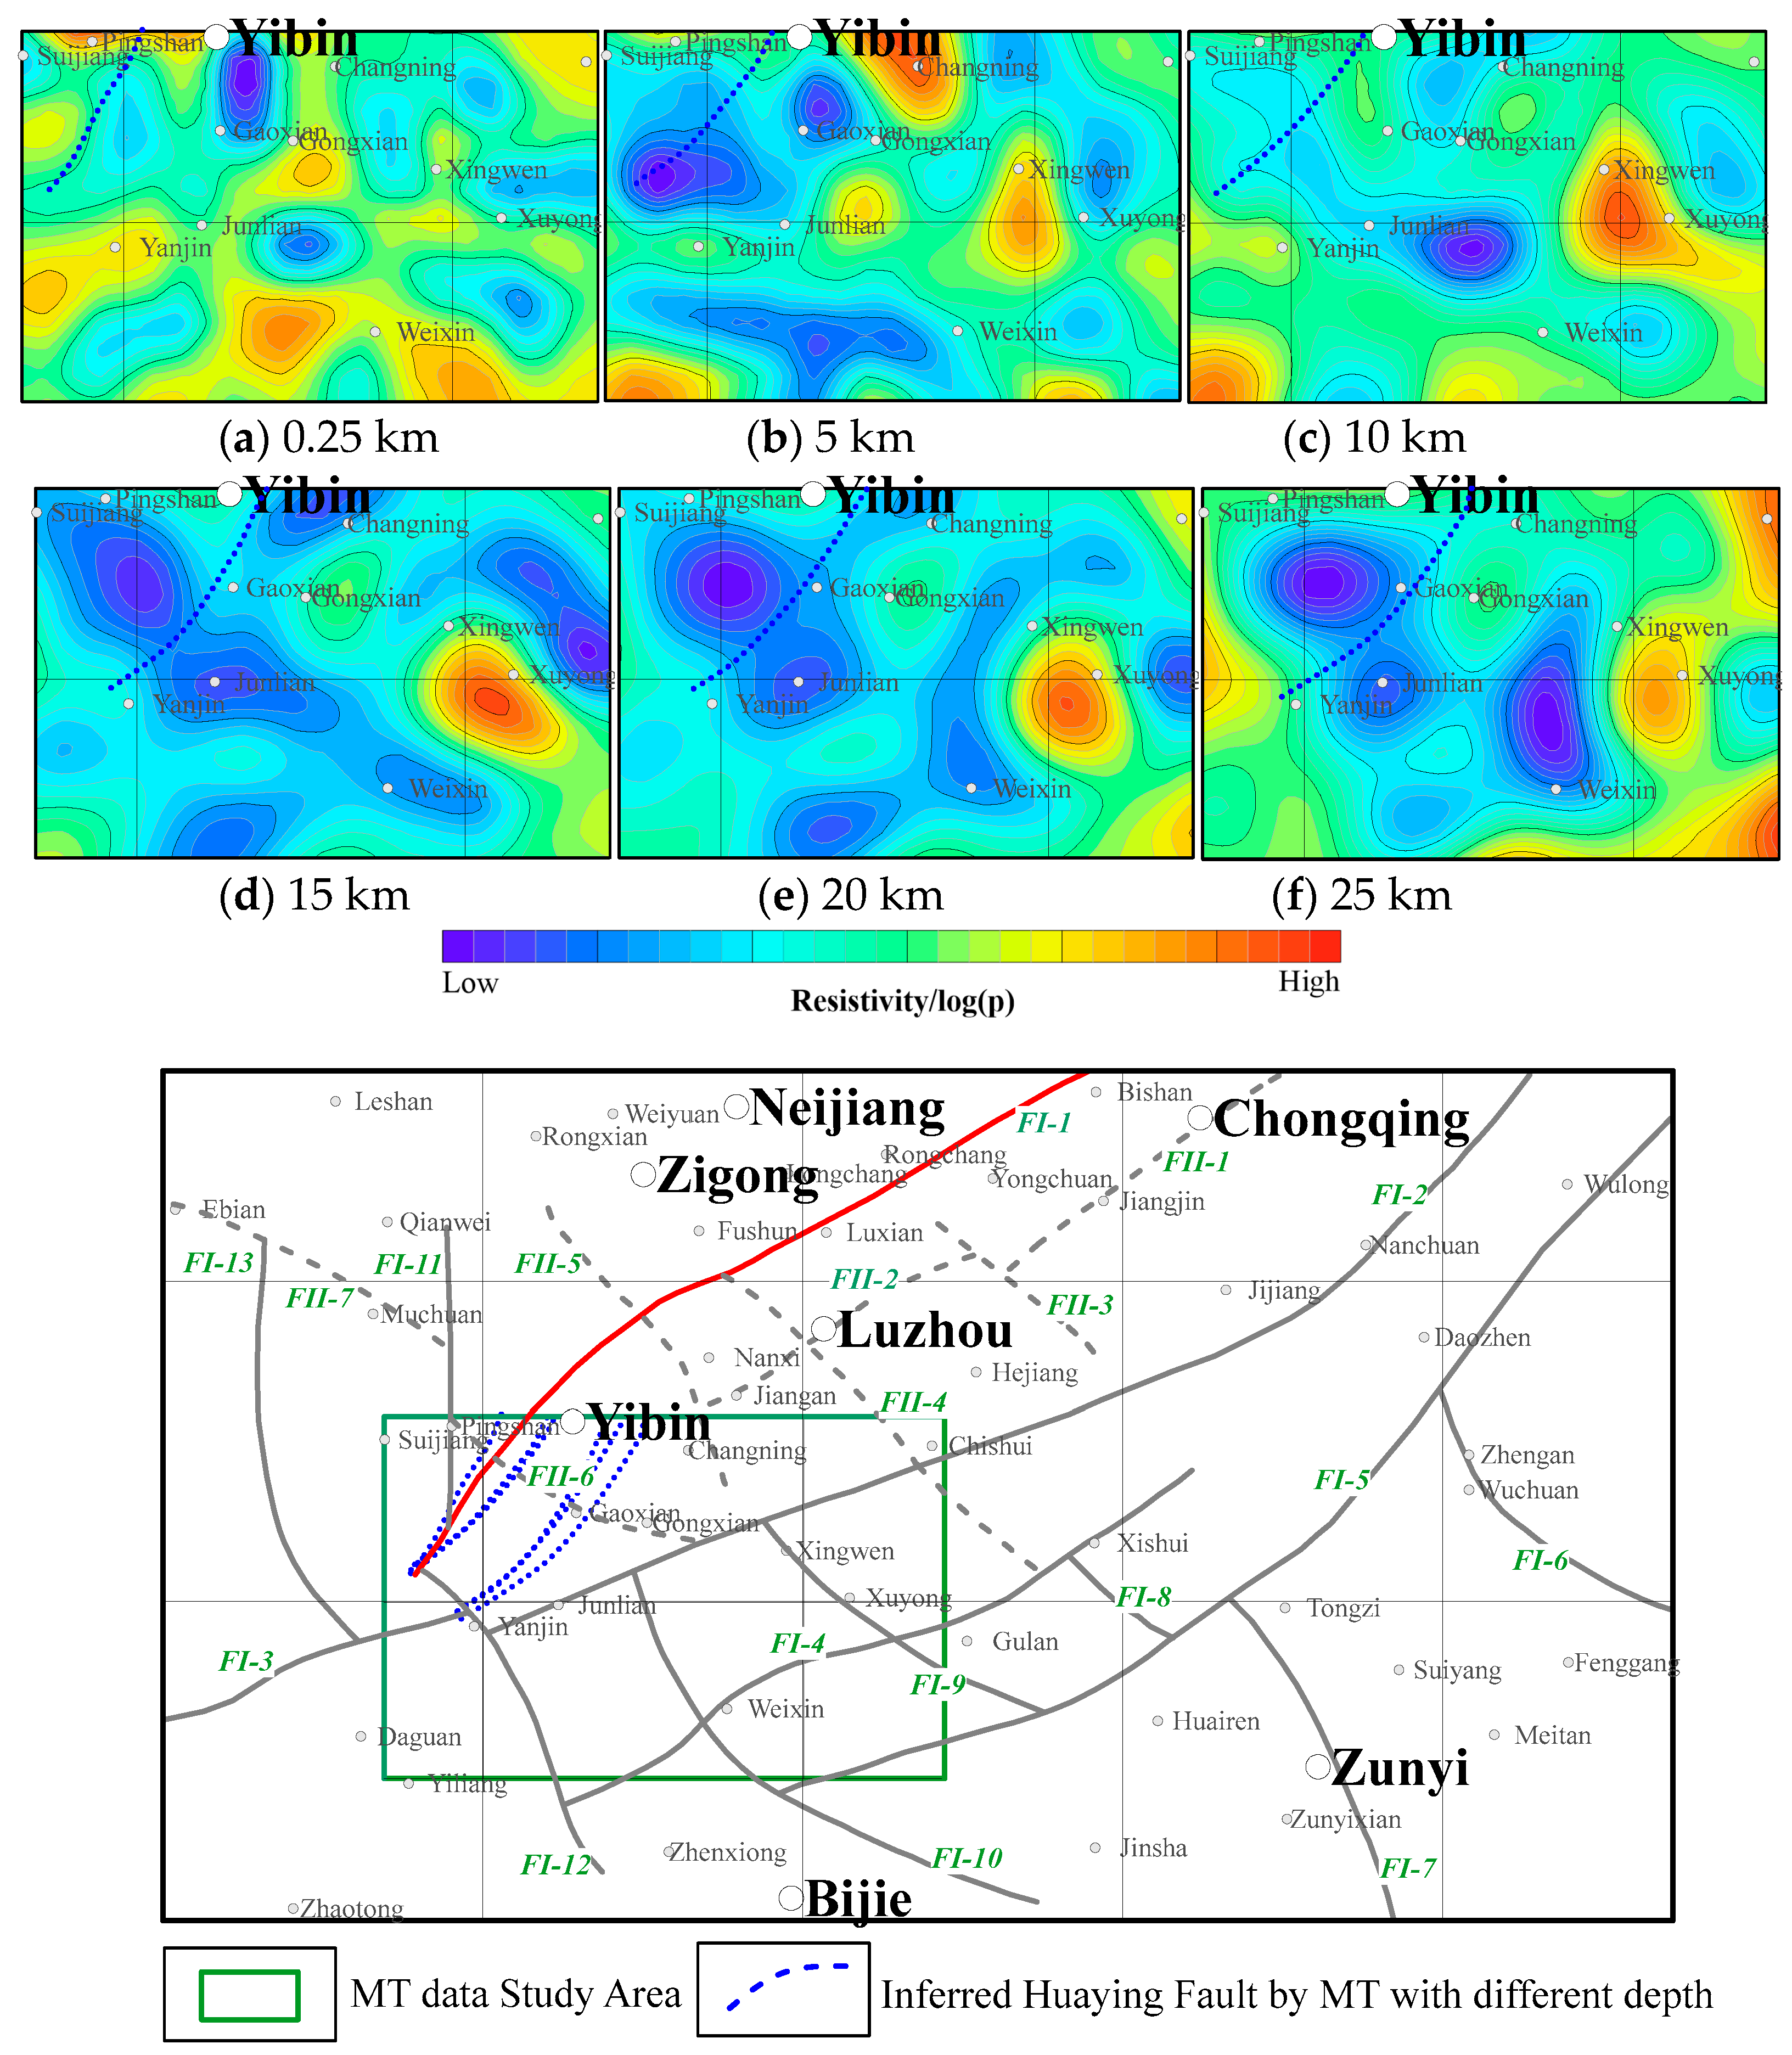
To study the vertical characteristics of the southern portion of the HMFZ, inversion was performed at different depths using MT data (Figure 10). The inversion results for depths of 0.25 km, 5 km, 10 km, 15 km, 20 km, and 25 km are served to track the development of the HMFZ (stippled blue line in Figure 10). The position derived from the 0.25 km inversion result is consistent with the inference based on gravity data (Figure 6), with an obvious NE trend. Inversion results associated with depths from 10–25 km reveal a stepped belt, where the extension of the HMFZ disappears. These large-scale inferred faults, which reflect a NW trend and deep burial, also agree with the inference of FI-12 (Figure 9). Moreover, the inversion results for depths of 0.25–5 km reveal a small NNW-trending fault that expands from Pingshan to Gaoxian. As depth increasing, this trend becomes weak, indicating shallow burial and corresponding to FII- 6 (Figure 9); according to the results from various depths, its dip is nearly vertical, but its linear characteristic from Junlian to Weixin and NWW-trending features is obvious. As depth increases, these features are enhanced, indicating that the HMFZ is large in scale and buried deeply, which agrees with gravity inversion results (Figure 9). Meanwhile, the planar projections at different depths (Figure 10) indicate that the southern part of the HMFZ (FI-1) trends SE and is linked to deep burial, with its extension limited by a NW-trending structure. From the referred results (Figure 9), most of the subsidiary faults impact NE or NNE; furthermore, based on the MT inversion result (Figure 10a), most subsidiary faults disappear with the depths deeper than 5 km, and it was inferred that their burial depths range from 0 to 5 km.

Figure 10.
The inversion MT results from depth 0.25 km, 5 km, 10 km, 15 km, 20 km, 25 km.
4.3.2. Depth from Extreme Points
Our isostatic residual gravity anomaly inversion results from using the DEXP method are displayed in Figure 11. The high- and low-level inversion values correspond to high- and low-density geological bodies, respectively, and the transition zone between high and low values can provide insight into the strikes and dips of the linear structures. The low-value area shows that the study area is dominated by large, NE-trending, and deeply buried faults. A nearly NE-trending linear structure is present, which is consistent with the results of planar information extraction (Figure 9) and better reflects the tectonic framework of the area.
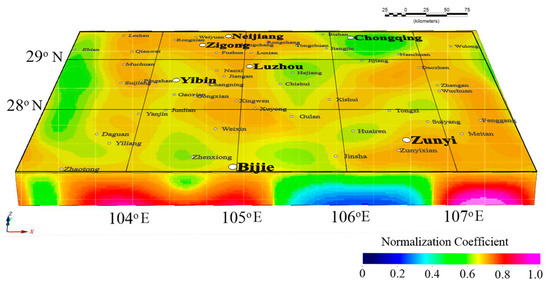
Figure 11.
The result of DEXP method.
To further examine the vertical extent of fault structures near the southern portion of the HMFZ, six sections were extracted from the DEXP inversion results and compared with those from planar extraction (Figure 12). In the P-1 profile, the position of FI-12 is between the high- and low-anomaly zones, and the inferred SW-dipping faults extend to a depth of approximately 20 km. Although FI-10 is associated with an obvious cascading zone with a NE trend, it is characterised by a low dip angle and deep burial. In the P-2 profile, FI-13 is deep and characterised by a wide and gentle NE trend, representing the southwest margin of the SB. In the P-3, P-4, and P-5 profiles, the HMFZ (FI-1) can be traced and is characterised by a SE trend and depth of up to ~25 km. In profile P-6, the HMFZ (FI-1) is associated with an obvious SE-trending cascade zone, whereas the Qiyao Mountain fault (FI-2) and FI-4 are correspondingly linked to positive and negative transition zones, indicative of a deep fault.
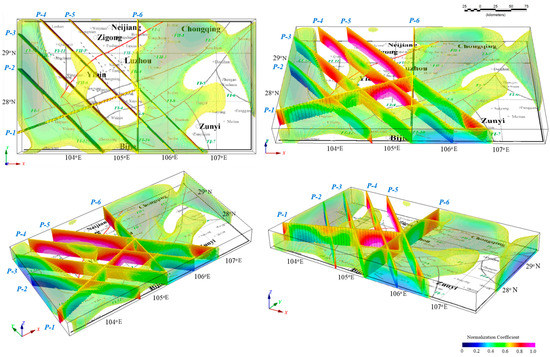
Figure 12.
Comparison between DEXP inversion results and fault structure plane inference results.
5. Discussion
5.1. Relationship between Palaeo Uplift and the Distribution of Oil/Gas Fields
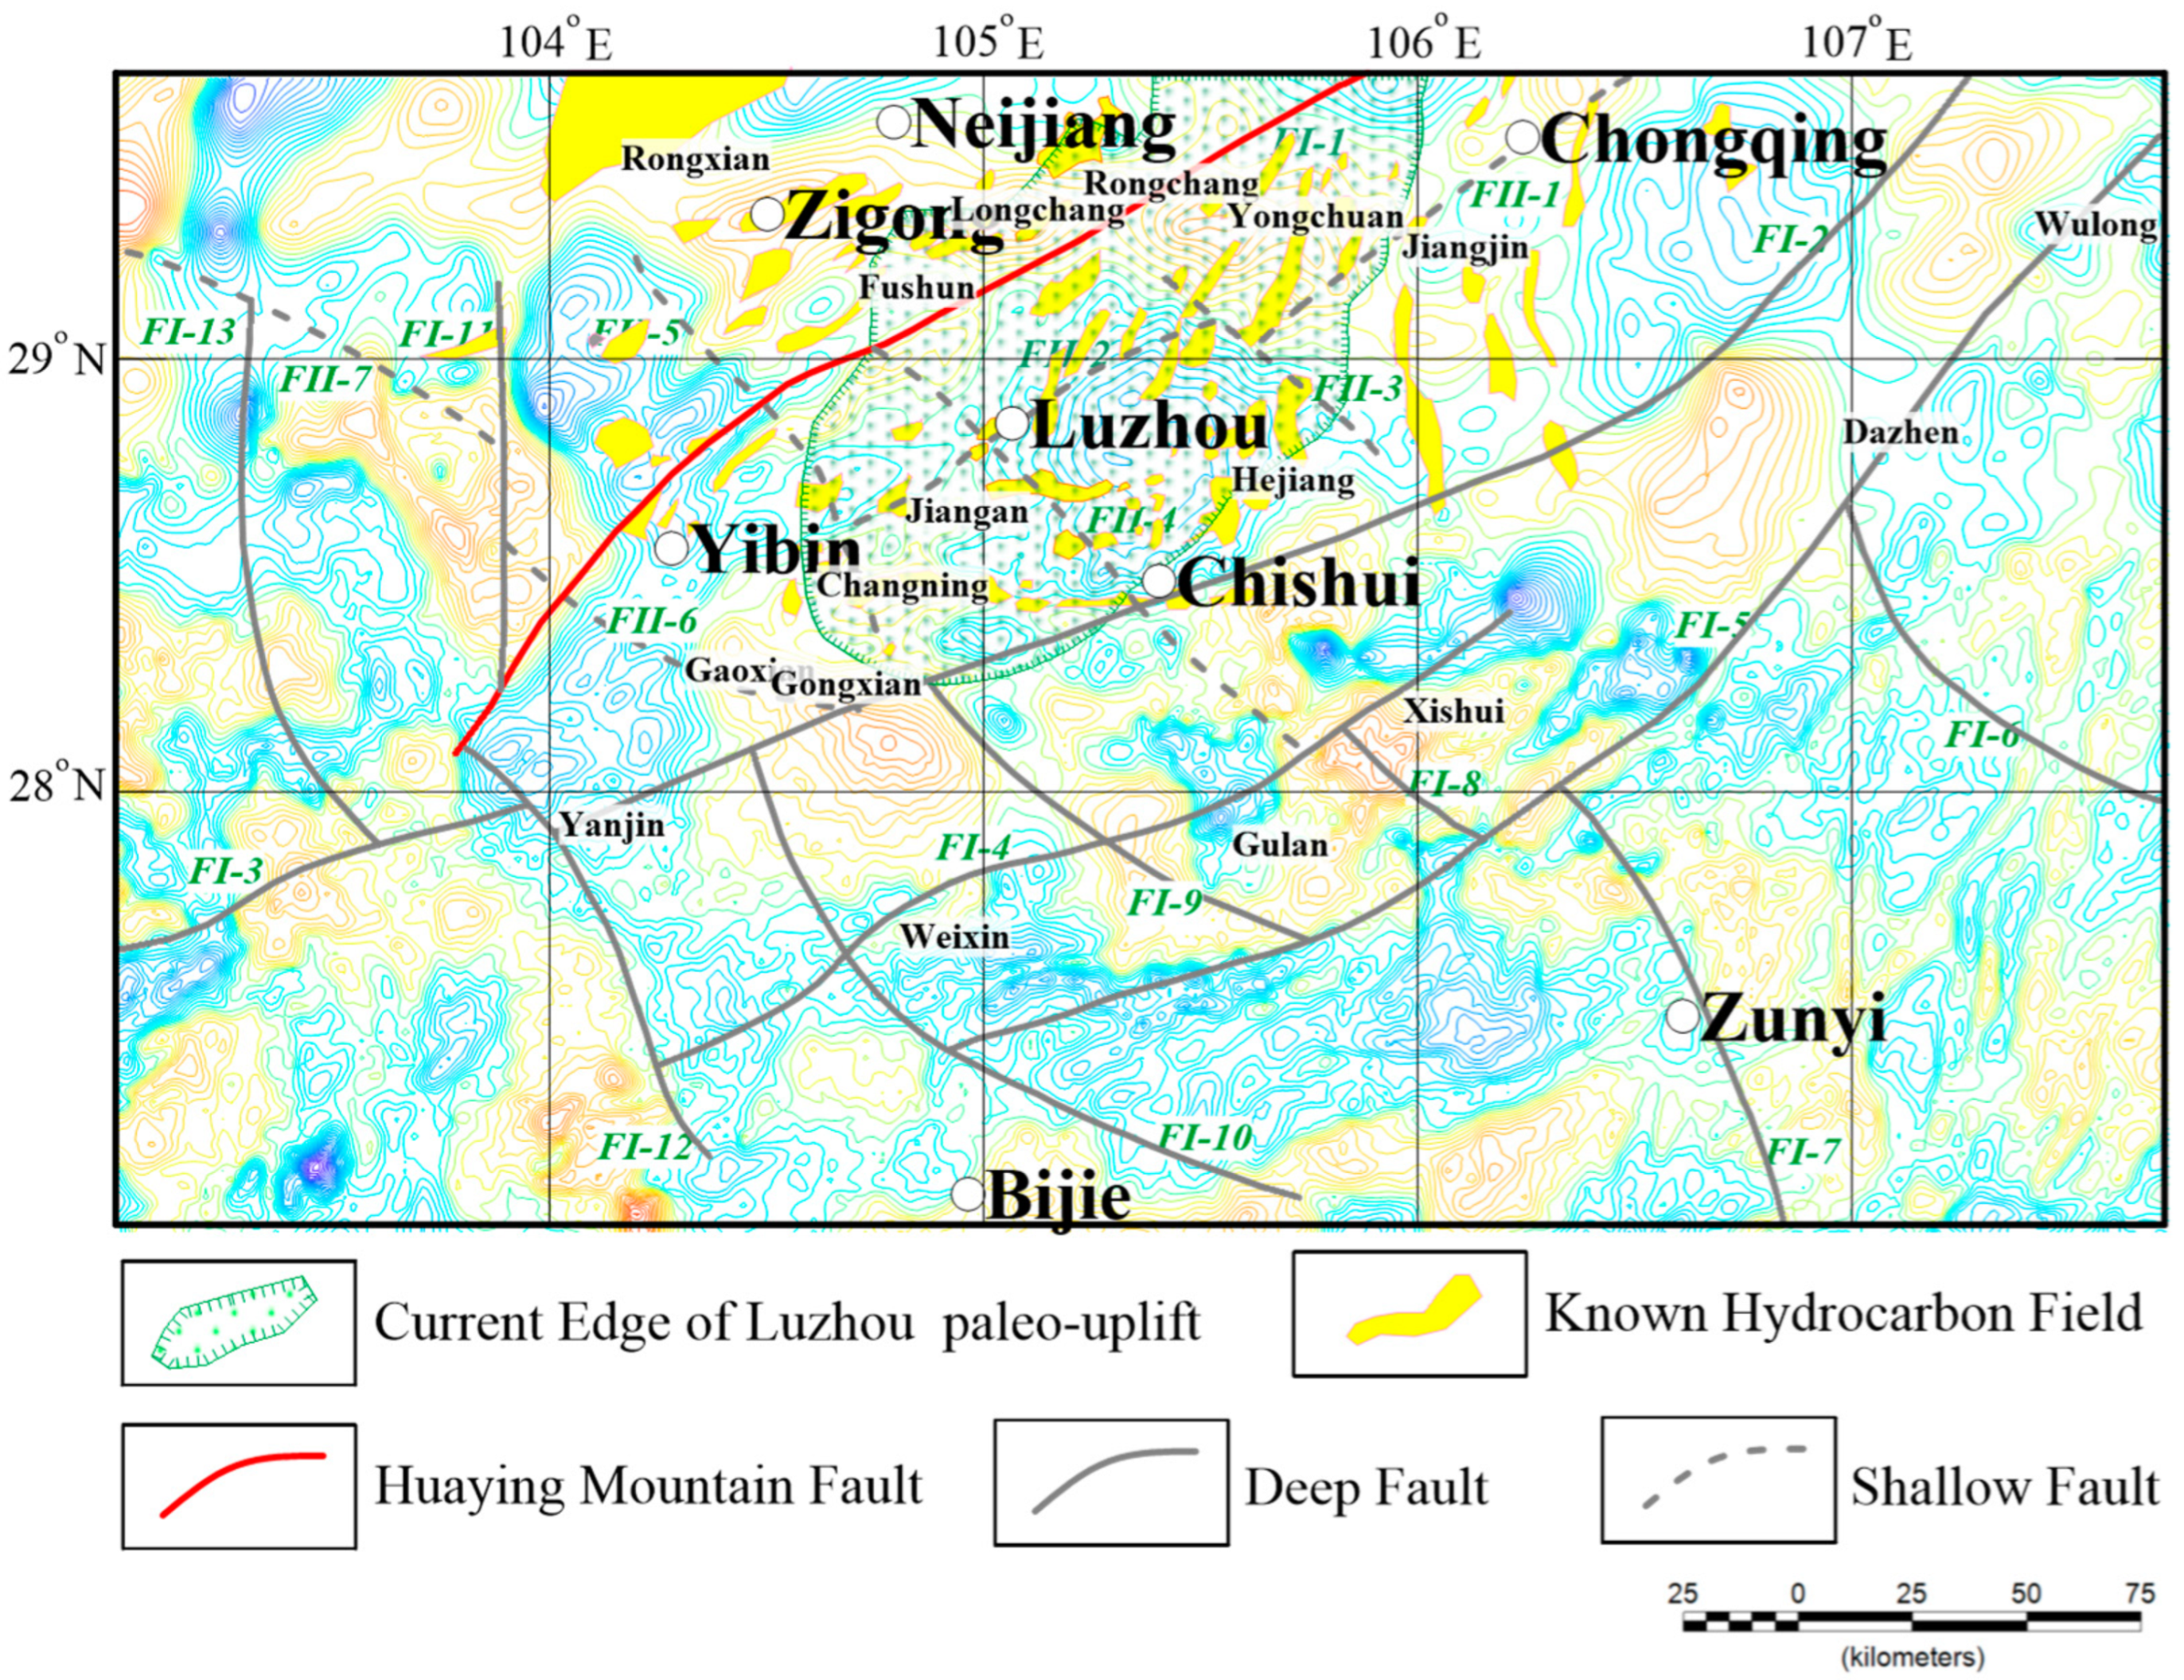
Palaeo uplift greatly influences hydrocarbon trapping and accumulation. It impacts reservoir performance and creates avenues for the migration and accumulation of early stage hydrocarbons and is therefore important for oil and gas development [52]. The Luzhou palaeo uplift is a classic Upper Palaeozoic NE-trending gas field in the SB that is situated in the southern HMFZ and includes the Luzhou, Jiangan, Hejiang, and Rongchang areas [32]. Faults development in this area are jointly attributed to the deformation within the Yangtze Block and the Indosinian Orogeny, making it a natural laboratory to study basin-mountain coupling and superimposed deformation. Abundant exploration results [37,53,54,55,56,57,58,59] show that the Luzhou palaeo uplift is an important tectonic unit for the accumulation of oil and gas in the SB (Figure 13; yellow indicates known oil and gas fields).
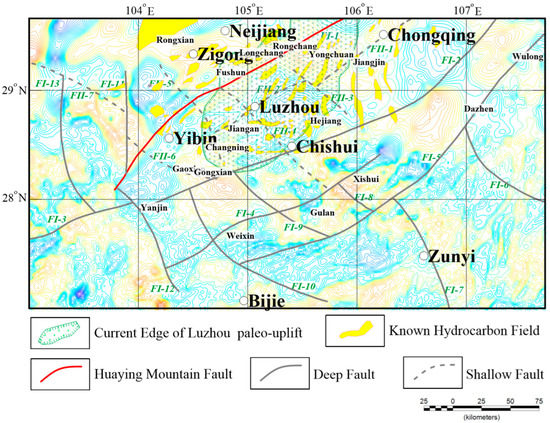
Figure 13.
Location of present boundary range and known oil and gas fields of Luzhou paleo uplift (the background image is the residual isostasy anomaly).
In the area of the Luzhou palaeo uplift, exploration targets and gas production mostly involve the anticline and slope areas, especially Permian and Triassic fractured gas fields [59]. The palaeo structures match the hydrocarbon accumulation well, which indicates that this palaeo high has been favourable for hydrocarbon migration and accumulation. Palaeo high evolution is conducive to early oil and gas accumulation, and the Luzhou palaeo uplift, which is attributed to the Indosinian Orogeny at the end of the Middle Triassic, continued to rise during the late Triassic–Jurassic period [60,61]. Although the Yanshan event during the Sichuan uplift caused the westward movement to the Zigong area, the Luzhou palaeo uplift remained in the most elevated area, which was conducive for early oil and gas accumulation. Oil and gas reserves have already been discovered in the Jialongjiang formation at the edge of the uplift.
5.2. Relationship between the Distribution of the Palaeo Uplift and Gravity Anomalies
Shown in Figure 13, it is obvious that Luzhou palaeo uplift extends broadly (Figure 13); the southern margin reaches between Gongxian and Changning, the eastern margin reaches the Chishui–Hejiang–Jinjiang area, the west margin reaches the Fushun–Longchang area, and the northern margin reaches Bishan. Across this expanse, there is a low-gravity anomaly closure, which is dome-shaped and extends in a southwest direction. Near present-day Luzhou, the gravity anomaly increases gradually, and a high anomaly occurs near Changning. In the northeast, gravity anomalies increase and creates an obvious NW-trending stepped belt, with a high anomaly associated with closure characterised by a long E-W axis near Yongchuan. Combining with the pre-research results [58], this indicates that the core strata in the palaeo high were involved in the deposition, uplift, and denudation during the Triassic. Moreover, the top of the palaeo high was uncovered from the Luzhou area to the Jialingjiang formation in the lower Triassic, and then to the Jiasi, Jialingjiang, and Leikoupo formations in the middle Triassic.
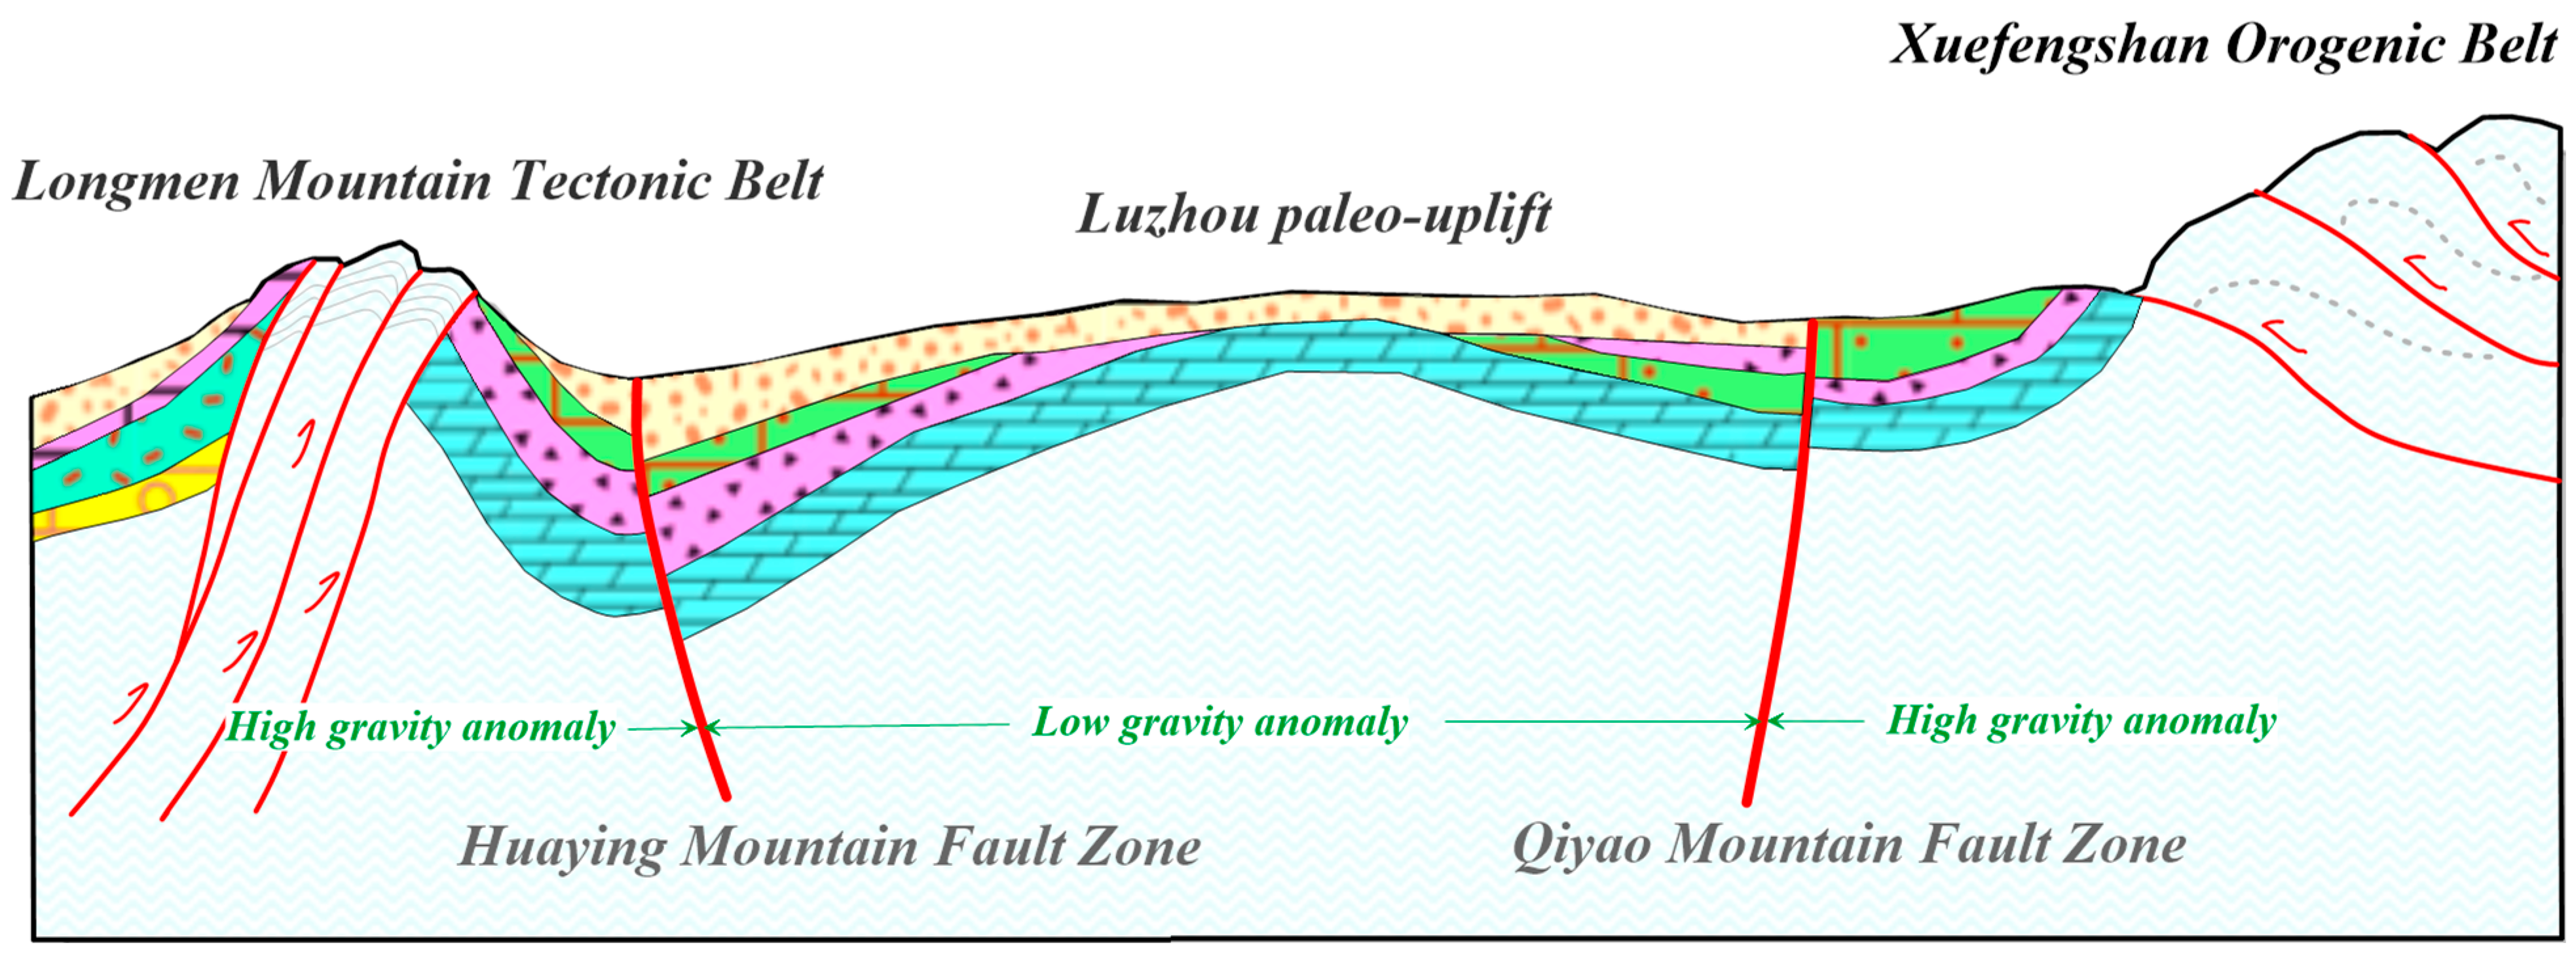
As clearly shown in Figure 13, the Luzhou paleo uplift is located between FI-1 and FI-2, and the axis formed by the Luzhou low-anomaly and Yongchuan high-anomaly areas corresponds to the NNE distribution of the uplift core. It infers that the developing of Luzhou paleo-uplift is controlled by HYMZ and the Qiyao mountain fault zone. On the other hand, the location of paleo-uplift is in the low gravity anomaly area. Furthermore, the Luzhou low-anomaly closure shows an obvious gradient in the southwest, whereas the northeast wing is relatively wide and gentle, indicating that during its formation, the principle controlling factor was tectonic stress. It inferred the evolution of Luzhou paleo uplift is linked to the Xuefengshan Orogenic Belt along the southeast margin, which caused northwest compression. The formation of the Luzhou low-anomaly closure was closely related to the movement of the Huanan Block during the Indosinian Orogeny, as shown in Figure 14 [17].
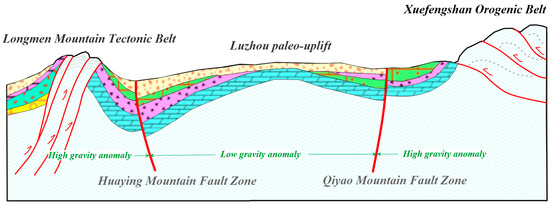
Figure 14.
The sketch map of Luzhou paleo uplift evolution.
5.3. Relationship between Fault Activity and the Distribution of Oil/Gas Fields
The distribution of oil and gas in a basin is usually closely related to the tectonic evolution of the basin. Faulting is an important and complex geological activity that can destroy oil and gas reservoirs [2]. When small-scale faults develop, they can only divide oil and gas fields and act as channels for further oil and gas migration. When large-scale faults form, oil and gas may be dispersed along the fault, resulting in the destruction of primary oil and gas reservoirs. Many oil and gas reservoirs in marine facies to the south of the study area have been destroyed by faulting, with some being attributed to the denudation of the main cap rocks, accompanied by stratigraphic uplift [51,59,60]. Although the other part of the fault-damaged reservoir caused no erosion of the main seal, oil and gas migrated along the fault.
In the early Paleozoic and early middle Triassic period, tensile activity was dominant, which resulted in the significant difference in stratigraphic thickness and lithofacies on both sides of the fault. It controlled the distribution of source bed and reservoir stratum from the early Paleozoic to the early middle Triassic period. In the late Triassic–Cretaceous period, due to the action of the extrusion stress field in the southeast direction, HYMZ occurred the thrust motion and slip action, then large nosing structures and folds are formed on both sides of the fault, which may become favorable accumulation zones for oil and gas, developed into different types of structural traps. The damage function from HYMZ to oil and gas reservoirs mainly occurs in this region where major faults often cut through the axis or the top of the anticlinal trap, and destroyed the local structure at the end of the Himalayan period, the integrity of trap is easy to lead to the loss of gas reservoir.
In this study, we inferred the formation and accumulation of oil and gas, as well as the reservoir distribution in the Luzhou palaeo uplift. We also evaluated the relationship between oil and gas fields and structural features based on measured gravity data. The Luzhou palaeo uplift is shown in the study area in Figure 13 (shaded green; refer to [51]), and the known locations of oil and gas fields (shaded yellow in Figure 10; refer to [51]) are marked in the gravity interpretation map. As shown in Figure 13, it is clear that the known hydrocarbon field is highly related to the distribution of the faults. Near the Neijing-Zigong area, the oil/gas field is in macro-shapes and striking along NE and NNE which is corresponding to HYMZ (FI-1), it means the distribution of these fields is controlled by HYMZ, HYMZ is developing well and effect the accumulation of the reservoirs, and near Yibin, the reservoirs also are existing, so the near HYMZ is well base for oil/gas accumulation. Inside the Luzhou paleo uplift, the oil/gas fields’ distribution is affected by the secondary faults mainly, the large faults that HYMZ (FI-1) and Qiyao Mountain Fault (FI-2) determines the accumulation of these fields. Furthermore, the late small-scale fault played the role of migrating-channel; thus, the distribution is controlled by secondary faults obviously.
5.4. Relationships among Oil/Gas Field Distributions, Gravity Anomalies, and Structural Features
The core of the palaeo high from Luzhou to Yongchuan is linked to the development of oil and gas fields. In the northeast, a long axis associated with relatively large-scale deposition and obvious gravity anomalies is present and is likely controlled by the HMFZ. The new anticline of the palaeo high serves as the overlying unit and is linked to the large-scale development of deep faults, which acted as conduits between the underlying Palaeozoic gas reservoirs and the Xujiahe formation. Gas reservoirs attributed to Palaeozoic source rocks formed early in the history of the HMFZ, and some were damaged by subsequent faulting, thus causing the escape of gas along the fault channels, accumulation in sandstone reservoirs, and the formation of a new fault-controlled reservoir complex.
In the Longchang and Rongchang areas, oil and gas reservoirs formed on the northwest wing of the palaeo high, with a long NE-oriented axis. However, in Longchang, the Shengdengshan gas field developed on the short axis of an anticline. This is among the earliest gas fields developed in China and is a fault-anticline composite gas reservoir. According to the gravity anomaly map, the scale and associated disturbance near the core of the high-anomaly closure are small, indicating the presence of small faults. Overall, oil and gas fields are distributed along a long NE-trending axis, thereby reflecting the impact of tectonic stresses from the NW. Oil and gas fields characterised by a nearly E-W axis exist from Changning to Chishui along the southern margin of the palaeo uplift, and the obvious gravity anomalies indicate the existence of E-W structural belts. A high gravity anomaly closure also exists in the west of Changningxian, which coincides with the small and short-axis Laowengchang anticline.
Northeast-trending near-equiaxial oil and gas fields developed to the northwest of the outer edge of the Luzhou palaeo uplift, near Zigong, and these are associated with high gravity anomalies. The strikes of closures are controlled by faults, which are distributed within the axial disturbance area of the gravity contours. The Dengjingguan gas field is situated along the north-western margin of the palaeo high, where Jurassic strata are exposed in an anticline core that trends NE and has a short axis. This section is cubic and characterised by a steep northwest wing, a gentle southeast wing, and a platform-like top. Thrust faults are common in the southeast, and some are exposed in the northwest wing of the anticline. Fracturing observed in the Jialingjiang Formation reservoir is also well developed in the Dengjingguan gas field. Large fractures that formed along the long axis of the anticline serve as the main channels for hydrocarbon migration. Owing to connections with underlying Palaeozoic source rocks, migration along faults involved dispersion, followed by accumulation in anticlinal traps, which produced stacked and independent reservoirs. Nearly N-S-oriented oil and gas fields formed in the Jinjiang area along the eastern margin of the paleo-uplift.
6. Conclusions
In this study, we distinguished fault structures in the HMFZ based on the processing and analysis of 1:250,000-scale measured gravity and MT data. The faults mainly trend in NNE and NE, with subordinate faults trending nearly in NE and E-W. We also revealed the vertical extents of the main faults and discussed the relationships among gravity anomalies, fault distributions, the Luzhou palaeo uplift, and the distribution of oil and gas reservoirs in the study area. Oil and gas fields are developed in the upper subsidiary anticline of the paleo-high, where strikes are controlled by small faults; these fields belong to an anticline-fault back. The corresponding gravity anomaly contour shows high-value closure and small-scale disturbance, which can provide reliable guidance for future oil and gas exploration.
Author Contributions
Conceptualization, methodology, soft, formal analysis, writing: M.X.; gravity investigation: C.S. and L.C.; MT investigation, MT data methodology and analysis: G.Q.; Project manager: Y.Y.; Document editing: L.J. All authors have read and agreed to the published version of the manuscript.
Funding
This research was funded by the National Key R&D Program of China [grant numbers: 2018YFE0208300], the China Geological Survey Project [grant numbers: GC20230111], the China Geological Survey Program [grant numbers: DD20221638, DD20190032], the National Natural Science Foundation of China [grant numbers: 42104092], Fundamental Research Funds Program of Chinese Academy of Geological Sciences [grant numbers: JY202101], China Scholarship Council [grant numbers: 202008575035].
Data Availability Statement
Data are available to request from the China Geological Survey. https://geocloud.cgs.gov.cn/.
Acknowledgments
This work was carried out within by the China Geological Survey Program, [grant number: DD20190032]. Please allow us to show the great appreciation to editor and reviewer for their so helpful comments and suggestions.
Conflicts of Interest
The authors declare no conflict of interest.
References
- Tan, C. Comparative Study on Stratigraphy and Sedimentary Facies of the Xujiahe Formation in Sichuan Basin and the Yanchang Formation in Ordos Basin. Master’s Thesis, China University of Geosciences, Beijing, China, 2014. [Google Scholar]
- Liu, C.L.; Li, B.; Wu, L.Q.; Wu, L.Q.; Wang, Z.L. Geological Condition Evaluation of Shale Oil of Upper Cretaceous in Songliao Basin; Geology Press: Beijing, China, 2016. [Google Scholar]
- Long, Y.K. Lower Paleozoic shale gas exploration potential in the central Yangtze area, China. Geol. Bull. China 2011, 30, 344–348. [Google Scholar]
- Zhang, L.Y.; Li, Y.X.; Li, J.H.; Jin, Y.W. Accumulation conditions for shale gas and it’ future exploration of Silurian in the Central upper Yangtze region. Geol. Sci. Technol. Inf. 2011, 30, 90–93. [Google Scholar]
- Zhang, L.H.; He, X.; Li, X.; Li, K.; He, J.; Zhang, Z.; Guo, J.; Chen, Y.; Liu, W. Shale gas exploration and development in the Sichuan Basin: Progress, challenge and countermeasures. Nat. Gas Ind. 2022, 9, 176–186. [Google Scholar] [CrossRef]
- Dong, R.Z.; Shi, Z.S.; Guan, Q.; Jiang, S.; Zhang, M.; Zhang, C.; Wang, S.; Sun, S.; Yu, R.; Liu, D.; et al. Progress, challenges and prospects of shale gas exploration in the Wufeng-Longmaxi reservoirs in the Sichuan Basin. Nat. Gas Ind. 2018, 38, 67–76. [Google Scholar] [CrossRef]
- Li, H.K.; Li, Z.Q.; Long, W.; Wan, S.S.; Ding, X.; Wang, S.Z.; Wang, Q.Z. Vertical configuration of Sichuan Basin and its superimposed characteristics of the prototype basin. J. Chengdu Univ. Technol. 2019, 46, 257–267. [Google Scholar]
- Wang, Z.J.; Wang, H.C.; Dong, D.; Qin, J. Review of Geophysical Results of Huayingshan Fault Zone. Earthq. Res. Sichuan 2018, 3, 6–12. [Google Scholar]
- Zhao, Z.W. The Regional Tectonic Characteristic of Southeast Sichuan Basin and Its Control to Oil and Gas Reservoir. Master’s Thesis, China University of Geosciences, Beijing, China, 2005. [Google Scholar]
- Xu, X.Q. The Gravity Characteristics of the Middle and Upper Yangtze Region and Its Geological Significance. Master’s Thesis, Northwest University, Shenyang, China, 2008. [Google Scholar]
- Sheng, Q.; Xie, X.S. Late Quaternary reverse strike-slip characteristics and seismic significance of Huaying Mountain fault zone in Sichuan. Crustal Tecton. Crustal Stress. Proceeding 2010, 1, 1–10. [Google Scholar]
- He, D.F.; Lu, R.L.; Huang, H.Y.; Wang, X.S.; Jiang, H.; Zhang, W.K. Tectonic and geological background of earthquake hazards in Changning shale gas development zone, Sichuan Basin, SW China. Pet. Explor. Dev. 2019, 46, 993–1006. [Google Scholar] [CrossRef]
- Chen, K.; Yi, J.; Sun, G.; Li, G.; Wang, T.J. Research on 3D P-wave velocity structure imaging in Chongqing Area. J. Geod. Geodyn. 2020, 40, 936–941. [Google Scholar]
- Liu, K.L.; Yang, S.; Chen, H.D.; Li, Q.; Ma, L.; Zhang, C.G. Characteristics and evolution of perrmian volcanic rocks in Huayingshan Area, eastern Sichuan Province. Mineral. Petrol. 2020, 40, 37–49. [Google Scholar]
- Liu, C.L.; Wang, G.G.; Shi, Z.; Zhao, D.; Zhang, H. Possible precursory anomalies in ground water level associated with the Wenchuan Ms 8.0 earthquake in 2008, Sichuan, China. Geod. Geodyn. 2020, 11, 127–134. [Google Scholar] [CrossRef]
- Li, Y.K.; Gao, J.W.; Han, J.; Yang, Y.E. Geophysical evidence for thrusting of crustal materials from orogenic belts over both sides of the Yangtze Block and its geological significance. Sci. China Earth Sci. 2019, 49, 687–705. [Google Scholar] [CrossRef]
- Huang, H.Y.; He, D.F.; Li, F.; Fan, H. Determination and formation mechanism of the Luzhou paleo-uplift in the southeastern Sichan Basin. Earth Sci. Front. 2019, 26, 102–120. [Google Scholar]
- Feng, M.; An, M.J.; An, M.J.; Wu, Z.H.; Tan, C.X. Focal Mechanisms of Earthquakes in Chongqing and Geodynamical Implications. Acta Geosci. Sin. 2019, 40, 319–328. [Google Scholar]
- Wu, H.; Qiu, N.S.; Chang, J.; Zhang, J.; Wang, Y. Physical Simulation on development of Multilayer detachment fold belt in Eastern Sichuan. Earth Sci. 2019, 44, 784–797. [Google Scholar]
- He, W.G. Features and Formation Mechanism of the Eastern-Sichua-Western-Hunan-Hubei Fold Thrust belt in South China. Master’s Thesis, University of Petroleum, Beijing, China, 2018. [Google Scholar]
- Wu, P.; Su, J.R.; Huang, C.M.; Huang, D.J.; Duan, Y.G. Characteristic of shear-wave splitting in the Yibin area, Sichuan Province. Earthq. Res. China 2017, 33, 414–423. [Google Scholar]
- Kong, H.B.; Liao, X.; Li, G.K.; Chen, M. Dynamic Characteristics of water level tides of four wells in the Huayingshan Area. Technol. Earthq. Disaster Prev. 2016, 11, 600–610. [Google Scholar]
- Wang, Z.C.; Zhao, W.Z.; Li, Z.Y.; Jiang, X.F.; Jun, L. Role of basement faults in gas accumulation of Xujiahe Formation, Sichuan Basin. Pet. Explor. Dev. 2008, 35, 541–547. [Google Scholar] [CrossRef]
- Ahmed, M.E.; Luan, T.P.; Ahmed, H. High precision structural mapping using edge filters of potential field and remote sensing data: A case study from Wadi Umm Ghalqa area, South Eastern Desert, Egypt. Egypt. J. Remote Sens. Space Sci. 2022, 25, 501–513. [Google Scholar]
- Luan, T.P.; Saulo, P.O.; Ahmed, M.E. Determination of structural lineaments of Northeastern Laos using the LTHG and EHGA methods. J. King Saud Univ.–Sci. 2022, 34, 101825. [Google Scholar]
- Smith, J.T.; Booker, J.R. Magnetotelluric inversion for minimum structure. Geophysics 1988, 53, 1565–1576. [Google Scholar] [CrossRef]
- Wannamaker, P.E.; Doerner, W.M. Crustal structure of the Ruby Mountains and southern Carlin Trend region, Nevada, from magnetotelluric data. Ore Geol. Rev. 2002, 21, 185–210. [Google Scholar] [CrossRef]
- Bedrosian, P.A. MT+, integrating magnetotellurics to determine earth structure, physical state, and processes. Surv. Geophys. 2007, 28, 121–167. [Google Scholar] [CrossRef]
- Bedrosian, P.A.; Feucht, D.W. Structure and tectonics of the northwestern United States from EarthScope USArray magnetotelluric data. Earth Planet. Sci. Lett. 2014, 402, 275–289. [Google Scholar] [CrossRef]
- De Groot-Hedlin, C.; Constable, S. Inversion of magnetotelluric data for 2D structure with sharp resistivity contrasts. Geophysics 2004, 69, 78–86. [Google Scholar] [CrossRef]
- Huang, J. Analysis for Cycle Evolution Moel of Karst Water System in Huayingshan Fold Mountain. Master’s Thesis, Chengdu University of Technology, Chengdu, China, 2009. [Google Scholar]
- Zhao, Y.H. Genetic Mechanism and Oil-Gas Analysis of High and Steep Structure in East Sichuan. Master’s Thesis, China University of Geosciences, Beijing, China, 2005. [Google Scholar]
- Luo, W. Regionalization of Mesozoic-Cenozoic Strata and Analysis of Basin Evolution of Sichuan Basin. Master’s Thesis, Chengdu University of Technology, Chengdu, China, 2010. [Google Scholar]
- Tang, R.C.; Zhang, Y.G.; Huang, Z.Z.; Lei, J.C. A study of seismic zoning of Shimian-Xichang area in Sichuan province. J. Seismol. Res. 1993, 03, 306–315. [Google Scholar]
- Luo, Z.L.; Long, X.M. The uplifting of the Longmenshan orogenic zone and the subsidence of the west Sichan foreland basin. Acta Geol. Sichuan 1992, 1, 1–17. [Google Scholar]
- Zhu, Z. Impact of Gypsolith on the Preservation and Exploration Prospect of Shale Gas in Sichuan Basin. Master’s Thesis, Nanjing University, Nanjing, China, 2016. [Google Scholar]
- Wang, Z.C. Tectonic Continuity and Gas Exploration in Sichuan Basin; Geology Press: Beijing, China, 2002; pp. 1–287. [Google Scholar]
- Fedi, M. DEXP: A fast method to determine the depth and the structural index of potential fields sources. Geophysics 2007, 72, I1–I11. [Google Scholar] [CrossRef]
- Yang, W.C.; Sun, Y.Y.; Hou, Z.-Z.; Yu, C.-Q. A multi-scale scratch analysis method for quantitative interpretation of regional gravity fields. Chin. J. Geophys. 2015, 58, 520–531. (In Chinese) [Google Scholar]
- Yang, G.Y. A new technique for potential field data processing: Small sub-domain filtering. Oil Geophys. Prospect. 1995, 30, 224–240. (In Chinese) [Google Scholar]
- Jiang, F.Y.; Gao, L.K. Edge enhancement of gravity anomalies and gravity gradient tensors using an improved small sub-domain filtering method. Appl. Geophys. 2012, 9, 119–130. [Google Scholar] [CrossRef]
- Wang, Y.G.; Zhang, F.X.; Wang, Z.W.; Meng, L.S.; Zhang, J. Edge Detection of Potential Field Using Normalized Differential. Jilin Univ. (Earth Sci. Ed.) 2013, 43, 592–602. [Google Scholar]
- Xu, M.L.; Yang, C.B.; Wu, Y.G.; Chen, J.Y.; Huan, H.F. Edge detection in the potential field using the correlation coefficients of multidirectional standard deviations. Appl. Geophys. 2015, 12, 23–34, 120, 121. [Google Scholar] [CrossRef]
- Abbas, M.A.; Fedi, M. Automatic DEXP imaging of potential fields independent of the structural index. Geophys. J. Int. 2014, 199, 1625–1632. [Google Scholar] [CrossRef]
- Hou, Z.Z.; Yang, W.C. Wavelet transform and Multi-scale analysis on gravity anomalies of China. Acta Geophys. Sin. 1997, 40, 85–95. (In Chinese) [Google Scholar]
- Jiang, W.L.; Zhang, J.F.; Tian, T.; Wang, X. Crustal structure of Chuan-Dian region derived from gravity data and its tectonic implications. Phys. Earth Planet. Int. 2012, 212–213, 76–87. [Google Scholar] [CrossRef]
- Meng, X.H.; Shi, L.; Guo, L.H.; Tong, T.; Zhang, S. Multi-scale analyses of transverse structures based on gravity anomalies in the northeastern margin of the Tibetan Plateau. Chin. J. Geophys. 2012, 55, 3933–3941. (In Chinese) [Google Scholar]
- Yang, S.W. Tectonic Characteristics of Paleozoic in Southern Sichuan Region and its Effects on Shale Gas Preservation. Master’s Thesis, Chang Jiang University, Jingzhou, China, 2015. [Google Scholar]
- Wu, G.J.; Tan, H.B.; Sun, K.; Wang, J.; Xi, Y.; Shen, C. Characteristics and tectonic significance of gravity anomalies in the Helanshan Yinchuan Graben and adjacent areas. J. Geophys. 2020, 63, 1002–1013. (In Chinese) [Google Scholar]
- Wu, Y.; Gao, Y. Gravity pattern in southeast margin of Tibetan Plateau and its implications to tectonics and large earthquakes. Earth Planet. Phys. 2019, 3, 425–435. [Google Scholar] [CrossRef]
- Blakely, R.J. Potential Theory in Gravity and Magnetic Application; Cambridge University Press: Cambridge, UK, 1995; pp. 149–414. [Google Scholar]
- Huang, H.; He, D.; Li, Y.; Li, J.; Zhang, L. Silurian tectonic-sedimentary setting and basin evolution in the Sichuan area, southwest China: Implications for paleo geographic reconstructions. Mar. Pet. Geol. 2018, 92, 403–423. [Google Scholar] [CrossRef]
- Chen, Z.Q. Dissection of the Fracture Gas Reservoir in Triassic of Shengdengshan Gas Field. NGI 1992, 12, 21–27. [Google Scholar]
- Qiao, Z.F.; Li, G.R.; Li, T.; Wang, X.; Yu, H.; Deng, X. Sequence-Stratigraphic Features and Their Controls on Carbonate Reservoirs for the Triassic Jialingjiang Formation of the Luzhou Paleohigh in Sichuan Basin. Acta Sedmentologica Sin. 2008, 26, 92–110. [Google Scholar]
- Zhu, Q.; Li, G.R.; Qiao, Z.F.; Wang, X.; Xu, W.W. The Reservoir Features of the Triassic Jialingjiang Formation in the Luzhou Uplift, Sichuan Basin. J. Geol. 2008, 28, 30–34. [Google Scholar]
- Deng, L.P.; Li, Y.J.; Li, Q.R.; Long, H.; Xu, Y.L. Study of Geological conditions of gas reservoir of Xujiahe Formation in the of Luzhou Paleohigh in Sichuan Basin, China. Pet. Geol. Eng. 2009, 23, 18–24. [Google Scholar]
- Li, F. Seismic Hazard Analysis on the Wide Spaced Anticlines in Chongqing. Master’s Thesis, Institute of Geology, China Earthquake Administration, Beijing, China, 2015. [Google Scholar]
- Han, K.Q.; Sun, W. Conditions for the formation of large marine gas fields and gas field clusters in Sichuan Basin. Oil Gas Geol. 2014, 35, 10–18. [Google Scholar]
- Huang, H.Y. Formation and Evolution of Paleo-Uplift in Southeastern Sichuan Basin and Its Control on Hydrocarbon Accumulation. Master’s Thesis, China University of Geosciences, Beijing, China, 2018. [Google Scholar]
- Kang, Y.Z. The distribution of oil and gas in the global main basins. China Acad. J. Electron. Publ. House. 2014, 16, 14–25. [Google Scholar]
- Li, Y.Q.; Gao, J.; Li, S.J.; Hao, Y.Q.; Lin, J.H.; Sun, W.; Wu, C.Y.; Ma, Q.; Wang, L.L. Hydrocarbon accumulation model and exploration prospect of Xixiangchi Group of Middle-Upper Cambrian in the Sichuan Basin. Nat. Gas Ind. 2022, 42, 29–40. [Google Scholar]


Disclaimer/Publisher’s Note: The statements, opinions and data contained in all publications are solely those of the individual author(s) and contributor(s) and not of MDPI and/or the editor(s). MDPI and/or the editor(s) disclaim responsibility for any injury to people or property resulting from any ideas, methods, instructions or products referred to in the content. |
© 2023 by the authors. Licensee MDPI, Basel, Switzerland. This article is an open access article distributed under the terms and conditions of the Creative Commons Attribution (CC BY) license (https://creativecommons.org/licenses/by/4.0/).