Abstract
Papua New Guinea (PNG) is located at the convergence edge of the Pacific Plate and the Indo-Australian Plate, consisting of three units. There are three chromium mineralization types in PNG. Based on national-scale geochemical mapping in PNG during 2015–2018, 1399 samples of stream sediments were collected from Highland Region, Papua Peninsula, and New Guinea Islands. This paper preliminarily studied chromium’s geochemical background, spatial distribution characteristics, and geochemical anomalies. The chromium concentration ranged from 3 ppm to 74,600 ppm, with a median value of 145 ppm, which was higher than the upper crustal abundance of chromium and the chromium geochemical baseline of Europe, Australia, North America, and China. In terms of stream sediment samples in different tectonic units, as mafic–ultramafic magmatic rocks are widely developed, the median chromium values of the New Guinea Orogen, including the Papuan Fold Belt, the New Guinea Thrust Belt, the Finisterre Terrane, the Aure Fold Belt, the Eastern Fold Belt, and the Eastern Papuan Composite Terrane, were higher than the value of the Melanesian Arc. The ophiolitic complexes, such as the April ophiolite, the Marum ophiolite, and the Papua ultramafic belt, significantly correlated with the higher chromium concentration. Eleven chromium high anomalies with mineralization potential were delineated, including three laterite and podiform prospecting areas and eight placer prospecting areas. Based on the chromium–nickel integrated anomaly map, comprehensive exploration and exploitation of nickel and chromium can be carried out in 1 and 11 high anomaly areas related to lateritic mineralization.
Keywords:
national-scale geochemical baseline; chromium; anomaly; laterite; placer; podiform; Papua New Guinea 1. Introduction
Chromium is a steely grey, lustrous, hard, and brittle transition metal with a high melting point (1907 °C). Chromium exists in many oxidation states, including +6, +5, +4, +3, +2, +1, −1, and −2, and the predominant and most stable oxidation state is +3. Natural chromium has four isotopes (50Cr, 52Cr, 53Cr, and 54Cr) and 52Cr is the most abundant. More than 50 kinds of chromium-containing minerals have been found in nature, belonging to oxides, chromates, and silicates. Chromium minerals with industrial value belong to chromium spinel minerals. Their general minerals include chromite ((Mg, Fe) Cr2O4) and picotite (Fe (Cr, Al)2O4). The chromium content is the highest in the mantle, and the average chromium contents in the core, lower mantle, upper mantle, and crust are 660 ppm, 2000 ppm, 1600 ppm, and 110 ppm, respectively. Chromium is enriched differently in various rocks on the earth’s surface, with averages of 25 ppm in felsic rock, 50 ppm in intermediate rock, 200 ppm in mafic rock, and 2000 ppm in ultramafic rock [1].
Chromium is a critical material because of its hardness, wear resistance, high-temperature resistance, and corrosion resistance. As the primary source of chromium, chromite is an irreplaceable raw material for the production of stainless steel and other special steels that are used for new infrastructure projects, including 5G base stations, the industrial Internet of Things, artificial intelligence, ultra high voltage transmission, high-speed intercity railways, and electric vehicle charging stations and are an essential strategic resource in military and aerospace industries [2,3]. All of the United States, the European Union, and Japan identified chromium as a critical mineral or a raw material of concern [4,5,6]. China also included chromite in the strategic mineral directory for the first time in 2016 to strengthen its management [3].
The global estimated mine production of chromite ore in 2021 was 41,000,000 tons, 44% of which was from South Africa. Other major producing countries include Turkey, Kazakhstan, India, Finland, etc. [7]. As the world’s leading chromium-consuming country, China’s demand for chromium will grow at an annual rate of 6.87% for the next decade [8]. According to an International Energy Agency (IEA) forecast, global chromium demand from concentrating solar power will grow 75 times by 2040 relative to 2020 [9]. Therefore, discovering new prospecting areas is crucial for a sustainable supply of chromium.
There are seven major chromium-containing mineralization types. The main mineralization types include stratiform deposits (Bushveld in South Africa), podiform deposits (Kempirsai in Kazakhstan), and laterite deposits (Ramu in PNG). Placer deposits (Salamaua in PNG), volcanogenic massive sulfide (VMS) deposits (Big Daddy in Canada), iron oxide copper gold (IOCG) deposits (Burra in Australia), and pegmatite-hosted deposits (Dongsugok in South Korea) are also significant.
Sampling for national-scale geochemical mapping in PNG was conducted jointly by the Mineral Resources Authority of PNG and the China Geological Survey during 2015–2018. Limited by traffic conditions, social security, private territories, and other factors, the samples were mainly collected from Highland Region, Papua Peninsula, and New Guinea Islands (New Britain Island, New Ireland Island, and Manus Island). The contents of 69 elements, including chromium, nickel, cobalt, and vanadium, were analyzed. In this paper, we report the contents of chromium in different tectonic units of PNG as well as a chromium geochemical contour map, a chromium geochemical anomaly map, and a chromium–nickel integrated anomaly map in order to (1) discuss chromium’s spatial distribution and its correlation with the tectonic unit, parent rocks, and mineralization and (2) point out the direction of the next step of chromium ore prospecting.
2. Topography, Geology, and Chromium Mineralization of PNG
PNG is situated between Australia’s stable continental mass and the Pacific’s deep ocean basin. The largest section is the eastern half of the island of New Guinea, which is dominated by a massive central cordillera, or system of mountain ranges, extending from Indonesia’s Irian Jaya to East Cape in Papua New Guinea, at the termination of the Owen Stanley Range, including the nation’s highest peak, Mt. Wilhelm (4509 m). A second mountain chain fringes the north coast and runs parallel to the central cordillera. Active and recently active volcanoes are prominent features of the landscapes of New Guinea. No glaciers or snowfields exist. In the lowlands, there are many swamps and floodplains. Important rivers include the Sepik, flowing to the north coast, and the Fly, flowing to the southwest coast. The smaller islands of PNG are also areas of extreme topographic contrast and generally feature mountain ranges rising directly from the sea or narrow coastal plains.
PNG is formed by the subduction and collision of the oceanic Pacific Plate and the Indo-Australian Plate, which consists of three tectonic units: the Fly Platform in the south, the New Guinea Orogen in the middle, and the Melanesian Arc in the north (Figure 1) [10,11,12,13]. The Fly Platform comprises the Proterozoic–Permian Australian cratonic basement overlain by Triassic–Neogene sediments of the Papuan Basin. It is essentially unaffected by the Cainozoic deformation that is apparent in terranes to the north [11]. The New Guinea Orogen comprises a metamorphosed Paleozoic–Mesozoic basement with Cenozoic sediments, volcanic rocks, and local intrusive rocks covers [14,15] and can be further divided into eight subtectonic units: the Papuan Fold Belt, the New Guinea Thrust Belt, the Aure Fold Belt, the Eastern Fold Belt, the Eastern Papuan Composite Terrane, the Papuan Islands, the Bewani–Torricelli Terrane, and the Finisterre Terrane [10,11,12]. The basement of the Papuan Fold Belt consists of Permian metasedimentary rocks intruded by Early to Middle Triassic granites and is overlain by a thick succession of deformed marine sedimentary rocks of the Late Triassic to Pliocene age [16,17]. The New Guinea Thrust Belt is characterized by Triassic to Eocene fine-grained sedimentary rocks and minor volcanic rocks [18,19]. The Aure Fold Belt and the Eastern Fold Belt are composed of a thick late Oligocene to Pliocene sequence of mainly clastic sedimentary rocks intruded by Oligocene gabbro [12]. The East Papuan Composite Terrane is dominated by ophiolite of the Papuan Ultramafic Belt on the northeast side and metamorphic rocks of the Owen Stanley Metamorphics to the southwest [12]. The Bewani–Torricelli Terrane is dominated by Late Cretaceous to Eocene sea-floor volcanic rocks and late Oligocene volcanic rocks with widespread, largely comagmatic intrusions [20]. The Finisterre Terrane comprises a thick middle–late Eocene volcanic sedimentary sequence, early Oligocene to early Miocene andesitic and basaltic lava, and middle Eocene to Pliocene shallow-water limestone [20]. The Papuan Islands comprise the Paleogene basement consisting of ophiolitic meta-igneous rocks and metasedimentary rocks, with a Pliocene volcanic sedimentary sequence and basalt covers [21]. Massive ophiolitic complexes, such as the April ophiolite [14,22,23], the Marum ophiolite [18,19], and the Papua ultramafic belt, are developed in the orogenic belt, especially in New Guinea Thrust Belt and the Eastern Papuan Composite Terrane. The Melanesian Arc comprises the islands northeast of the mainland and was built up by subduction-related island arc magmatism beginning in the Eocene [24].
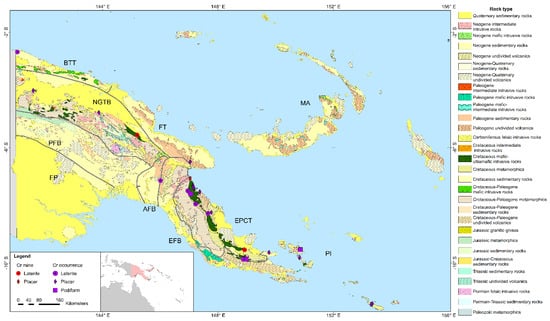
Figure 1.
Distribution of chromium-bearing deposits and chromium occurrence (modified from [10,25,26]). FP, Fly Platform; PFB, Papuan Fold Belt; NGTB, New Guinea Thrust Belt; AFB, Aure Fold Belt; EFB, Eastern Fold Belt; EPCT, Eastern Papuan Composite Terrane; FT, Finisterre Terrane; BTT, Bewani–Torricelli Terrane; MA, Melanesian Arc; PI, Papuan Islands.
Three chromium mineralization types have been found in PNG (Figure 1) [25]. Laterite deposits formed by the weathering of serpentinized ultramafic rocks such as dunite and peridotite are the primary mineralization type in PNG and are distributed in NGTB, EFB, and EPCT. The Ramu deposit, the only nickel–cobalt–chromium deposit being exploited in PNG, is formed by the weathering of the Marum ophiolite. The Wowo Gap is also a sizeable chromium-bearing deposit hosted by the Papuan Ultramafic Belt. Placer deposits related to mafic–ultramafic rocks can be found in NGTB, FT, EPCT (the Salamaua deposit), EFB, and PI. Podiform deposits are mainly distributed in EPCT and PI (Table 1).

Table 1.
Basic information of chromium-bearing mines and chromium occurrence in PNG [25].
3. Methods
3.1. Sampling
Limited by traffic conditions, social security, private territories, and other factors, samples were mainly collected from the Papuan Fold Belt, the New Guinea Thrust Belt, the Eastern Fold Belt, and the Melanesian Arc. The sampling grid was based on 1:250,000 topographic map sheets of 5′ × 5′, which were approximately equal to 100 km2. The sampling points were designed to control the maximum area of each sampling grid, and at least one sample was collected from each sampling grid. Geographically, Papua New Guinea has many mountains, generally of high altitude, followed by low mountains and hills, and few plains and valleys. According to the technical requirements of international geochemical mapping from the UNESCO International Centre on Global-scale Geochemistry, <2 mm stream sediments from riverbed surfaces at a depth of 0–25 cm were sampled at each site. In total, 1399 samples were collected which covered approximately 128,000 km2. The average sampling density was approximately 1.1 sites/100 km2. The number of field repeats accounted for 3.3% of the total samples. The weight of each sample was about 1 kg, half of which was used for analysis, and the rest was reserved as duplicate samples [15,27]. The sample locations are shown as circles in Figure 2.
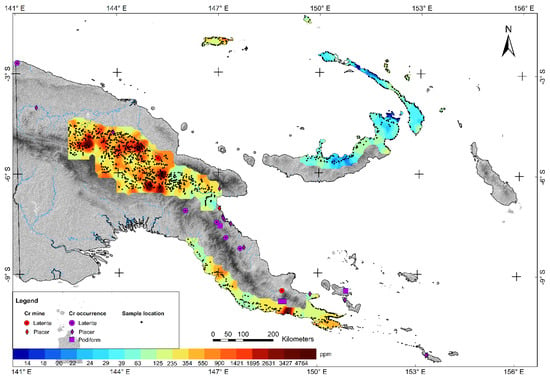
Figure 2.
Chromium geochemical contour map of PNG.
3.2. Chemical Analysis and Quality Control
All samples were analyzed by the Henan Province Rock & Mineral Testing Centre, a qualified laboratory for geochemical analysis in China. Chromium was determined using X-ray fluorescence spectrometry (XRF). The detection limit was 5 ppm. During the analysis, after processing the sample to less than 74 μm (95% less than 74 μm), 4 g of the sample was dried at 105 °C, edged with low-pressure polyethylene, and pressed into a disc with a diameter of 32 mm under 35 MPa [28].
All chemical analyses of the samples were conducted under a strict quality control protocol. The accuracy and precision of the analytical method were tested by analyzing the Chinese primary geochemical standard reference materials. Parallel analyses were conducted with the XRF. Analyses were conducted for each of the 12 standard reference materials. The accuracy was determined by the logarithmic deviation (Δ1gC) between the arithmetic mean value of the analysis data and the standard values of the standard samples.
: the arithmetic mean value; Cs: the standard value.
The precision was determined by the relative standard deviation (RSD) between the analysis values and the standard values of the standard samples.
Ci: the analysis value; Cs: the standard value; n:12.
Parallel analyses showed that the accuracy and the precision of the analytical method met the requirement of the specification (Table 2).

Table 2.
The chromium data of standard samples.
The 1399 samples were divided into 28 analytical batches, i.e., 50 samples per batch, and 4 standard samples unknown to the analysts were randomly inserted into each batch of 50 samples. In total, 112 determinations of standard samples were made within the suite of 1399 samples. The pass rate of accuracy and precision for the data reached 100%, and the sample rate was also 100%. A histogram shows that the chromium element data conformed to a normal distribution, proving the validity of the data (Figure 3).
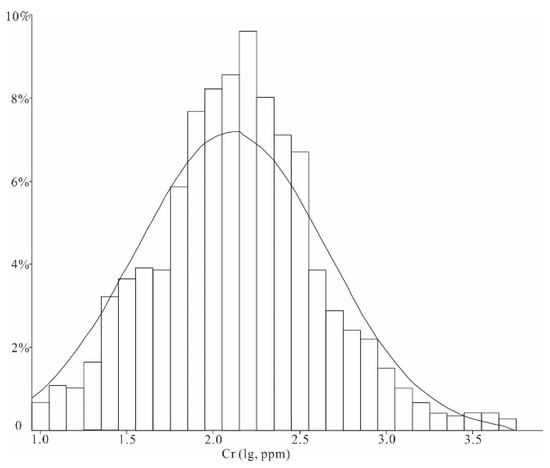
Figure 3.
Histogram of chromium element.
3.3. Data Reduction
Reliable geochemical maps are meaningful for prospecting and environmental studies [29]. The chromium geochemical contour map (Figure 2) was generated using GeoExpl (International) and ArcGIS software. The raw discrete data were interpolated to generate a regular output grid using an exponentially weighted distance model. The spacing between grid cells (Dx and Dy) was 10 km. The data search mode was circle search, and the search radius was 2.5 times of the center distance of the adjacent grids, which was 25 km. The compilation of geochemical maps adopted the classification method of cumulative frequency to divide the chromium into 19 grades according to the cumulative frequencies of 0.5, 1.2, 2.0, 3.0, 4.5, 8.0, 15.0, 25.0, 40.0, 60.0, 75.0, 85.0, 92.0, 95.0, 97.0, 98.0, 98.8, and 99.5 (%).The corresponding chromium contents were 14, 18, 20, 22, 24, 29, 39, 63, 125, 235, 354, 550, 900, 1421, 1895, 2631, 3427, and 4764 (ppm). The gradient of dark blue, light blue, light green, yellow, red, and dark red indicates the chromium contents from low to high (Figure 2).
4. Results
4.1. General Distribution of Chromium in PNG
The chromium concentrations ranged from 3 ppm to 74,600 ppm. The 95% range (P2–P97) varied from 14 to 1420 ppm, with the median value (baseline) of 145 ppm, an arithmetic mean value of 548 ppm, and a geometric mean value of 150 ppm. The chromium values in the stream sediments followed a log-normal distribution, as evidenced by the ranking of the arithmetic mean (AM), geometric mean (GM), and median values as AM > median ≈ GM [30]. The chromium baseline of PNG was significantly higher than the upper crustal abundance of chromium, at 92 ppm [31], and the chromium geochemical baselines of other continents and countries (Table 3).

Table 3.
Comparison of chromium baselines between PNG and other continents/countries.
4.2. Spatial Distribution of Chromium in Different Tectonic Units
The statistical parameters of the chromium values in the stream sediments of seven tectonic units are presented in Table 4, while Figure 4 shows their statistical distributions in the form of boxplots. The median chromium values of stream sediments samples were ranked as follows: Aure Fold Belt (299 ppm) > Eastern Papuan Composite Terrane (197 ppm) > Eastern Fold Belt (196 ppm) > New Guinea Thrust Belt (187 ppm) > Papuan Fold Belt (179 ppm) > Finisterre Terrane (165 ppm) > Melanesian Arc (42 ppm). Notably, the stream sediments of the Melanesian Arc were depleted of chromium relative to the PNG baseline.

Table 4.
The statistical parameters of the chromium concentration (ppm) of stream sediments in different tectonic units based on the national-scale geochemical mapping project data. NGO: New Guinea Orogen.
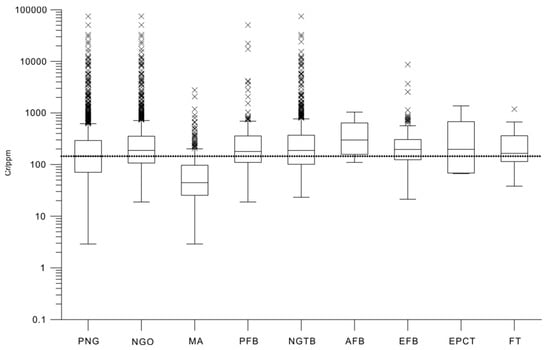
Figure 4.
Boxplots showing the variations of chromium values in stream sediments from different tectonic units.
5. Discussion
5.1. Chromium Geochemical Distribution Associated with Geological Background
Chromium belongs to the iron element group. In nature, chromium is mainly combined with Fe2O3 and mineralized in the form of chromite. Since the ion radius of Cr3+ is similar to that of Al3+ and Fe3+ (6.4 nm, 5.7 nm, and 6.7 nm), there can be extensive isomorphism between them. Mn, Mg, Ni, Co, and Zn can be replaced as Cr in the same way [36]. For this reason, chromium is mainly distributed in mafic–ultramafic rocks.
The covers of PNG are mainly composed of Mesozoic–Cenozoic strata, volcanic rocks, and intrusive rocks. The subduction of the Pacific Plate to the Indo-Australian plate resulted in a large number of residual oceanic crusts, mainly ophiolitic complexes splicing on the continental crust [10,26,37,38]. The noticeable high chromium baseline can be attributed to the widely distributed mafic and ultramafic rocks since the Cretaceous period (Figure 1), and the high chromium concentrations (>2630 ppm, dark red colors) are closely associated with the April ophiolite, the Marum ophiolite, and the Papua ultramafic belt (Figure 1 and Figure 2).
The chromium geochemical baseline of the New Guinea Orogen is higher than that of PNG. Compared with the New Guinea Orogen, there is significant chromium depletion in the Melanesian Arc, which may be due to the widespread exposure of intermediate magmatite and sedimentary strata and the lack of mafic–ultramafic magmatic rock in the island arc (Table 4 and Figure 2). The ophiolitic complexes mostly outcropped in the New Guinea Orogen, such as the April ophiolite and the Marum ophiolite in the New Guinea Thrust Belt, the Papua ultramafic belt in the Eastern Papuan Composite Terrane, the Mount Turu ophiolite and the Neogene mafic intrusive rocks in the Bewani–Torricelli Terrane, and the Normanby Island ophiolite in the Papuan Islands [37,39], resulting in higher chromium concentrations than other rocks in PNG (nine samples of the Marum ophiolite ranged from 221 to 26,800 ppm, with a mean value of 7270 ppm (unpublished author data). The significant high chromium baseline of the Aure Fold Belt (299 ppm) may be due to the 12 samples, which were distributed on the Neogene mafic intrusive rocks and Neogene andesitic–basaltic volcanic rocks.
5.2. Significance for Further Prospecting
Geologists have repeatedly discussed that national-scale geochemical mapping can effectively delineate geochemical anomaly areas related to mineralization [15,40,41]. The anomaly areas with element contents >85% of the samples are worth considering in ore prospecting [42,43,44]. With 85% (550 ppm) as the baseline of the outer anomaly zone, four chromium geochemical anomalies were delineated in the sampling area. With 95% (1421 ppm) as the baseline of the middle anomaly zone, eleven high geochemical anomalies were delineated. These anomalies indicate the direction for future chromium ore exploration (Figure 5 and Table 5).
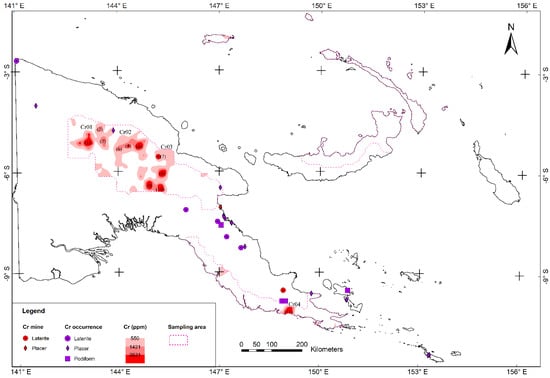
Figure 5.
Chromium geochemical anomaly map of PNG.

Table 5.
Chromium geochemical anomalies of PNG.
The Cr01 geochemical anomaly is located in the middle of the New Guinea Thrust Belt, covering an area of 6936 km2, including 22 samples with chromium contents greater than 550 ppm. The outcropping rocks are mainly Cretaceous April ophiolite; Neogene intermediate intrusive rocks, including diorite and gabbro; and Neogene intermediate–mafic volcanics. There are three high geochemical anomalies. No. 1 is associated with the Cretaceous serpentinized peridotite (April ophiolite). The highest chromium content in the sample was 32,800 ppm. This high anomaly has the potential to develop laterite and podiform mineralization. No. 2 is associated with the middle Miocene basaltic and andesitic volcanics. The highest chromium content was 11,400 ppm. It has the potential to develop placer mineralization. No. 3 is associated with the middle to late Miocene Karawari Batholith, mainly composed of diorite. The highest chromium content was 15,300 ppm. It also has the potential to develop placer mineralization, and Lower Yuat placer mineralization is developed near this area.
The Cr02 geochemical anomaly is located in the middle, east of the New Guinea Thrust Belt, covering an area of 7668 km2, including 38 samples with chromium contents greater than 550 ppm. The outcropping rocks are mainly Triassic undivided volcanics, Cretaceous–Paleogene undivided volcanics, Neogene mafic intrusive rocks, and Neogene–Quaternary undivided volcanics. There are three high geochemical anomalies. The highest chromium content of the stream sediment samples in high anomaly No. 4 was 30,300 ppm. It is related to the middle Miocene Oipo intrusives, which are mainly composed of gabbro and granodiorite. Both No. 5, with a chromium content of 24,000 ppm, and No. 6, with a chromium content of 9560 ppm, are related to the upper Triassic basic to intermediate Kana Volcanics. High anomalies 4, 5, and 6 are potential areas of placer mineralization.
The Cr03 geochemical anomaly is located in the east of the New Guinea Thrust Belt and the northeast of the Papuan Fold Belt, covering an area of 8089 km2, including 25 samples with chromium contents greater than 550 ppm. The outcropping rocks are mainly Cretaceous Marum ophiolite, Neogene undivided volcanics, and Neogene–Quaternary undivided volcanics. There are four high geochemical anomalies in this area. No. 7, with a chromium content of 10,100 ppm, is associated with Cretaceous serpentinized peridotite (Marum ophiolite). The Ramu laterite deposit is developed in this area, which has the potential to further discover laterite and podiform mineralization. No. 8 is associated with the middle Miocene Yaveufa Formation, which is mainly composed of andesitic and basaltic lava, tuff, and agglomerate. The highest chromium content was 74,600 ppm. No. 9, with a chromium content of 50,600 ppm, is associated with Pliocene to Holocene Suaru Volcanics and Karimui Volcanics, both of which are mainly basaltic and andesitic lava, agglomerate, and tuff. No. 10, with a chromium content of 22,100 ppm, is associated with the upper Miocene Michael Diorite and Pliocene to Holocene Crater Mountain Volcanics, mainly including andesitic and basaltic lava. High anomalies 8, 9, and 10 can be considered as placer mineralization prospecting areas.
The Cr04 geochemical anomaly is located in the east of the Eastern Fold Belt, covering an area of 1053 km2, including two samples with chromium contents greater than 550 ppm. The outcropping rocks are mainly Cretaceous–Paleogene undivided volcanics. No. 11 is the only high anomaly in this area and is associated with the upper Cretaceous to middle Eocene Kutu Volcanics, including basaltic lava, minor gabbro, and ultramafics, which host laterite and podiform mineralization potential.
5.3. Comprehensive Exploration and Exploitation of Laterite-Bearing Chromium Deposits
Numerous ophiolitic complexes led to the development of a large number of laterite-bearing chromium deposits in PNG [25]. The primary commodity of laterite deposits is nickel, and chromium is an associated commodity. The Ramu laterite deposit in high anomaly area 7, which produced 41.3 kilotons of nickel and 92.1 kilotons of chromite concentrate in 2018 [45], has proven that the comprehensive exploitation of nickel and chromium is feasible. The nickel contents of samples were also tested during the analysis work. With 95% (147 ppm) as the baseline for nickel high anomalies, we compiled a Cr-Ni integrated anomaly map (Figure 6). High nickel contents were found in high anomaly areas 1, 3, 4, 5, 6, 8, 10, and 11. Among them, areas 3, 4, 5, 6, 8, and 10 have no potential to form lateritic nickel chromium deposits due to the absence of mafic–ultramafic rock. However, areas 1 and 11 are potential laterite mineralization areas. Therefore, the comprehensive exploration of nickel and chromium is an effective method to improve the deposit economy and promote chromium’s exploitation when prospecting and forecasting in high anomaly areas 1 and 11.
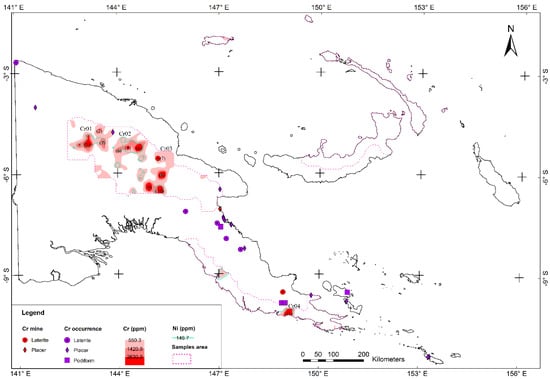
Figure 6.
Chromium–nickel integrated anomaly map of PNG.
6. Conclusions
- (1)
- The chromium concentrations of stream sediment samples ranged from 3 ppm to 74,600 ppm, with a median value of 145 ppm, which was higher than the upper crustal abundance of chromium and the chromium geochemical baselines of Europe, Australia, North America, and China.
- (2)
- The differences in chromium concentrations in different tectonic units were significant. The New Guinea Orogen (including PFB, NGTB, AFB, EFB, EPCT, and FT), widely distributed with mafic and ultramafic magmatic rocks, had a higher median chromium value than the Melanesian Arc.
- (3)
- The ophiolitic complexes, such as the April ophiolite, the Marum ophiolite, and the Papua ultramafic belt, were significantly correlated with the higher chromium concentration.
- (4)
- According to the geochemical characteristics of chromium, four anomalies and eleven high chromium anomalies were delineated. They are mainly distributed in the New Guinea Thrust Belt. Three high anomalies can potentially develop laterite and podiform chromium mineralization, and eight high anomalies can be used to discover placer chromium deposits.
- (5)
- The chromium–nickel integrated anomaly map shows that comprehensive exploration and exploitation of nickel and chromium can be carried out in high anomaly areas 1 and 11, with laterite mineralization potential.
Author Contributions
Writing—original draft preparation, Y.Z. (Yuhao Zhao); writing—review and editing, C.K. and T.W.; supervision, N.M. and Z.Y.; project administration, Y.Z. (Yiping Zhu); methodology, B.Z. and X.W. All authors have read and agreed to the published version of the manuscript.
Funding
This research was funded by the National Key Research and Development Program of China (2021YFC2901804) and the China Geological Survey Project (DD20221803, DD20160110, and 12120115067601).
Data Availability Statement
Data sharing is not applicable.
Acknowledgments
The national-scale geochemical mapping in PNG was jointly completed by the China Geological Survey and the Mineral Resources Authority of PNG, and all samples were analyzed by the Henan Province Rock & Mineral Testing Centre. We express our heartfelt thanks to all project participants.
Conflicts of Interest
The authors declare no conflict of interest.
References
- Mou, B.L. Element Geochemistry; Beijing University Press: Beijing, China, 1999; pp. 34–38. (In Chinese) [Google Scholar]
- Yan, T.T.; Wang, X.Q.; Liu, D.S.; Chi, Q.H.; Zhou, J.; Xu, S.F.; Zhang, B.M.; Nie, L.S.; Wang, W. Continental-scale spatial distribution of chromium (Cr) in China and its relationship with ultramafic-mafic rocks and ophiolitic chromite deposit. Appl. Geochem. 2021, 126, 104896. [Google Scholar] [CrossRef]
- Lv, P.R.; Gao, Y.W.; Zhang, Y.X.; Zhang, D.D. Kazakhstan’s Chromite Resource Endowment, Development, Import and Its Suggestions for Production Capacity Cooperation between China and Kazakhstan. Northwest. Geol. 2022, 55, 297–305, (In Chinese with English Abstract). [Google Scholar]
- National Research Council. Minerals, Critical Minerals, and the U.S. Economy; The National Academies Press: Washington, DC, USA, 2008; pp. 1–245.
- Pellegrini, M. Critical Raw Materials for the EU; European Commission Enterprise and Industry: Brussels, Belgium, 2014; pp. 11–85. [Google Scholar]
- Hatayama, H.; Tahara, K. Criticality assessment of metals for Japan’s resource strategy. Mater. Trans. 2015, 56, 229–235. [Google Scholar] [CrossRef]
- Schulte, R.F. Chromium, Mineral Commodity Summaries; U.S. Geological Survey: Washington, DC, USA, 2022; pp. 48–49.
- Zheng, M.G.; Yuan, X.M. Demand Forecasting of China’s Chrome Ore from 2020 to 2030 Based on Grey Neural Network. Resour. Dev. Mark. 2018, 34, 747–752. [Google Scholar]
- Kim, T.Y.; Gould, T. The Role of Critical Minerals in Clean Energy Transitions; International Energy Agency: Washington, DC, USA, 2021; pp. 70–71. [Google Scholar]
- Yao, Z.Y.; Zhao, Y.H.; Wang, T.G.; Zhu, Y.P.; Zhao, X.D.; Chen, G.; Song, X.X.; Liang, S.Y. The Geology, Mineral Resources and Mining Investment Envoronment of Pupua New Guinea; Geology Press: Beijing, China, 2018; pp. 12–75. (In Chinese) [Google Scholar]
- Williamson, A.; Hancock, G. The Geology and Mineral Potential of Papua New Guinea; Papua New Guinea Department of Mining: Port Moresby, Papua New Guinea, 2005; pp. 6–47.
- Sheppard, S.; Cranfield, L. Geological Framework and Mineralization of Papua New Guinea—An Update; Mineral Resources Authority: Port Moresby, Papua New Guinea, 2012; pp. 7–30.
- Holm, R.J.; Spandler, C.; Richards, S.W. Continental collision, orogenesis and arc magmatism of the Miocene Maramuni arc, Papua New Guinea. Gondwana Res. 2015, 28, 1117–1136. [Google Scholar] [CrossRef]
- Rogerson, R.; Hilyard, D.B.; Francis, G.; Finlayson, E. The foreland thrust belt of Papua New Guinea. Proc. Pac. Rim Congr. 1987, 87, 579–583. [Google Scholar]
- Wang, T.G.; Conrad, K.; Zhao, Y.H.; Nathan, M.; Yao, Z.Y.; Zhang, B.M.; Wang, X.Q.; Zhu, Y.P. National-scale distribution of Cobalt in Papua New Guinea and its significance for mineralization potential. J. Geochem. Explor. 2022, 239, 107013. [Google Scholar] [CrossRef]
- Dow, D.B. A Geological Synthesis of Papua New Guinea; Bureau of Mineral Resources, Geology and Geophysics: Port Moresby, Papua New Guinea, 1977; 41p.
- Pigram, C.J.; Davies, P.J.; Feary, D.A.; Symonds, P.A. Tectonic controls on carbonate platform evolution in southern Papua New Guinea: Passive margin to foreland basin. Geology 1989, 17, 199–202. [Google Scholar] [CrossRef]
- Dobmeier, C.J.; Poke, B. 1:100,000 Geological Map Publication Series of Papua New Guinea, Sheet 7887 Aiome; Mineral Resources Authority: Port Moresby, Papua New Guinea, 2012.
- Dobmeier, C.J.; Poke, B.; Wagner, B. 1:100,000 Geological Map Publication Series of Papua New Guinea, Sheet 7886 Minj; Mineral Resources Authority: Port Moresby, Papua New Guinea, 2012.
- Pigram, C.J.; Davies, H.L. Terranes and accretion history of the New Guinea orogen. BMR J. Aust. Geol. Geophys. 1987, 10, 193–211. [Google Scholar]
- Williamson, A.; Rogerson, R. Geology and Mineralisation of Misima Island; Geological Survey of Papua New Guinea: Port Moresby, Papua New Guinea, 1983; pp. 1–12.
- Hoeflaken, F.; Dobmeier, C.J. 1:100,000 Geological Map Publication Series of Papua New Guinea, Sheet 7688 Yimas; Mineral Resources Authority: Port Moresby, Papua New Guinea, 2012.
- Spieler, O.; Hoeflaken, F. 1:100000 Geological Map Publication Series of Papua New Guinea, Sheet 7488 Double; Mineral Resources Authority: Port Moresby, Papua New Guinea, 2012.
- Jaques, A.L. Petrology and petrogenesis of cumulate peridotites and gabbros from the Marum Ophiolite Complex, northern Papua New Guinea. J. Petrol. 1981, 22, 1–40. [Google Scholar] [CrossRef]
- Saroa, D. PNG Minerals 2011; Mineral Resources Authority: Port Moresby, Papua New Guinea, 2012.
- Yao, Z.Y.; Zhao, Y.H.; Wang, T.G.; Chen, G.; Zhu, Y.P.; Zhao, X.D. New progress of geology and mineral resources mapping in Oceania. Geol. Bull. China 2018, 37, 510–521, (In Chinese with English abstract). [Google Scholar]
- Wang, X.Q.; Zhang, B.M.; Zhang, Q. Technical Requirements of International Geochemical Mapping; China Geological Survey: Beijing, China, 2018; pp. 1–26. (In Chinese)
- Zhang, Q.; Bai, J.F.; Wang, Y. Analytical scheme and quality monitoring system for China Geochemical Baselines. Earth Sci. Front. 2012, 19, 33–42, (In Chinese with English abstract). [Google Scholar]
- Grunsky, E.C.; Drew, L.J.; Sutphin, D.M. Process recognition in multi-element soil and stream-sediment geochemical data. Appl. Geochem. 2009, 24, 1602–1616. [Google Scholar] [CrossRef]
- Reimann, C.; Arnoldussen, A.; Englmaier, P.; Filzmoser, P.; Finne, T.E.; Garrett, R.G.; Koller, F.; Nordgulen, Ø. Element concentrations and variations along a 120-km transect in southern Norway–Anthropogenic vs. geogenic vs. biogenic element sources and cycles. Appl. Geochem. 2007, 22, 851–871. [Google Scholar] [CrossRef]
- Rudnick, R.; Shan, G. Composition of the Continental Crust. In Treatise on Geochemistry; Holland, H.D., Turekian, K.K., Eds.; Elservier: Amsterdam, The Netherlands, 2014. [Google Scholar]
- Salminen, R.; Plant, J.; Reeder, S.; Salminen, R. Geochemical Atlas of Europe. Part 1, Background Information, Methodology and Maps, 526; Geological Survey of Finland Espoo: Helsinki, Finland, 2005.
- Reimann, C.; Caritat, P. Establishing geochemical background variation and threshold values for 59 elements in Australian surface soil. Total Environ. 2017, 578, 633–648. [Google Scholar] [CrossRef] [PubMed]
- Smith, D.B.; Cannon, W.F.; Woodruff, L.G.; Garrett, R.G.; Klassen, R.; Kilburn, J.E.; Horton, J.D.; King, H.D.; Goldhaber, M.B.; Morrison, J.M. Major and Trace-Element Concentrations in Soils from Two Continental-Scale Transects of the United States and Canada; U.S. Geological Survey: Washington, DC, USA, 2005.
- Liu, D.S.; Wang, X.Q. Geochemical Baselines of Chromium in Catchment Sediment/Soil in China. In Proceedings of the Annual Meeting of Chinese Geoscience Union, Beijing, China, 20–23 October 2014; p. 2809. (In Chinese). [Google Scholar]
- Liu, H.F.; Xu, Y.F.; Li, S.P. Grouping of 39 Elements and Element Geochemistry; Geology Press: Beijing, China, 2017; pp. 60–63. (In Chinese) [Google Scholar]
- Davies, H.L. The geology of New Guinea-the cordilleran margin of the Australian continent. Episodes 2012, 35, 87–102. [Google Scholar] [CrossRef]
- Wang, T.G.; Yao, Z.Y.; Huang, B.; Zhu, Y.P.; Zhao, X.D. Tectonic evolution and Resource potential of Papua New Guinea. East China Geol. 2014, 35, 130–135, (In Chinese with English abstract). [Google Scholar]
- Davies, H.L.; Jaques, A.L. Emplacement of ophiolite in Papua New Guinea. Geol. Soc. Spec. Publ. 1984, 13, 341–349. [Google Scholar] [CrossRef]
- Demetriades, A.; Birke, M.; Albanese, S.; Schoeters, I.; De Vivo, B.; Demetriades, A.; Birke, M.; Albanese, S.; Schoeters, I.; De Vivo, B. Continental, regional and local scale geochemical mapping. J. Geochem. Explor. 2015, 154, 1–5. [Google Scholar] [CrossRef]
- Demetriades, A.; Smith, D.B.; Wang, X.Q. General concepts of geochemical mapping at global, regional, and local scales for mineral exploration and environmental purposes. Geochim. Bras. 2019, 32, 136–179. [Google Scholar] [CrossRef]
- Wang, X.Q. Global Geochemical Baselines: Understanding the past and predicting the future. Earth Sci. Front. 2012, 19, 7–18, (In Chinese with English abstract). [Google Scholar]
- Wang, X.Q. China geochemical baselines: Sampling methodology. J. Geochem. Explor. 2015, 148, 25–39. [Google Scholar] [CrossRef]
- Wang, X.Q.; Zhou, J.; Xu, S.F.; Chi, Q.H.; Nie, L.S.; Zhang, B.M.; Yao, W.S.; Wang, W.; Liu, H.L.; Liu, D.S.; et al. China soil geochemical baselines network: Data characteristics. Geol. China 2016, 43, 1469–1480, (In Chinese with English abstract). [Google Scholar]
- Deng, Q.; Ingham, P.D.; Nice, R.; Brett, A. Ramu Nickel Cobalt Project-NI 43-101 Technical Report; Behre Dolbear Australia Pty Limited: Sydney, Australia, 2019; pp. 59–72. [Google Scholar]
Disclaimer/Publisher’s Note: The statements, opinions and data contained in all publications are solely those of the individual author(s) and contributor(s) and not of MDPI and/or the editor(s). MDPI and/or the editor(s) disclaim responsibility for any injury to people or property resulting from any ideas, methods, instructions or products referred to in the content. |
© 2023 by the authors. Licensee MDPI, Basel, Switzerland. This article is an open access article distributed under the terms and conditions of the Creative Commons Attribution (CC BY) license (https://creativecommons.org/licenses/by/4.0/).