Abstract
Only grams or kilograms of valuable resources are extracted for each tonne of ore processed, generating immense amounts of tailings. Returning tailings-containment dams to their equivalent pre-disturbance landscape state is many stakeholders’ acceptable management strategy. The depositing of thickened fluid fine tailings (FFT), which the industry has relied upon to develop geotechnically stable dry landscapes, has not materialised due to the low hydraulic conductivity of such placements. The addition of sand to thickened FFT is proposed to accelerate the consolidation of thickened FFT in a co-disposal scheme, and this study evaluates its impact. In the continuum of solid wastes from mining operations, sand is the next-larger-sized grade of solids after “fine” that is produced in high proportions. Blends of highly-plastic FFT and fine-grade sand tailings at varying sand-to-fine ratio (SFR) values were tested. Sand lowered the liquid limit but did not significantly affect the plastic limit of FFT. The changes in liquid and plastic limits for SFR ≥ 1 blends were under 5% of water content. The maximum unit weight for the co-disposal mixes was obtained at SFR 3. Despite increases in unit weights, hydraulic conductivity increased with increasing SFR, while the trend for compression rates was in the reverse order. Void ratio—effective pressure—hydraulic conductivity power law relationships at varying SFR were obtained from the consolidation measurements. The constitutive constants of these relationships were used to model settlement of 30 m deep pits over a 25-year period. For all the deposits studied, the dewatering converged to a maximum solids content characteristic of each SFR in the order 74, 85, 88, and 94% (w/w) for thickened FFT and SFRs 1, 2, and 3, respectively. The numerically calculated average solid contents of the deep-pit placements grew closer with increasing SFR becoming 59, 77, 82, and 86% (w/w), respectively. Balancing the consolidation-rate gains and the land footprint required for storage with SFR increase, the optimal composition for co-disposal for this material and similar tailings is SFR 1.
1. Introduction
Since only grams or kilograms of the valuables are extracted for each tonne of ore processed, an immense amount of solids waste is discharged as solids slurry. Upon discharge, the tailings’ coarse solids settle quickly, while the fines remain in a fluid state and need to be contained in dikes or dams. Tailings dams are therefore an unavoidable part of the modern economy, with no option available other than to manage them sustainably.
Tailings accumulation from current and past production of minerals and metals occupies land that was, in the main, forested area and likely a habitat for wildlife, too. In addition, drainage and leaching of process-affected tailings fluid to surface or groundwater bring unacceptable health and environmental hazards. For the mining companies, the dams are a liability and pose major economic concerns, as they require perpetual observation, construction and maintenance to avoid structural failures. Moreover, permits from regulators to develop a mine include appraisal of the mine-tailings restoration program that will be implemented by the operator at end of mine life or earlier. In short, it is imperative on societal, environmental, regulatory, and economic grounds for mining operators to address the multi-pronged issues related to fluid fine tailings (FFT) dams.
Reducing the water content—dewatering (thickening)—is a necessary step for the transformation of FFT ponds into landforms [1,2]. Commercial technologies for dewatering FFT start with the addition of flocculants and coagulants, which gather the suspended fine particles to form larger and denser aggregates, making them more amenable for subsequent dewatering processes [3]. In practice, the thickened FFT solids content relative to the total wet mass often converges to about 60% solid (w/w). Investigation of the evolution of such thickened FFT discharged into a dedicated storage deep-pit to consolidate over decades or years under its own weight has been reported by Demoz [4]. That study focussed upon the two critical geotechnical properties for a stable dryland: load-bearing capacity, as exhibited by shear strength, and rate of consolidation of the thickened FFT. Direct shear measurements of thickened FFT for normal stresses up to 1 MPa showed a linear Mohr–Coulomb failure envelope plot with a very small cohesive intercept and small internal friction angle. A deposit needs to be firm-to-stiff at a minimum 50 kPa shear strength for it to support small landscaping equipment [5,6]. The normal stress attained by self-weight sufficient to generate the minimum shear strength amounted to a 23.8 m thick deposit based on the empirical Mohr–Coulomb expression reported [4]. The implication is that deposits created using thickened FFT will remain liquifiable and unable to support reclamation machinery; this often described as being non-trafficable deposits.
It was also found that the dewatered FFT obtained by separation using scroll decanter centrifuge (often called cake) had hydraulic conductivity values below 1 × 10⁻⁹ m/s, starting from 10 kPa load, and in line with that of silty-clay fine tailings. The void ratio–effective stress–hydraulic conductivity power-law curves’ constitutive constants were used as model inputs to predict tailings settlement using a finite-strain 1D model software [4]. The model’s output indicated that consolidation by self-weight of thickened FFT deposit, even after two hundred years of consolidation, will still retain a high moisture content of >43%, owing to the low hydraulic conductivity of the thickened FFT. In this follow-up work, co-disposal using available coarse tailings from the same mining operation is studied as the clear route to increase the hydraulic conductivity. Co-disposal in this context refers to the final step of disposing an already-thickened FFT with coarse tailings blended at a prescribed sand-to-fine ratio (SFR). In geotechnical engineering, fines are the silt- and clay-sized materials. The most-accepted definition of fines encompasses all particles < 75 μm, and the SFR represents the ratio of the mass of the particles > 75 μm to the mass of particles in the mixture that are fines, i.e., <75 μm. Blending coarse tailings into an already-thickened FFT avoids the interference of the coarse tailings in the dewatering treatment process and reduces the amount of material being handled, too. Conducting the thickening and blending steps sequentially is more reliable in the co-disposal scheme, as it simply combines commonly used operations. Many studies have proven that mixing coarse particles with fines increases the consolidation rate by increasing permeability, while the absolute compression may not be that significant [7,8]. Unlike waste rock mixtures, there is very little known regarding the design of fine sand–FFT mixture disposal [9]. The difference from waste rock is that the fine sand used consists of particles that are less than 0.25 mm in size, while results available for waste rock usually derive from samples consisting of particles obtained after scalping with wider mesh screens such as 10 cm wide sieves [8]. At an equivalent SFR, the fines–sand co-disposal mixture may show different engineering properties than the waste rock–fine mixture because of the large relative size difference between the two coarse materials. Inferences on the effect of relative size differences of the coarse materials in co-disposal operations can be drawn, but this question is not covered specifically in this study. The current study is an attempt to understand the influence of finely sized sand particles on the consolidation characteristics of thickened FFT.
Whether fine sand particles affect the consolidation rate of FFT has not been reported. The FFT–sand mix study is on a continuum in the utilization of different tailing solids in co-disposal schemes, as has often been examined for waste rock [8,9,10,11]. The question of which composition of sand as a mixture shortens the reclamation readiness to an acceptable range of time has not been studied, and it is the principal objective of this work.
The approach of the work described in this paper is to determine (i) the compression properties of varying SFR FFT–sand composite deposits; (ii) conduct measurements on the hydraulic conductivity of varying FFT–sand composites; and (iii) utilize constitutive constants of effective stress–void ratio–hydraulic conductivity relations obtained from these empirical measurements to predict, using numerical modelling, a co-disposal mix ratio that can become reclamation-ready 25 years after mine closure. These constants cannot be obtained using first principles. The focus of our studies is on creating geotechnically stable deposits. Stable deposits allow capping and reclamation cover work so that the deposits can ultimately become ecosystems, including vegetation, equivalent to their pre-disturbance landforms [12]. This portion of the project is limited to understanding the impact of a widely available tailings material, fine sand, on the consolidation of FFT–sand mixtures.
2. Methods and Materials
2.1. Materials
The fine tailings for this study were obtained from the bitumen extraction process of oil-sands surface mining operations in Northern Alberta. Hot water, sometimes with a caustic soda addition, is being used to extract bitumen from surface-mined oil-sand ore. The bitumen content of mined ores deemed viable for oil production ranges from 9 to 13% (w/w). The oil-sand deposit of North Alberta has an average bitumen content of about 9.7% (w/w). The remainder of the ore is mineral solids (80 to 85 wt%), which are discharged in slurry form following extraction and must be disposed of [13,14]. These post-extraction solid particles range in size from 2 mm to 2 μm and even smaller. Generally, clay minerals make up about half of the fines. The FFT stream that ends up in the containment dams is composed primarily of fines, with an SFR of <<1 [15]. After a few years of settlement, the FFT densifies to a thicker persistent suspension of less than 40% (w/w) solids commonly referred to as mature fine tailings (MFT). For every barrel of ore mined, about 1.4 barrels of non-settling suspension is generated.
The coarse tailings were received dry, while the fine tailings were received as a slurry of 36 mass% solids. The FFT was coagulated with gypsum and flocculated using a commercial polyacrylamide polymer to produce the thickened fine tailings (cake) samples using scroll decanter centrifuge (SDC) separation. Details of the continuous SDC solid/liquid separation process used to produce the thickened test FFT are found in Demoz [16].
The particle-size distributions (PSD) were measured using a Mastersizer™ 2000 (Malvern Instruments, UK) coupled with a Hydro 2000MU wet-sample dispersion unit which enables continuous stirring and circulation of the suspension while passing through the measurement cell of the instrument. The samples were also sonicated in an ultrasonic bath to increase the dispersion in the suspension of the particles. The PSD were determined based on the scattering of blue and red laser lights. Already, wet-sieve analyses of the PSD of both streams of tailings (i.e., sand and fine tailings) had shown that all of the particles were less than 2 mm in diameter and within the measurement range of the laser diffraction instrument, as shown in Figure 1c below. Figure 1a,b show photographs of the fine sand and rolled thickened FFT (cake). The sand particles were round. The specific gravity of the sand particles was 2.55, while the FFT was 2.40.
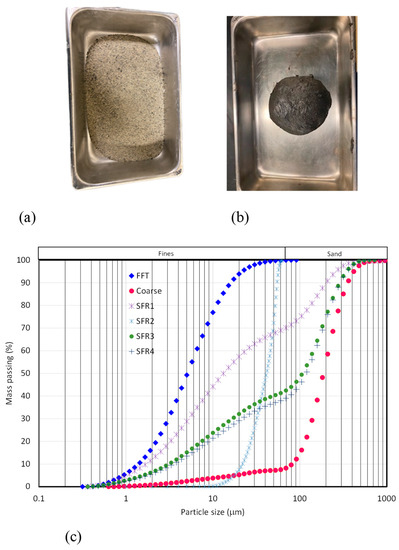
Figure 1.
Pictures and particle-size distribution of tailings: (a) photograph of coarse tailings; (b) photograph of a ball of thickened FFT; (c) PSD of FFT, sand, and sample prepared using the materials at varying SFRs.
The FFT that was thickened comprised only fine-sized particles (Figure 1). The coarse tailings particles were all <0.425 mm and were classified as fine sand. The particles tested were more than 200 times smaller than sample holders used, and size effects in the measurements were not expected. A favourable sample-container-to-particle-size ratio according to ASTM (2011a) helped eliminate preferential lateral hydraulic leakage [17]. In Table 1, the gradation, at varying SFRs, of the samples prepared is listed. The gradation indicated that prepared samples had correspondingly weighted representations of the fine and coarse solids in proportion to the SFR, as is easily observable with the PSD of SFR 1. Other than the coarse tailings, all prepared mixtures displayed a uniformity coefficient Cu, listed in Table 1, of >5, which indicated a discontinuity in the gradation of the rest of the test samples.

Table 1.
Cut sizes of varying SFR samples tested.
2.2. Solids Minerology
The FFT was spiked with a known quantity (~20%, w/w) of highly crystalline alumina/corundum (α-Al2O3) powder as an internal standard, prior to being reduced to the optimum grain-size range for quantitative X-ray analysis (<10 μm) by grinding under ethanol in a vibratory McCrone XRD Mill (Retsch GmbH, Germany) for 15 min. Continuous-scan X-ray powder-diffraction data were collected over a range of 4–80° (2θ) with CoKα radiation on a Bruker D8 Advance Bragg-Brentano diffractometer equipped with an Fe filter foil, 0.6 mm (0.3°) divergence slit, 4.0° incident- and diffracted-beam Soller slits and a LynxEye-XE detector. The long fine-focus Co X-ray tube was operated at 35 kV and 40 mA, using a take-off angle of 6°. The diffraction angle of the sample and prominent characteristic peaks of minerals are shown in Figure 2.
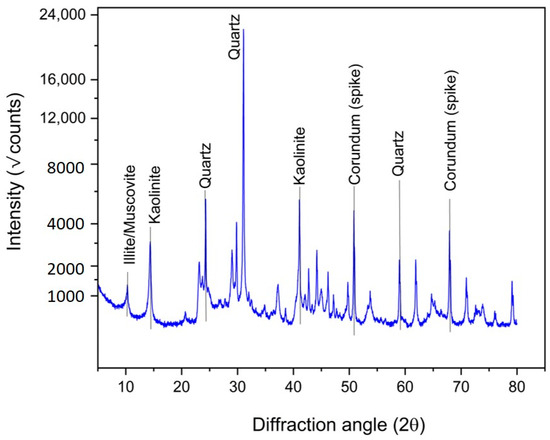
Figure 2.
XRD spectra of FFT indicating the major clay minerals present.
The X-ray diffractogram was analysed using the International Centre for Diffraction database PDF-4 and Search-Match Eva 4.2 (Bruker AXS). X-ray powder-diffraction data of the sample were refined with the Rietveld program Topas 4.2 (Bruker AXS). The results of the mass normalized quantitative phase analysis by Rietveld refinement using the internal standard method are given in Table 2. The Rietveld method yields relative amounts of crystalline materials within a sample. The difference between the scaled total of the crystalline phases and 100% is designated as “amorphous” content.
Table 2.
Rietveld-method quantitative phase analysis (wt.%) of original FFT.
The sample has broad peaks that correspond to kaolinite, as well as what is likely an illite–smectite mixed layer. To overcome disorder in the kaolinite and illite–smectite, empirical models for poorly crystalline clays have been calibrated against reference clays from the Source Clays Project using the PONKCS method [18]. The FFT sample was dominated by three minerals, specifically, illite-smectite, kaolinite, and quartz, which collectively made up ~80% of the solids. Aside from the 13% (w/w) of amorphous solids, the other substances were all <2% (w/w). XRD analyses results indicated that the total clay content of the FFT sample was 53% (w/w). Methylene blue-spot test titration to determine the clay content of the as-received FFT slurry gave a clay content of 58% (w/w) [4]. XRD quantitative analyses of the FFT are tabulated to aid comparison with other mine tailings, since the consolidation rates are dependent on fines composition. Amongst the major minerals of this FFT, the order of consolidation, in decreasing order, is quartz > kaolinite > illite–smectite.
2.3. Hydraulic Conductivity
Hydraulic conductivity was measured according to ASTM D2435-11 [19]. Schematics of the large-strain consolidation (LSC) cell used for the measurement are shown in Figure 3. The fluid flowed from bottom to top, and the head difference was measured with a ruler. The head difference was also checked using the pore-pressure transducers at the bottom of the cell. The difference in pore pressures with and without the permeability tube connected to the flow-inlet port is expected to equal the hydraulic head difference. A small constant head provided a low-pressure gradient for permeability measurements. The constant head permeability measurement method was selected because it allows small hydraulic head difference tests. The differences in hydraulic head for the constant head test were kept small to avoid seepage-induced consolidation [20]. The FFT contained a significant amount of clay minerals, and its hydraulic conductivity was naturally very low. For this reason, the outflow fluid flow rates were obtained from the volume drained out of a narrow-permeability glass tube which also served as the hydraulic head (see Figure 3). The saturated hydraulic conductivity, kc, is related to the flow rate as follows [21,22,23].
where “a” (m2) is the internal area of permeability tube (head), Δl (m) is the difference in the water length due to outflow from the permeability tube, L (m) is the sample height, A (m2) is the sample cross-sectional area, h (m) is the constant head height and t (s) is the flow time. All experiments were performed at room temperature (~21 °C).
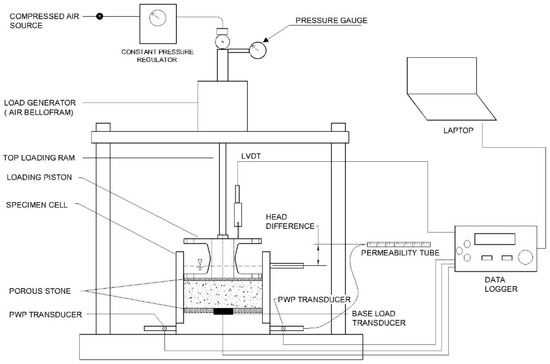
Figure 3.
Schematics of the large strain cell for hydraulic conductivity measurements.
The samples were mixed with an addition of just enough water to allow blending of the FFT and the coarse sample. Too much water led to segregation of the coarse particles within the tested specimen, resulting in inhomogeneity. The tested specimen was allowed to fully saturate by capping the samples with water and letting some drain through the bottom porous stone. kc was determined after the completion of the consolidation step, which was evident from a lack of change in the sample’s vertical height.
2.4. Coefficient of Commpressibility
To understand the pressure and volume change behaviour of FFT–sand mixtures, one-dimensional consolidation tests were carried using a Humboldt E5706™ direct shear instrument (Humboldt Mfg. Co., Elgin, IL, USA) operated (set up) as an oedometer. The load was increased sequentially, following ASTM D2435 [19,22]. Monitoring the linear variable distance transducer (LVDT) and controlling the axial load applied on the samples were both performed by a computer using Next™ application software (Humboldt Mfg. Co., Elgin, IL, USA).
The sample stainless-steel cell used was 100 mm in diameter and the initial sample thicknesses were always >25 mm. Deionized water (DI) was added in the sample carriage to keep samples fully saturated throughout the test periods. Periodically, DI was squirted to cover the edges of the loading pad to ensure the top porous stone was capped with water too.
While the SFR of each sample could be prepared accurately based on the weight proportions of the thickened FFT and sand, their moisture contents were established by letting them stabilize while inundated in water over at least two days, with seating loads from the stainless-steel loading pad and the porous stone on top. The seating load pressure amounted to 0.64 kPa. All compression loads were maintained constant for at least 30 h between increases in subsequent steps.
2.5. Attergerg Limits of FFT–Sand Composites
The soil-thread method, in accordance with ASTM Standard D4318-10, was used to obtain the plastic limits of the deposits [24]. The ASTM cone-penetration method, ASTM D3441-16, was followed to measure the liquid limit [25]. The ASTM D3441-16 method requires that oversized particles >0.42 mm be removed (sieve No. 40) prior to measurement. The sieving step was found unnecessary, as the largest class of particles present were fine sand (<0.425 mm).
The FFT sample was high-plasticity clay, while that of the coarse tailings was fine sand. Increasing the SFR reduced the plasticity index (window), but without much of a change in the plastic limits of the samples. The sand’s effect in this case was to increase the viscous tendency of the mixture.
3. Results and Discussion
Permeability is the dominant parameter in the design and implementation of waste-disposal facilities. FFT is associated with low shear strength and low achievable density, neither of which are favourable for creating dryland. Many studies have proven that mixing coarse particles with fines increases consolidation rate by increasing permeability and reducing absolute compression [7,8]. Unlike the often-studied and used waste rock tailings co-disposal, there is very little known regarding the design of sand–FFT co-disposal. Gravel and waste rock are valuable as construction materials in and around the mine, and sand additives are studied in this work as alternatives to conserve them. The consolidation properties of the FFT and sand mixtures at varying ratios were examined by measuring two intertwined properties of the deposit, hydraulic conductivity, and compression. Hydraulic conductivity was measured using LSC, and the compression properties were obtained using an oedometer setup. LSC measurements alone can yield the results that can be obtained using oedometer measurements. However, the LSC setup has many parts that are sources of error in the accurate measurement of sample settlements. An oedometer setup was relied upon for compression property measurements in this work.
After completion of consolidation at each load-step, the cake’s permeability was measured under load using the constant head method [26]. Figure 4 shows the hydraulic conductivity of the FFT–sand mix up to SFR 4. FFT and SFR 1 displayed wide void-ratio decreases due to consolidation from 2 to 0.6 and 1 to 0.4, respectively. The hydraulic conductivities obtained showed the expected power-law correlation in void-ratio for FFT by itself and the SFR 1 mix. The FFT–sand mix of SFR compositions ≥ 2 showed narrow void-ratio changes with applied pressure. For SFR ≥ 2 samples, we opted to present the mean hydraulic conductivity and the range of void-ratio change commensurate with the uncertainty in kc and the ensuing curve fit errors (please see Figure 5).
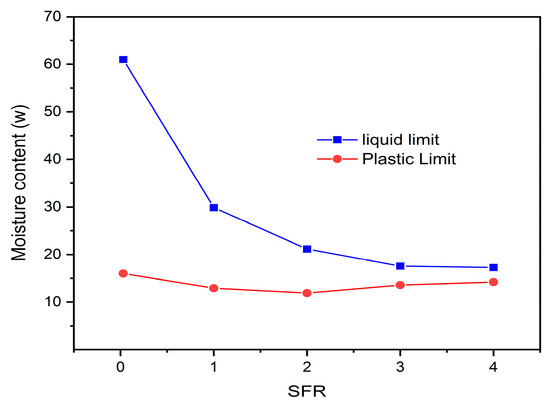
Figure 4.
Atterberg limits of FFT–sand formulations.
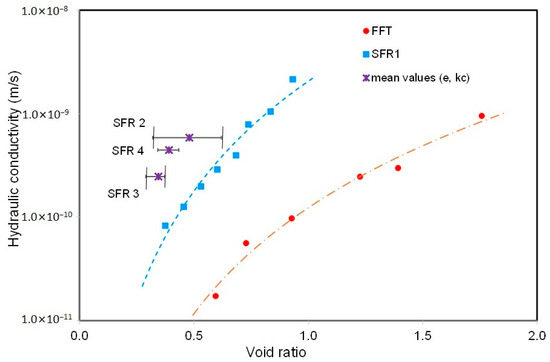
Figure 5.
Permeability of cake dependence on void ratio. Void-ratio range of samples is shown in error bar format.
Sand-containing samples gave higher kc than did FFT. The kc increased with increases in SFR despite the corresponding increase in the unit weight of samples. FFT and SFR 1 samples showed the characteristic kc–void ratio power-law dependence curve. However, SFRs 2, 3, and 4 had such a small void-ratio change that, for convenience, their characteristics are compared using the mean kc and mean void ratios, as presented in Figure 5. The low and high void-ratio ranges of the samples are presented in horizontal error bar format. The results show that the higher the SFR, the narrower is the range of the sample void-ratio change. In comparison to SFRs 3 and 4, the void ratio of SFR 2 showed a wider void-ratio change and had higher mean void ratio. It is because of its higher void ratio that the kc of SFR 2 appeared to be higher than those of the samples that had more sand in them. At the same pressures, kc was consistently higher with increases in SFR.
Figure 6 shows that the saturated void ratio of the samples decreased from SFR 1 to SFR 7. The samples as prepared (at the start of the compression test) had lower void ratios with increases in SFR. Fines and, particularly, clay minerals have very large specific surface areas and are known for their high degree of affinity for water. The decrease in void ratio with SFR can be attributed in part to the decrease in the samples’ fines content. The porosity along sand particles is higher than that within the assembly of fine particles. The other possibility in which fines would affect the unit weight of the samples is that of the fines occupying the pores between the sand particles, lowering the void ratios of samples as presented using the compression measurements (please see Figure 6). Both kc (Figure 5) and void ratio (Figure 6) indicate that for SFR > 3, both kc and void-ratio properties were simply dominated by the coarse particles. The small gradient of void ratio with effective pressure lines also meant that beyond SFR 3, the pressure was carried mainly by the skeleton of coarse particles which were in contact with each other and showed very minimal compression other than rearrangement. The optimal mix ratio of FFT based on unit weight gain and hydraulic conductivity improvement could be deduced to be SFR 3. Practically, the optimum SFR should be concluded after also considering the shear strength for load-bearing capacity.
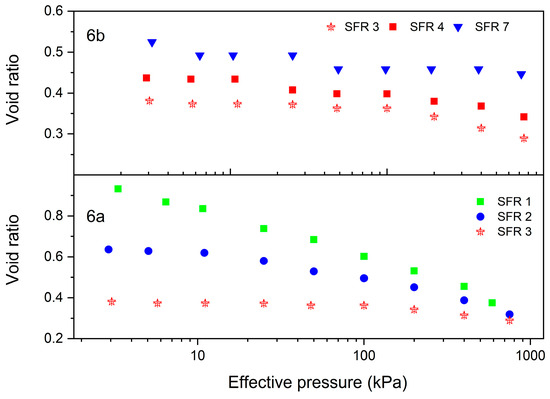
Figure 6.
Void-ratio variation with effective stress obtained from LSC data. The SFR 3 void ratio is plotted in both (6a) and (6b) to show the inflection of trends.
Coarse particles increase the compression rate, although not necessarily the absolute compression of the sample. Cessation of vertical deformation at any of the loads indicated completeness of consolidation. The compression rate was calculated from the settlement—time plots, similar to that shown for FFT, which had the largest strain changes (Figure 7).
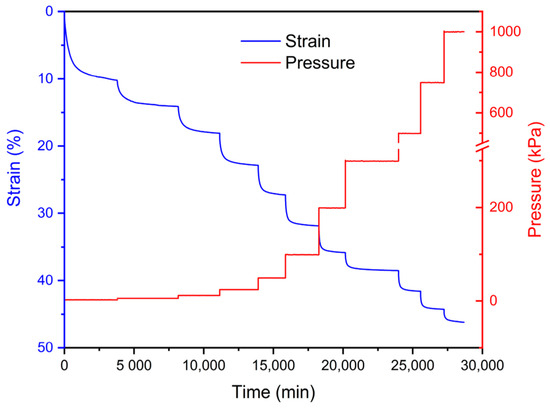
Figure 7.
Vertical strain and effective pressure applied during FFT compression test.
Void ratios were calculated using the sample heights and one known void ratio according to Equation (2). The height after completion of the oedometer test and the moisture content of the entire sample obtained from oven drying were used as accurate reference points to calculate the void ratios (or heights) of the preceding loads.
where ΔH = change in the height of the sample due to pressure increment, Hi = sample height at the sample void ratio of ei [27,28]. The maximum vertical deformation for each load was <10% axial strain, and the cumulative vertical deformation over the entire test (1 MPa normal stress) amounted to 46% axial strain for the FFT sample shown in Figure 7. The total strains from the compression data for SFR 1 to 4, respectively, were 30.5, 19.9, 13.1, and 9.1 percent (see Figure 8).
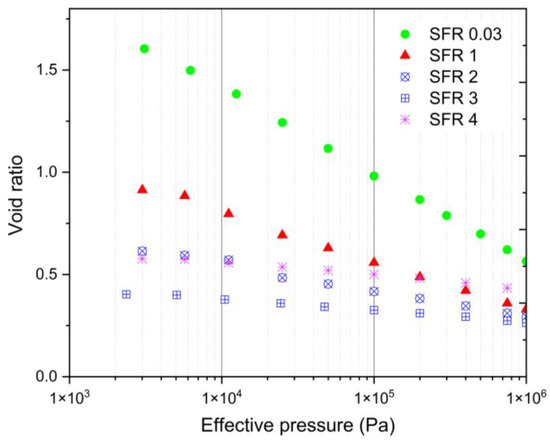
Figure 8.
Volume compressibility from oedometer test.
Three distinct regions may be observed in the semilogarithmic compressibility plot of samples in general [27,29,30]. The compression curves of the FFT–sand mix samples shown in Figure 8 exhibited neither the initial over-consolidated horizontal portion nor the post-primary-compression curve. It is natural for under-consolidated freshly produced material to follow a linear compression line [26]. The secondary compression stage was also not reached at the highest pressures applied.
The relationships between void ratio and effective stress for highly compressible materials and soils are often expressed by a power function [31,32] as given in Equation (3). The coefficient and power law constants of the empirical curve fit for the varying SFR are plotted in Figure 9. The Figure shows the inverse relationship between compression rate and absolute compression with SFR. Table 3 gives the e–σ′ power fit relation with a best least-squares fit correlation factor > 0.94 for all.
where σ′ is the effective pressure in Pa. The experimental compression indices, as well as the index based on Terzaghi’s proposed relationship between Cc and liquid limit, Cc = 0.009 × (WL − 10) where WL is the liquid limit are also included in Table 3 [27]. Experimental and calculated Cc for FFT were in agreement with each other. The calculated Cc values for the other mixed samples are less than <0.2. Although the empirical and calculated Cc values of these FFT–sand mixes are numerically close, they fall outside the range reported for sandy clays or sands, which are in the range from 0.2 to 0.4 [23].
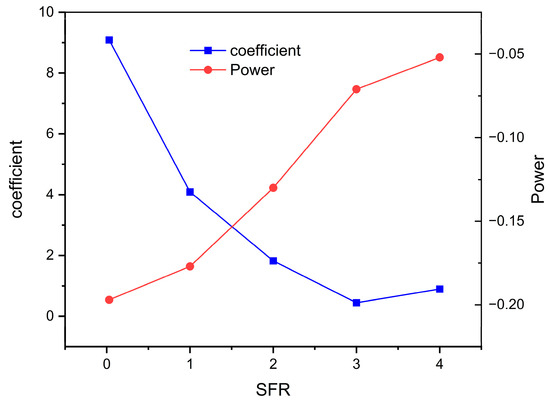
Figure 9.
Power-law fit constants of the volume compressibility curve for FFT–sand mixes.
Table 3.
Constitutive constants of e–s′–kc relations of thickened tailings–fine sand mixes used in the 1D finite-strain consolidation modelling.
The compressibility is the resistance offered by the soil to the deformation (volume change) during consolidation. The compression index, Cc, decreased with increasing SFR, and this means that the coefficient of volume change also showed a similarly decreasing trend with increases in SFR. Since the FFT–sand mixtures had lower void ratios with increases in SFR to begin with, the reduction in void ratio will also occur in a shorter time span and lower absolute compression, which is a behaviour associated with improved consolidation interactions of tailings deposits.
The coefficient of consolidation (Cv) is essentially an indicator of the rate of consolidation of a soil sample and is dependent on the rate at which water can be expelled out of the compacted sample at a given load. When both the hydraulic conductivity and volume compressibility are measured for the sample itself, Equation (4) is the most reliable option to determine Cv [23,27,28].
where the coefficient of compressibility is determined by av = de/dσ′; γw is the unit weight of water (9.81 kN/m3). In this study, both the LSC data and the oedometer results showed that SFR 3 gave the highest-density deposit. The LSC (Figure 4 and Figure 5) results indicate that the kc for SFR 3 can reasonably be represented by the mean value, owing to the narrow void-ratio change and the level of uncertainty with kc measurements. kc of FFT as a function of void ratio can be calculated from its constitutive relation, as reported by Demoz [4]. The ratio of the consolidation rates of SFR 3 to FFT at the mean void ratio of SFR 3 is 4862:1. This study therefore demonstrates that co-disposal with sand can address the problem of the inordinately slow consolidation rate of FFT. Although the consolidation rates were not specifically reported, the significant effects of coarse tailings on hydraulic conductivity were emphasized by Yuan et al. [7].
Numerical 1D modelling of the settlement of thickened material, specifically, the scroll-decanter-centrifuge-separated FFT placed in a dedicated discharge site 30 m in depth, showed that such a deposit would not become reclamation-ready in a time period that would be practical [4]. Mixtures containing sand exhibit higher consolidation rates and lower compression indices. The settlements of FFT–sand mix up to SFR 3 are calculated using a finite-strain settlement consolidation modelling software called FSConsol™ to evaluate the influence of fine sand. FSConsol is based on the finite-strain settlement solution given by Gibson et al. and is widely used by the industry [33,34,35]. The same operating (disposal) conditions as those for the thickened FFT is used in the modelling so that the results can be compared directly. A 30 m deep-pit with a containment area of 1.5 Sq. km after completion of filling with FFT–sand mix is considered. Drainage is set to occur in both upward and downward flows, because the hydraulic conductivity is likely to be limited by the deposit rather than by the disposal ground. The constitutive relations used for the model calculation are given in Table 3. The deep-pit’s dimensions or filling conditions are operational (subjective) decisions, and are not fundamental properties that would limit the generality of the model calculations.
Figure 10 presents the solid-content profile of the deep-pit 25 years after complete filling with differing SFR co-disposal mixes. No consideration was given in these analyses to environmental effects such as freeze–thaw and desiccation. For all the deposits, solid content increase begins from the bottom, which is to be expected, as it experiences higher compression. The modelling also shows that the dewatering converges to a maximum solids content characteristic of each SFR in the order 74, 85, 88, and 94% (w/w). Similarly, the average solids contents of the deep-pit, with SFR increasing from that of fines-only to SFR 3 25 years after completing the pit filling, are 59, 77, 82, and 86% (w/w), respectively. The regions where these deposits belong on the ternary plot for oil-sands tailings are shown in Figure 11 [36,37]. The ternary plot shows that the bottom portion of the deep-pit approaches the target end-product solids content at >77 mass% solids.
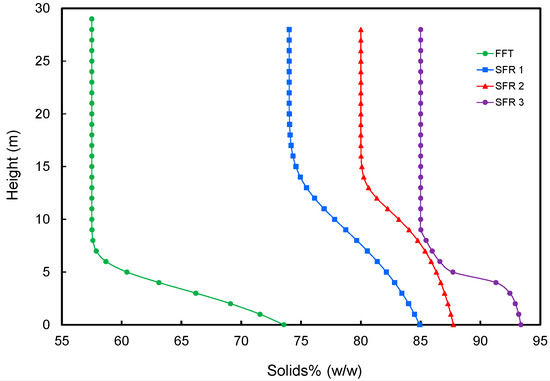
Figure 10.
Finite-strain model solids profile output of thickened FFT at varying SFR after 25 years of consolidation.
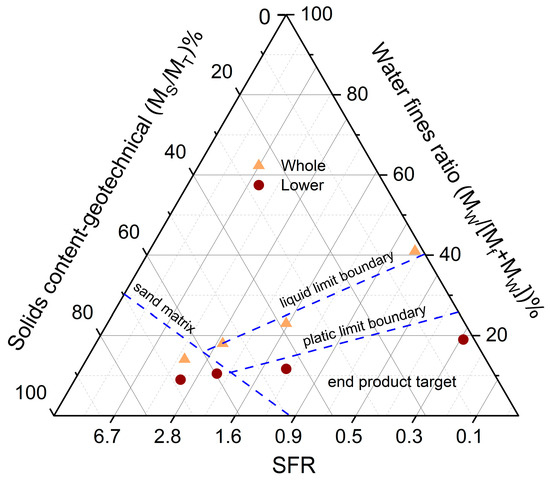
Figure 11.
Ternary diagram depicting the consolidated samples region relative to the boundary lines. Mf, MT, and MW represent the masses of fine solids, whole tailings and water mass, respectively. Solid contents of the whole deep-pit and those below the inflection of the solids profile (Figure 10) are plotted.
At SFR 1, the average solids content exceeds a superseded stringent regulatory directive once instituted by one jurisdiction requiring 50% capture of fines in deposits (AER directive 074) [38]. A value of >65% (w/w) solids content is a high enough unit weight to allow capping and reclamation cover operations [12,39,40]. The bottom-third portion of the deep deposit is beyond the plastic region and can be considered semisolid. The modelling results and index properties mean that co-disposal of even an SFR 1 mix, from the aspect of consolidation, could result in reclamation-ready dry ground in 25 years.
Beyond SFR 1, the consolidation rate gains are not very significant. At higher SFR, more storage capacity of the pit will be used by the sand, thus reducing the capacity available to store fine solids. Figure 12 shows the volume needed to contain 1 M tonne of dry FFT under varying conditions. After complete consolidation, an SFR 3 co-deposit requires more than one and one-half times volume to handle 1 M tonne of dry FFT, as does SFR 1 co-disposal mix. The increased solids contents at SFR 2 and higher also will not result in, geotechnically speaking, very different co-mixed deposits. For these reasons, the optimal composition using fine sand for co-disposal is SFR 1. This paper covered the consolidation aspect only. In general, co-disposal with coarse tailings and, notably, with waste rock have been demonstrated to exhibit higher shear strength.
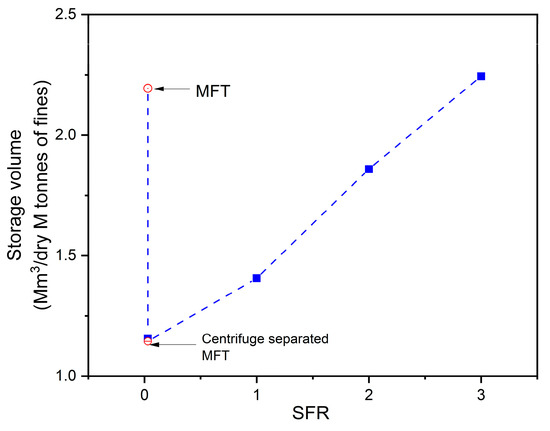
Figure 12.
Storage volumes to contain 1M tonnes of dry FFT at varying SFR.
4. Conclusions
Dewatering is a necessary step for the terrestrial reclamation of FFT ponds. Thickened FFT in a dedicated disposal site has been shown in practice and by modelling to not be able to develop into dryland by self-weight consolidation. This work investigated co-disposal using fine sand as a route to produce deposits that allow expedient capping and reclamation cover operations. The relationships between the hydraulic conductivity of FFT and mixtures with fine sand added at varying SFR were measured. The deformation of these samples under load was also measured so that the effect of fine sand on the consolidation rate could be numerically calculated using empirically derived constants in the constitutive relations of e–σ′–kc. The hydraulic conductivity of the FFT–sand mixtures increased with SFR. The compression index decreased with increases in SFR. The highest relative degree of specific gravity improvement of the deposits was obtained in the range between FFT and SFR 1. At SFR 1, the average deposit solids content is ≥77 mass% solids and is favourable for capping operations. The optimal co-disposal composition, balancing the consolidation rate gains and the minimizing of the land footprint required for storage with the increase in sand, is SFR 1.
Funding
Funding for this work was provided by the Federal Government, Natural Resources Canada department Office of Energy Research and Development (OERD).
Data Availability Statement
All data used is reported in the manuscript.
Acknowledgments
The author would like to acknowledge support from the Government of Canada’s Office of Energy Research and Development (OERD). Members of the Upstream and Environment team were helpful during this long-term study. The XRD analysis of the FFT was performed at the Department of Earth, Ocean & Atmospheric Sciences, University of British Columbia, Canada.
Conflicts of Interest
The author declares no conflict of interest. The funder had no role in the design of the study; in the collection, analyses, or interpretation of data and writing of the manuscript.
References
- Devenny, D.W. A Screening Study of Oil Sand Tailings Technologies and Practices. Revision I, March. Alberta Energy Research Institute, Prepared for the Government of Alberta. 2010. Available online: www.assembly.ab.ca>Iao>library>egovdoc>aleri (accessed on 30 May 2023).
- Boswell, J.E.S.; Gidley, I.D.C.; Jeeravipoolvarn, S.; Pellerin, K.D.O.; Vietti, A. Oil sands thickened tailings—Remedies from an international perspective. In Proceedings of the Tailings and Mine Waste Conference 2015, Vancouver, BC, Canada, 26–28 October 2015; Available online: https://open.library.ubc.ca/soa/cIRcle/collections/59368/items/1.0340520 (accessed on 8 August 2023).
- Jewell, R.J.; Fourie, A.B. Paste and Thickened Tailings: A Guide; Australian Centre for Geomechanics, The University of Western Australia: Crawley, Australia, 2006; ISBN 0-9756756-4-8. [Google Scholar]
- Demoz, A. Geotechnical properties determination of thickened fluid fine tailings. Geotech. Geol. Eng. 2022, 40, 1887–1898. [Google Scholar] [CrossRef]
- McKenna, G.; Mooder, B.; Burton, B.; Jamieson, A. Shear strength and density of oil sands fine tailings for reclamation to boreal forest landscape. In Proceedings of the 5th IOSTC International Oil Sands Tailings Conference, Lake Louise, AB, Canada, 4–7 December 2016; University of Alberta Geotechnical Group: Edmonton, AB, Canada, 2016. [Google Scholar]
- Rozina, E. Bearing Capacity of Multilayer-Deposited in-Line Flocculated Oil Sands Tailings. Master’s Thesis, Department of Civil and Environmental Engineering, Carlton University, Ottawa, ON, Canada, 2013. [Google Scholar]
- Yuan, X.S.; Wang, N.; Dunmola, A.; Curran, M.; Sharp, J.; Lanoue, A. Co-processing of fresh oil sand tailings. In Proceedings of the 25th International Conference on Paste and Filtered Tailings, Banff, AB, Canada, 29 April–3 May 2023. [Google Scholar]
- Burden, R. Using Co-Disposal Techniques to Achieve Stable “Dry-Stacked” Tailings: Geotechnical Properties of Blended Waste Rock and Tailings in Oil Sands and Metal Mining. Ph.D. Thesis, University of Alberta, Edmonton, AB, Canada, 2021. [Google Scholar]
- Burden, R.; Wilson, G.W. Comingling of waste rock and tailings to improve “dry stack” performance: Desing and evaluation of mixtures. Minerals 2023, 13, 295. [Google Scholar] [CrossRef]
- Habte, K.; Bocking, K. Co-disposal practice in mine waste management. In Proceedings of the Tailings and Mine Waste ’17, Banff, AB, Canada, 5–8 November 2017. [Google Scholar]
- Wickland, B.E.; Wilson, G.W. Self-weight consolidation of mixtures of mine waste rock and tailings. Can. Geotech. J. 2005, 42, 327–339. [Google Scholar] [CrossRef]
- Degenhardt, D.; Dongena, A.V.; Schreiberb, S.G.; Bekele, A. Growth and survival of native upland and wetland species in shallow capped thickened tailings: A meso-scale greenhouse study. Can. J. Soil. Sci. 2023, 103. [Google Scholar] [CrossRef]
- Masliyah, J.H.; Zhou, Z.; Xu, Z.; Czarnecki, J.; Hamza, H.A. Understanding water-based bitumen extraction from Athabasca oil sands. Can. J. Chem. Eng. 2004, 82, 625–864. [Google Scholar] [CrossRef]
- Gray, M.; Xu, Z.; Masliya, J. Physics in the oil sands of Alberta. Phys. Today 2009, 62, 31–35. [Google Scholar] [CrossRef]
- Cossey, H.L.; Batycky, A.E.; Kaminsky, H.; Ulrich, A.C. Geochemical Stability of Oil Sands Tailings in Mine Closure Landforms. Minerals 2021, 11, 830. [Google Scholar] [CrossRef]
- Demoz, A. Impact of preflocculation on scroll decanter centrifuge separation performance. Can. J. Chem. Eng. 2018, 96, 265–269. [Google Scholar] [CrossRef]
- ASTM. Standard D2434—Permeability of Granular Soils (Constant Head). In ASTM Annual CDs of Standards; ASTM: West Conshohocken, PA, USA, 2011. [Google Scholar]
- Scarlett, N.V.Y.; Madsen, I.C. Quantification of phases with partial or no known crystal structures. Powder Diffr. 2006, 21, 278–284. [Google Scholar] [CrossRef]
- ASTM D2435-11; Standard Test Method for One Dimensional Consolidation Properties of Soils Using Incremental Loading. ASTM International: West Conshohocken, PA, USA, 2011.
- Znidarcic, D.; Abu-Hejleh, A.N.; Fairbanks, T.; Robertson, A. Consolidation Characteristics Determination for Phosphatic Clays. Vol 1: Seepage Induced Consolidation Tests Equipment Description and User Manual; University of Colorado: Boulder, CO, USA, 1994. [Google Scholar]
- Scott, J.D.; Jeeravipoolvarn, S.; Chalaturnyk, R.J. Tests for wide range of compressibility and hydraulic conductivity of flocculated tailings. In Proceedings of the 61st Canadian Geotechnical Conference, Edmonton, AB, Canada, 22–24 September 2018; pp. 738–745. [Google Scholar]
- Head, K.H.; Epps, R.J. Manual of Soil Laboratory Testing, 3rd ed.; Whittles Publishing: Caithness, UK, 2011; Volume 2, Chapters 10 and 14. [Google Scholar]
- Whitlow, R. Basic Soil Mechanics, 4th ed.; Prentice Hall: Dorchester, UK, 2001. [Google Scholar]
- ASTM D4318-10; Standard Test Methods for Liquid Limit, Plastic Limit, and Plasticity Index of Soils. ASTM: West Conshohocken, PA, USA, 2017.
- ASTM D3441-16; Standard Test Methods for Cone Penetration Testing of Soils. ASTM: West Conshohocken, PA, USA, 2017.
- Suthaker, N.N.; Scott, J.D. Consolidation behaviour of oil sand fine tailings. In Proceedings of the America Society of Mining and Reclamation National Meeting, Pittsburgh, PA, USA, 24–29 April 1994; Volume 4, pp. 399–406. [Google Scholar]
- Das, B.M. Principles of Geotechnical Engineering, 4th ed.; PWS Publishing Company: Boston, MA, USA, 1998. [Google Scholar]
- Holtz, R.D.; Kovacs, W.D.; Sheahan, T.C. An Introduction to Geotechnical Engineering, 2nd ed.; Pearson: Noida, India, 2010. [Google Scholar]
- Khan, F.S.; Azaam, S. Determination of consolidation behaviour of clay slurries. Int. J. Min. Sci. Technol. 2016, 26, 277–283. [Google Scholar] [CrossRef]
- Terzaghi, K.; Peak, R.B.; Mesri, G. Soil Mechanics in Engineering Practice; John Wiley & Sons Inc.: New York, NY, USA, 1996. [Google Scholar]
- Ahmed, M.; Beier, N.A.; Kaminsky, H. A Comprehensive Review of Large Strain Consolidation Testing for Application in Oil Sands Mine Tailings. Mining 2023, 3, 121–150. [Google Scholar] [CrossRef]
- Pollock, G.W. Large Strain Consolidation of Oil Sands Tailings Sludge. Master’s Thesis, Department of Civil Engineering, University of Alberta, Edmonton, AB, Canada, 1988. [Google Scholar]
- Gibson, R.E.; England, G.L.; Hussey, M.J.L. The theory of one-dimensional consolidation of saturated clays. Géotechnique 1967, 17, 261–273. [Google Scholar] [CrossRef]
- Gibson, R.E.; Schiffman, R.L.; Cargill, K.W. The theory of one-dimensional consolidation of saturated clays, II. finite non-linear consolidation of thick homogeneous layers. Can. Geotech. J. 1981, 18, 280–293. [Google Scholar] [CrossRef]
- Tito, A.A. Numerical Evaluation of One-Dimensional Large-Strain Consolidation of Mine Tailings. Master’s Thesis, Department of Civil and Environmental Engineering, Colorado State University, Fort Collins, CO, USA, 2015. [Google Scholar]
- Scott, J.D.; Cymerman, G.J. Prediction of viable tailings disposal methods. In Sedimentation Consolidation Models: Prediction and Validation: Proceedings of a Symposium; ASCE: New York, NY, USA; San Francesco, CA, USA, 1984; pp. 522–544. [Google Scholar]
- Azam, S.; Scott, J.D. Revisiting the ternary diagram for tailings characterization and management. Geotech. News 2005, 23, 43–46. [Google Scholar]
- Alberta Energy Regulator. ST98: Alberta’s Energy Reserves & Supply/Demand Outlook. 2013. Available online: http://www.aer.ca/data-and-publications/statistical-reports/st98 (accessed on 7 August 2023).
- COSIA. Technical Guide for Fluid Fine Tailings Management. 2012. Available online: https://cosia.ca/node/57 (accessed on 19 July 2023).
- Imperial Oil Resources Limited. Kearl Oil Sands Mine: Fluid Tailings Management Report for 2019. 2020. Available online: https://static.aer.ca/prd/documents/reports/2020-State-Fluid-Tailings-Management-Mineable-OilSands.pdf (accessed on 19 July 2023).
Disclaimer/Publisher’s Note: The statements, opinions and data contained in all publications are solely those of the individual author(s) and contributor(s) and not of MDPI and/or the editor(s). MDPI and/or the editor(s) disclaim responsibility for any injury to people or property resulting from any ideas, methods, instructions or products referred to in the content. |
© 2023 by the author. Licensee MDPI, Basel, Switzerland. This article is an open access article distributed under the terms and conditions of the Creative Commons Attribution (CC BY) license (https://creativecommons.org/licenses/by/4.0/).