Article

Mapping of the Structural Lineaments and Sedimentary Basement Relief Using Gravity Data to Guide Mineral Exploration in the Denizli Basin

by
Fatma Figen Altinoğlu
Department of Geological Engineering, Pamukkale University, Denizli 20160, Turkey
Minerals 2023, 13(10), 1276; https://doi.org/10.3390/min13101276
Submission received: 15 August 2023 / Revised: 20 September 2023 / Accepted: 25 September 2023 / Published: 29 September 2023

Abstract

:
The Aegean Graben System is a complex tectonic structure in Western Anatolia and the Denizli Graben is a member of this system that hosts many geothermal springs, ore deposits, and travertine areas. In this study, the gravity data were analyzed to determine the subsurface geological structures and the depth model of the basin. The Bouguer gravity anomaly has a NW–SE pattern that is consistent with the general trend of the Denizli Basin. The pre-Neogene basement depths range from 0.1 km to 2.3 km. The Denizli Basin is composed of the Çürüksu Basin and the Laodikia sub-basin. The basins have undulated structures with many depressions; the deepest depression region is in the northern part of the Çürüksu Basin, which is close to the Pamukkale Fault Zone. In addition, the new gravity lineament map was obtained by using new-generation edge detection techniques: the tilt angle of the horizontal gradient amplitude (TAHG), and fast sigmoid-edge detection (FSED) of gravity data. The new proposed lineament map shows that the Denizli Basin has complex structures consisting of NW–SE, E–W, and NE–SE trending lineaments, and the major NW–SE trending faults and NE–SW trending lineaments control the main structural configuration. The uplifts and depressions in the basin deposit and the intersection area of lineaments are promising prospective areas for mineral deposits and have energy resource potential.

1. Introduction

Researching mineral deposits, hydrocarbon and geothermal potential, hot springs, and travertine occurrences requires knowledge of tectonic structures such as faults, fractures, their interactions, intersection zones, and the progression of these structures at the subsurface. The potential field methods in geophysics are the widespread methods to identify boundaries of subsurface structures and various techniques have been used to define the edges of density and magnetization structures [1,2,3,4,5]. On the other hand, identifying the presence and location of smooth depressions and uplifts in a sedimentary basin’s basement relief may assist in locating stratigraphic and structural oil traps [6,7]. In such research, potential field data on larger-scale surveys [8,9,10] and seismic data in more local target areas are used very effectively [11,12,13].
Western Anatolia is one of the major continental extension regions in the world [14,15], characterized by active extensional tectonics [16,17,18,19] and a thin continental crust [20,21]. Due to the compression and extension regime in Western Anatolia, many horst-graben structures extending in various directions called the Aegean Graben System, have been formed in the region [22] (Figure 1a). On the other hand, the Aegean Graben System is also known as a remarkable region in Western Anatolia that hosts many geothermal fields, mineral deposits, oil, gas, and hydrocarbons. Therefore, the tectonic evolution and geological structure of the region have attracted the attention of many researchers [14,15,16,17,18,20,21,22,23,24,25,26,27,28,29,30,31,32,33]. In this topic, there are many studies in the literature investigating hydrocarbon resources [34,35,36,37], geothermal potential [38,39,40,41,42,43,44,45,46,47], and travertine formation [48,49,50,51,52,53] in the Western Anatolian grabens.
The research area of this study includes the NW–SE trending Denizli Graben as part of the Aegean Graben System, which was formed as an extensional basin during the Late Miocene-Quaternary neotectonic evolution of SW Turkey (Figure 1b). The area is of great economic significance since it comprises geothermal areas, numerous hot springs, travertines, and marble quarries. It has been subjected to a number of geological studies due to its tectonic position [19,32,54,55]. However, geophysical studies focusing on determining the depth structure of the basin and its subsurface geologic structural elements have been few in the literature. A review of the results of previous research on this topic is as follows: Sarı and Şalk [56] investigated the sedimentary thickness of Aegean grabens using 2D and 3D analysis of Bouguer gravity anomalies and reported a sediment thickness of over 2 km in the Denizli Graben. Altinoğlu et al. [57] provided the 3D topography of the upper/lower crustal boundary of the Denizli Basin by inversion of gravity data and used conventional edge detection methods such as the horizontal gradient, analytic signal, and tilt angle to detect lineaments around the basin for the first time. Altinoğlu [58] determined the topography of the sedimentary basement in the southeastern part of the Denizli region and reported a thickness of 2–2.2 km in the Honaz region. Ekinci et al. [59] determined the sediment topography along Aegean grabens by evaluating profile gravity data, one of which is located close to the northeast boundary of the Denizli Basin. They concluded that the maximum sediment thickness in the Aegean Graben System is approximately 1.5 km. They have also used the geothermal wells drilled by MTA. The lithological log of the geothermal well, which is drilled in the Denizli Basin [59,60], is given in Figure 1c. Apart from the studies on the sedimentary depth structure of the study area, some other studies investigated the deeper crust and thermal structure of the region. In the study by Bilim [61], the tectonic and thermal structure of the eastern part of Western Anatolia was examined using aeromagnetic and Bouguer gravity anomalies. In their study, the northeast part of Denizli city has been determined with shallow CPD. Kaypak and Gökkaya [62] investigated the upper crustal velocity structure in the Denizli basin with 3D local earthquake tomography and reported that the main geothermal fields in the Denizli region are mostly located along graben systems and main fault systems. Irmak [63] determined the focal mechanisms of the small earthquakes in the Denizli Basin. Erbek-Kiran et al. [64] studied the upper crustal structure of the Denizli Graben using Bouguer gravity data and seismic data. The Bouguer anomalies in their study were evaluated to determine the basement topography of the upper-lower crust boundary by inversion of gravity data. Based on the interpretation of two seismic reflection datasets, they concluded that sedimentary sequences in the Denizli Basin can be considered oil traps.
Figure 1. (a) The simplified geological map of Western Anatolia, modified from [30,31]. The dashed box shows the area coverage of the study area. GG: Gördes Graben, DG: Demirci Graben, SG: Selendi Graben, AG: Alaşehir Graben, KMG: Küçük Menderes Graben, BMG: Büyük Menderes Graben, DG: Denizli Graben, UGB: Uşak-Güre Basin, AG: Acıgöl Graben, and BG: Baklan Graben. (b) The geological map of the study area, modified from [53,65]. (c) Lithological log of the geothermal well drilled by General Directory of Mineral Exploration and Research Company of Turkey (MTA) in Denizli Basin (modified from [59,60]).
Minerals 13 01276 g001
Knowledge of the sediment base topography and interconnected lineaments may yield significant gains in the course of the investigation of a region’s mineral deposits and energy resources potential. Most of the previous geophysical studies in the Denizli Graben were focused on deeper crustal architecture, and the studies regarding shallow sediments and basement characteristics mainly address a narrow part of the basin area. This research aims to determine the three-dimensional (3D) depth variation of the Denizli sedimentary basin by inverting its gravity anomalies and delineating subsurface linear structural elements such as faults or contacts using recent enhanced techniques of gravity data interpretation with the expectation of providing key information for further mineral and energy resource studies in the region. For this purpose, firstly, the 3D sedimentary basement topography of the basin area was determined by an iterative inversion process of the gravity data utilized in the frequency and space domain. Next, the gravity lineaments were obtained using two different edge detector filters that are capable of balancing anomalies of shallow and deep sources. Finally, some of the featured findings obtained from the study, which improve previous geological information, are discussed in the context of potential sites for future hydrocarbon, geothermal, and mineral explorations.

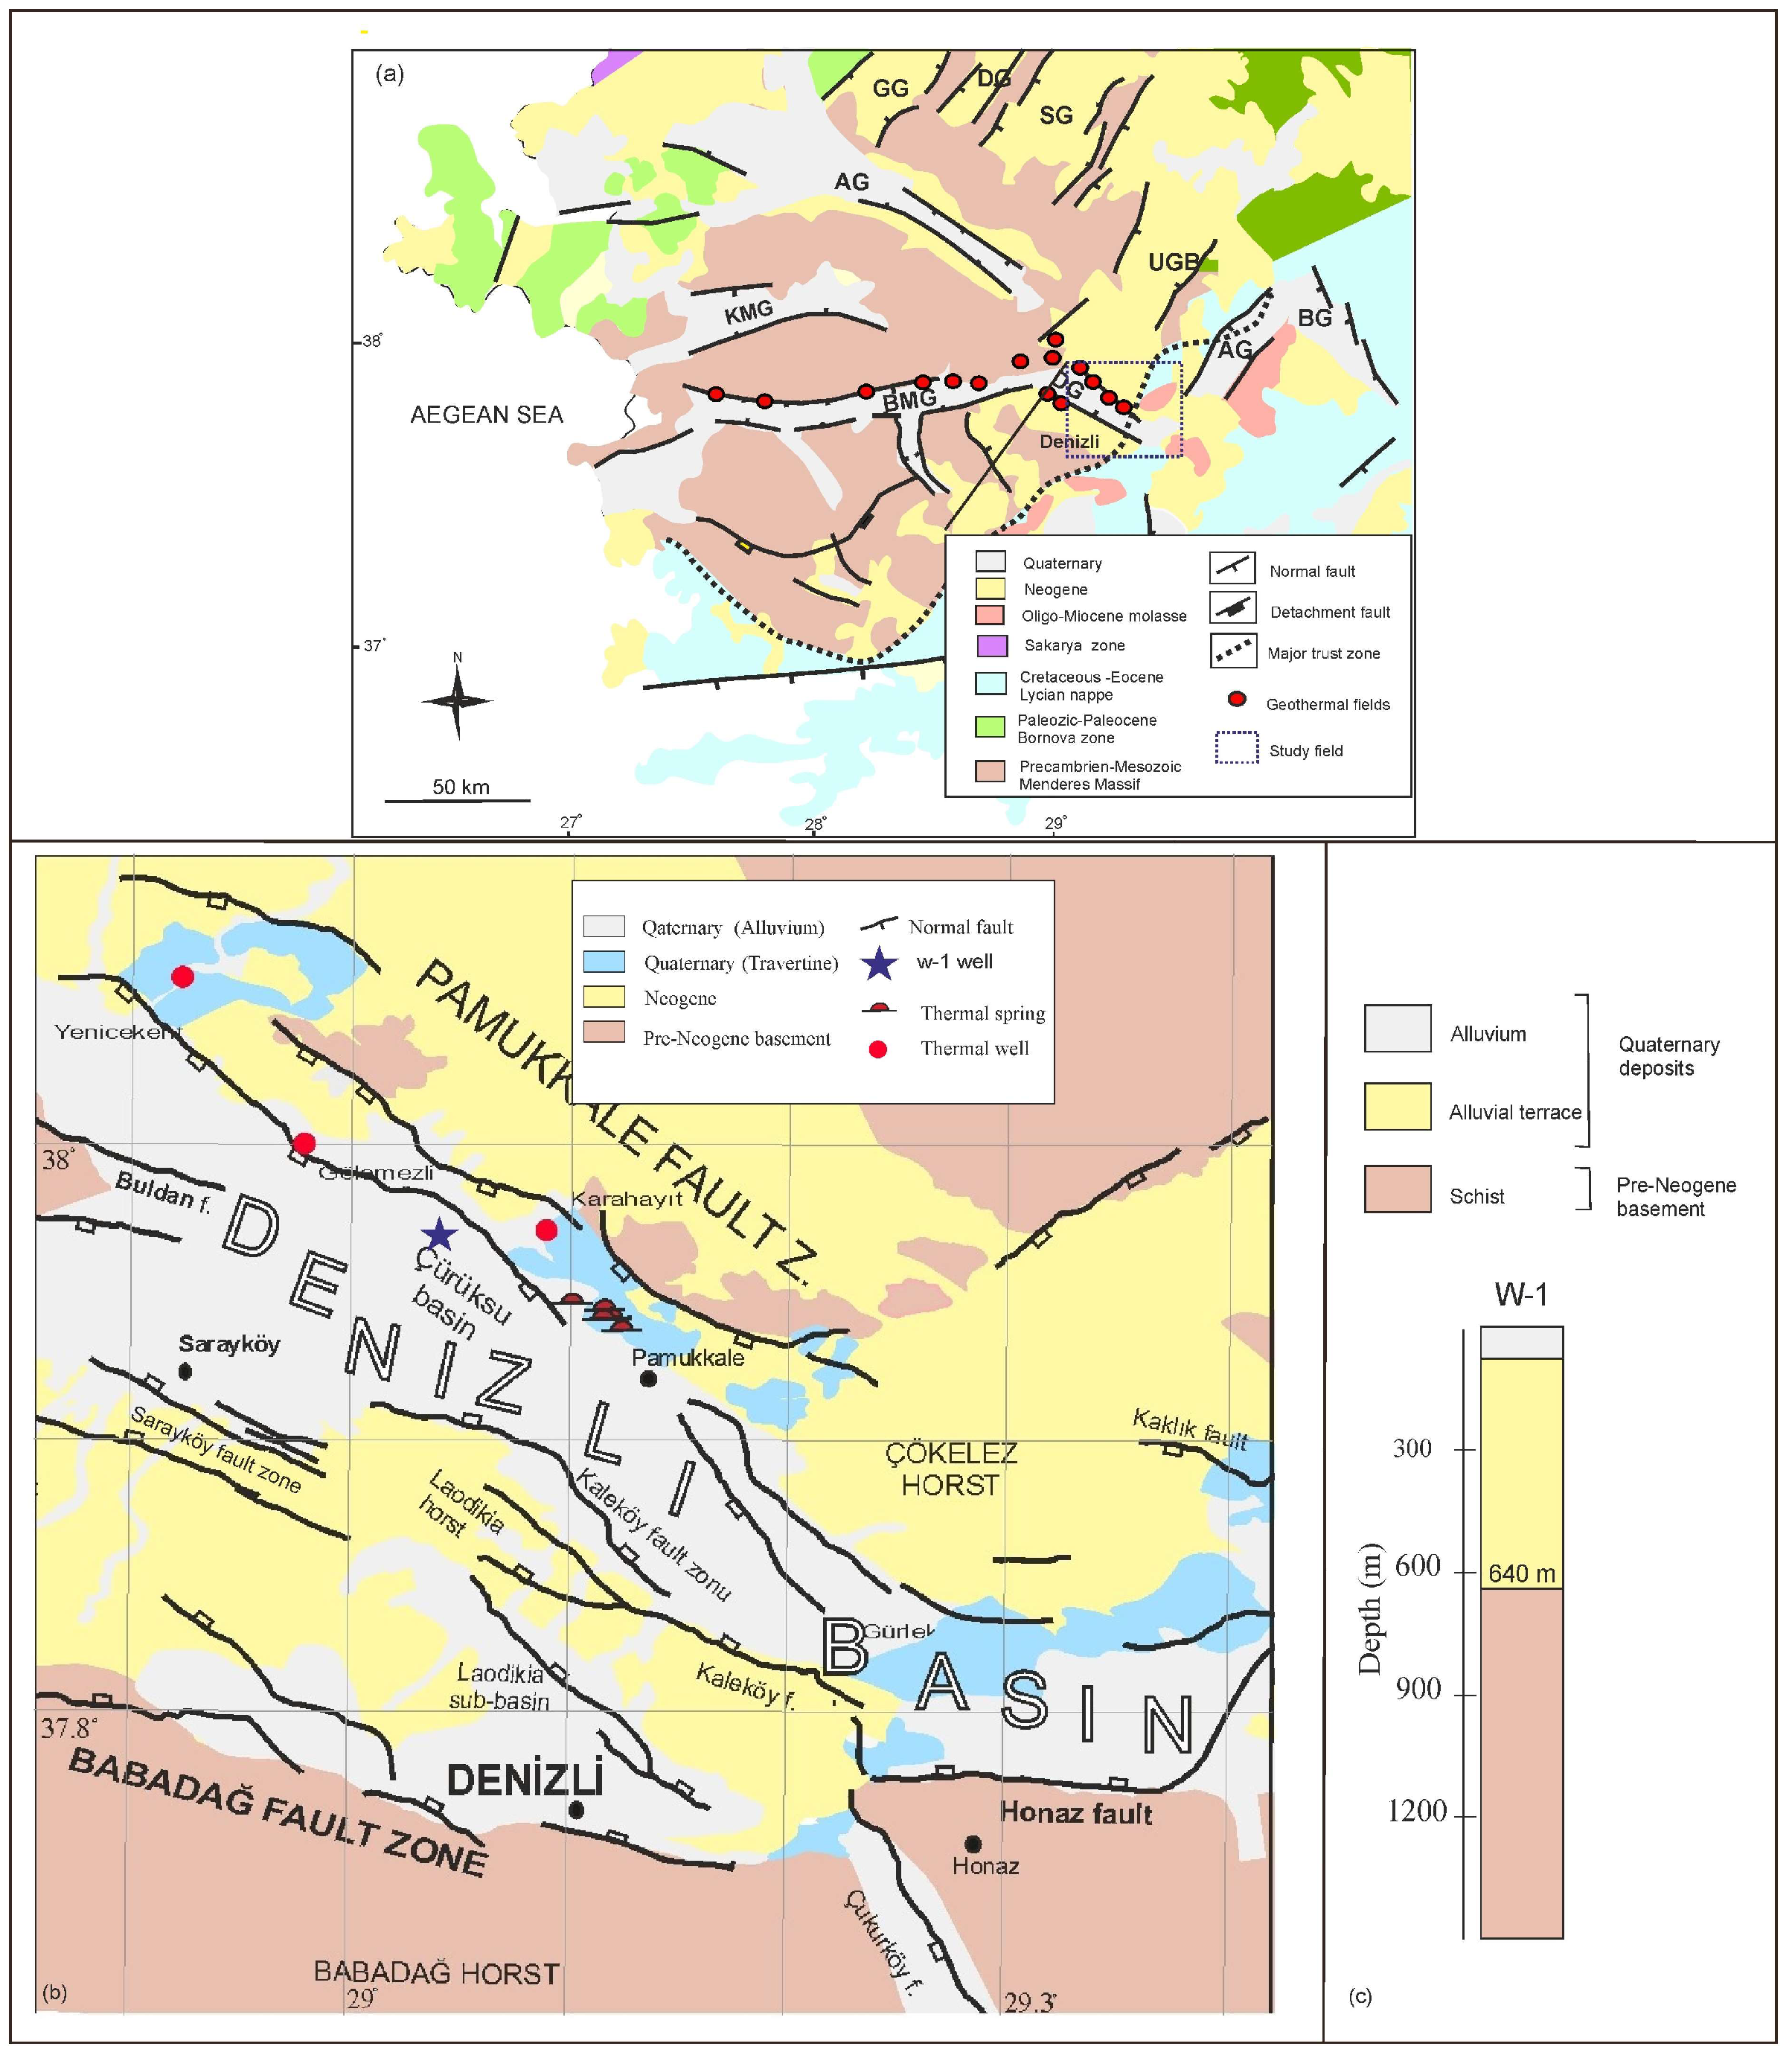
2. Tectonic Settings of Denizli Basin

The Denizli Basin area is a transition region of Aegean grabens with various orientation and extension directions: E–W trending Büyük Menderes Graben, Küçük Menderes Graben, NW–SE-trending Alaşehir Graben, and NE-SW trending Baklan Graben, Acıgöl Graben and Burdur Graben (Figure 1a). The NW–SE trending Denizli Basin is approximately 50 km in length and 7–28 km in width. The formation of the basin started around 14 million years ago, with an estimated average slip rate of 0.14–0.15 mm/year [15,19,66]. The basin was developed on pre-Oligocene metamorphic rocks found in the Menderes Massif, Lycian Nappes, and an Oligocene-Lower Miocene molassic sequence [66] (Figure 1a). The sedimentary fill of the Denizli Basin comprises Early Miocene to Quaternary units, including alluvial, fluvial, and lacustrine deposits, superimposed on the metamorphic bedrock. The geological substrate of the region consists of Paleozoic schist-quartzite, gneiss, and marbles, which form the pre-Neogene basement of the Western Anatolian extensional province.
The Denizli Basin is bordered by the Çökelez Horst and Pamukkale Fault Zone to the north, the Babadağ Horst and Babadağ Fault Zone to the SW, and Honazdağ Horst and Honaz Fault to the south. The Kaleköy Fault Zone extending in the central part of the basin divides the basin into two Quaternary basins, namely the Çürüksu Basin in the north and the Laodikia sub-basin in the south [54] (Figure 1b).

3. Data and Methods

The Bouguer gravity data of the study region were obtained from the General Directory of Mineral Exploration and Research Company of Turkey (MTA) and Turkish Petroleum Corporation (TPAO). No detailed information is available on instruments. The gravity values were tied to MTA and General Command of Mapping base stations related to the Potsdam 981260.00 mGal absolute gravity value accepted by the International Union of Geodesy and Geophysics in 1971. The latitude correction was carried out by using the Gravity Formula of 1967 and the terrain reduction was carried out with the aid of the Hammer tables out to Zone J. The Bouguer density was assumed to be 2.67 gr cm−3. Then, the data were gridded over 1 km2 areas. The Bouguer gravity anomaly map of the Denizli Graben with 10 mGal intervals is given in Figure 2.
The Bouguer anomaly map indicates the entire impact of shallow and deep sources’ gravity responses due to the density heterogeneity of the subsurface. Therefore, regional-residual separation for the relevant anomalies in determining the depth model of sedimentary basins is the first step of the processing of Bouguer gravity data. Many techniques are used in the literature to separate anomalies, such as subtracting a fixed value referenced to a geological unit from the Bouguer anomaly, trend surface analysis, polynomial fitting, and a variety of filtering schemes in both the time and Fourier domains. Due to the study area being small and the basin bordered by pre-Neogene basements in the north and south, the anomaly value passing through the basin boundary was determined. In the Bouguer gravity anomaly map, −23 mGal contours pass through the basin boundary as shown with the yellow contour line in Figure 2. To increase the impact of shallow geological features, residual anomalies were created by subtracting these values from gravity anomalies. The residual gravity anomaly map is given in Figure 3.
In the inversion of gravity data to recover the sediment-basement relief, a constant value of density contrast is often used for shallow basins, while varying density contrasts with depth are considered for deep basins. As the Aegean grabens are not expected to be a deep basin, a constant density contrast value of 0.5 g cm−3 was used in the inversion process, based on the information obtained from the boreholes drilled for geothermal exploration by MTA [56,59]. Due to the low density of sediments in comparison to a surrounding rock density, a sedimentary cover is generally associated with negative gravity anomalies [59]. Therefore, only the negative anomaly corresponding to the basin fill is taken into consideration in the inversion scheme, whereas the positive anomalies in the observed gravity anomaly are ignored.

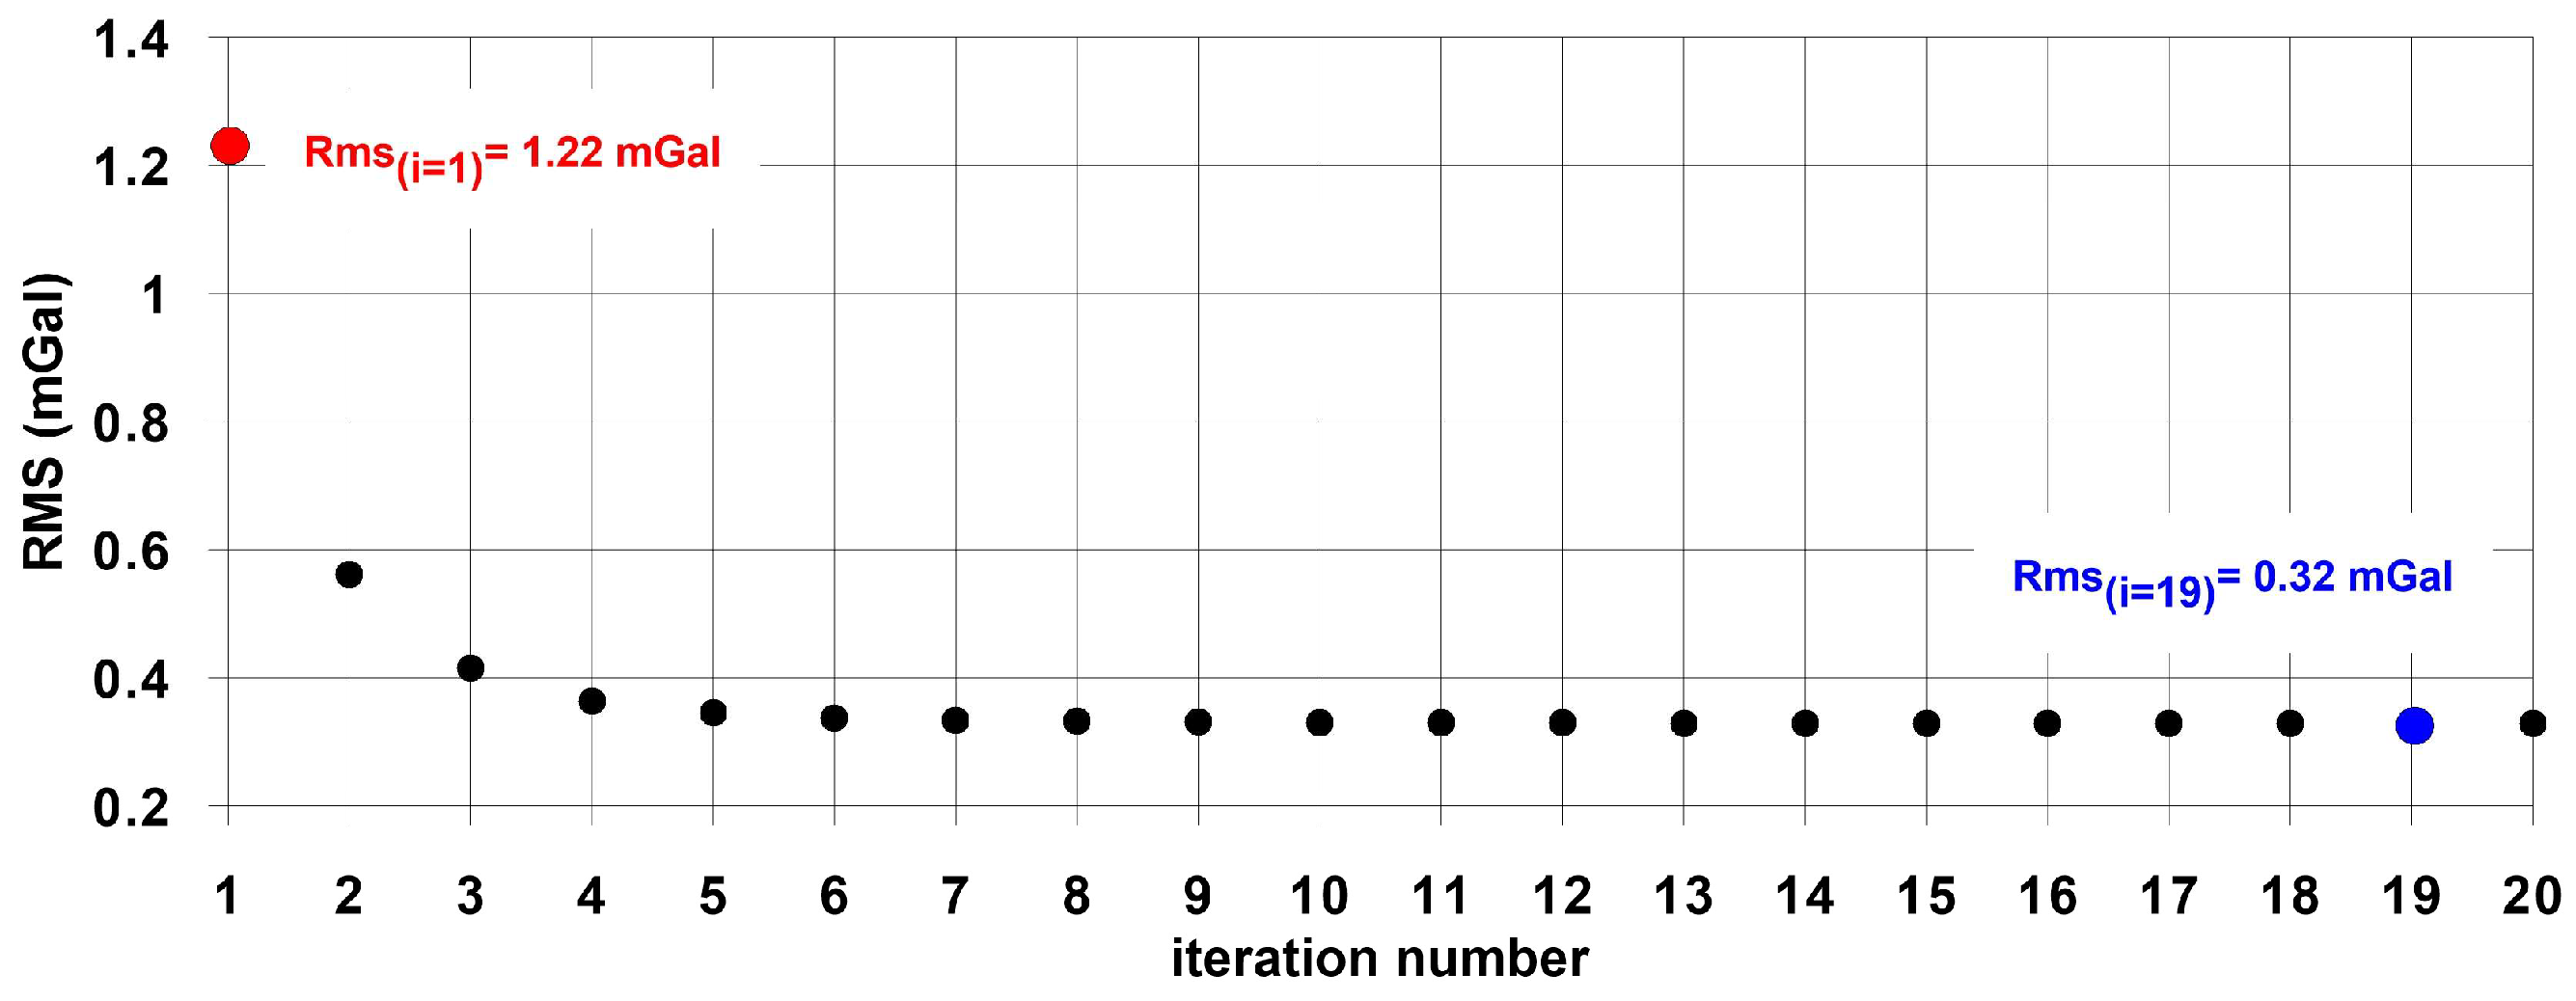
3.1. Basin Depth Model

The gravity anomalies of the study area are inverted by using an iterative procedure proposed in [68] which combines the advantages of both the frequency domain and space domain techniques applied for the forward calculation of the gravity anomalies and the modification of calculated depth values after each iteration. The algorithm consists of three main steps to invert the gravity anomalies for the basement depth h.
The infinite horizontal slab equation is first used to generate an initial approximation of the depth to the basement interface at each observation [69]:
h ( i , j ) 1 = 1 λ l n 1 λ g o b s ( i , j ) 2 π ρ 0
where g o b s ( i , j ) is the observed field at a mesh point (i, j), ρ = ρ 0 e λ z is the density model where λ is the decay constant of the decrease in density with depth z, and Δ ρ 0 is the density contrast at the surface. The FFT-based algorithm in [70] is used in the next step to calculate the gravity response of the density interface of the initial model:
g = 2 π γ ρ 0 λ 1 e z 0 + 2 π γ ρ 0 e z 0 × F 1 e k z 0 k + λ F 1 e λ h n = 1 ( k ) n n ! F e λ h h n
where k is the wavenumber, γ is the gravitational constant, F[ ] and F−1[ ] represent the Fourier and inverse Fourier transforms, respectively, and z0 is the mean depth of the basement interface as a reference level in the sense that h = z0 + Δh describes the depth of the interface. The depth model is modified using the space domain relation in the final stage found in [71]:
h ( i , j ) ( t + 1 ) = g o b s ( i , j ) g c a l c ( i , j ) h ( i , j ) ( t )
where t denotes the number of iterations. When the desired fit between the calculated and observed gravity fields, as measured by the root mean square error (RMS) between them, occurs between the second and third steps, the gravity response of the modified depths is calculated once more, and the process is repeated until the inverted model is satisfied.

3.2. Detection of Lineaments

To identify the lineaments from potential field data, edge detection techniques play an important role, and they are generally based on vertical and horizontal derivatives of the field. The total horizontal gradient amplitude (THG) [72] is a popularly used method to highlight the boundaries of potential field sources. The authors of [73] showed that the use of the maximum values of the total horizontal gradient can outline the source edges. The THG filter is defined as:
T H G = F x 2 + F y 2 ,
where F / x and F / y are the gradients of the field F in horizontal x and y directions, respectively.
Some authors used higher-order derivatives to increase the resolution of the edge detection results [74,75,76]. The main disadvantage of these methods based on the amplitude of gravity gradients is that they cannot equalize the amplitudes of anomalies caused by sources located at different depths.
Miller and Singh [76] showed that the phase-based methods that can produce balanced results using the arctangent function of the ratio of the vertical gradient to the horizontal gradient amplitude, called the tilt angle (TA), can equalize large and small amplitudes at the same time. The TA filter is given as:
= tan 1 F z F x 2 + F y 2
Ferreira et al. [77] proposed the use of the tilt angle of the horizontal gradient amplitude (TAHG) method for balancing signals from shallow and deep structures more effectively. This method represents an improvement over the tilt angle method. The TAHG filter is defined as:
T A H G = t a n 1 T H G z T H G x 2 + T H G y 2
where T H G / x T H G / y , and T H G / z are the horizontal and vertical derivatives of the total horizontal gradient of F. The technique offers the advantage of equalizing the total horizontal gradient (THG) while being less dependent on depth considerations. This method showcases superior resolution in detecting body limits compared to conventional approaches.
The other method called fast sigmoid-edge detection (FSED) by the authors of [78] employs a modified fast sigmoid function of the ratio of the derivatives of the THG in order to improve the resolution and accuracy of estimated edges. The source edges are identified using its maximum values. The formulation of the FSED is given as:
F S E D = R 1 1 + R ,
where
R = T H G z T H G x 2 + T H G y 2
The FSED filter can balance the large and small amplitude anomalies due to sources of different depths and properties, as well as the edges of the sources being determined with higher resolution and more accurately. As another advantage, this filter also does not produce false edges when the anomalous sources contain opposite sign density contrasts simultaneously [78].

4. Results

The Bouguer gravity anomalies range from −50 to 10 mGal, with a maximum amplitude variation of 60 mGal (Figure 2). High positive anomalies are seen on the northern and southern parts of the map, which is explained by the presence of metamorphic basement units with a high density. The residual gravity anomaly map of the study area is given in Figure 3, the NW–SE trending anomalies are consistent with trend of the Denizli Basin. The anomaly contours at the northern and southern edges of the basin display a dense trend corresponding to the basin’s extension. This type of contour arrangement in gravity maps may indicate the presence of linear structures such faults or contacts. Here, the positive residual anomaly pattern observed in the northern and southern boundaries along the graben is consistent with the regional geology of pre-Neogene basement units.

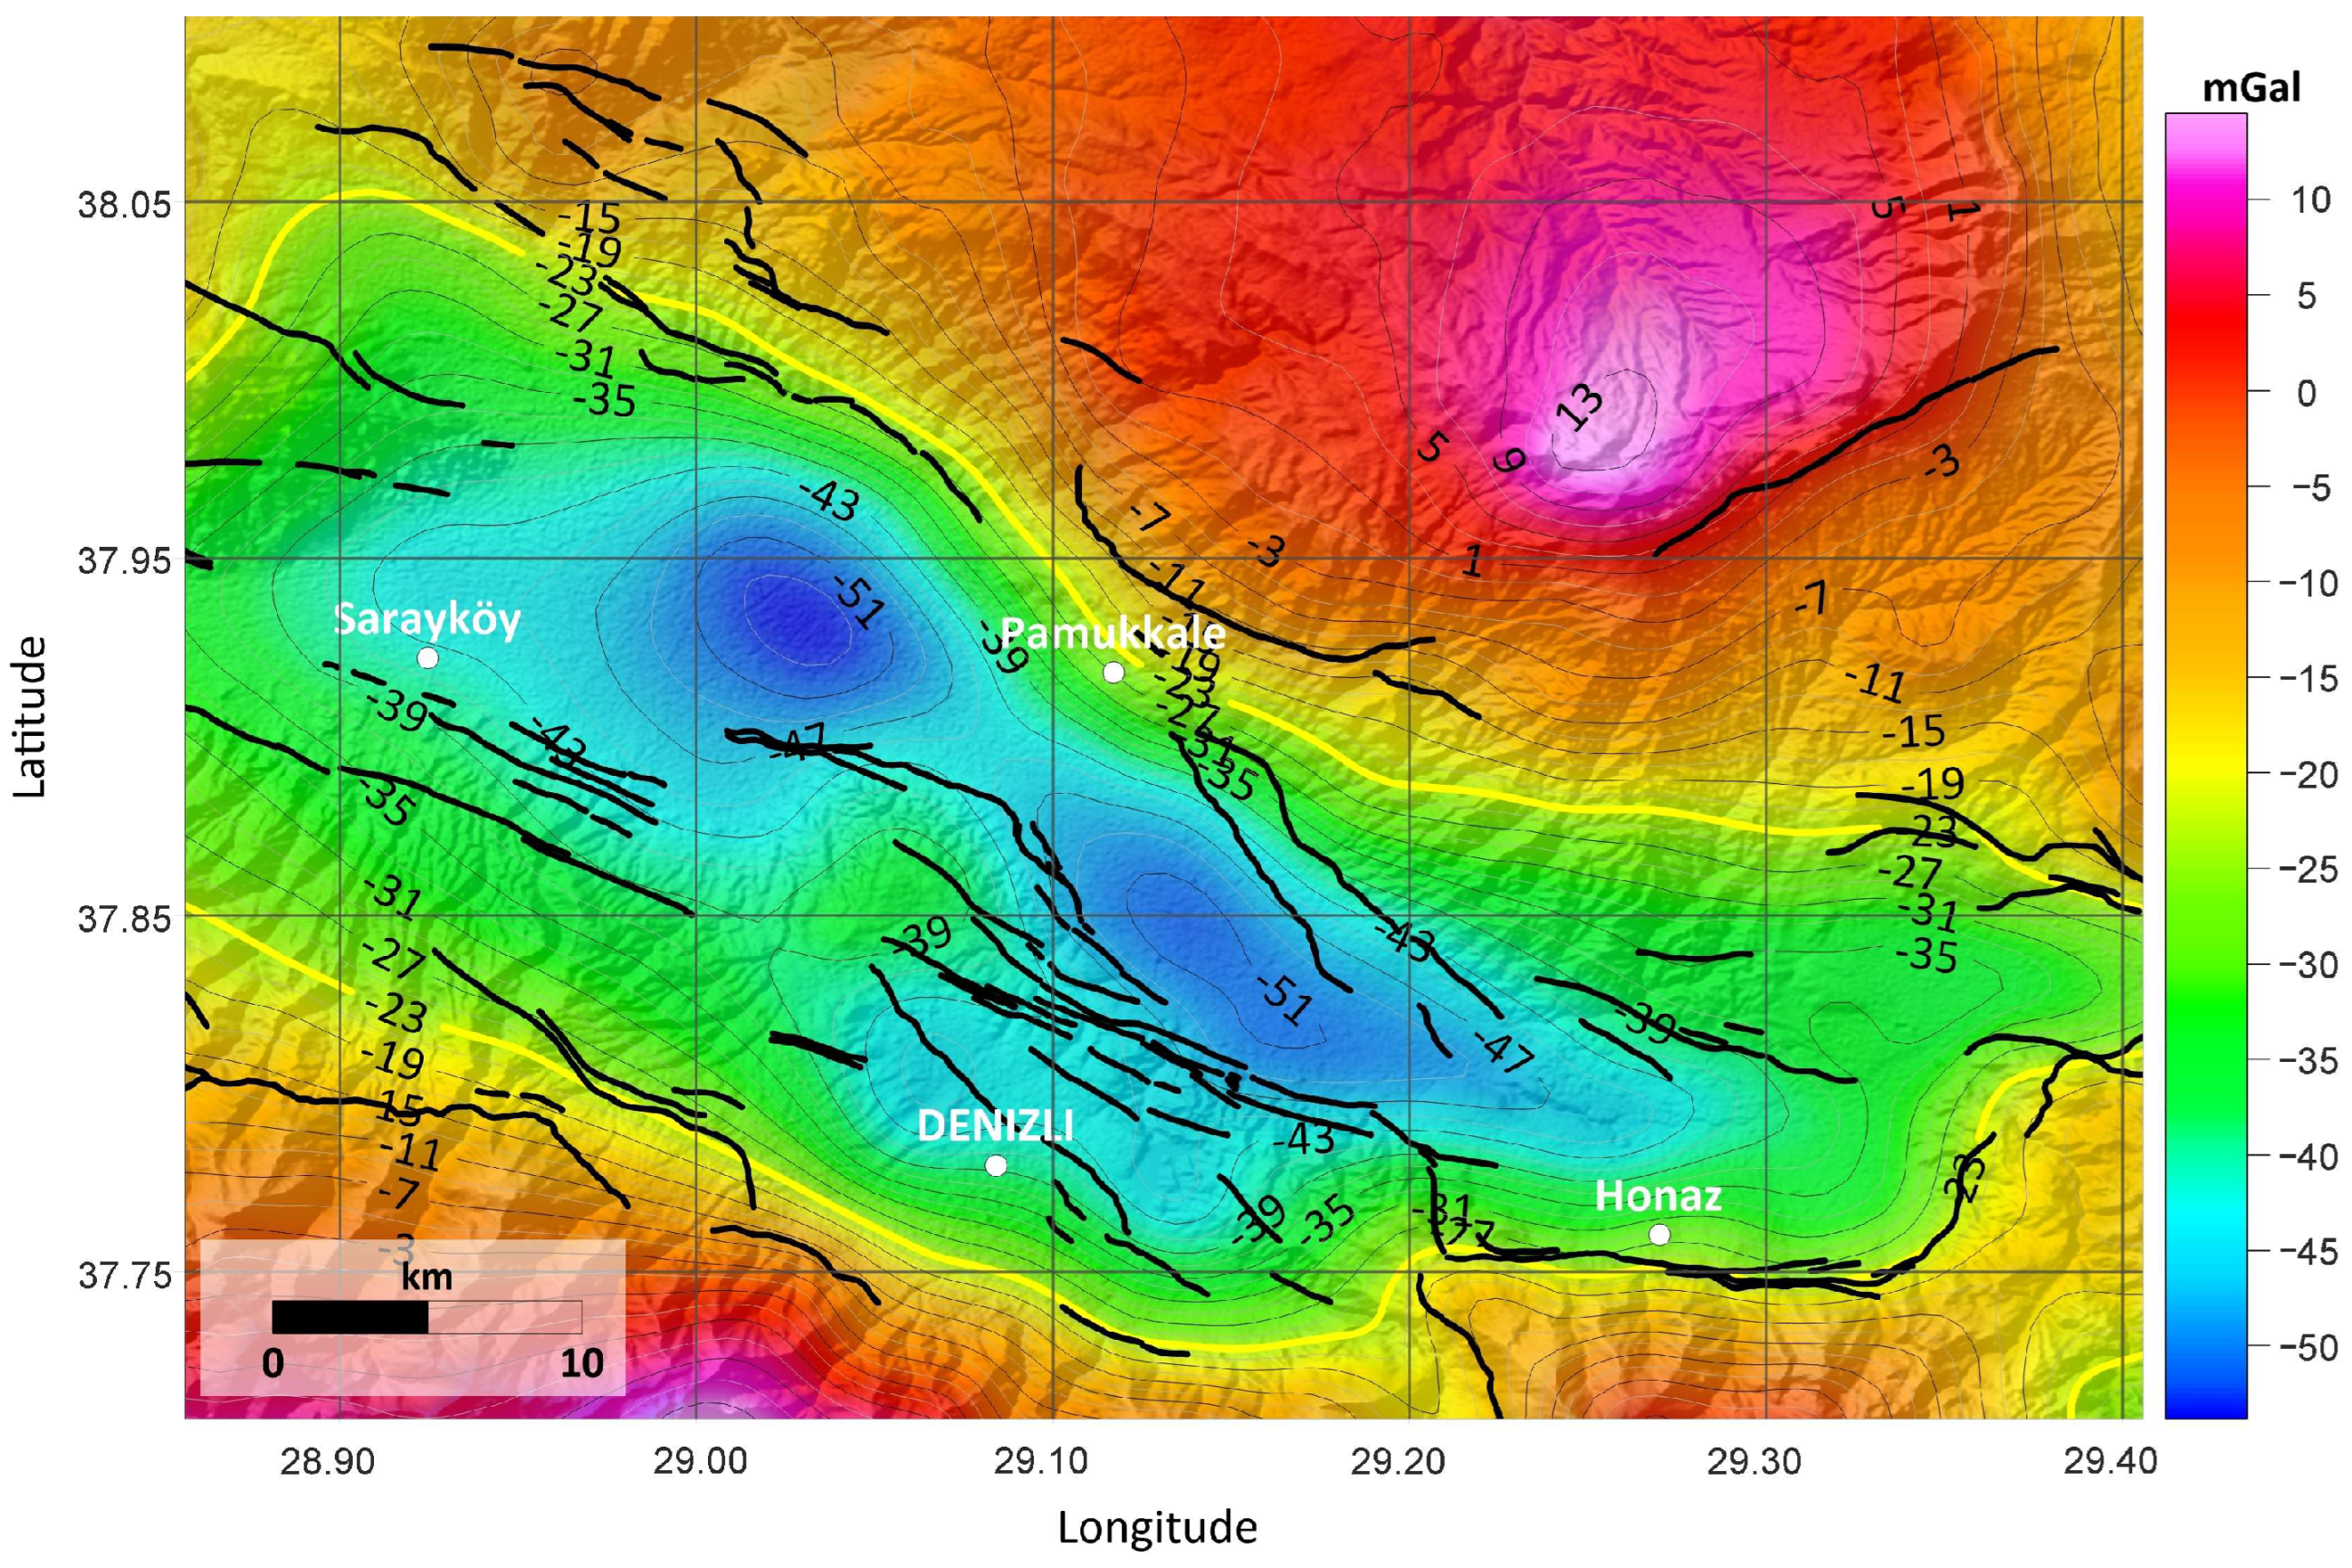
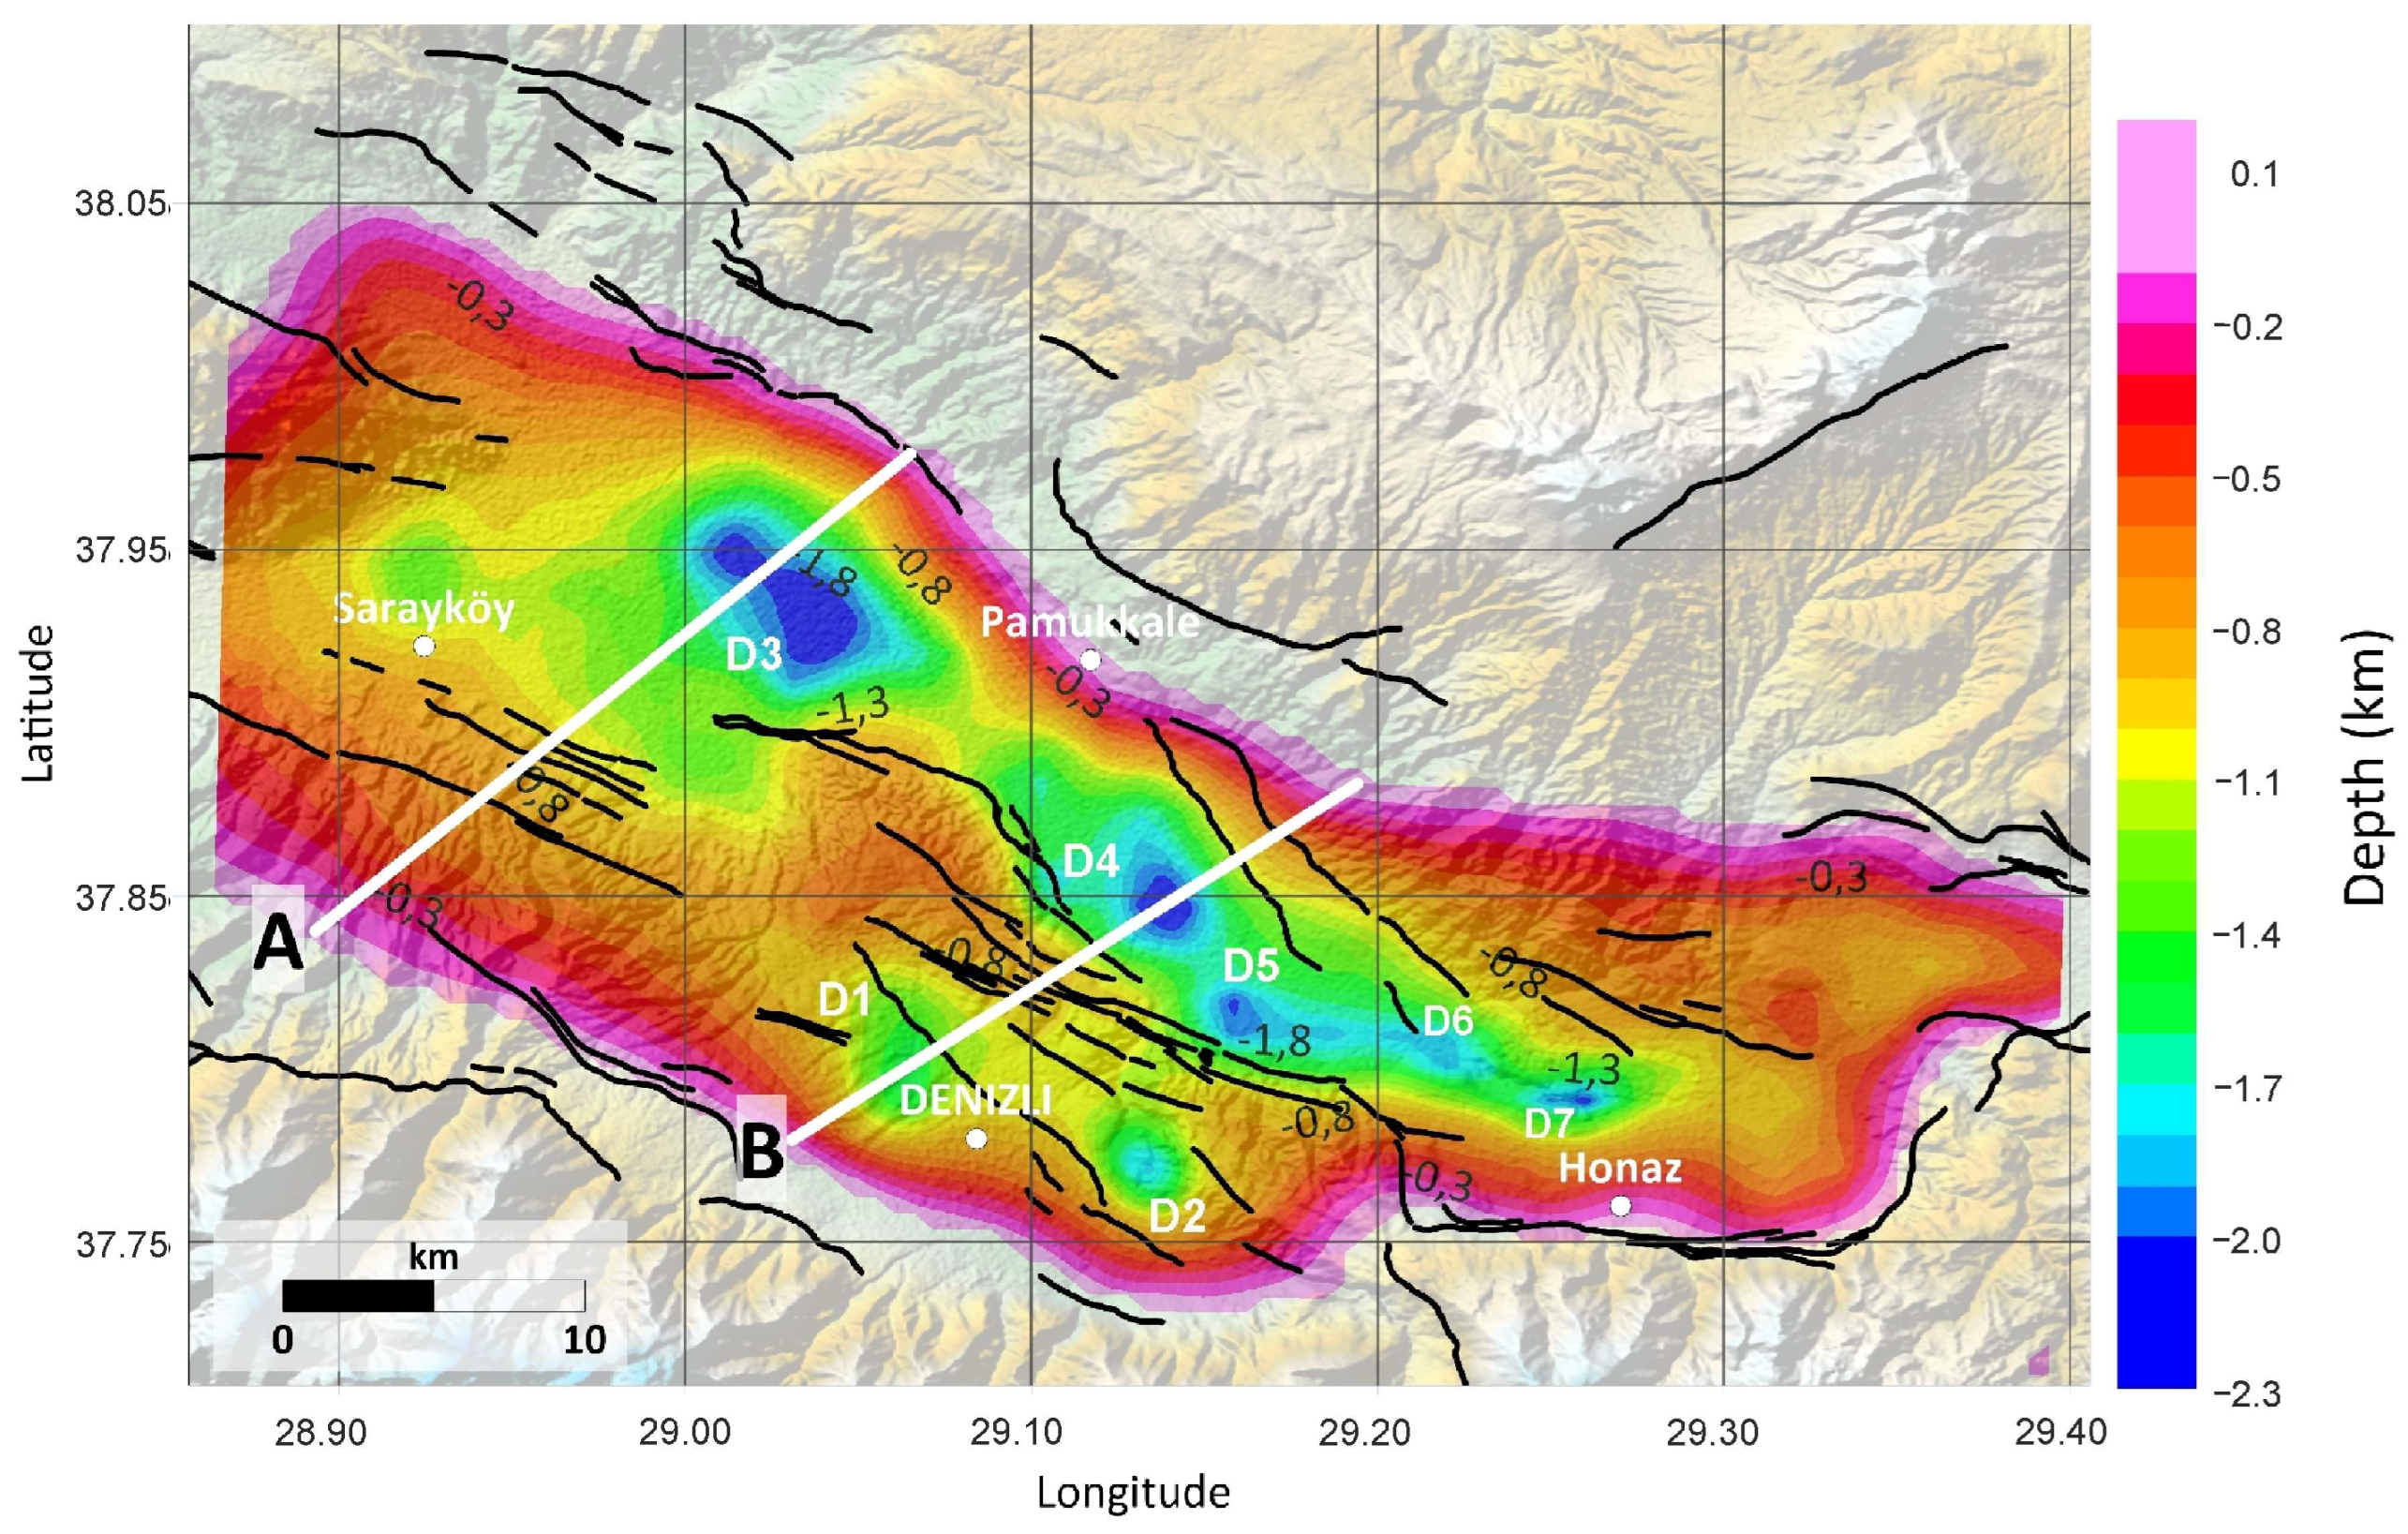
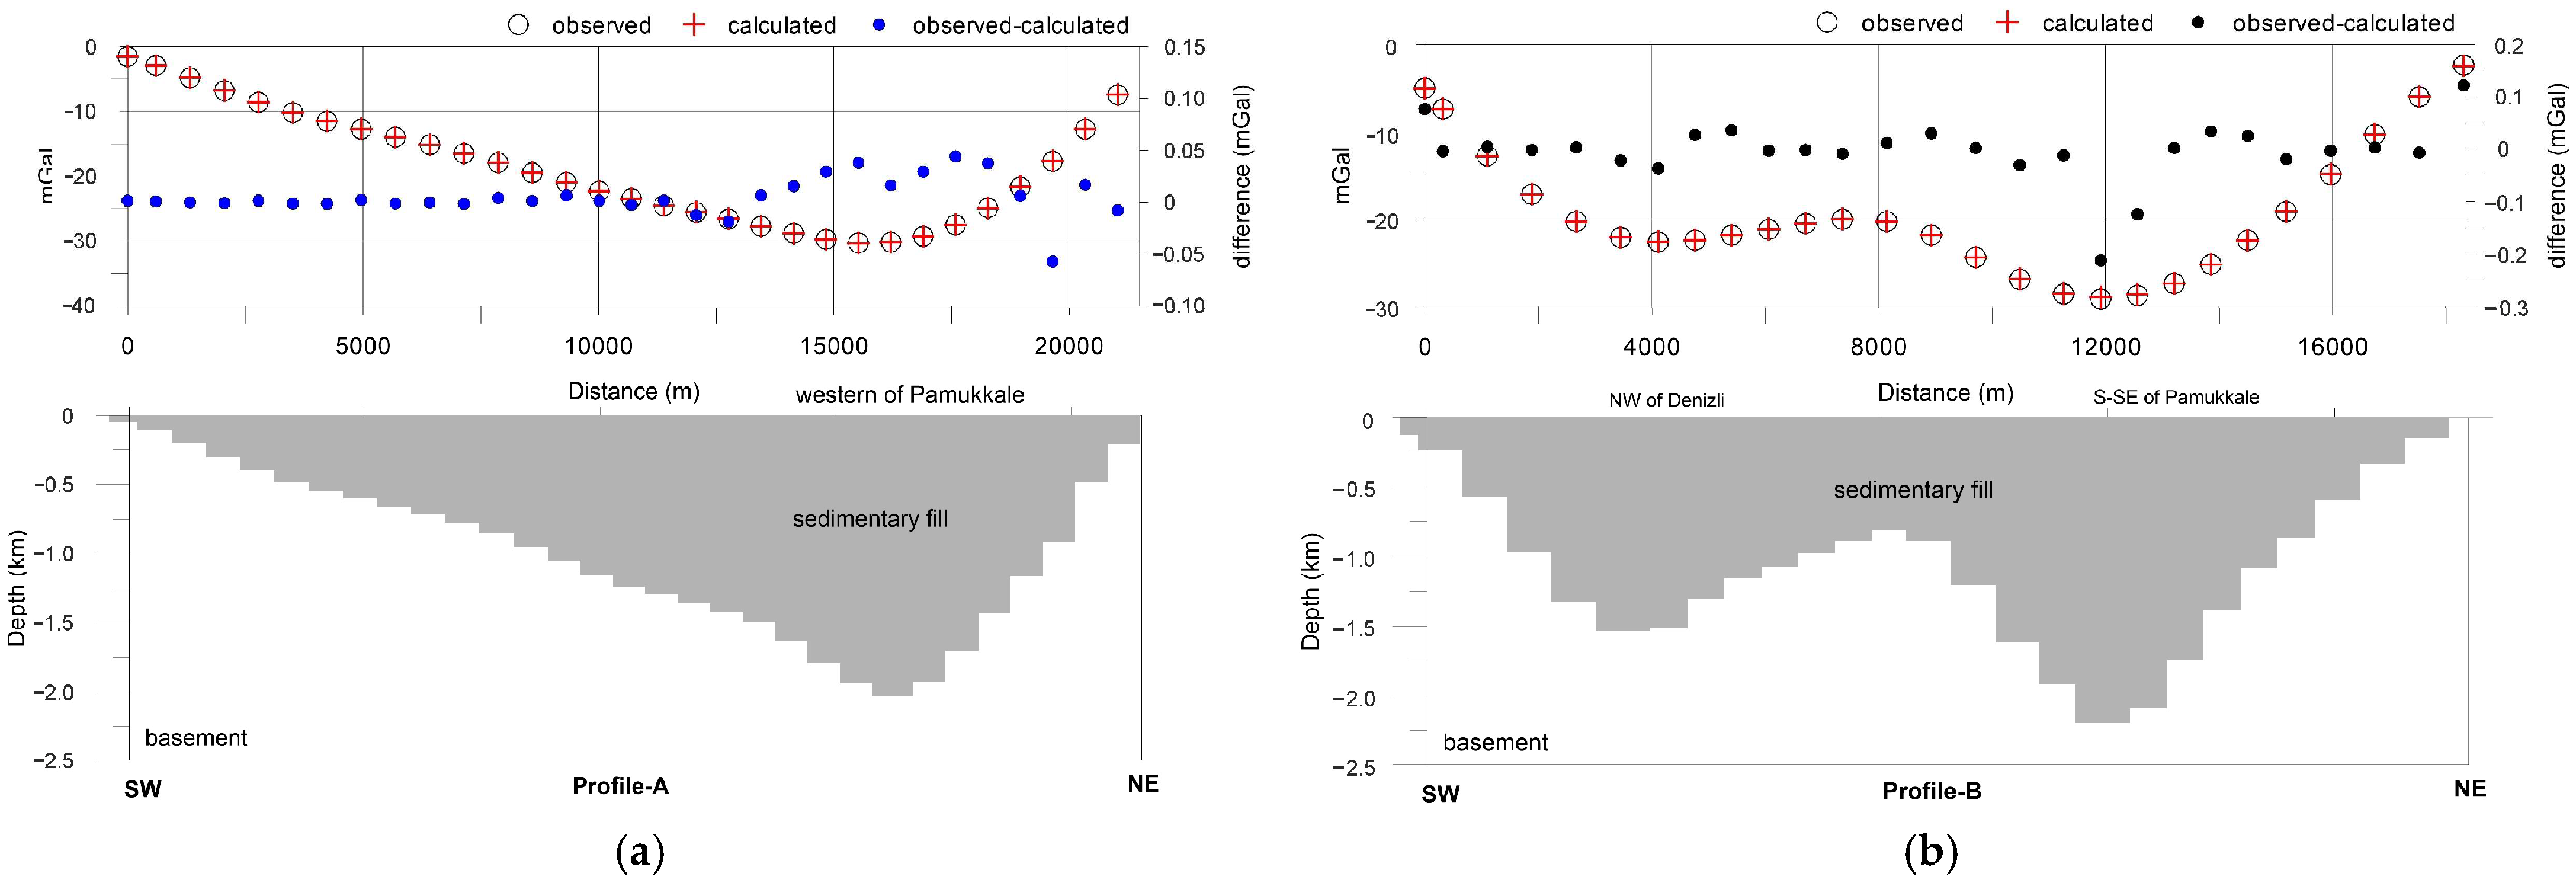
4.1. Sedimentary Basin Depth Model

Mapping the sediment- pre-Neogene basement topography is an important aspect of the geophysical investigation of oil, gas, and mineral resources. In the inversion of gravity data, the iteration ends when the RMS between the calculated and observed gravity data at any point of the iteration increases relative to the preceding step. In this case, the divergence criterion in the RMS error is used as the algorithm’s termination model. A window length of the three data points from the edges of the data was also not taken into consideration throughout the calculations in order to prevent edge effects. The termination of the iterative process has been achieved at the nineteenth iteration (Figure 4). The RMS error between the observed and calculated gravity anomalies of the initial depth approximation is 1.22 mGal and decreases to 0.32 mGal for the optimum solution. The obtained RMS error of 0.32 mGal corresponds to approximately 1% of the maximum amplitude of the input data. In gravity inversion depth modeling, this fit is a sufficient fit in terms of modeling.
The 3D sediment-basement depth configuration map has been enhanced after the nineteenth iteration was given in Figure 5. The pre-Neogene basement depths range from 0.1 km to 2.3 km. The Denizli Basin consists of two basins [19,32]. In the Laodikia sub-basin, there are two depression areas, D1 and D2, with a maximum thickness of 1.7 km and a ridge between these depressions. The Çürüksu Basin has an undulation structure. Five depressions are observed within the basin. The deepest depression region, D3, is located in the northern part of the basin with the largest areal extension settlement. Pamukkale travertine, the largest and most famous travertine formation that gives the name to Pamukkale Fault Zone, and many other geothermal field occurrences are close to the D3 depression. Another notable feature is a ridge located between the depressions D3 and D4 in the sediment topography. This ridge has a relatively shallow burial depth (about 1.2–1.6 km) and may contain structural traps such as faulted anticlines and fault block traps. This undulated structure was also given by the interpretation of seismic reflection data in the study [64]. This area could be a promising prospective area for hydrocarbon and geothermal exploration. The Çürüksu Basin narrows towards the Honaz district and three other depressions (D5, D6, and D7) are observed within the basin. In previous studies, Sarı and Şalk [56] analyzed the gravity anomalies of Western Anatolia with variable density contrast by 2D and 3D inversion techniques and they reported a sediment thickness of 2 km in the Denizli Graben. Altinoğlu [58] studied in the SW part of the Denizli region and reported a sediment thickness of 2–2.2 km in the Honaz region. In the study of Ekinci et al. [59], the authors conducted a study using gravity data inversion with global optimization to map basement reliefs of Western Anatolia Grabens. For a profile passing through the Denizli Graben located close to the northern edge of the graben, they presented an undulated structure and reported a basement depth of 1.4 km in the Pamukkale region and 0.86 km in the west of the Honaz district. In this study [59], the lithological log of some boreholes drilled by MTA for geothermal exploration in the Western Anatolian Grabens is given. In the sediment-basement depth map, the basement depth value of 700 m at the location corresponding to the W-1 borehole drilled in the Denizli Basin is very close to the geological information obtained from the lithological log of this well (hW-1 = 640 m). The gravity and seismic data of the Denizli region were studied by [64]. They determined the sediment thickness as 2.64 km in the Çürüksu Graben by evaluation of two seismic profiles in the Denizli Graben. The results of this study are relatively consistent with the results of previous studies.
The cross-section data from the inverted basin model, with the calculated and observed gravity anomalies along two profiles, are shown in Figure 6. Profile A starts from the north of Babadağ district and ends in the west of Pamukkale in the SW–NE direction. As demonstrated in Profile A, the sediment thickness is thin in the southwest and thickens towards the northeast. The NE boundary of the basin is steep. The observed and calculated anomalies are mostly in accordance and the maximum difference between the observed and calculated anomalies is 0.05 mGal in Profile A. Profile B starts from the west of Denizli province and first passes the Laodeika sub-basin, then the Karakova Horst, separating the Loadeika sub-basin and the Çürüksu Basin, and finally the Çürüksu Basin in the north. The pre-Neogene basement surface is at 1.5 km in the Laodeika sub-basin (D1 depression) and 2.2 km in the Çürüksu Basin (D4 depression). The pre-Neogene basement topography has been uplifted as seen in the central part of the basin model. The maximum difference between the observed and calculated anomalies is 0.2 mGal in Profile B.

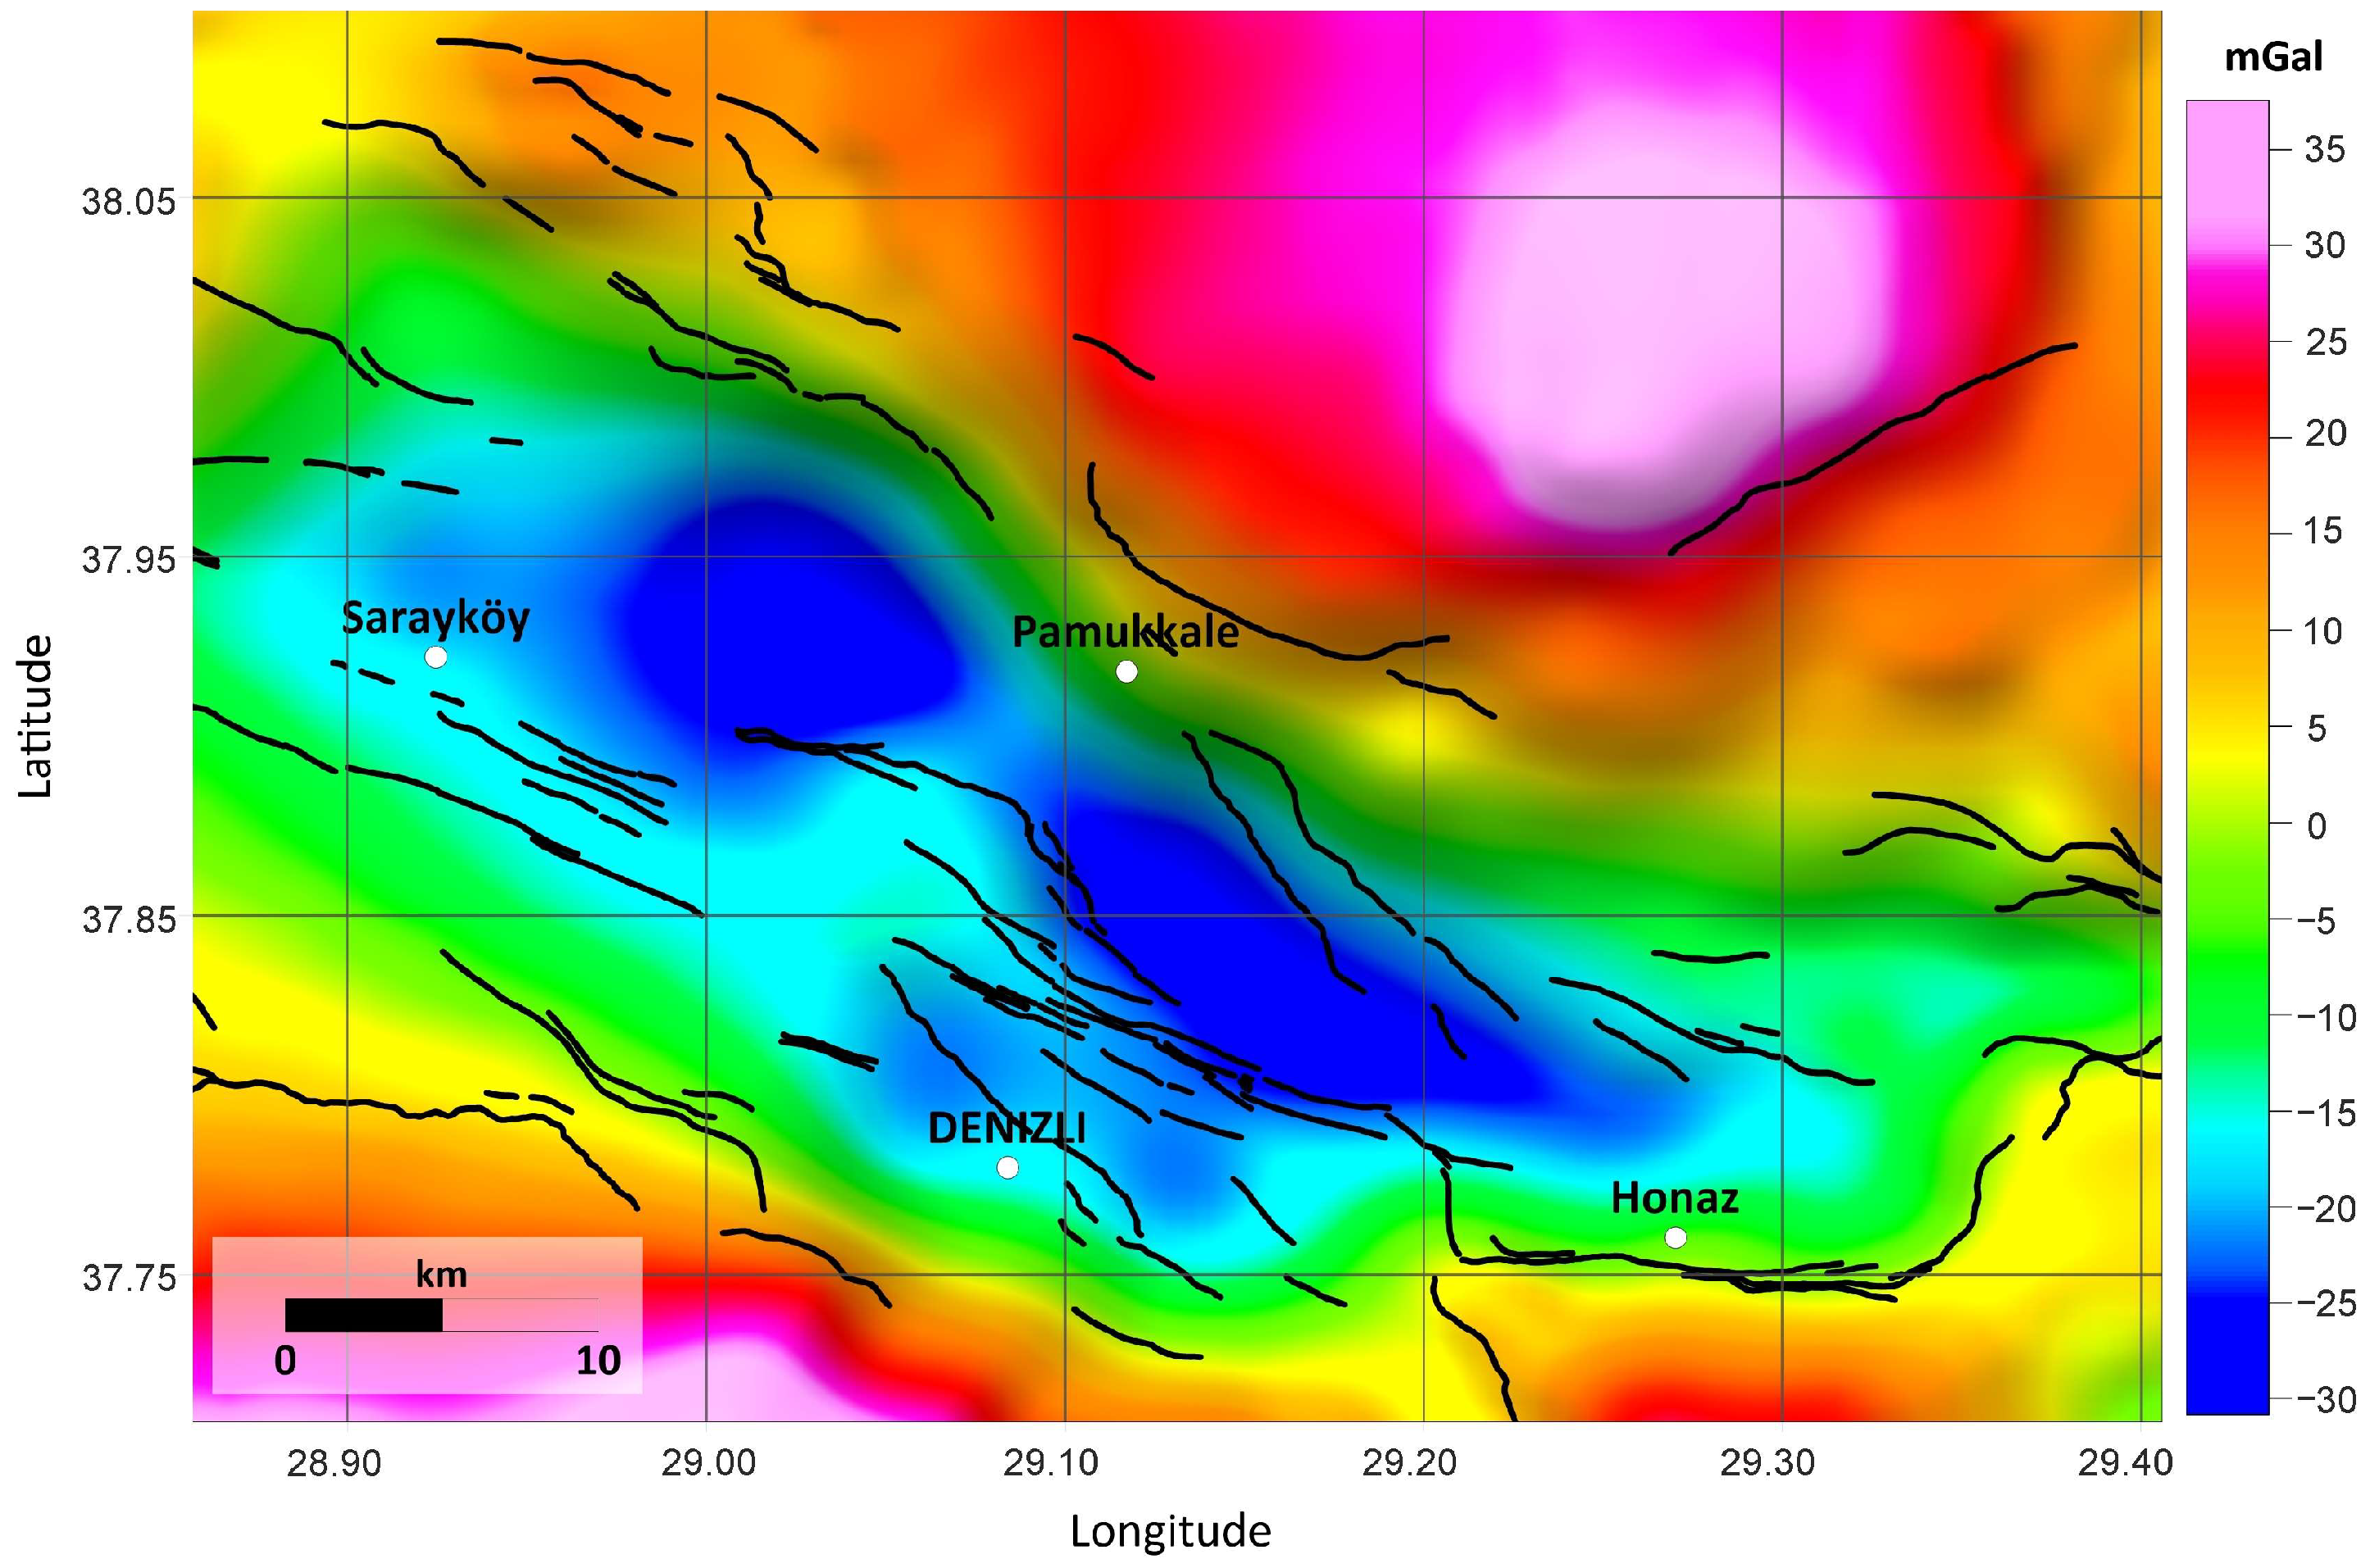
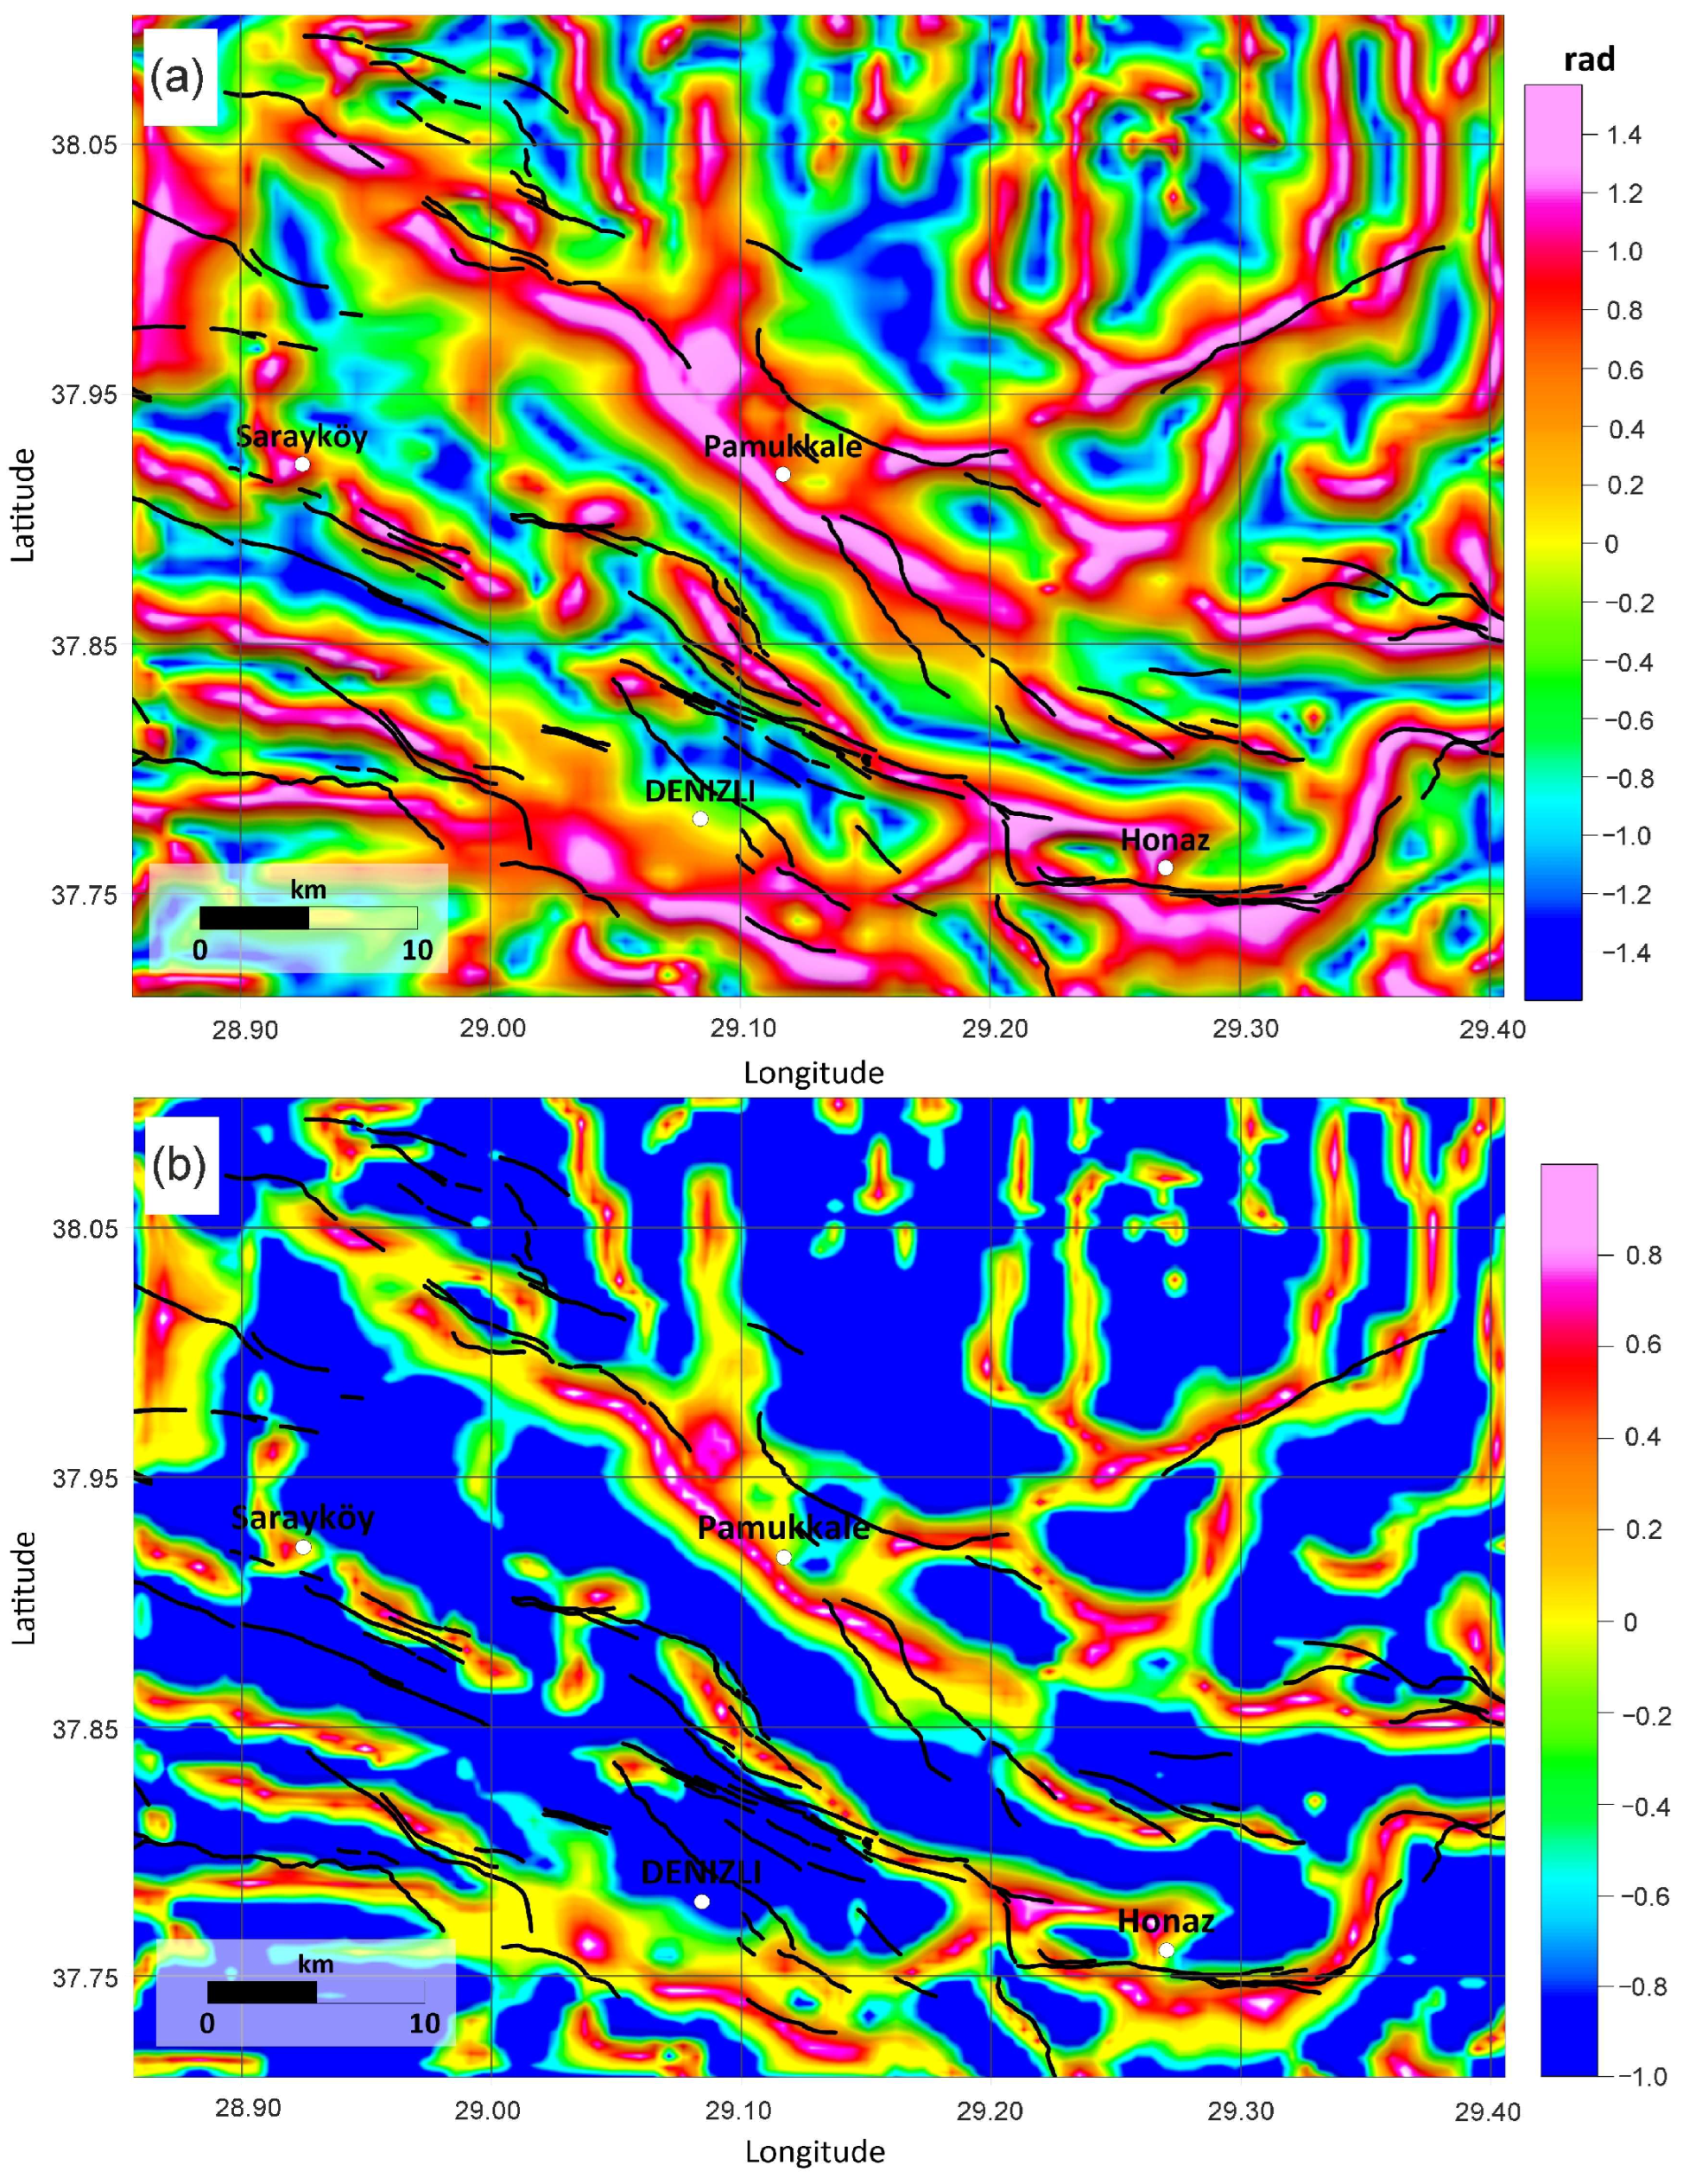
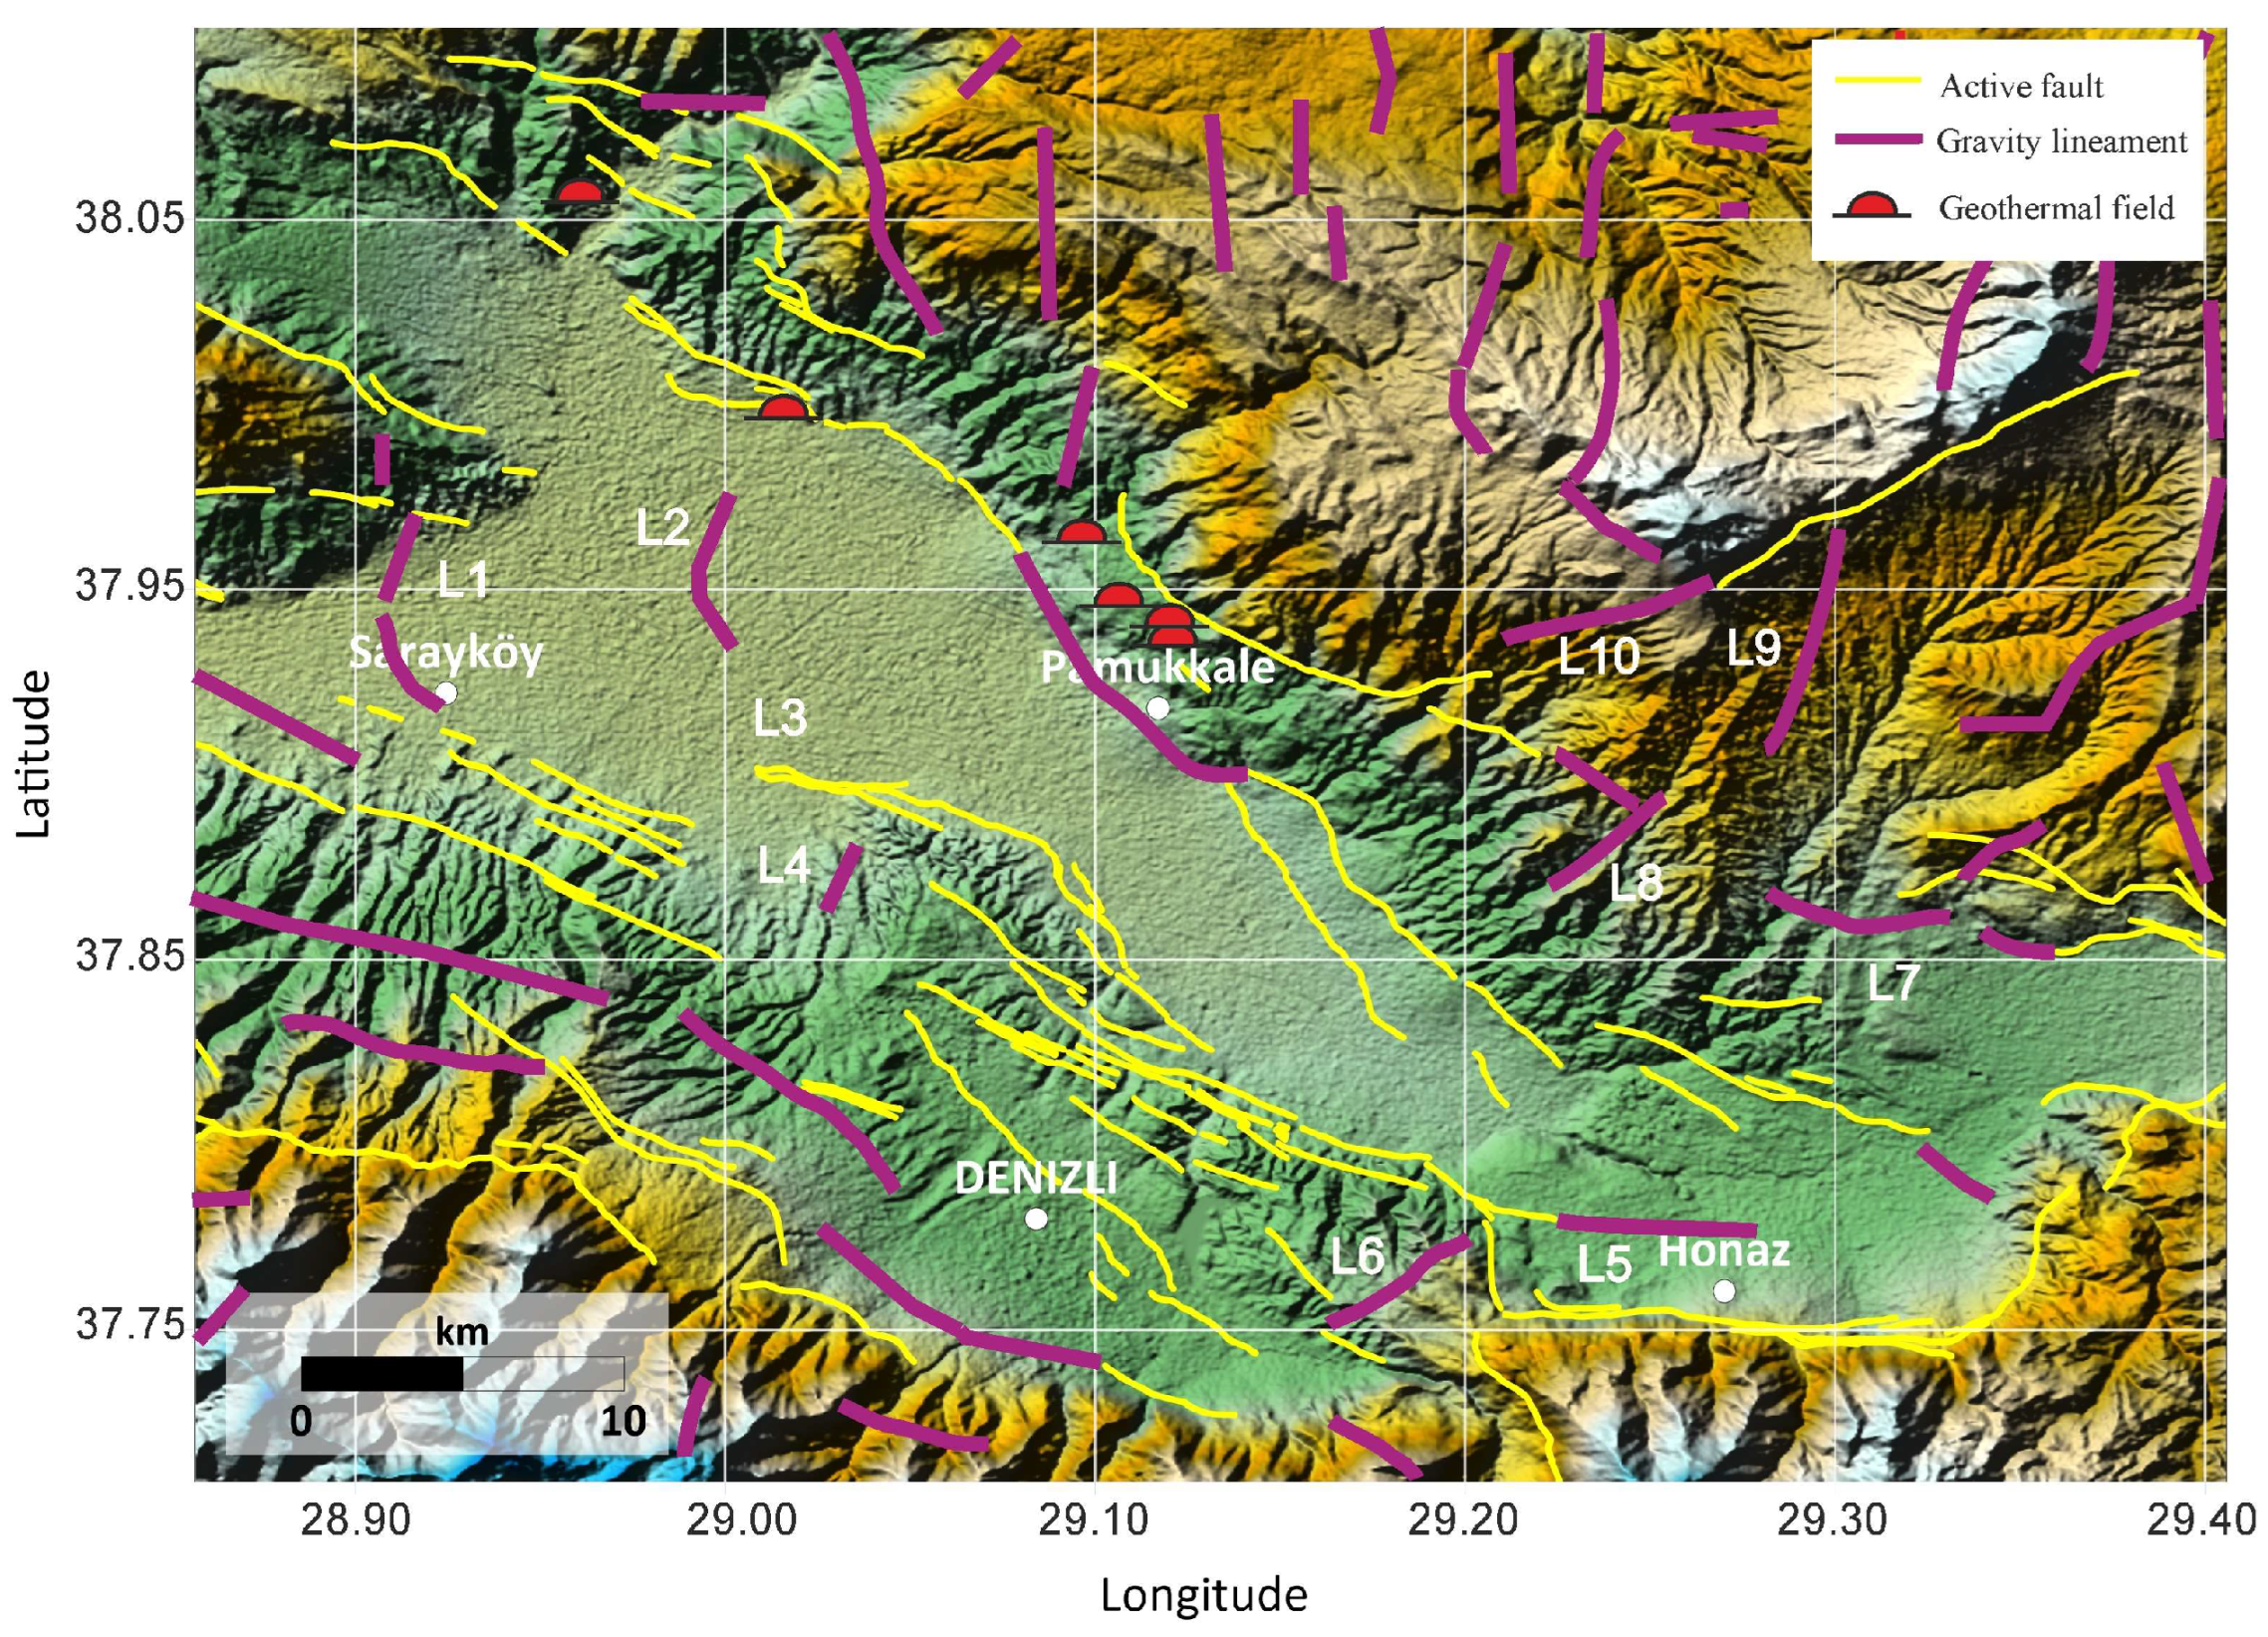
4.2. Lineament Detection

Lineaments are basically geological structures that represent faults, joints, lithological contacts, and shear zones which are important locations for gathering data in regional geological and tectonic investigations. Edge detection algorithms applied to gravity data are particularly effective for mapping linear features and identifying the boundaries of a geological structure [80,81,82,83,84]. The TAHG and FSED edge detection methods were applied to the residual gravity anomaly map of the Denizli region to determine lineaments. The maximum values of these maps are located at the boundaries of subsurface features and causative source bodies [78,80]. These new-generation filters have a higher resolution than traditional filters such as horizontal gradient, analytic signal, and tilt angle, which were previously applied to Western Anatolia gravity data [85]. These traditional filters based on the amplitude of the gravity gradients mainly have the disadvantage of being unable to equalize the amplitudes of anomalies caused by source bodies located at different depths. More detailed information about the filters can be found in [78].
The results indicate that the maximum positive anomalies of TAHG and FSED maps (Figure 7a,b) are consistent with the regional NW–SE structural trend and indicate many linear structures with different trends. On the other hand, the FSED map produced higher-resolution lineaments than the TAHG map.
The main boundary faults of the Denizli Graben, the Pamukkale Fault Zone in the north, the Babadağ Fault Zone in the southeast, and the Honaz fault in the south, are well delineated in the TAHG and FSED maps. Additionally, the Kaleköy Fault Zone, which separates the Çürüksu Basin and Laodeika sub-basin, can easily be seen on the maps. The newly identified linear structures will be referred to as “L” in the text. As a result of this study, many lineaments were identified, but buried structures and intersecting lineaments were emphasized. The new proposed lineament map of the study area is given in Figure 8.
Lineaments L1, L2, L3, and L4 are probably buried structures under the sedimentary fill (Figure 8). Lineament L1 extends from the Sarayköy fault to the north in an approximately N–S direction. The intersection of this new lineament with the Sarayköy fault is promising for hydrocarbon and geothermal exploration. This is because there are many geothermal fields and hot springs around this region (Kızıldere, Ortakçı, Umut thermal, Buldan, Yenice-Kamara). Lineament L2 is located between Sarayköy and Pamukkale and is extended in the N–S direction and borders the D3 depression in the sediment. The NW–SE trending L3 lineament is extended from the north of the Kaleköy Fault Zone and also borders the D3 depression from the south. The N–S trending lineament, L4, borders the Karakova Horst from the west. Lineament L5 may have been the extension of the Kaleköy fault towards the Honaz district, which was also suggested by [58]. This segment is probably buried in the sediment fill and so is undefined in the active fault map. Another NE–SW trending Lineament, L6, has been detected west of the Karateke village, in the western part of the Honaz region. The existence of travertine occurrences and springs around this region was mentioned in [44,86] when the authors declared that the travertine occurrences in the Denizli Basin are related to the fault system. In addition, the L7 lineament may have been the westward continuation of the Kaklık fault.
The other NE–SW directional lineaments have been identified in the east-northeast part of the study area, south of the Çökelezdağ Horst. Some other newly detected NE–SW direction lineaments (L8, L9, and L10) are extended from south of the Çökelez Horst to the Pamukkale Fault Zone. These NE–SW trending lineaments may have developed under the influence of the NW–SE trending expansion phase, as suggested in [86]. The intersection areas of these divergent linear structures can be possible sites for mineral deposition investigations.

5. Conclusions

The Denizli Graben area is an important structure of the Western Anatolia Horst Graben system. The basin hosts many geothermal areas, hot springs, and travertine deposits. The Denizli Graben consists of Çürüksu Graben and Laodikia sub-graben, as mentioned in previous geological studies. The sediment–pre-Neogene basement interface topography of the whole Denizli Basin is established in this study. The deepest and the largest areal depression region of Çürüksu Graben is in the Pamukkale region with a 2.3 km depth. The basin narrows towards the south. The ridges between two depressions may be a tectonic uplift or basement ridge and could be the initial exploration area for hydrocarbon or geothermal exploration. The produced lineament map of the region includes many lineaments in different orientations which are unspecified in the active fault map of MTA. These lineaments and their intersection points with each other or known faults are suggested as the key structures to look for in geothermal, travertine, and mineral exploration studies.

Funding

This research received no external funding.

Data Availability Statement

The data presented in this study are not publicly available due to the fact that they must be taken from the General Directory of Mineral Exploration and Research Company of Turkey (MTA) and Turkish Petroleum Corporation (TPAO).

Conflicts of Interest

The authors declare no conflict of interest.

References

  1. Satyakumar, A.V.; Pandey, A.K.; Singh, A.P.; Tiwari, V.M. Delineation of structural and tectonic features in the Mahanadi basin, eastern India: New insights from remote sensing and land gravity data. J. Asian Earth Sci. 2022, 227, 105116. [Google Scholar] [CrossRef]
  2. Pham, L.T.; Oksum, E.; Kafadar, O.; Trinh, P.T.; Nguyen, D.V.; Vo, Q.T.; Le, S.T.; Do, T.D. Determination of subsurface lineaments in the Hoang Sa islands using enhanced methods of gravity total horizontal gradient. Vietnam J. Earth Sci. 2022, 44, 395–409. [Google Scholar]
  3. Alrefaee, H.; Soliman, M.; Merghelani, T. Interpretation of the subsurface tectonic setting of the Natrun Basin, north Western Desert, Egypt using Satellite Bouguer gravity and magnetic data. J. Afr. Earth Sci. 2022, 187, 104450. [Google Scholar] [CrossRef]
  4. Liu, J.; Li, S.; Jiang, S.; Wang, X.; Zhang, J. Tools for Edge Detection of Gravity Data: Comparison and Application to Tectonic Boundary Mapping in the Molucca Sea. Surv. Geophys. 2023, 1–30. [Google Scholar] [CrossRef]
  5. Kamto, P.G.; Oksum, E.; Pham, L.T.; Kamguia, J. Contribution of advanced edge detection filters for the structural mapping of the Douala Sedimentary Basin along the Gulf of Guinea. Vietnam. J. EARTH Sci. 2023. [Google Scholar] [CrossRef]
  6. Chakravarthi, V.; Shankar, G.B.K.; Muralidharan, D.; Harinarayana, T.; Sundararajan, N. An integrated geophysical approach for imaging subbasalt sedimentary basins: Case study of Jam River Basin, India. Geophysics 2007, 72, B141–B147. [Google Scholar] [CrossRef]
  7. Silva, J.B.; Oliveira, A.S.; Barbosa, V.C. Gravity inversion of 2D basement relief using entropic regularization. Geophysics 2010, 75, I29–I35. [Google Scholar] [CrossRef]
  8. Babu, H.R. Basement structure of the Cuddapah Basin from gravity anomalies. Tectonophysics 1993, 223, 411–422. [Google Scholar] [CrossRef]
  9. Blakely, R.J.; Christiansen, R.L.; Guffanti, M.; Wells, R.E.; Donnelly-Nolan, J.M.; Muffler, L.J.P.; Clynne, M.A.; Smith, J.G. Gravity anomalies, Quaternary vents, and Quaternary faults in the southern Cascade Range, Oregon and California: Implications for arc and backarc evolution. J. Geophys. Res. Solid Earth 1997, 102, 22513–22527. [Google Scholar] [CrossRef]
  10. Aydogan, D. Extraction of lineaments from gravity anomaly maps using the gradient calculation: Application to Central Anatolia. Earth Planets Space 2011, 63, 903–913. [Google Scholar] [CrossRef]
  11. Cherepanova, Y.; Artemieva, I.M.; Thybo, H.; Chemia, Z. Crustal structure of the Siberian craton and the West Siberian basin: An appraisal of existing seismic data. Tectonophysics 2013, 609, 154–183. [Google Scholar] [CrossRef]
  12. Anukwu, G.C.; Khalil, A.E.; Nawawi, M.; Younis, A.M. Delineation of shallow structures in the vicinity of Ulu Slim hot spring using seismic refraction and MASW techniques. NRIAG J. Astron. Geophys. 2020, 9, 7–15. [Google Scholar] [CrossRef]
  13. Salaun, N.; Toubiana, H.; Mitschler, J.-B.; Gigou, G.; Carriere, X.; Maurer, V.; Richard, A. High-resolution 3D seismic imaging and refined velocity model building improve the image of a deep geothermal reservoir in the Upper Rhine Graben. Geophysics 2020, 39, 857–863. [Google Scholar] [CrossRef]
  14. Jackson, J.A.; Mckenzie, D.P. The relationship between plate motions and seismic moment tensors and rates of active de-formation in the Mediterranean and Middle East. Geophys. J. Int. 1988, 93, 45–73. [Google Scholar] [CrossRef]
  15. Westaway, R. Neogene evolution of the Denizli region of western Turkey. J. Struct. Geol. 1993, 15, 37–53. [Google Scholar] [CrossRef]
  16. McKenzie, D. Active tectonics of the Alpine—Himalayan belt: The Aegean Sea and surrounding regions. Geophys. J. Int. 1978, 55, 217–254. [Google Scholar] [CrossRef]
  17. Şengör, A.M.C.; Yilmaz, Y. Tethyan evolution of Turkey: A plate tectonic approach. Tectonophysics 1981, 75, 181–241. [Google Scholar] [CrossRef]
  18. Bozkurt, E. Origin of NE-trending basins in western Turkey. Geodin. Acta 2003, 16, 61–81. [Google Scholar] [CrossRef]
  19. Kaymakçı, N. Kinematic development and paleostress analysis of the Denizli Basin (Western Turkish): Implications of spatial variation of relative paleostress magnitudes and orientations. J. Asian Earth Sci. 2006, 27, 207–222. [Google Scholar] [CrossRef]
  20. Jolivet, L.; Faccenna, C.; Huet, B.; Labrousse, L.; Le Pourhiet, L.; Lacombe, O.; Lecomte, E.; Burov, E.; Denèle, Y.; Brun, J.-P.; et al. Aegean tectonics: Strain localisation, slab tearing and trench retreat. Tectonophysics 2012, 597-598, 1–33. [Google Scholar] [CrossRef]
  21. Faccenna, C.; Becker, T.W.; Auer, L.; Billi, A.; Boschi, L.; Brun, J.P.; Capitanio, F.A.; Funiciello, F.; Horvàth, F.; Jolivet, L.; et al. Mantle dynamics in the Mediterranean. Rev. Geophys. 2014, 52, 283–332. [Google Scholar] [CrossRef]
  22. Dewey, J.F.; Şengör, A.M.C. Aegean and surrounding regions: Complex multiplate and continuum tectonics in a convergent zone. Geol. Soc. Am. Bull. 1979, 90, 84–92. [Google Scholar] [CrossRef]
  23. Bozkurt, E.; Mittwede, S.K. Introduction: Evolution of continental extensional tectonics of western Turkey. Geodin. Acta 2005, 18, 153–165. [Google Scholar] [CrossRef]
  24. Şengör, A.M.C.; Görür, N.; Şaroglu, F. Strike-slip faulting and related basin formation in zones of tectonic escape: Turkey as a case study. In Strike-slip Deformation, Basin Formation and Sedimentation; Biddle, K.T., Christie-Blick, N., Eds.; SEPM Society for Sedimentary Geology: Tulsa, OK, USA, 1985; Volume 37, pp. 227–264. [Google Scholar]
  25. Le Pichon, X.; Angelier, J. The hellenic arc and trench system: A key to the neotectonic evolution of the eastern mediterranean area. Tectonophysics 1979, 60, 1–42. [Google Scholar] [CrossRef]
  26. Le Pichon, X.; Angelier, J. The Aegean sea. Philos. Trans. R. Soc. Lond. 1981, 72, 300–357. [Google Scholar]
  27. Dewey, J.F. Extensional collapse of orogens. Tectonics 1988, 7, 1123–1139. [Google Scholar] [CrossRef]
  28. Seyitoglu, G.; Scott, B.C. Age of the Alasehir graben (west Turkey) and its tectonic implications. Geol. J. 1996, 31, 1–11. [Google Scholar] [CrossRef]
  29. Dilek, Y.; Whitney, D.L. Cenozoic crustal evolution in central Anatolia: Extension, magmatism, and landscape development. In Proceedings, Third International Conference on the Geology of the Eastern Mediterranean; Panayides, I., Xenophontos, C., Malpas, J., Eds.; Geological Survey Department: Nicosia, Cyprus, 2000; pp. 183–192. [Google Scholar]
  30. Koçyiğit, A.; Yusufoğlu, H.; Bozkurt, E. Evidence from the Gediz graben for episodic two-stage extension in western Turkey. J. Geol. Soc. 1999, 156, 605–616. [Google Scholar] [CrossRef]
  31. Sözbilir, H. Extensional tectonics and the geometry of related macroscopic structures: Field evidence from the Gediz de-tachment, western Turkey. Turk. J. Earth Sci. 2001, 10, 51–67. [Google Scholar]
  32. Koçyiğit, A. The Denizli graben-horst system and the eastern limit of western Anatolian continental extension: Basin fill, structure, deformational mode, throw amount and episodic evolutionary history, SW Turkey. Geodin. Acta 2005, 18, 167–208. [Google Scholar] [CrossRef]
  33. Gessner, K.; Gallardo, L.A.; Markwitz, V.; Ring, U.; Thomson, S.N. What caused the denudation of the Menderes Massif: Review of crustal evolution, lithosphere structure, and dynamic topography in southwest Turkey. Gondwana Res. 2013, 24, 243–274. [Google Scholar] [CrossRef]
  34. Yilmaz, M.; Gelisli, K. Stratigraphic–structural interpretation and hydrocarbon potential of the Alaşehir Graben, western Turkey. Pet. Geosci. 2003, 9, 277–282. [Google Scholar] [CrossRef]
  35. Çiftçi, N.B.; Temel, R.; Iztan, Y.H. Hydrocarbon occurrences in the western Anatolian (Aegean) grabens, Turkey: Is there a working petroleum system? AAPG Bull. 2010, 94, 1827–1857. [Google Scholar] [CrossRef]
  36. Altan, Z.; Ocakoğlu, N.; Böhm, G.; Sarıkavak, K.T. Seismic Events in The Upper Miocene–Pliocene Sed-Imentary Succession In The Gulf Of Izmir (Western Anatolia): Implications for Hydrocarbon Prospectivity. J. Pet. Geol. 2020, 43, 209–224. [Google Scholar] [CrossRef]
  37. Demircioğlu, D.; Ecevitoğlu, B.; Seyitoğlu, G. Evidence of a rolling hinge mechanism in the seismic records of the hydrocarbon-bearing Alaşehir graben, western Turkey. Pet. Geosci. 2010, 16, 155–160. [Google Scholar] [CrossRef]
  38. Tüfekçi, N.; Süzen, M.L.; Güleç, N. GIS based geothermal potential assessment: A case study from Western Anatolia, Turkey. Energy 2010, 35, 246–261. [Google Scholar] [CrossRef]
  39. Erkan, K. Geothermal investigations in western Anatolia using equilibrium temperatures from shallow boreholes. Solid Earth 2015, 6, 103–113. [Google Scholar] [CrossRef]
  40. Baba, A.; Sözbilir, H. Source of arsenic based on geological and hydrogeochemical properties of geothermal systems in Western Turkey. Chem. Geol. 2012, 334, 364–377. [Google Scholar] [CrossRef]
  41. Şimşek, Ş. Geothermal model of Denizli, Sarayköy-Buldan area. Geothermics 1985, 14, 393–417. [Google Scholar] [CrossRef]
  42. Özgür, N. Geochemical signature of the Kizildere geothermal field, western Anatolia, Turkey. Int. Geol. Rev. 2002, 44, 153–163. [Google Scholar] [CrossRef]
  43. De Filippis, L.; Faccenna, C.; Billi, A.; Anzalone, E.; Brilli, M.; Soligo, M.; Tuccimei, P. Plateau versus fissure ridge travertines from Quaternary geothermal springs of Italy and Turkey: Interactions and feedbacks between fluid discharge, paleoclimate, and tectonics. Earth Sci. Rev. 2013, 123, 35–52. [Google Scholar] [CrossRef]
  44. Brogi, A.; Alçiçek, M.C.; Yalçıner, C.; Capezzuoli, E.; Liotta, D.; Meccheri, M.; Rimondi, V.; Ruggieri, G.; Gandin, A.; Boschi, C.; et al. Hydrothermal fluids circulation and travertine deposition in an active tectonic setting: Insights from the Kamara geothermal area (western Anatolia, Turkey). Tectonophysics 2016, 680, 211–232. [Google Scholar] [CrossRef]
  45. Brogi, A.; Alçiçek, M.C.; Liotta, D.; Capezzuoli, E.; Zucchi, M.; Matera, P.F. Step-over fault zones controlling geothermal fluid-flow and travertine formation (Denizli Basin, Turkey). Geothermics 2020, 89, 101941. [Google Scholar] [CrossRef]
  46. Tarcan, G.; Özen, T.; Gemici, Ü.; Çolak, M.; Karamanderesi, İ.H. Geochemical assessment of mineral scaling in Kızıldere geothermal field, Turkey. Environ. Earth Sci. 2016, 75, 1317. [Google Scholar] [CrossRef]
  47. Karamanderesi, İ.H.; Ölçenoğlu, K. Geology of the Denizli Sarayköy (Gerali) Geothermal Field, Western Anatolia, Turkey. In Proceedings of the World Geothermal Congress, Antalya, Turkey, 24–29 April 2005. [Google Scholar]
  48. Mesci, B.L.; Tatar, O.; Piper, J.D.A.; Gürsoy, H.; Altunel, E.; Crowley, S. The efficacy of travertine as a palaeoenvironmental indicator: Palaeomagnetic study of neotectonic examples from Denizli, Turkey. Turk. J. Earth Sci. 2013, 22, 191–203. [Google Scholar] [CrossRef]
  49. Altunel, E.; Karabacak, V. Determination of horizontal extension from fissure-ridge travertines: A case study from the Denizli Basin, southwestern Turkey. Geodin. Acta 2005, 18, 333–342. [Google Scholar] [CrossRef]
  50. Çakır, Z. Along-strike discontinuity of active normal faults and its influence on Quaternary travertine deposition; examples from western Turkey. Turk. J. Earth Sci. 1999, 8, 67–80. [Google Scholar]
  51. Erees, F.S.; Aytas, S.; Sac, M.M.; Yener, G.; Salk, M. Radon concentrations in thermalwaters related to seismic events along faults in the Denizli Basin, Western Turkey. Radiat. Meas. 2007, 42, 80–86. [Google Scholar] [CrossRef]
  52. Van Noten, K.; Topal, S.; Baykara, M.O.; Özkul, M.; Claes, H.; Aratman, C.; Swennen, R. Pleistocene-Holocene tectonic reconstruction of the Ballık travertine (Denizli Graben, SW Turkey): (De) formation of large travertine geobodies at inter-secting grabens. J. Struct. Geol. 2019, 118, 114–134. [Google Scholar] [CrossRef]
  53. Ozkul, M.; Varol, B.; Alcicek, M.C. Depositional environments and petrography of Denizli travertines. Bull. Miner. Res. Explor. 2002, 125, 13–29. [Google Scholar]
  54. Hançer, M. Study of the structural evolution of the Babadağ-Honaz and Pamukkale fault zones and the related earthquake risk potential of the Buldan region in SW Anatolia, east of the Mediterranean. J. Earth Sci. 2013, 24, 397–409. [Google Scholar] [CrossRef]
  55. Seyïtoğlu, G.; Işik, V. Late Cenozoic Extensional Tectonics in Western Anatolia: Exhumation of the Menderes Core Complex and Formation of Related Basins. Bull. Miner. Res. Explor. 2015, 151, 47–106. [Google Scholar] [CrossRef]
  56. Sarı, C.; Şalk, M. Sediment thickness of the Western Anatolia graben structures determined by 2D and 3D analysis using graviy data. J. Asian Earth Sci. 2006, 26, 39–48. [Google Scholar] [CrossRef]
  57. Altinoğlu, F.F.; Sari, M.; Aydin, A. Detection of Lineaments in Denizli Basin of Western Anatolia Region Using Bouguer Gravity Data. Pure Appl. Geophys. 2015, 172, 415–425. [Google Scholar] [CrossRef]
  58. Altinoğlu, F.F. Structural interpretation of SW part of Denizli, Turkey, based on gravity data analysis. Arab. J. Geosci. 2020, 13, 1–16. [Google Scholar] [CrossRef]
  59. Ekinci, Y.L.; Balkaya, Ç.; Göktürkler, G.; Özyalın, Ş. Gravity data inversion for the basement relief delineation through global optimization: A case study from the Aegean Graben System, western Anatolia, Turkey. Geophys. J. Int. 2020, 224, 923–944. [Google Scholar] [CrossRef]
  60. Akkuş, I.; Akıllı, H.; Ceyhan, S.; Dilemre, A.; Tekin, Z. Inventory of Turkey Geothermal Sources, Inventory Series-201; MTA General Directorate of Mineral Research and Exploration Publications: Ankara, Turkey, 2005. [Google Scholar]
  61. Bilim, F. Investigation into the tectonic lineaments and thermal structure of Kutahya-Denizli region western Anatolia, from using aeromagnetic, gravity and seismological data. Phys. Earth Planet. Inter. 2007, 165, 135–146. [Google Scholar] [CrossRef]
  62. Kaypak, B.; Gökkaya, G. 3D imaging of the upper crust beneath the Denizli geothermal region by local earthquake tomog-raphy, western Turkey. J. Volcanol. Geotherm. Res. 2012, 211–212, 47–60. [Google Scholar] [CrossRef]
  63. Irmak, T.S. Focal mechanisms of small-moderate earthquakes in Denizli Graben (SW Turkey). Earth Planets Space 2013, 65, 943–955. [Google Scholar] [CrossRef]
  64. Erbek-Kiran, E.; Ates, A.; Dolmaz, M.N. Upper Crustal Structure of Denizli Graben (Western Turkey) From Bouguer Gravity Data and Seismic Reflection Sections. Surv. Geophys. 2022, 43, 1947–1966. [Google Scholar] [CrossRef]
  65. Sun, S. Denizli Uşak Arasının Jeolojisi ve Linyit Olanakları. [Geology and Lignite Occurrences of Denizli and Uşak Region]; MTA Report, No: 9985; MTA: Ankara, Turkey, 1990; (in Turkish with English abstract).
  66. Sözbilir, H. Geometry and origin of folding in the Neogene sediments of the Gediz Graben, western Anatolia, Turkey. Geo-Din. Acta 2002, 15, 277–288. [Google Scholar] [CrossRef]
  67. Emre, Ö.; Duman, T.Y.; Özalp, S.; Elmacı, H. 1:250,000 Scale Active Fault Map Series of Turkey, Denizli (NJ 35-12) Quad-Rangle; Serial Number: 12; General Directorate of Mineral Research and Exploration: Ankara, Turkey, 2011. [Google Scholar]
  68. Pham, L.T.; Oksum, E.; Do, T.D. GCH_gravinv: A MATLAB-based program for inverting gravity anomalies over sedimentary basins. Comput. Geosci. 2018, 120, 40–47. [Google Scholar] [CrossRef]
  69. Cordell, L. Gravity analysis using an exponential density-depth function; San Jacinto Graben, California. Geophysics 1973, 38, 684–690. [Google Scholar] [CrossRef]
  70. Granser, H. Three-dimensional interpretation of gravity data from sedimentary basins using an exponential density-depth function. Geophys. Prospect. 1987, 35, 1030–1041. [Google Scholar] [CrossRef]
  71. Cordell, L.; Henderson, R.G. Iterative three-dimensional solution of gravity anomaly data using a digital computer. Geophysics 1968, 33, 596–601. [Google Scholar] [CrossRef]
  72. Cordell, L.; Grauch, V.J.S. Mapping basement magnetization zones from aeromagnetic data in the San Juan Basin, New Mexico. In The Utility of Regional Gravity and Magnetic Map, 1st ed.; Hinze, W.J., Ed.; Society of Exploration Geophysicists: Tulsa, OK, USA, 1985; pp. 181–197. [Google Scholar]
  73. Roest, W.R.; Verhoef, J.; Pilkington, M. Magnetic interpretation using the 3-D analytic signal. Geophysics 1992, 57, 116–125. [Google Scholar] [CrossRef]
  74. Verduzco, B.; Fairhead, J.D.; Green, C.M.; MacKenzie, C. New insights into magnetic derivatives for structural mapping. Geophysics 2004, 23, 116–119. [Google Scholar] [CrossRef]
  75. Wijns, C.; Perez, C.; Kowalczyk, P. Theta map: Edge detection in magnetic data. Geophysics 2005, 70, L39–L43. [Google Scholar] [CrossRef]
  76. Miller, H.G.; Singh, V. Potential field tilt—A new concept for location of potential field sources. J. Appl. Geophys. 1994, 32, 213–217. [Google Scholar] [CrossRef]
  77. Ferreira, F.J.; de Souza, J.; Bongiolo, d.B.e.S.A.; de Castro, L.G. Enhancement of the total horizontal gradient of magnetic anomalies using the tilt angle. Geophysics 2013, 78, J33–J41. [Google Scholar] [CrossRef]
  78. Oksum, E.; Le, D.V.; Vu, M.D.; Nguyen, T.H.T.; Pham, L.T. A novel approach based on the fast sigmoid function for inter-pretation of potential field data. Bull. Geophys. Oceanogr. 2021, 62, 543–556. [Google Scholar]
  79. USGS. Available online: https://earthexplorer.usgs.gov (accessed on 8 September 2023).
  80. Sahoo, S.D.; Pal, S.K. Mapping of Structural Lineaments and Fracture Zones around the Central Indian Ridge (10°S–21°S) using EIGEN 6C4 Bouguer Gravity Data. J. Geol. Soc. India 2019, 94, 359–366. [Google Scholar] [CrossRef]
  81. Essa, K.S.; Nady, A.G.; Mostafa, M.S.; Elhussein, M. Implementation of potential field data to depict the structural lineaments of the Sinai Peninsula, Egypt. J. Afr. Earth Sci. 2018, 147, 43–53. [Google Scholar] [CrossRef]
  82. Bencharef, M.H.; Eldosouky, A.M.; Zamzam, S.; Boubaya, D. Polymetallic mineralization prospectivity modelling using multi-geospatial data in logistic regression: The Diapiric Zone, Northeastern Algeria. Geocarto Int. 2022, 37, 15392–15427. [Google Scholar] [CrossRef]
  83. Pham, L.T.; Prasad, K.N.D. Analysis of gravity data for extracting structural features of the northern region of the Central Indian Ridge. Vietnam J. Earth Sci. 2023, 45, 147–163. [Google Scholar]
  84. Jorge, V.T.; Oliveira, S.P.; Thanh, L.P.; Duong, V.H. A balanced edge detector for aeromagnetic data. Vietnam. J. Earth Sci. 2023. [Google Scholar] [CrossRef]
  85. Altınoğlu, F.F. Investigation of Tectonics of Western Anatolia by Geophysical Methods. Ph.D. Thesis, University of Pamukkale, Denizli, Turkey, 2012; p. 225. [Google Scholar]
  86. Hançer, M. Structural Evolution of the Northeast—Southwest Trending Tectonic Lineament and a Model for Graben Formation in the Denizli Region of Western Anatolian (West of the Zagros Fold-and-Thrust Belt). Dev. Struct. Geol. Tecton. 2019, 3, 83–100. [Google Scholar]
Figure 2. The Bouguer gravity anomaly map of the study area. The black lines indicate the active faults in the region [67].
Minerals 13 01276 g002
Figure 3. The residual gravity anomaly map of the study area. Black lines indicate the active faults in the region [67].
Minerals 13 01276 g003
Figure 4. The graph of RMS error variation against the iteration number.
Minerals 13 01276 g004
Figure 5. The sediment pre-Neogene basement relief map of Denizli Graben. The black lines show the active fault of the region given by MTA [67], and the white lines indicate the gravity profiles. The topographic elevation data were downloaded from [79].
Minerals 13 01276 g005
Figure 6. The inverted basin model across Profiles A and B with the observed and calculated gravity anomalies. (a) Profile A, and (b) Profile B (the location of profiles is given in Figure 5).
Minerals 13 01276 g006
Figure 7. (a) Tilt angle of the horizontal gradient amplitude (TAHG), (b) FSED map of the study area. The black lines show the active fault of the region given by MTA [67].
Minerals 13 01276 g007
Figure 8. The compiled structural lineament map of the study area is superimposed on a topographic map [79]. The active faults of the region are yellow lines [67], and the new proposed lineaments are shown with purple lines.
Minerals 13 01276 g008
Disclaimer/Publisher’s Note: The statements, opinions and data contained in all publications are solely those of the individual author(s) and contributor(s) and not of MDPI and/or the editor(s). MDPI and/or the editor(s) disclaim responsibility for any injury to people or property resulting from any ideas, methods, instructions or products referred to in the content.

