Abstract
Since the particle size, shape, specific surface area, and purity of the ground calcium carbonate (GCC) decide its usability in the paper, paint, and plastic industries, the effect of grinding is important. However, the effect of stirred and ball mill grinding on the particle shape of GCC by dynamic image analysis (DIA) is still lacking in the literature. Therefore, the aim of this study is to compare the aspect ratio at the same fineness (d97 = 50 μm) and evaluate other properties such as color, and surface area of GCC particles by stirred and ball mill grindings. DIA results showed that particles produced by the ball mill had higher aspect ratio values than those by the stirred mill. This was attributed to the impact, and attrition breakage modes produced by the ball and stirred mill, respectively. This conclusion is supported by XRD and SEM. Finally, the results related to physical properties such as aspect ratio, surface area, and whiteness are discussed depending on the usage area of GCC.
1. Introduction
Grinding, which is used for fine-size reduction of materials in a broad range of modern industries such as minerals, pharmaceuticals, cement, and pigment production, has been reported to symbolize a global market value of US$ 400 billion for the mineral industry [1]. Since the concepts of energy savings and ecological awareness are the main issues nowadays, less energy consumption for grinding means more reductions in costs and fewer harmful effects on the environment. In the mineral industry, energy is needed for grinding ore and minerals to reduce the particle size. Moreover, more energy-efficient technology for grinding is of prime interest [2] because the energy required for the grinding process depends not only on the demanded fineness but also on the type of mill employed. In addition, it is known that the size, density, and shape of grinding media, mill speed, feed size, slurry density, and hardness have great impacts on product size and grinding efficiency. Therefore, the mill type, as well as the feed size and strength of the material to be ground should be considered for energy consumption in grinding, which aims to decrease particle size and increase the surface area [3]. In this context in the last several decades, stirred mills have been commonly used for fine grinding in several industries such as minerals, ceramics, pharmaceuticals, chemicals, cosmetics, paints, and papers because they have higher energy efficiency than ball milling, and the ability to produce fine products [2,4,5,6,7]. Moreover, it is well known that stirred mills provide a remarkable improvement in energy savings due to the small size of the grinding media and the ability to mix at higher speeds [8], with higher media loading compared to ball milling when finer particles are desired [9,10,11,12].
Fillers, which provide unique attributes to paper, plastics, and paint, are predominately pigment particles that are yielded mostly from natural minerals such as calcium carbonate which increases opacity, brightness, and color [13]. It is known that the effect of mineral addition to paints and coatings depends on the size and aspect ratio of the minerals as well as mineralogy, oil absorption, brightness, pH, chemical inertness, refractive index, purity, soluble salts, and volume fraction in the matrix. For example, the particle size and shape of fillers change the light scattering [14] and filler entanglement density [15].
Calcite or ground calcium carbonate (GCC), which has a Mohs hardness value of 3, a refractive index value of about 1.70, and a density of nearly 2.7 g/cm3, is a cheap and valuable industrial mineral commonly utilized as the ground form in many industries such as paper, paint, and plastic [16]. Since the d97 term (97% passing size) is the fineness value usually looked at in GCC production [17], it is well-known that dry GCCs with a d97 value of 74–45 μm are among the cheapest known white fillers [18]. Vast tonnages of calcite mineral particles are produced each year by grinding around the world since calcite is used as filler in the industry when it is micronized and has a hydrophobic property, and a high level of whiteness [19]. It is reported that the market for both GCC and precipitated calcium carbonate (PCC) keeps on growing day by day due to the increases in the prime markets of paper, plastics, paint, rubber, and adhesive sealants. Therefore, the consumption of calcium carbonate augmented from 74.3 Mt in 2011 to 81 Mt in 2015 [20]. The U. S. Geological Survey [21] reported that the world limestone production in 2018 was recorded as 420 million metric tons because it is widely preferred in paints, paper, and plastics thanks to its low cost, abrasion, oil absorption, moisture and resistance to weathering, high brightness and purity, and easy dispersion [22]. Moreover, the mineralogical purity and white color required for GCC to be used as a filler in these industries can only be achieved by controlling the size, shape, surface area, and liquid absorbency of the grains [18]. Since the process and end-use behavior of GCC not only depends on the particle size or specific surface but is also influenced by the particle shape [23], particle morphology control of GCC is crucial for industrial applications. For instance, particle size, shape, and surface area are critical properties of papermaking filler derived from GCC [24]. Gaber [25] has emphasized that shape and size are important factors affecting GCC features such as consistency, oil absorption, and hiding power. It has been reported that the typical particle shape of GCC ranges from irregular to blocky, while the aspect ratio and surface area vary between 1 to 1.5 and 5 to 12 m2/g, respectively. On the other hand, the particle shape of GCC is often rhombohedral, which provides a porous surface on the paper [26,27,28,29]. Furthermore, it is known that the light scattering of a coated layer of paper is influenced by mean sizes, size distribution, and shape of the pigment particles [30].
However, particle shape is an overlooked parameter in the characterization of fine particle systems. Fine particles must be broadly characterized by their size, size distribution, and shape. Therefore, using an accurate, and quick analysis to predict the product characteristics and control the processes for the best conditions is significant. Recently, a novel technique called dynamic image analysis (DIA), which is capable of measuring the shape parameters of particles while they are moving, provides valuable information to guess the behavior of products for improving the quality and performance of a material. Thus, it is widely regarded as the most recent, advanced and accepted technique that provides statistically significant characterization of a huge number of particles [31].
Since the morphological characteristics, specific surface area, size, and purity of the GCC to be used as a filler are important [32], the appropriate mill using an appropriate breakage mode can produce the particle size, size distribution, and shape desired for these industries such as paper, paint, and plastics. Previous works have focused on the effects of ball and stirred milling on particle size and other physical properties of GCC. Only one study in the literature investigated the relationship between the applied stress intensity and the shape of the particles produced by a ball and stirred mill using an optical microscope [23]. Similarly, only a few works deal with the effect of grinding by ball and stirred mill on the shape of the particles by using SEM. For instance, the morphological analysis of galena and quartz minerals ground by stirred mills was studied by Roufail [33]. In addition, Alex et al. [34] studied the evolution of gibbsite morphologies with milling time using stirred media mill and SEM. Moreover, particle shape analysis of South African platinum group mineral ore called UG2 milled in a laboratory ball mill and stirred mill was conducted by using Auto-SEM-EDS [35]. The influence of ball mill grinding on the color and particle size properties of talc and smectite from white bentonite was studied and compared with fine-grained calcite from chalk [36]. However, measuring a very small number of particles (usually less than 100) with visual techniques such as SEM, which depends on the user’s experience for shape characterization of flat particles and yields 2D results, can be misleading as the 3rd dimension is neglected. Moreover, sample preparation is tedious and time-consuming, and images must be manually modified to ensure that each particle is clearly seen and without overlapping with other particles. These factors make the quantification process more subjective and less appealing than faster methods [37]. On the other hand, DIA exhibits exceptional accuracy and reproducibility over a very broad measuring range for the quality control of particle materials. However, quantitative shape analysis by dynamic image analysis of calcite minerals ground by conventional ball mill and stirred mill and comparison of the product shape are still lacking in the literature. Since the particle size, shape, specific surface area, purity, and whiteness degree of the fillers that affect the properties of the final products in the paper, plastic, and paint industries are important and these industries use both conventional ball mills and stirred mills to produce fine calcite products by operating at closed circuits with separators and filtering them. This study aims not only to quantify specific surface area, morphology, size, and whiteness properties of calcite particles ground by stirred mills and conventional ball mills at the same fineness (d97), but also aims to evaluate the suitability of the mill products as GCC fillers in the paint, paper, and plastic industries by comparing their physical properties.
2. Theoretical Background: Aspect Ratio Parameters Based on Different Models Used in DIA
Aspect ratio, which is one of the globally used shape parameters expressing the ratio between length and width for the characterization of industrial minerals, is the simplest solution to consider non-spherical shape characterization. For example, cubes or spheres have a 1:1 aspect ratio whereas blocky particles have a 2:1 to 4:1 aspect ratio and platy particles have a 20:1 [22]. Dynamic imaging provides greater particle detail regarding various shape parameters including aspect ratio compared to static imaging. Thus, three different aspect ratio measures based on three different shape models of DIA were selected in this study. They are provided as follows:
2.1. Elliptical Aspect Ratio (EAR)
It is described based on the ellipse model and equal to the ratio of equivalent elliptical area length to equivalent elliptical area width (Figure 1a).
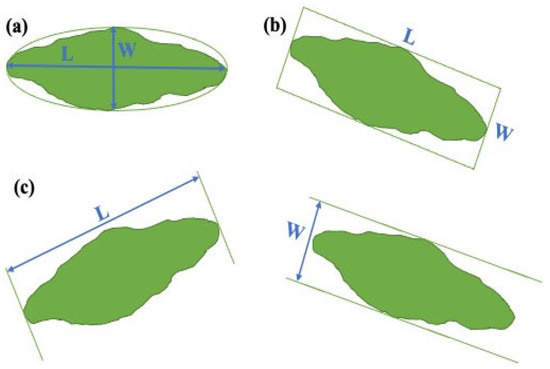
Figure 1.
Particle characterization models used in dynamic image analysis (a) Ellipse model (b) Rectangle model (c) Irregular model [38].
2.2. Bounding Rectangular Aspect Ratio (BRAR)
It is described based on the rectangle model, which is defined as a rectangle of the smallest area surrounding but not crossing the object generally for non-fiber-shaped particles. In other words, it can be best described as the ratio of length (the larger side of the bounding rectangle) to width (the smaller side of the bounding rectangle) (Figure 1b). Figure 2 shows changes in different BRAR values measured by DIA for differently shaped calcite particles. It should be noted that while the ideal lower value of BRAR for spherical particles is 1.0 (Figure 2d), the value of BRAR increases as the shape of the particle deviates from spherical (Figure 2a). On the other hand, BRAR values for ground particles are always greater than 1.0 since there is no perfectly spherical particle after breakage.

Figure 2.
Variation of different BRAR values measured by DIA for different shapes of calcite particles. (a) very high BRAR (b) high BRAR (c) moderate BRAR (d) very low BRAR.
2.3. Feret Aspect Ratio (FAR)
It is described based on an irregular model and can be calculated as the ratio of Feret length (Feret max) to Feret width (Feret min), which are the smallest and largest possible spacings between two parallel lines that contact but do not cross the particle, respectively, as shown in Figure 1c [38]. In other words, they can be considered “caliper dimensions”.
3. Materials and Methods
3.1. Sample
As shown in Table 1, pure calcite samples (CaCO3) having a density of 2.70 g/cm3 were studied in this study from Mikron’S Company (Niğde, Türkiye). Since calcite products were manufactured by both ball and stirred mills of the company, the aim of this study is to compare the particle shape of both stirred and ball-milled products at the same fineness value. Therefore, the term d97, ref. [17] was selected as the targeted size in this study, since the d97 value of the GCC is generally desired to be between 74–45 μm in the calcite industry [18]. The particle size distributions of the calcite sample fed to the stirred mill and the ball mill are provided in Figure 3. It is seen that it is suitable for the material and media size to be fed to the mills used in this experimental study.

Table 1.
Chemical composition of the calcite sample used in this study [39].

Figure 3.
Particle size distributions of feed for calcite grinding by the stirred mill and ball mill (modified from [39,40].
3.2. Grinding Procedure
3.2.1. Stirred Milling
Laboratory grinding tests were conducted in a laboratory batch-type vertical stirred ball mill (Nimak Makina, Niğde-Türkiye) having a motor power of 3 kW with a tank volume of 1200 cm3 (including shaft) running at 3000 rpm (Figure 4a). The diameter of the pin-type stirrer arm was 8.5 cm, and the number of stirrer arms was 5. Grinding tests were performed for each parameter at a constant grinding time. Alumina balls (spherical beads) with a density of 3.60 g/cm3 and with 4 mm diameters were used as the grinding media (Figure 5a). Since grinding aids usually act as dispersants that prevent particles from agglomerating, glycol-based commercial liquid grinding aids at the dose of 700 g/t were also utilized in all grinding tests as it is commonly used in calcite grinding. After each test, all of the media and ground samples were removed from the mill and the media were separated from the products by sieving. The detailed experimental conditions for stirred milling are provided in Table 2.

Figure 4.
Mills used in this study (a) stirred mill [39], (b) ball mill [40].
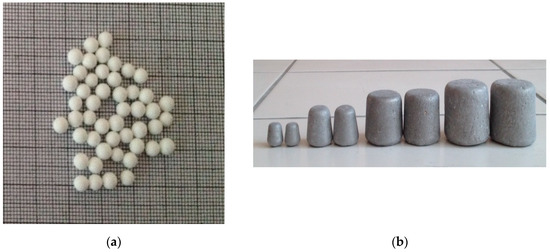
Figure 5.
Grinding media used in this study (a) alumina balls used for stirred mill grinding, (b) cylpebs used for ball milling tests [40].
Table 2.
Experimental conditions for stirred mill and ball mill followed in this study [40].
3.2.2. Ball Milling
For conventional ball milling, a laboratory-scale stainless steel ball mill (without lifter) having a dimension of 200 mm × 200 mm and a volume of 6283 cm3 with a 0.37 kW variable speed motor was utilized (Figure 4b). Since cylpebs, which are heavily rounded cylinders, are known to produce faster breakage rates, especially for the coarse size fractions (100 μm × 1000 μm) [41], in this study stainless steel cylpebs (Figure 5b) having a density of 7.65 g/cm3 and with various diameters (40 × 40–32 × 32–20 × 20–12 mm × 12 mm) were used as the grinding media. Glycol-based commercial liquid grinding aids were also utilized to prevent agglomeration in ball mill grinding tests at the dose of 2000 g/t as in stirred mill grinding tests. The detailed experimental conditions for conventional ball milling were provided in Table 2.
3.3. Particle Size Analysis
Wet Laser Diffraction Particle Sizer Malvern 2000 Ver. 2.00 with the Hydro 2000 MU insert (Malvern Co., Ltd., England), which was based on Mie theory [42], was used for the surface area and aspect ratio, as well as particle size analysis of the feed and milled products.
3.4. Dynamic Imaging of Particles
DIA, which means that particle images are captured and analyzed while particles flow in front of a digital camera, employs random orientation to allow the analysis of all dimensions of the particles and recirculation of the sample to assure the best representation of the sample for more accurate data as shown in Figure 6. The dynamic turbulent flow route provides a three-dimensional random orientation, a direct view of the flowing particles within the detection region [43].
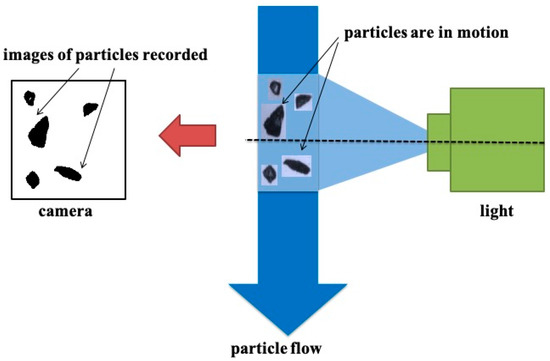
Figure 6.
Principle of dynamic imaging of particles.
About 1 g of the ground representative samples taken by rotary riffler was placed in a 25 mL beaker with distilled water and kept in an ultrasonic bath for about 2 min to provide sufficient dispersion for image analysis. Particle shape characterization of the calcite samples ground by ball and stirred mill was carried out by using the DIA instrument (Particle Insight, Micromeritics® Instrument Corp., Norcross, GA, USA) [44]. At least 10,000 particles were measured for each mill product to provide high statistical accuracy. The average values of three consistent measurements were used in each measurement to reveal the differences in the shapes of the calcite particles ground in the stirred mill and conventional ball mill.
3.5. SEM Analysis
Tescan MIRA3 XMU model SEM operating at 10 kV, was used for the visual shape comparison of the microphotographs for the particles by ball and stirred milling. In SEM analysis, the samples were coated with gold to increase surface conductivity.
3.6. XRD Analysis
After the dry samples were prepared as pellets, the mineralogical compositions were determined by using X-ray (Panalytical Empyrean) analyses of the feed, and products of stirred and ball milling at 45 kV and 40 mA. Then, the data obtained by the X-ray detector provides a spectrum for the samples that were evaluated by a software called HighScore to match them with the cards available in its library for the determination of the sample contents.
3.7. Color Analysis
Color property as well as particle size and shape of mineral fillers is of significant importance because it affects the properties of the end products [45]. Optical properties such as brightness, whiteness, and L, a*, and b* color space values were evaluated using Datacolor ELREPHO (Datacolor Inc., Lawrenceville, NJ, USA), spectrophotometer (Figure 7b) in this study. It is a widely accepted instrument, which uses a diffuse/0° optical geometry and automated, adjustable, ISO 2469 compliant UV filter for analysis of color, brightness, opacity, diffuse reflectance factors, yellowness, and whiteness of pulp, paper, and chemicals.

Figure 7.
Color analysis instrument used in this study (a) CIELAB color diagram (b) and color spectrophotometer instrument [46].
Color management software basically utilizes versions of the color space described by the Commission International de ľéclairage (CIE). XYZ is a mathematical edition of the RGB model, which was designed for mapping whole colors visible to humans employing various wavelengths of red (R), green (G), and blue (B) light and it expands the RGB space and avoids negative numbers by using three set primaries.
The CIELab space (or CIEL*a*b*), which means the space between mapped colors corresponds to their visual differences, expresses colors according to L, a, and b values, where they are defined as lightness, from black (0) to white (100), amount of green (−) to red (+), and amount of blue (−) to yellow (+), respectively. In the diagram illustrated by Figure 7a, visible colors broaden evenly along the two-color axis to make chromatic attributes easy to view. CIELab theoretically covers visionary colors that are beyond the scope of human sensing [46].
In addition, (Ry) whiteness, which is defined as brightness or reflectance degree can be obtained by measurement [19]. For the calcite sector where color differences are critical for micronized particles, Ry, L, a, and b values for coated calcite particles are favorable when Ry ≥ 96, L ≥ 98, a < 1, and b < 1, respectively, [47].
4. Results and Discussion
4.1. DIA Results
Size analysis by wet laser diffraction analysis of stirred mill and ball mill products is provided in Figure 8. Since this study aims to investigate whether stirred mill, which is the best alternative to the conventional ball mill that can produce finer particles with less energy consumption, produces a suitable particle shape for GCC. It was found that both product sizes have almost the same fineness (d97 = 50 μm) to compare their aspect ratio values by DIA.

Figure 8.
Particle size distributions of products for calcite grinding by stirred mill and ball mill.
Based on this result, detailed DIA measurements of the GCC products ground by ball and stirred mills in terms of three aspect ratio parameters, such as EAR, BRAR, and FAR along with statistical parameters (ECAD, the minimum, the maximum, the mean, and the standard deviation values) by counting more than 10,000 particles per each measurement are listed as Table A1, Table A2, Table A3, Table A4, Table A5 and Table A6 in the Appendix A. The equivalent circular area diameter (ECAD) parameter used in DIA, represents the diameter of a sphere that would have a volume close to the actual volume of the particle. It should be noted that the ECAD values given in the tables are almost the same to compare the aspect ratio values of particles for each sample.
Figure 9 summarizes three different aspect ratio parameters, EAR, BRAR, and FAR, based on the bounding rectangle model, the Ellipse model, and the Feret model, as measured by DIA for Stirred mill and ball mill products, respectively. As seen from Figure 9a, EAR values ranged from 1.421 to 1.415 for stirred milled calcite particles, while they varied from 1.523 to 1.497 for ball milled particles. In addition, BRAR values ranged from 1.419 to 1.423 for stirred-milled calcite particles, whereas they varied from 1.504 to 1.533 for ball-milled particles (Figure 9b). Finally, FAR values ranged from 1.553 to 1.560 for stirred milled calcite particles; on the other hand, they varied between 1.636 to 1.677 for ball milled particles (Figure 9c). The same trend was found for all three different aspect ratio parameters measured for grains of calcite products ground in two different mills. Overall results revealed that the higher aspect ratio values were obtained by the ball mill compared to the stirred mill, indicating that the particles ground by stirred mill have lower elongated particles. The results have shown that every data point in the plots represents more than 10,000 counted particles measured by three consistent repetitions to provide high statistical accuracy since at least 6400 particles for each measurement are required at a 99% confidence level as stated by British Standard 3406 [48] and Allen [49]. Ulusoy and Yekeler [50] also measured EAR, BRAR, and FAR values for 0.250 + 0.045 μm ball milled calcite as 1.664, 1.665, and 1.765, respectively. The differences in the results of the two different studies are attributed to the particle size and purity of the calcite material used. It was concluded that ball milled particles had a higher aspect ratio in terms of the EAR, BRR, and FAR than stirred milled particles.
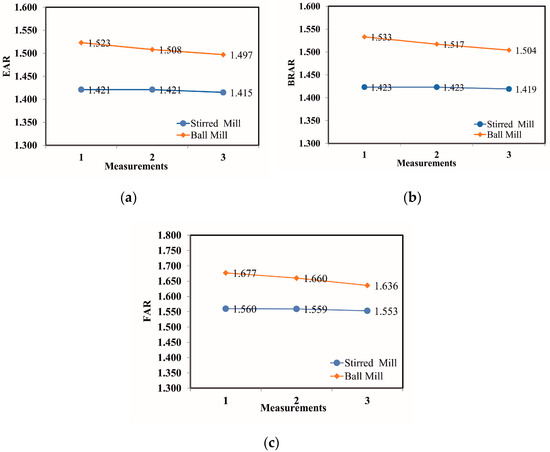
Figure 9.
Comparison of different aspect ratio parameters for the calcite particles ground by the stirred mill and ball mill by dynamic image analysis: (a) EAR (b) BRAR and (c) FAR.
Differences in product shapes are attributed to the different grinding methods used in this study as the quality of the particles depends on the breakage modes of mills in terms of their size, size distribution, and shape [35,51]. In other words, it was found that the stirred-milled particles had a more rounded shape compared to the ball milled particles since the stirred mill grinding relies on attrition breakage [34,51,52,53,54]. On the other hand, a conventional ball mill, which works based on more impact and less abrasion and chipping mechanisms [55], produced more elongated particles than stirred mill products. It has been suggested that under impact stress, the fragmentation mechanism may be due to essentially simultaneous rupture and fracture, which produce particles of nearly round shape and uniform size during fragmentation. On the other hand, it has been reported that the main mechanism of fracturing by attrition is primarily the rupture of grain joints leading to the dissociation of crystallites, and secondly, the chipping and the breakage of these crystallites [23,56].
Moreover, it is thought that the use of grinding media with different surface areas, bulk densities, and contact mechanisms in the two different mills used in this study is also responsible for the difference in the aspect ratio values. As a matter of fact, cylpebs grind in the form of line contact and area contact [57].
Figure 10 illustrates the images from the DIA for the calcite samples tested in this comparative study. It can be clearly seen that the shape of most particles is non-spherical. Figure 10b indicates ball milled particles have a more elongated shape, whereas Figure 10a shows more rounded particles obtained by stirred milling. This is in good agreement with the previously reported study [24,35,58].

Figure 10.
Images recorded during DIA measurement (a) particles produced by the stirred mill and (b) particles produced by the ball mill.
Cheng et al. [59] have stated that the particle shape of GCC particles is important for the paper and paint industries, especially cubic particles which may also lend high electric insulation and a high elasticity modulus to composites. In this case, the stirred mill which produces less elongated particles, may be preferred over the ball mill. On the other hand, it can also be argued that ball milling is more suitable as it is widely acknowledged that pigments with a higher aspect ratio typically offer greater qualities including increased coverage and gloss for the paint industry [60,61]. Similarly, Gupta [62] has proposed that plastics prefer elongated reinforcements such as fibers over granular shapes due to the fact that plastics need high impact strength and not high tensile strength. In this case, the ball mill, which produces more elongated particles, may be preferred over the stirred mill.
4.2. ANOVA Results
Table 3 shows the mean BRAR values selected as a sample statistical evaluation of the 1st measurements related to the stirred and ball milled particles to test their significance by analyzing the “Compare means” function in the ANOVA test using IBM® SPSS® Statistics version 23.0. When the “Sig.” value (significance level) in Table 3 is less than 0.05, there is a significant difference between the groups with a confidence level of 95% [63]. Based on this rule of thumb, the “Sig.” (significant level) values of the test of homogeneity and multiple comparisons of ANOVA tests were less than 0.05 (see red marked). The ANOVA test has shown that there is a significant difference between BRAR values of stirred and ball milled particles and it can statistically be reported as “F(1,20053) = 346.356, p = 0.000”. It was concluded that BRAR mean values of both milled particles are significantly different in the confidence level of 95%. The average of the 10,000 particles after three repetitions has shown the net difference along with high statistical accuracy. Thus, all three aspect ratio values of particles by the ball mill are higher than particles by the stirred mill.
Table 3.
Statistical evaluation for the significance of the BRAR measurements.
4.3. SEM Results
SEM images illustrated in Figure 11 clearly shed light on the differences in particle shapes of ground calcite samples by stirred and ball mills, i.e., particles by stirred milling are mostly blocky and rounded (see Figure 11a) whereas ball mill particles are generally elongated as clearly seen from Figure 11b.
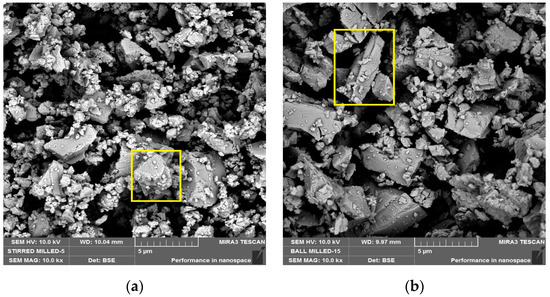
Figure 11.
SEM micrographs of the (a) particles from the stirred mill and (b) particles from the ball mill (magnified at 10,000×).
4.4. Size and Surface Area Results
Table 4 summarizes the size parameters, surface area, and aspect ratio values of the samples of both mill products by laser diffraction technique. The same fineness (d97 = 50 μm) values were obtained for both milling products in order to compare the surface area and particle shape in terms of the aspect ratio of the products milled by the stirred mill and ball milling, and this is in agreement with the results in Figure 8. In addition, when the thickness and aspect ratio values were examined in parallel with the DIA measurements, similar differences were also observed in the laser diffraction measurements. In other words, particles ground in the stirred mill have a larger specific surface area than particles ground in the ball mill, which is compatible with lower d10 and d50 values.
Table 4.
Comparison of the particle size and surface area of the stirred and ball milled by laser diffraction.
The results related to the surface area are in good agreement with the previously reported literature. While Jeong et al. [64] have found a value of 2.18 m2/g for untreated GCC, Toraman et al. [65] have found the surface area of calcite as 2.85 m2/g by stirred milling using glycol grinding aids. Lin and Somasundaran [66] and Lin et al. [67] have also found appropriate findings, i.e., the stirred milling produces higher specific surface area, and modifies other physicochemical properties than conventional ball milling.
The difference in the measured surface area is also attributed to the grinding media, which have a different surface area, bulk density, and contact mechanisms in grinding action, i.e., cylpebs balls grind in the form of line contact and area [57]. Although products with equivalent d97 dimensions have been examined, there are differences in the d10 dimensions of the products due to the difference in the grinding mechanism of the two mills. This is also evident from the difference in surface area values.
Therefore, the magnitude of the specific surface area values depends on the feed size, ball size, and ratio, as well as the grinding time. In addition, it is obvious that it will increase even more when the particle size is reduced further. It should be noted that the mill product’s fineness requires more energy input. Moreover, the main aim of this study is to compare the aspect ratio at d97 = 50 μm and evaluate other properties such as color and surface area for the intended use of GCC.
This research article aims to compare the physical properties such as aspect ratio, surface area, and whiteness of GCC products produced by different grinding processes. It has been concluded that two GCC products with the same size but different values of aspect ratio, surface area, and color property, produced by stirred and ball mill grinding are obtained. Therefore, it can be said that one of the grinding systems is better than the other for one of these properties desired in one of the industries such as paper, paint, and plastic.
For example, GCC particles with a higher surface area due to their particle shape will have a better contact interface with the polymer matrix due to their larger specific surface area when used as polymer filling material. Furthermore, it is well known that with the addition of a GCC filler, the most desirable mechanical properties for the plastics industry are the tensile strength and impact resistance of the polymer. It has been reported that as the filler aspect ratio increases, their mechanical properties increase [45]. Since rubber reinforcement is known to require granular particles [62], stirred mill products are more favorable than ball mill products because the elongated particles tend to form a grain pattern that can cause the rubber to tear more easily along the alignment direction. In addition, high surface area fillers provide an increased surface area for contact, which increases their capacity to strengthen rubber links. Moreover, particles with a planar shape have more surface available for contacting the rubber than spherical particles with an equivalent average particle diameter [18]. Therefore, stirred mill products are also favorable in the rubber industry.
In the paper industry, since loading higher filler content is always desired by the paper manufacturer due to reduced costs and increased optical properties, aspect ratios and surface areas of the particles to be used as fillers become important, e.g., it is known that the filler’s particle size and shape have the biggest effects on how the light scatters [14]. Furthermore, the specific surface area of filler particles is of crucial importance since there is a direct correlation between the specific surface area of the filler and the internal sizing agent demand in papermaking [25]. Moreover, higher composite stiffness is suggested to be caused by a higher particle aspect ratio and a higher modulus since the size and shape of the GCC particles used in paper coating provide the gloss properties of the system. It is also well known that platy particles of uncoated GCC fillers decrease porosity and improve printing performance by enhancing the smoothness and gloss of the papers [45]. Thus, the ball mill is favored for the paper industry compared to the stirred mill.
In paint making, the surface area is important for hiding power properties. While hiding power increases with an increase in the surface area of the GCC extender for the rheological properties of the fluid paint [68], the filler’s intrinsic high surface area causes it to debond fibers when employed to generate brightness and opacity [69]. Therefore, the stirred mill is preferred in the paint industry compared to the ball mill.
These discussions are also compatible with the literature. For example, the surface area values obtained by stirred and ball mills in this study are suitable for the paper and plastic industries according to the reported study by Ercan et al. [70].
4.5. XRD Results
Figure 12 shows the XRD results of the XRD patterns of feed and product samples for stirred and ball mills. It is clearly seen that the result of the feed is accorded well with the content of major elements obtained from analysis in Table 1. Looking at the strongest diffraction peak of the CaCO3 in Figure 12, it is clearly seen that the peak positions are the same, but the peak intensities are different. This is attributed to the different shapes of the powders [71,72]. In other words, the highest peak intensities were found for ball mill calcite products which produced particles having a higher aspect ratio, whereas the lowest peak intensities were found for stirred mill products, which produced a lower aspect ratio of particles. In addition, different proportions of these crystal faces may be directly related to particle shape since different XRD peaks represent different crystal faces.

Figure 12.
XRD patterns of feed and product samples for stirred and ball mill.
4.6. Color Analysis Results
It is known that whiteness is caused by the scattering of light by pigment. In addition, light scattering is the mechanism that contributes to hiding and can be explained by optical theories. White pigments are unique in that the appearance of white is due only to scattering [73]. Hubbe and Gill [24] have claimed that modification in particle shape may lead to a higher relative bonded area between products and fibers compared to other PCC particle shapes having a comparable light-scattering ability. In addition, Grönfors [13] has stated that the size and shape of the filler particles affect the amount of light scattering as well as the refraction index of filler and the quantity of pigment-air interfaces available in the product. Moreover, a higher surface area and higher whiteness are important for the composite polymer filler due to its superior mechanical properties [74]. Because the common use of GCC depends on its cheap price and its high whiteness and brightness, the comparison of color analysis results for both mill products examined in this study can be seen in Table 5. Results are in agreement with a previous study, i.e., Lourenço et al. [58] have reported that the unmodified GCC samples have greater brightness R457 (%) values than 84.8. Furthermore, Toraman et al. [65] have also found similar results (L = 98.39; a = −0.03; b = 1.02) with the stirred milling of calcite using glycol grinding aids.
Table 5.
Color analysis of stirred and ball-milled calcite.
While the stirred mill product has a higher degree of whiteness than the ball mill product, the result that the ball mill product has higher yellowness than the stirred mill product can also be said when the b values in Table 5 are taken into account. Considering Ry, L, a, and b values for coated calcite particles are favorable when Ry ≥ 96, L ≥ 98, a < 1, and b < 1, respectively [47,75], Table 5 reveals that, stirred mill product is better than ball milled product.
Considering the Ry values, which are counted as the brightness indicator in Table 5, both mill products are suitable, as it should be at least 90% for paper pigment fillers. However, it is clear that the Ry values of the stirred mill product are higher than the Ry values of the ball mill product. Since the minimum L value required for GCC with a d97 value of 50 μm used in the paint (exterior paints, latex coatings, and polymer-based) industry is 97.5 [17], it can be said that the stirred mill products are better than the ball mill products. As a result, according to the results of the color analysis, both mill products were found to be suitable for the paper, plastic, and paint industries where calcite is predominantly used. The color difference in products of the stirred mill and ball mill may be attributed to the particle size and steel media used.
5. Conclusions and Future Recommendations
The following conclusions can be drawn from the present study:
According to the particle size analysis, the particles of the stirred and ball mill products (d97 = 50 μm) have the same fineness. However, according to the DIA results with the same ground products, it is revealed that the shapes of the particles of the calcite products ground in two different mills are not the same. This means that they will undoubtedly behave differently in subsequent processes or applications.
In addition, ANOVA tests revealed that the mean shape (EAR, BRAR, and FAR) values obtained by DIA, which became a recently popular technique for shape characterization, are significant at a confidence level of 95%. In other words, the values for the aspect ratio of calcite powders ground in a stirred and ball mill, found by counting at least 10,000 particles in each measurement and taking the average of three consistent measurements, are not the same.
Furthermore, these results are supported not only by DIA and SEM images but also by the difference in XRD peak intensities.
Based on the DIA, XRD, and SEM results, stirred mill products have a lower aspect ratio than ball mill products.
Since the breakage modes in mills determine the quality of the particles in terms of particle size, particle size distribution, and particle shape, and also the control of particle shape and morphology of calcite is important for industrial applications, where GCC is preferred as a filler, it has been shown in this study that more rounded (blocky, even) particles with a higher degree of whiteness and gloss can be obtained for pigment industry using a stirred mill, which has an attrition-based breakage mode.
According to the industry in which GCC will be used, one product can be preferred over the other according to the purity, size, surface area, particle shape, and whiteness properties of the particles ground in the ball and stirred mill. In other words, it was determined that the ball mill is favored in the paper industry due to its higher aspect ratio properties. On the other hand, stirred mills are preferred in order to produce GCC products with a larger surface area, and higher whiteness properties for the paint and plastics industries.
However, this study, which examines the effect of two different grindings performed according to the grinding parameters (mill speed, ball filling ratio, ball size distribution, powder filling ratio, and grinding aids, etc.) with optimum values on the particle shape and the usability of the grinding products in the industries, will shed light on future studies in which the effects of these parameters on grain shape are examined separately.
Author Contributions
Conceptualization: U.U. and S.Ç.; Methodology: U.U., S.Ç., H.S.G. and G.B.; Writing: U.U.; Writing-Review & Editing: U.U. and S.Ç. All authors have read and agreed to the published version of the manuscript.
Funding
This research received no external funding.
Data Availability Statement
Not applicable.
Acknowledgments
The authors thank Ali Özer at CÜTAM for the SEM analysis to support this study. Thanks are due to Micron’S Company (Niğde, Türkiye) for providing the sample and Anadolu Micronize Company (Niğde, Türkiye) for particle size, surface area, and color analysis.
Conflicts of Interest
The authors declare no conflict of interest.
Appendix A
Table A1.
BRAR values determined by DIA measurement of stirred-milled calcite.
Table A1.
BRAR values determined by DIA measurement of stirred-milled calcite.
| Stirred Mill | 1. Measurement 2 | 2. Measurement | 3. Measurement | Average |
|---|---|---|---|---|
| ECAD Mean (μm) | 12.2 | 12.5 | 12.9 | |
| Counted particles | 10,100 | 10,047 | 10,067 | |
| Minimum | 1.000 | 1.000 | 1.000 | |
| Maximum | 5.555 | 3.391 | 3.428 | |
| Mean | 1.419 | 1.423 | 1.423 | 1.422 1 |
| Std. dev. | 0.285 | 0.285 | 0.284 | |
| Number percentiles 10.00% | 1.120 | 1.126 | 1.123 | |
| Number percentiles 25.00% | 1.215 | 1.219 | 1.218 | |
| Number percentiles 50.00% | 1.373 | 1.375 | 1.377 | |
| Number percentiles 75.00% | 1.580 | 1.582 | 1.584 | |
| Number percentiles 90.00% | 1.800 | 1.813 | 1.810 | |
| Representative shape |  |
1 The values reported are averages of three independent measurements. 2 Used for the ANOVA Test.
Table A2.
EAR values determined by DIA measurement of stirred-milled calcite.
Table A2.
EAR values determined by DIA measurement of stirred-milled calcite.
| Stirred Mill | 1. Measurement | 2. Measurement | 3. Measurement | Average |
|---|---|---|---|---|
| ECAD Mean (μm) | 12.2 | 12.5 | 12.9 | |
| Counted particles | 10,039 | 10,003 | 10,016 | |
| Minimum | 1.000 | 1.000 | 1.000 | |
| Maximum | 3.264 | 3.391 | 3.428 | |
| Mean | 1.415 | 1.421 | 1.421 | 1.419 1 |
| Std. dev. | 0.276 | 0.282 | 0.282 | |
| Number percentiles 10.00% | 1.119 | 1.125 | 1.123 | |
| Number percentiles 25.00% | 1.214 | 1.218 | 1.218 | |
| Number percentiles 50.00% | 1.372 | 1.373 | 1.376 | |
| Number percentiles 75.00% | 1.576 | 1.580 | 1.582 | |
| Number percentiles 90.00% | 1.792 | 1.808 | 1.805 |
1 The values reported are averages of three independent measurements.
Table A3.
FAR values determined by DIA measurement of stirred-milled calcite.
Table A3.
FAR values determined by DIA measurement of stirred-milled calcite.
| Stirred Mill | 1. Measurement | 2. Measurement | 3. Measurement | Average |
|---|---|---|---|---|
| ECAD Mean (μm) | 12.2 | 12.5 | 12.9 | |
| Counted particles | 10,042 | 10,004 | 10,018 | |
| Minimum | 1.000 | 1.000 | 1.000 | |
| Maximum | 3.701 | 3.581 | 3.498 | |
| Mean | 1.553 | 1.559 | 1.560 | 1.557 1 |
| Std. dev. | 0.269 | 0.273 | 0.278 | |
| Number percentiles 10.00% | 1.259 | 1.264 | 1.259 | |
| Number percentiles 25.00% | 1.351 | 1.357 | 1.354 | |
| Number percentiles 50.00% | 1.511 | 1.515 | 1.517 | |
| Number percentiles 75.00% | 1.687 | 1.687 | 1.700 | |
| Number percentiles 90.00% | 1.899 | 1.900 | 1.920 |
1 The values reported are averages of three independent measurements.
Table A4.
BRAR values determined by DIA measurement of ball-milled calcite.
Table A4.
BRAR values determined by DIA measurement of ball-milled calcite.
| Ball Mill | 1. Measurement 2 | 2. Measurement | 3. Measurement | Average |
|---|---|---|---|---|
| ECAD Mean (μm) | 12.4 | 11.1 | 11.3 | |
| Counted particles | 10,196 | 10,201 | 10,167 | |
| Minimum | 1.000 | 1.000 | 1.000 | |
| Maximum | 4.482 | 4.334 | 7.274 | |
| Mean | 1.504 | 1.533 | 1.517 | 1.518 1 |
| Std. dev. | 0.340 | 0.328 | 0.333 | |
| Number percentiles 10.00% | 1.135 | 1.181 | 1.169 | |
| Number percentiles 25.00% | 1.251 | 1.293 | 1.278 | |
| Number percentiles 50.00% | 1.445 | 1.484 | 1.461 | |
| Number percentiles 75.00% | 1.684 | 1.716 | 1.691 | |
| Number percentiles 90.00% | 1.965 | 1.970 | 1.952 | |
| Representative shape |  |
1 The values reported are averages of three independent measurements. 2 Used for the ANOVA Test.
Table A5.
EAR values determined by DIA measurement of ball-milled calcite.
Table A5.
EAR values determined by DIA measurement of ball-milled calcite.
| Ball Mill | 1. Measurement | 2. Measurement | 3. Measurement | Average |
|---|---|---|---|---|
| ECAD Mean (μm) | 11.1 | 11.3 | 12.4 | |
| Counted particles | 10,016 | 10,006 | 10,065 | |
| Minimum | 1.000 | 1.000 | 1.000 | |
| Maximum | 4.334 | 3.574 | 3.549 | |
| Mean | 1.523 | 1.508 | 1.497 | 1.509 1 |
| Std. dev. | 0.319 | 0.319 | 0.332 | |
| Number percentiles 10.00% | 1.180 | 1.168 | 1.134 | |
| Number percentiles 25.00% | 1.290 | 1.275 | 1.249 | |
| Number percentiles 50.00% | 1.477 | 1.455 | 1.440 | |
| Number percentiles 75.00% | 1.700 | 1.676 | 1.673 | |
| Number percentiles 90.00% | 1.946 | 1.927 | 1.946 |
1 The values reported are averages of three independent measurements.
Table A6.
FAR values determined by DIA measurement of ball-milled calcite.
Table A6.
FAR values determined by DIA measurement of ball-milled calcite.
| Ball Mill | 1. Measurement | 2. Measurement | 3. Measurement | Average |
|---|---|---|---|---|
| ECAD Mean (μm) | 11.1 | 11.3 | 12.4 | |
| Counted particles | 10,018 | 10,007 | 10,068 | |
| Minimum | 1.000 | 1.023 | 1.000 | |
| Maximum | 4.377 | 3.799 | 3.632 | |
| Mean | 1.677 | 1.660 | 1.636 | 1.658 1 |
| Std. dev. | 0.315 | 0.316 | 0.328 | |
| Number percentiles 10.00% | 1.306 | 1.296 | 1.269 | |
| Number percentiles 25.00% | 1.448 | 1.427 | 1.390 | |
| Number percentiles 50.00% | 1.627 | 1.608 | 1.584 | |
| Number percentiles 75.00% | 1.855 | 1.835 | 1.822 | |
| Number percentiles 90.00% | 2.093 | 2.086 | 2.081 |
1 The values reported are averages of three independent measurements.
References
- Khumalo, N. The Application of the Attainable Region Analysis in Comminution. Ph.D. Thesis, University of the Witwatersrand, Johannesburg, South Africa, 2007. [Google Scholar]
- Jankovic, A. Variables Affecting the Fine Grinding of Minerals Using Stirred Mills. Miner. Eng. 2003, 16, 337–345. [Google Scholar] [CrossRef]
- Das, H. Food Processing Operation Analysis; Size Reduction (Chapter 1); Asian Books Private Limited: New Delhi, India, 2005; pp. 1–20. [Google Scholar]
- Mankosa, M.J.; Adel, G.T.; Yoon, R.H. Effect of Media Size in Stirred Ball Mill Grinding of Coal. Powder Technol. 1986, 49, 75–82. [Google Scholar] [CrossRef]
- Altun, O.; Benzer, H.; Enderle, U. Effects of Operating Parameters on the Efficiency of Dry Stirred Milling. Miner. Eng. 2013, 43–44, 58–66. [Google Scholar] [CrossRef]
- Radziszewski, P. Assessing the Stirred Mill Design Space. Miner. Eng. 2013, 41, 9–16. [Google Scholar] [CrossRef]
- Ouattara, S.; Frances, C. Grinding of Calcite Suspensions in a Stirred Media Mill: Effect of Operational Parameters on the Product Quality and the Specific Energy. Powder Technol. 2014, 255, 89–97. [Google Scholar] [CrossRef]
- Kwade, A.; Schwedes, J. Wet Grinding in Stirred Media Mills. In Handbook of Powder Technology; Salman, A.D., Ghadiri, M., Hounslow, M.J., Eds.; Elsevier Science B.V.: Amsterdam, The Netherlands, 2007; Chapter 6; Volume 12, pp. 251–382. [Google Scholar] [CrossRef]
- Shi, F.; Morrison, R.; Cervellin, A.; Burns, F.; Musa, F. Comparison of Energy Efficiency between Ball Mills and Stirred Mills in Coarse Grinding. Miner. Eng. 2009, 22, 673–680. [Google Scholar] [CrossRef]
- Xiao, X.; Zhang, G.; Feng, Q.; Xiao, S.; Huang, L.; Zhao, X.; Li, Z. The Liberation Effect of Magnetite Fine Ground by Vertical Stirred Mill and Ball Mill. Miner. Eng. 2012, 34, 63–69. [Google Scholar] [CrossRef]
- Jankovic, A.; Valery, W.; Davis, E. Cement Grinding Optimisation. Miner. Eng. 2004, 17, 1075–1081. [Google Scholar] [CrossRef]
- Larsson, S.; Rodríguez Prieto, J.M.; Heiskari, H.; Jonsén, P. A Novel Particle-Based Approach for Modeling a Wet Vertical Stirred Media Mill. Minerals. 2021, 11, 55. [Google Scholar] [CrossRef]
- Grönfors, J. Use of Fillers in Paper and Paperboard Grades. Bachelor’s Thesis, Tampere University of Applied Sciences, International Pulp and Paper Technology, Tampere, Finland, 2010. [Google Scholar]
- Chauhan, V.S.; Bhardwaj, N.K. Efficacy of Dispersion of Magnesium Silicate (Talc) in Papermaking. Arab. J. Chem. 2017, 10, S1059–S1066. [Google Scholar] [CrossRef]
- Kezuka, Y.; Kawai, K.; Eguchi, K.; Tajika, M. Fabrication of Single-Crystalline Calcite Needle-Like Particles Using the Aragonite–Calcite Phase Transition. Minerals. 2017, 7, 133. [Google Scholar] [CrossRef]
- Calcite Powder, Silver Microns Pvt. Ltd. 2011. Available online: http://www.calcite.in/calcite-powder.asp (accessed on 8 December 2022).
- Chalkiopoulou, F.; Chatzipanagis, I.; Valta, K.; Christidis, C. Production of High Value Added Carbonate Fillers from the Treatment of White Calcitic Marble Waste: The Case of Eastern Macedonia and Thrace of Greece. In Proceedings of the 3rd International Conference on Sustainable Solid Waste Management, Tinos Island, Greece, 2–4 July 2015. [Google Scholar]
- Ciullo, P.A. Industrial Minerals and Their Uses: A Handbook and Formulary, 1st ed.; William Andrew: New York, NY, USA, 1996; Chapter 2; pp. 17–82. [Google Scholar]
- Uçurum, M. Coated Calcite Production and Product Features. J. Undergr. Resour. 2014, 6, 1–10. [Google Scholar]
- Roskill. GrGround & Precipitated Calcium Carbonate: Global Industry, Markets & Outlook, 2nd ed.; Roskill Information Services: London, UK, 2016. [Google Scholar]
- U.S. Geological Survey. Mineral Commodity Summaries; U.S. Geological Survey: Reston, VA, USA, 2019; p. 200. [CrossRef]
- Vanderbilt, R.T. Paints and Coatings, A Guide to Filler Properties and Uses, Technical Data, No. 703. Vanderbilt Minerals. 2013. Available online: https://www.vanderbiltminerals.com/resources/VR_703_Paint_Filler_Minerals_Reference_Web.pdf (accessed on 23 November 2022).
- Rácz, A. Reduction of Surface Roughness and Rounding of Limestone Particles in a Stirred Media Mill Chem. Eng. Technol. 2014, 37, 865–872. [Google Scholar] [CrossRef]
- Hubbe, M.; Gill, R.A. Fillers for Papermaking: A Review of their Properties, Usage Practices, and their Mechanistic Role. BioResources 2016, 11, 78–79. Available online: https://bioresources.cnr.ncsu.edu/BioRes_11/BioRes_11_1_2886_Review_Hubbe_Gill_Fillers_Papermaking_Props_Usage_Prac_Mechanistic_Role_8676.pdf (accessed on 23 November 2022). [CrossRef]
- Gaber, M.A.W. Characterizations of El Minia Limestone for Manufacturing Paper Filler and Coating. Egypt. J. Pet. 2018, 27, 437–443. [Google Scholar] [CrossRef]
- Domingo, C.; Loste, E.; Gómez-Morales, J.; García-Carmona, J.; Fraile, J. Calcite Precipitation by a High-Pressure CO2 Carbonation Route. J. Supercrit. Fluids. 2006, 36, 202–215. [Google Scholar] [CrossRef]
- Hagemeyer, R.W. Pigments for Paper: A Project of the Coating Pigments Committee of Tappi’s Coating & Graphic Arts Division; TAPPI Press: Atlanta, GA, USA, 1997. [Google Scholar]
- Alén, R. Papermaking Chemistry, 2nd ed.; Finnish Paper Engineers’ Association: Helsinki, Finland, 2007. [Google Scholar]
- VTT Products and production. Knowpap, version 11.0; VTT Products and Production: Espoo, Finland, 2009.
- Kumar, N.; Bhardwaj, N.K.; Chakrabarti, S.K. Influence of Particle Size Distribution of Calcium Carbonate Pigments on Coated Paper Whiteness. J. Coat. Technol. Res. 2011, 8, 613–618. [Google Scholar] [CrossRef]
- Olson, E. Particle Shape Factors and Their Use in Image Analysis Part 1: Theory. J. GXP Compliance 2011, 15, 85. [Google Scholar]
- Han, Y.-R.; Seo, Y.-B. Effect of Particle Shape and Size of Calcium Carbonate on Physical Properties of Paper. J. Korea TAPPI 1997, 29, 7–12. [Google Scholar]
- Roufail, R.A. The Effect of Stirred Mill Operatıon on Particles Breakage Mechanism and Their Morphological Features. Ph.D. Thesis, University of British Columbia, Vancouver, BC, Canada, 2011. [Google Scholar]
- Alex, T.C.; Kumar, R.; Roy, S.K.; Mehrotra, S.P. Stirred Bead Mill Grinding of Gibbsite: Surface and Morphological Changes. Adv. Powder Technol. 2008, 19, 483–491. [Google Scholar] [CrossRef]
- Little, L.; Mainza, A.N.; Becker, M.; Wiese, J. Fine grinding: How mill type affects particle shape characteristics and mineral liberation. Miner. Eng. 2017, 111, 148–157. [Google Scholar] [CrossRef]
- Christidis, G.E.; Makri, P.; Perdikatsis, V. Influence of Grinding on the Structure and Colour Properties of Talc, Bentonite and Calcite White Fillers. Clay Miner. 2004, 39, 163–175. [Google Scholar] [CrossRef]
- Miller, N.A.; Henderson, J.J. Quantifying Sand Particle Shape Complexity using a Dy-namic, Digital Imaging Technique. Agron. J. 2010, 102, 1407–1414. [Google Scholar] [CrossRef]
- Vision Analytical Inc. Why Particle Shape Is Important. 2022. Available online: https://particleshape.com/why-particle-shape-is-important, (accessed on 23 November 2022).
- Cayirli, S.; Gökçen, H.S. The Effect of Stirred Mill Orientation at Different Grinding Parameters. In Proceedings of the 16th International Mineral Processing Symposium, Antalya, Turkey, 23–25 October 2018. [Google Scholar]
- Cayirli, S. Influences of Operating Parameters on Dry Ball Mill Performance. Physicochem. Probl. Miner. Process. 2018, 54, 751–762. [Google Scholar] [CrossRef]
- Ipek, H. Effect of Grinding Media Shapes on Breakage Parameters. Part. Part. Syst. Char. 2007, 24, 229–235. [Google Scholar] [CrossRef]
- Malvern Instruments Ltd. Mastersizer 2000 User Manual, MANO384, Issue 1.0, March 2007, Worcestershire, UK. Available online: https://www.malvernpanalytical.com/en/assets/Mastersizer-2000-user-manual-English-MAN0384-1-0_tcm50-11674.pdf (accessed on 23 November 2022).
- Vision Analytical, Principle of Operation. 2022. Available online: https://particleshape.com/principle-of-operation (accessed on 9 December 2022).
- Vision Analytical, Particle Insight Shape Module. 2022. Available online: https://particleshape.com/particle-insight-shape-module (accessed on 9 December 2022).
- Adams, J. Particle Size and Shape Effects in Materials Science: Examples from Polymer and Paper Systems. Clay Miner. 1993, 28, 509–530. [Google Scholar] [CrossRef]
- Datacolor Inc. ELREPHO Spectrophotometer. 2022. Available online: https://www.datacolor.com/business-solutions/product/datacolor-elrepho (accessed on 23 November 2022).
- Cayirli, S. Surface Modification of Calcite: Part II. Characterization Methods and Quality Control Processes. Sci. Min. J. 2020, 59, 65–78. [Google Scholar] [CrossRef]
- BS 3406:1963; Methods for Determination of Particle Size Distribution Guide to Powder Sampling. British Standards Institution: London, UK, 1963.
- Allen, T. Particle Size Measurement, 4th ed.; Powder Technol. Springer: Dordrecht, The Netherlands, 1990. [Google Scholar]
- Ulusoy, U.; Yekeler, M. Dynamic Image Analysis of Calcite Particles Created by Different Mills. Int. J. Miner. Process. 2014, 133, 83–90. [Google Scholar] [CrossRef]
- Palaniandy, S.; Azizli, K.A.M.; Hussin, H.; Hashim, S.F.S. Effect of operational parameters on the breakage mechanism of silica in a jet mill. Miner. Eng. 2008, 21, 380–388. [Google Scholar] [CrossRef]
- Yamamoto, T.; Harada, Y.; Fukui, K.; Yoshida, H. Afm Investigation of the Surface Properties of Silica Particles Dispersed by Bead Milling. Colloids Surf. A Physicochem. Eng. Asp. 2010, 362, 97–101. [Google Scholar] [CrossRef]
- Allen, J. Advances in stirred milling—Improving profitability of copper ore processing. Bulk Solids Handl. 2011, 31, 144. [Google Scholar]
- Wang, C. Comparison of HPGR—Ball Mill and HPGR—Stirred Mill Circuits to the Existing AG/SAG Mill—Ball Mill Circuits. Master’s Thesis, University of Science and Technology Beijing, Beijing, China, 2009. [Google Scholar]
- Wang, Y.; Forssberg, E. Product Size Distribution in Stirred Media Mills. Miner. Eng. 2000, 13, 459–465. [Google Scholar] [CrossRef]
- Frances, C.; Le Bolay, N.; Belaroui, K.; Pons, M.N. Particle morphology of ground gibbsite in different grinding environments. Int. J. Miner. Process. 2001, 61, 41–56. [Google Scholar] [CrossRef]
- Shi, F. Comparison of Grinding Media—Cylpebs Versus Balls. Miner. Eng. 2004, 17, 1259–1268. [Google Scholar] [CrossRef]
- Lourenço, A.F.; Gamelas, J.A.; Sequeira, J.; Ferreira, P.J.; Velho, J.L. Improving Paper Mechanical Properties Using Silica-Modified Ground Calcium Carbonate as Filler. BioResources 2015, 10, 8312–8324. [Google Scholar] [CrossRef]
- Cheng, B.; Lei, M.; Yu, J.; Zhao, X. Preparation of Monodispersed Cubic Calcium Carbonate Particles Via Precipitation Reaction. Mater. Lett. 2004, 58, 1565–1570. [Google Scholar] [CrossRef]
- Lobato, E.M.C. Determination of Surface Free Energies and Aspect Ratio of Talc. Master’s Thesis, Virginia Polytechnic Institute and State University, Blacksburg, VA, USA, 2004. [Google Scholar]
- Lohmander, S. Aspect ratios of pigment particles determined by different methods. Nord. Pulp Pap. Res. J. 2000, 15, 221–230. [Google Scholar] [CrossRef]
- Gupta, C.K. Chemical Metallurgy: Principles and Practice; WILEY-VCH Verlag GmbH & Co.: Weinheim, Germany, 2003; Chapter 2; pp. 119–121. [Google Scholar]
- Ulusoy, U. Application of Anova to Image Analysis Results of Talc Particles Produced by Different Milling. Powder Technol. 2008, 188, 133–138. [Google Scholar] [CrossRef]
- Jeong, S.-B.; Yang, Y.-C.; Chae, Y.-B.; Kim, B.-G. Characteristics of the Treated Ground Calcium Carbonate Powder with Stearic Acid Using the Dry Process Coating System. Mater. Trans. 2009, 50, 409–414. [Google Scholar] [CrossRef]
- Toraman, O.; Çayirli, S.; Uçurum, M. The Grinding-Aids Effect of Moisture, Triethanolamine (Tea) and Ethylene Glycol (Eg) on Grinding Performance and Product Quality of Calcite. Int. J. Eng. Res. Sci. 2016, 2, 121–128. [Google Scholar]
- Lin, I.J.; Somasundaran, P. Alterations in Properties of Samples During Their Preparation by Grinding. Powder Technol. 1972, 6, 171–179. [Google Scholar] [CrossRef]
- Lin, I.; Nadiv, S.; Grodzian, D. Changes in the State of Solids and Mechano-Chemical Reactions in Prolonged Comminution Processes. Miner. Sci. Eng. 1975, 7, 313–336. [Google Scholar]
- Siesholtz, H.W.; Cohan, L.H. Calcium Carbonate Extender Pigments. Ind. Eng. Chem. 1949, 41, 390–395. [Google Scholar] [CrossRef]
- Wilson, I. Filler and Coating Pigments for Papermakers. In Industrial Minerals & Rocks; Kogel, J.E., Trivedi, N.C., Barker, J.M., Krukowski, T.S., Eds.; SME: Littleton, CO, USA, 2006; pp. 1287–1300. [Google Scholar]
- Ercan, M.; Koltka, S.; Sabah, E. The Production of Ground Calcium Carbonate (GCC) from Marble Wastes: Comparison of Wet and Dry Grinding Products. Sci. Min. J. 2018, 57, 35–43. [Google Scholar] [CrossRef]
- Inoue, M.; Hirasawa, I. The Relationship between Crystal Morphology and Xrd Peak Intensity on CaSO4·2H2O. J. Cryst. Growth. 2013, 380, 169–175. [Google Scholar] [CrossRef]
- Holder, C.F.; Schaak, R.E. Tutorial on Powder X-Ray Diffraction for Characterizing Nanoscale Materials. ACS Nano. 2019, 13, 7359–7365. [Google Scholar] [CrossRef]
- Boke, J.W. Calcium Carbonate Particle Size Effects on Titanium Dioxide Light Scattering in Coatings. Master’s Thesis, Faculty of California Polytechnic State University, San Luis Obispo, CA, USA, 2013. [Google Scholar]
- Huo, C.; Shen, J.; Xia, Q. Preparation of Composite Ground Calcium Carbonate in Ca(OH)2–H2O–CO2 System and Characterization. In Advanced Materials Research; Trans Tech Publications Ltd.: Wallero, Switzerland, 2011; Volume 287–290, pp. 548–552. [Google Scholar] [CrossRef]
- Karakaş, F.; Çelik, M.S. Effect of Quantity and Size Distribution of Calcite Filler on the Quality of Water Borne Paints. Prog. Org. Coat. 2012, 74, 555–563. [Google Scholar] [CrossRef]


Disclaimer/Publisher’s Note: The statements, opinions and data contained in all publications are solely those of the individual author(s) and contributor(s) and not of MDPI and/or the editor(s). MDPI and/or the editor(s) disclaim responsibility for any injury to people or property resulting from any ideas, methods, instructions or products referred to in the content. |
© 2023 by the authors. Licensee MDPI, Basel, Switzerland. This article is an open access article distributed under the terms and conditions of the Creative Commons Attribution (CC BY) license (https://creativecommons.org/licenses/by/4.0/).