1. Introduction
Copper porphyry deposits are the most important and typical copper source for copper mines. It has been reported that more than 95% of copper mines in Chile are copper porphyry deposits [
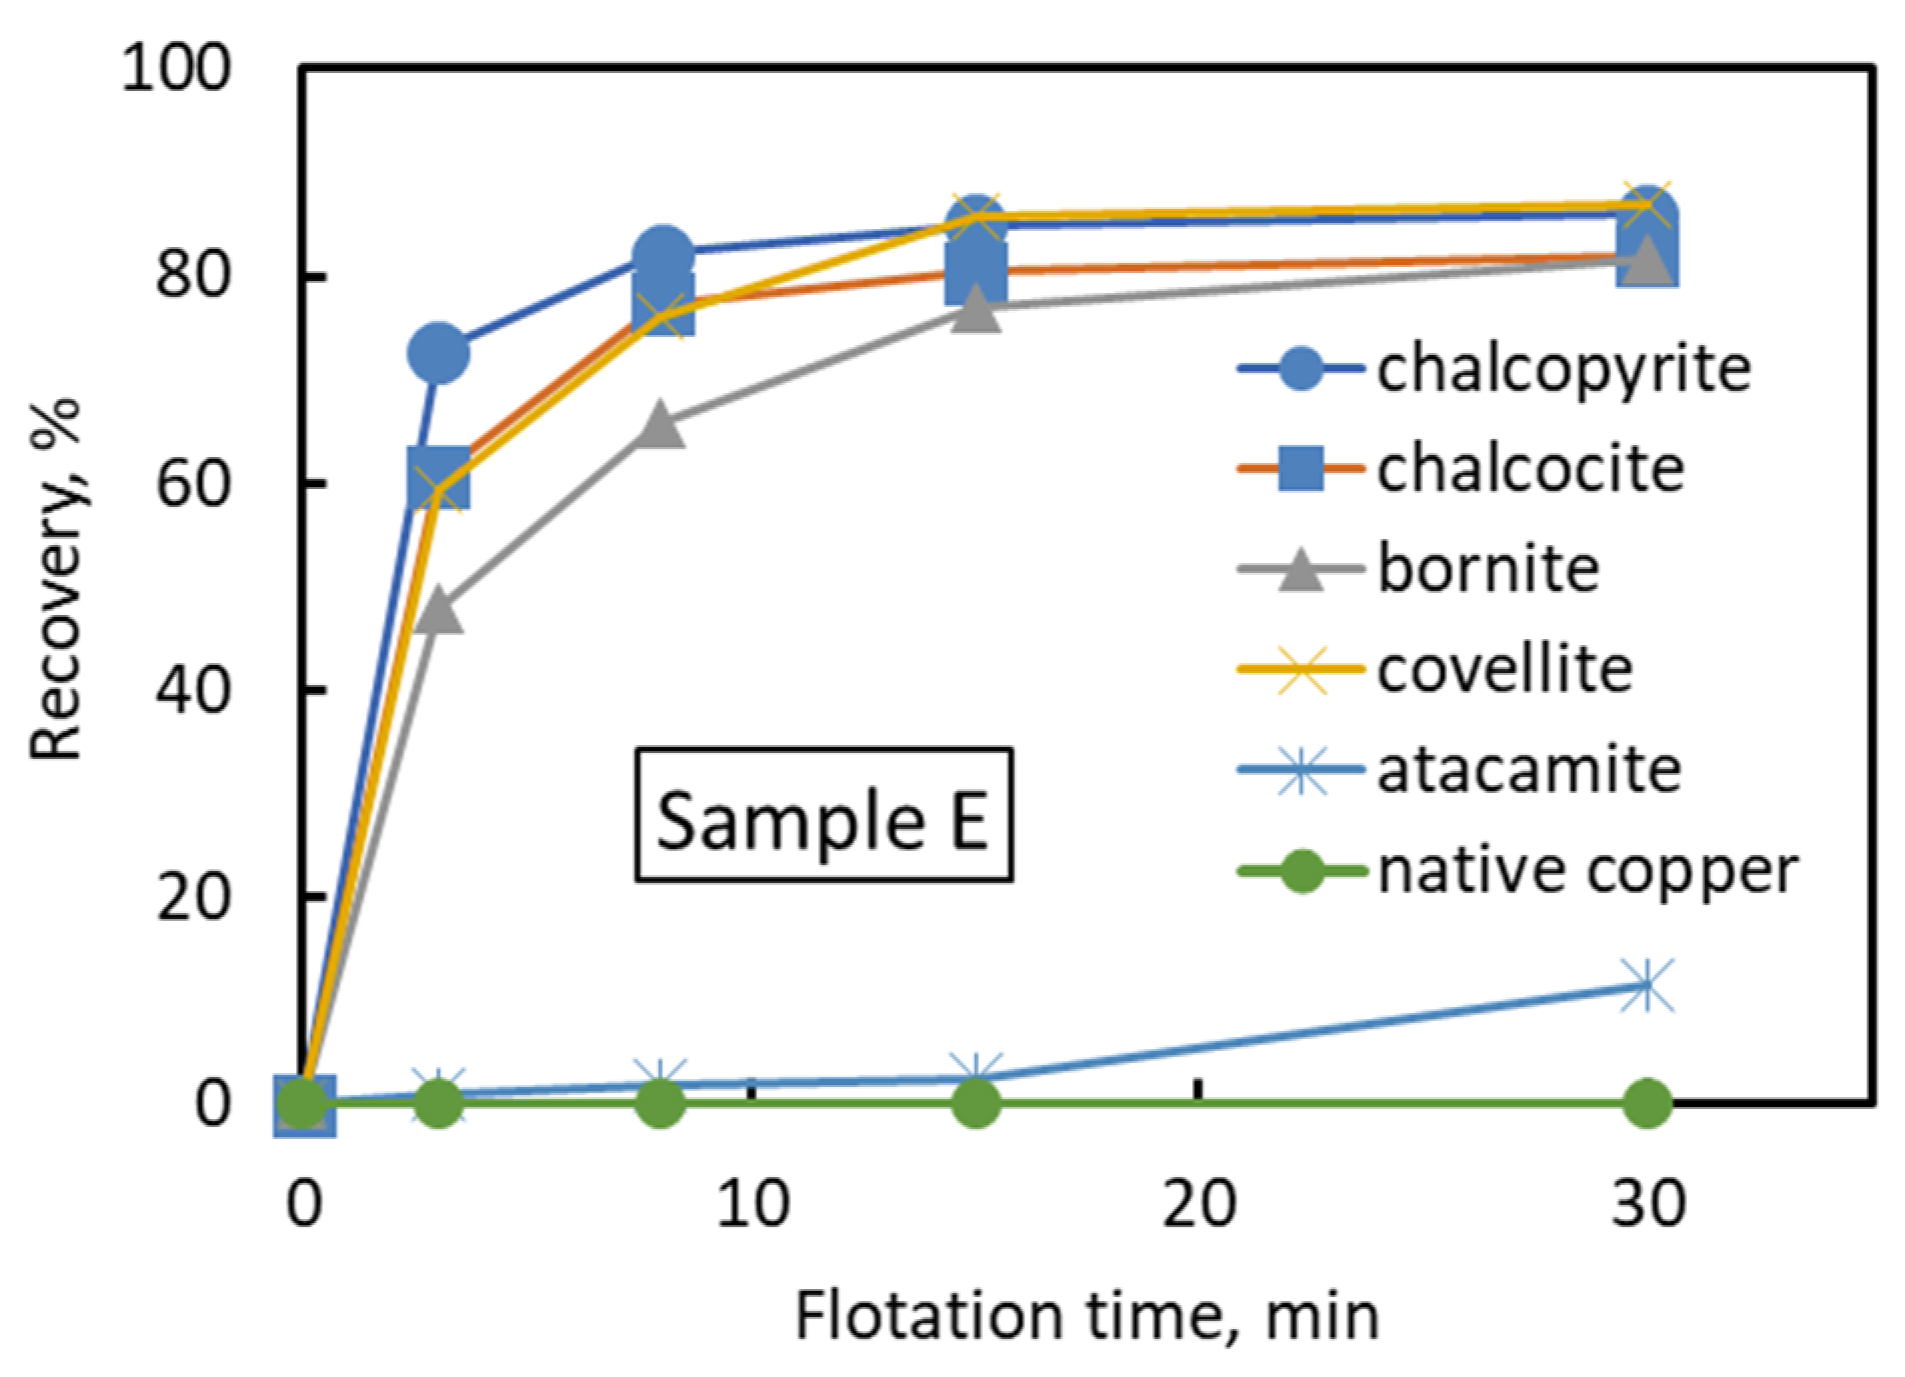
1]. Typical copper porphyry deposits comprise oxidized ore zones, secondary sulfide ore zones, and primary sulfide ore zones from the surface to the deep. Each zone contains characteristic copper minerals, e.g., chalcopyrite (CuFeS
2) and bornite (Cu
5FeS
4) in the primary sulfide ore zone, chalcocite (Cu
2S) and covellite (CuS) in the secondary sulfide ore zone, and atacamite (Cu
2(OH)
3Cl) and natural copper (Cu) in the oxide ore zone [
1]. In addition, these copper minerals are often associated with molybdenite (MoS
2), which is the main molybdenum source, and both copper and molybdenum minerals are recovered [
2,
3,
4].
The initial beneficiation stage of these copper and molybdenum minerals commonly includes flotation [
3,
5]. Flotation is widely used in mineral processing to separate minerals based on the difference in surface hydrophobicity. In the conventional flotation circuit, the copper sulfide minerals are collected as a froth product. Meanwhile, the other hydrophilic and oxide minerals are separated as a sink. If required, the copper oxide minerals can be recovered as froth with sulfurization.
Generally, the copper porphyry ores are mined from several locations in the mining sites; thus, the mineral composition, oxidation degree, and copper grade vary greatly, which can affect the flotation performance. To overcome this problem, it is a common practice in a mining operation to blend these ores and provide a stable feed composition for maintaining an optimum flotation condition. However, the blending is carried out empirically, and the mixing ratio may change daily. Therefore, it is important to predict the effect of mixing ratio and mineralogical composition on the flotation rate and recovery, as well as the mineral grade, in advance. Allahkarami et al. [
6] estimated the copper and molybdenum grade and recoveries in an industrial flotation plant using an artificial neural network (ANN). However, this ANN method did not consider the mineralogical aspect of the feed and the flotation behavior of individual copper and molybdenum minerals as the input parameter. On the other hand, Tijsseling et al. [
7] used a mineralogical study to predict the flotation performance. However, their study focused on sediment-hosted copper–cobalt sulfide ore. Therefore, it is necessary to estimate the flotation behavior of blended ore on the basis of the mineralogical composition of each ore.
Conversely, seawater usage demand for mineral processing, including flotation processes, has recently increased, and various flotation estimation tests in seawater are necessary. Seawater or saline water has been used in the Las Luces copper–molybdenum (Cu–Mo) beneficiation plant in Taltal, Chile, in the Michilla Project, Chile, and the KCGM Project, Australia for processing sulfide minerals [
8,
9,
10,
11]. Although Alvarez and Castro [
12] and Castro [
13] showed that the use of seawater does not affect the flotation of pure chalcopyrite, various studies have shown that seawater contains various alkali metals ions that influence the flotation behavior of copper and molybdenum minerals [
14,
15,
16,
17,
18,
19,
20,
21,
22,
23,
24,
25]. Previous work by Hirajima et al. [
26], Suyantara et al. [
24], and Li et al. [
27] showed that the colloidal magnesium hydroxide precipitate was the most detrimental ingredient for chalcopyrite and molybdenite flotation in seawater at high pH. However, there are limited studies available on the prediction of flotation performance of copper and molybdenum minerals from various Cu–Mo ores in seawater.
Fullston et al. [
28] revealed that the degree of oxidation of copper-containing sulfide minerals can be ranked using zeta potential analysis in water, and they concluded that chalcocite is the most oxidized, followed by bornite, covellite, and chalcopyrite. This means that chalcocite and bornite are more easily oxidized than chalcopyrite. In addition, the various oxidation degrees of chalcopyrite, bornite, and molybdenite affect the flotation behavior of these minerals [
29,
30,
31]. However, these studies were carried out using pure minerals; thus, it is important to study the effect of the degree of oxidation of copper and molybdenum minerals from various Cu–Mo ores.
In this study, the effect of the degree of oxidation on the recovery of copper and molybdenum minerals from various Cu–Mo ores in seawater was investigated. Furthermore, the effect of the mixing ratio of various Cu–Mo ores and mineralogical compositions on the flotation recovery was evaluated. It might be hypothesized that the flotation kinetics of blended Cu–Mo ore in seawater can be estimated by the flotation kinetics of each copper and molybdenum mineral from each Cu–Mo ore. Therefore, a mineralogical prediction model was proposed to estimate the flotation behavior of blended Cu–Mo ore on the basis of the flotation behavior of each Cu–Mo ore in this study.
2. Materials and Methods
2.1. Materials
The five ore samples used in the flotation tests were prepared and labeled as Samples A, B, C, D, and E. Samples A and B were from the primary sulfide zone, samples C and D were from the secondary sulfide zone, and Sample E was from the oxide zone in the copper porphyry deposit in Chile. The ore samples were crushed using a jaw crusher (passing 6 mm) at the operating mine, crushed under 1.68 mm using a roll-crusher, and then packed in bags. Each bag contained a 0.875 kg ore sample, which was used for the flotation tests. Each ore sample was stored at −40 °C to minimize oxidation. The ore samples were thawed before being used for the flotation tests. The seawater for flotation was taken from Niihama, Ehime Prefecture, Japan, and the chemical composition of seawater is presented in
Table 1.
2.2. Analysis of Mineral Composition
Analysis of the mineral composition of the flotation feed and products was conducted using XRD (Malvern PANalytical, X’Pert Pro, EA Almelo, The Netherlands) and mineral liberation analysis (FEI, MLA650F, United States of America). A mineral list for MLA was prepared to identify the minerals on the basis of the minerals detected by XRD and the mineral database, which contains elemental compositions of approximately 500 minerals. The flotation tail contained low-grade copper and molybdenum and had a wide particle size distribution, which may affect the MLA results. Therefore, the flotation products were sieved using a 106 μm and 20 μm Tyler sieves to accurately analyze the mineral composition. The MLA measurements were conducted using two modes (i.e., extended back-scattered electron (XBSE) mode and sparse phase liberation (SPL) mode). The XBSE mode was used to analyze all minerals in the sample, and the SPL mode was used to analyze the mineral composition of copper and molybdenum. The samples were solidified with bakelite resin (sumilite resin@ PR-50252, Sumitomo Bakelite Co., Ltd., Tokyo, Japan) and then mixed with phenol resin (MultiFast Black, Struers Co., Ltd., Struer, Denmark) for hot solidification. The solidified fractions were polished with water-resistant abrasive papers (Struers Co., Ltd., Struer, Denmark) and SiC paper (Struers Co., Ltd., Struer, Denmark), before buffing with diamond suspensions (Struers Co., Ltd., Struer, Denmark) to a mirror finish, which were used as samples for MLA. The standard deviation for mineral liberation analysis was estimated at ca. 1.3%
2.3. Chemical Assay for Each Sample
Chemical analysis via inductively coupled plasma atomic emission spectroscopy (ICP-AES, Agilent ICP-AES 5100, Santa Clara, CA, USA) was conducted for all ore samples. The total copper (TCu) and total molybdenum (TMo) were analyzed by an alkaline melting method, in which samples were mixed with sodium peroxide (Na2O2, Kanto Chemical Co., Ltd., Tokyo, Japan) and melted at 800 °C. The sample obtained by alkali melting was dissolved in 10% dilute hydrochloric acid (HCl, Kanto Chemical Co., Inc., Tokyo, Japan) and analyzed by ICP-AES. The standard deviation for chemical analysis was estimated at ca. 0.03%.
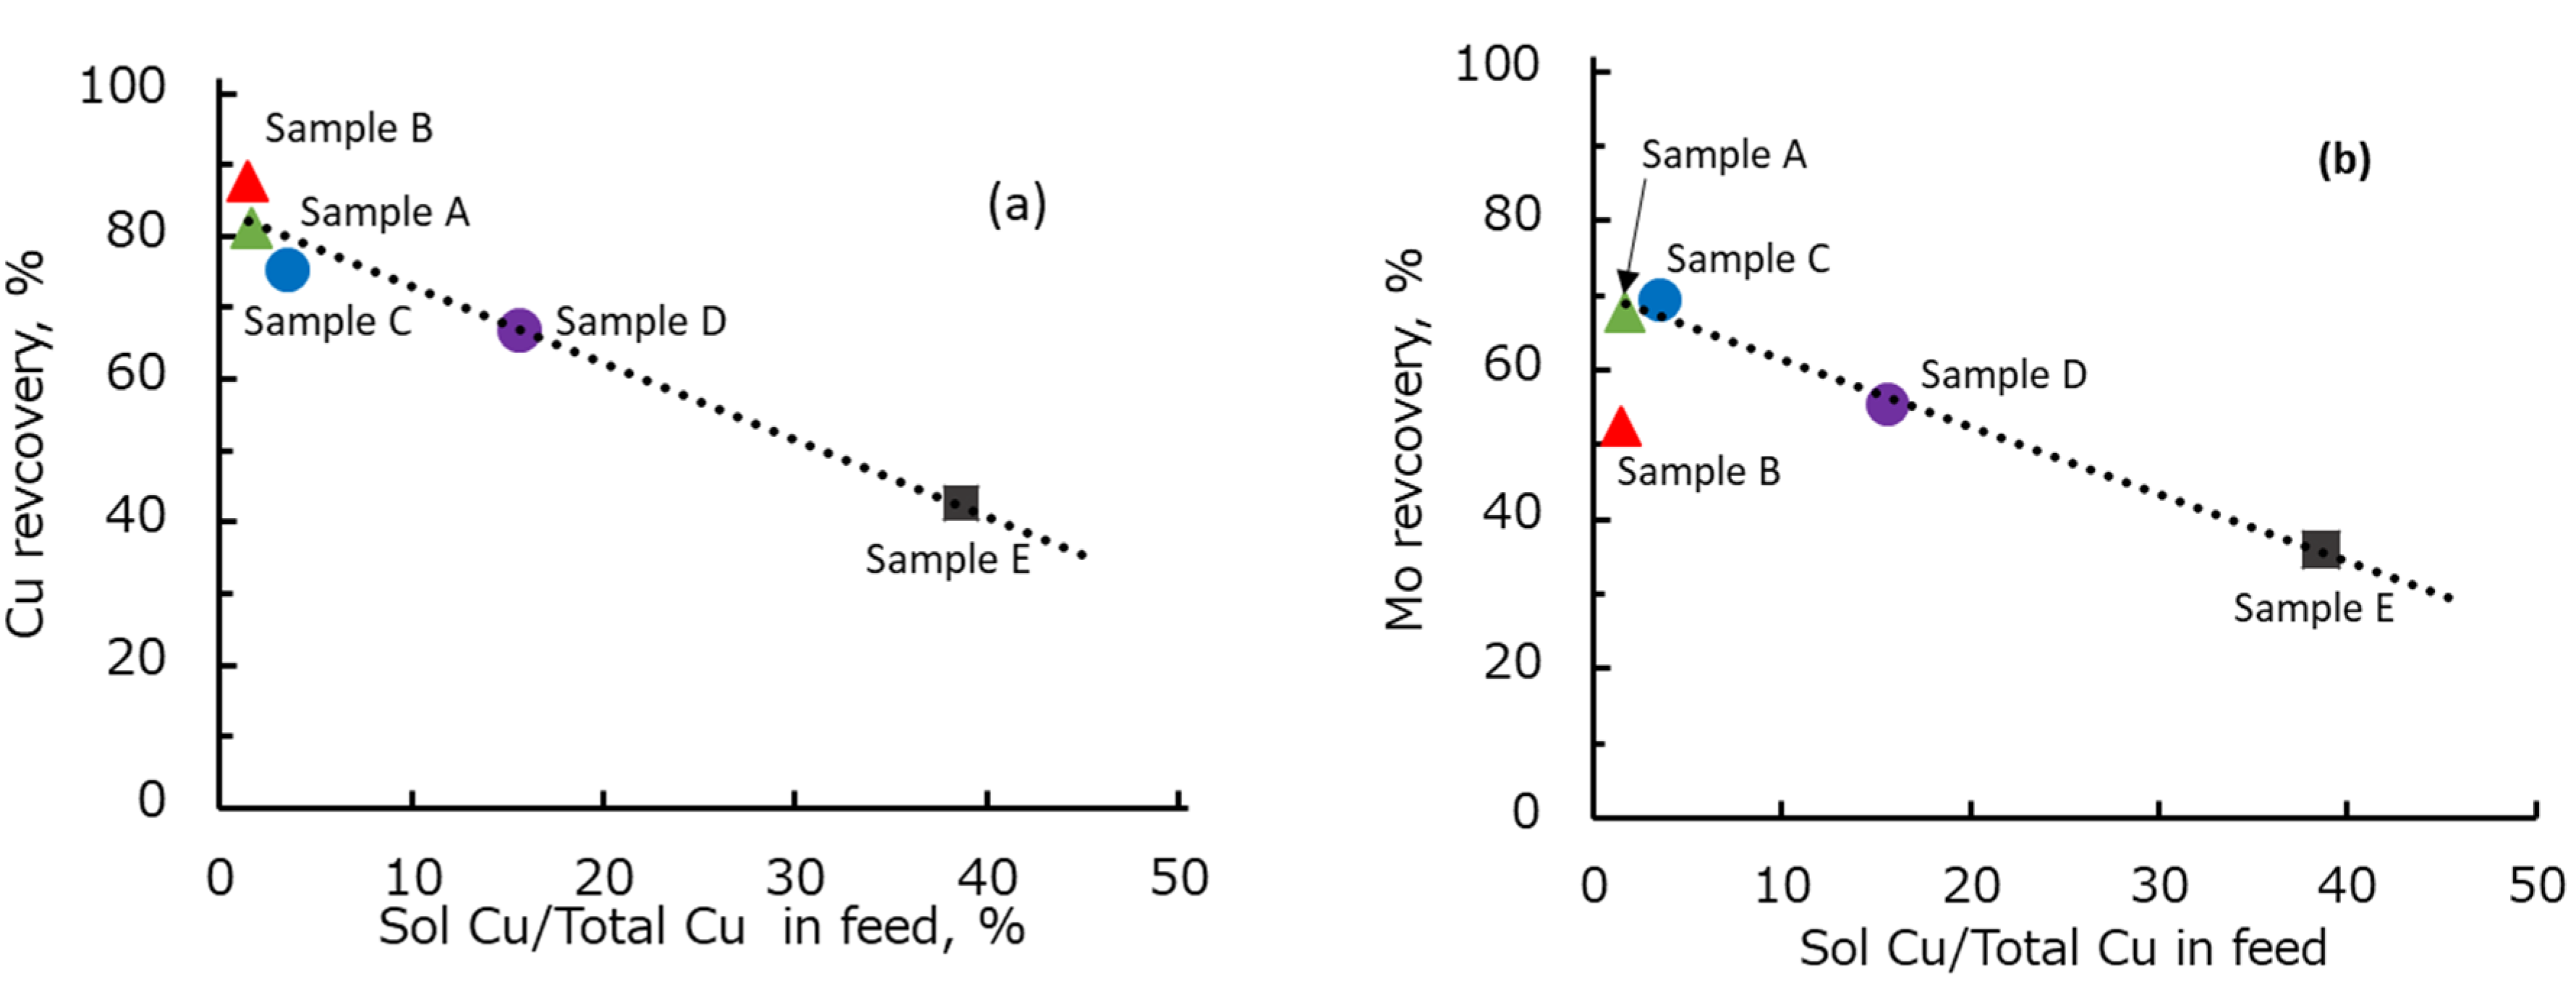
Analysis of acid-soluble copper (Sol. Cu) was conducted by mixing 1 g of ore sample with 50 mL of 1 M citric acid, and the mixture was stirred at 130 rpm for 1 h. The entire volume was adjusted to 100 mL via the addition of water. The mixture was filtered using filter paper with a pore diameter of 1 µm. The copper grade in the recovered filtrate was measured using ICP-AES. The acid-soluble copper and molybdenum assay relates to the copper and molybdenum minerals associated with the oxide minerals [
32]. Therefore, the oxidation degree of copper or molybdenum in the ore was estimated as the ratio of acid-soluble Cu or Mo to the total Cu or Mo (Equations (1) and (2)).
2.4. Flotation Experiments
All flotation tests were conducted using a Denver-type flotation machine. A thionocarbamate (MX7017, Cytec Industries Inc., Woodland Park, NJ, USA) was used as the copper collector, diesel oil (diesel, Idemitsu Kosan Co., Ltd., Tokyo, Japan) was used as the molybdenum collector, methyl isobutyl carbinol (MIBC, Kanto Chemical Co., Ltd., Tokyo, Japan) was used as the frother, and slaked lime (Fujifilm Wako Pure Chemical Co., Ltd., Tokyo, Japan) was used as the pH modifier. The dosages of these reagents in the flotation tests were referenced to the dosage at the operating mine.
The ore samples (0.875 kg) were mixed with 500 mL of seawater in a stainless-steel (SUS304) mill with stainless-steel rods (SUS304). Pulp density was 57% (
w/
w). Thionocarbamate (30 g/t) and diesel oil (15 g/t) were added and ground for 10 min. Subsequently, the grinding medium was changed from the stainless-steel rod to the steel ball. The grinding time with the steel ball was adjusted for each ore (
Table 2) to achieve a P
80 of 170 µm.
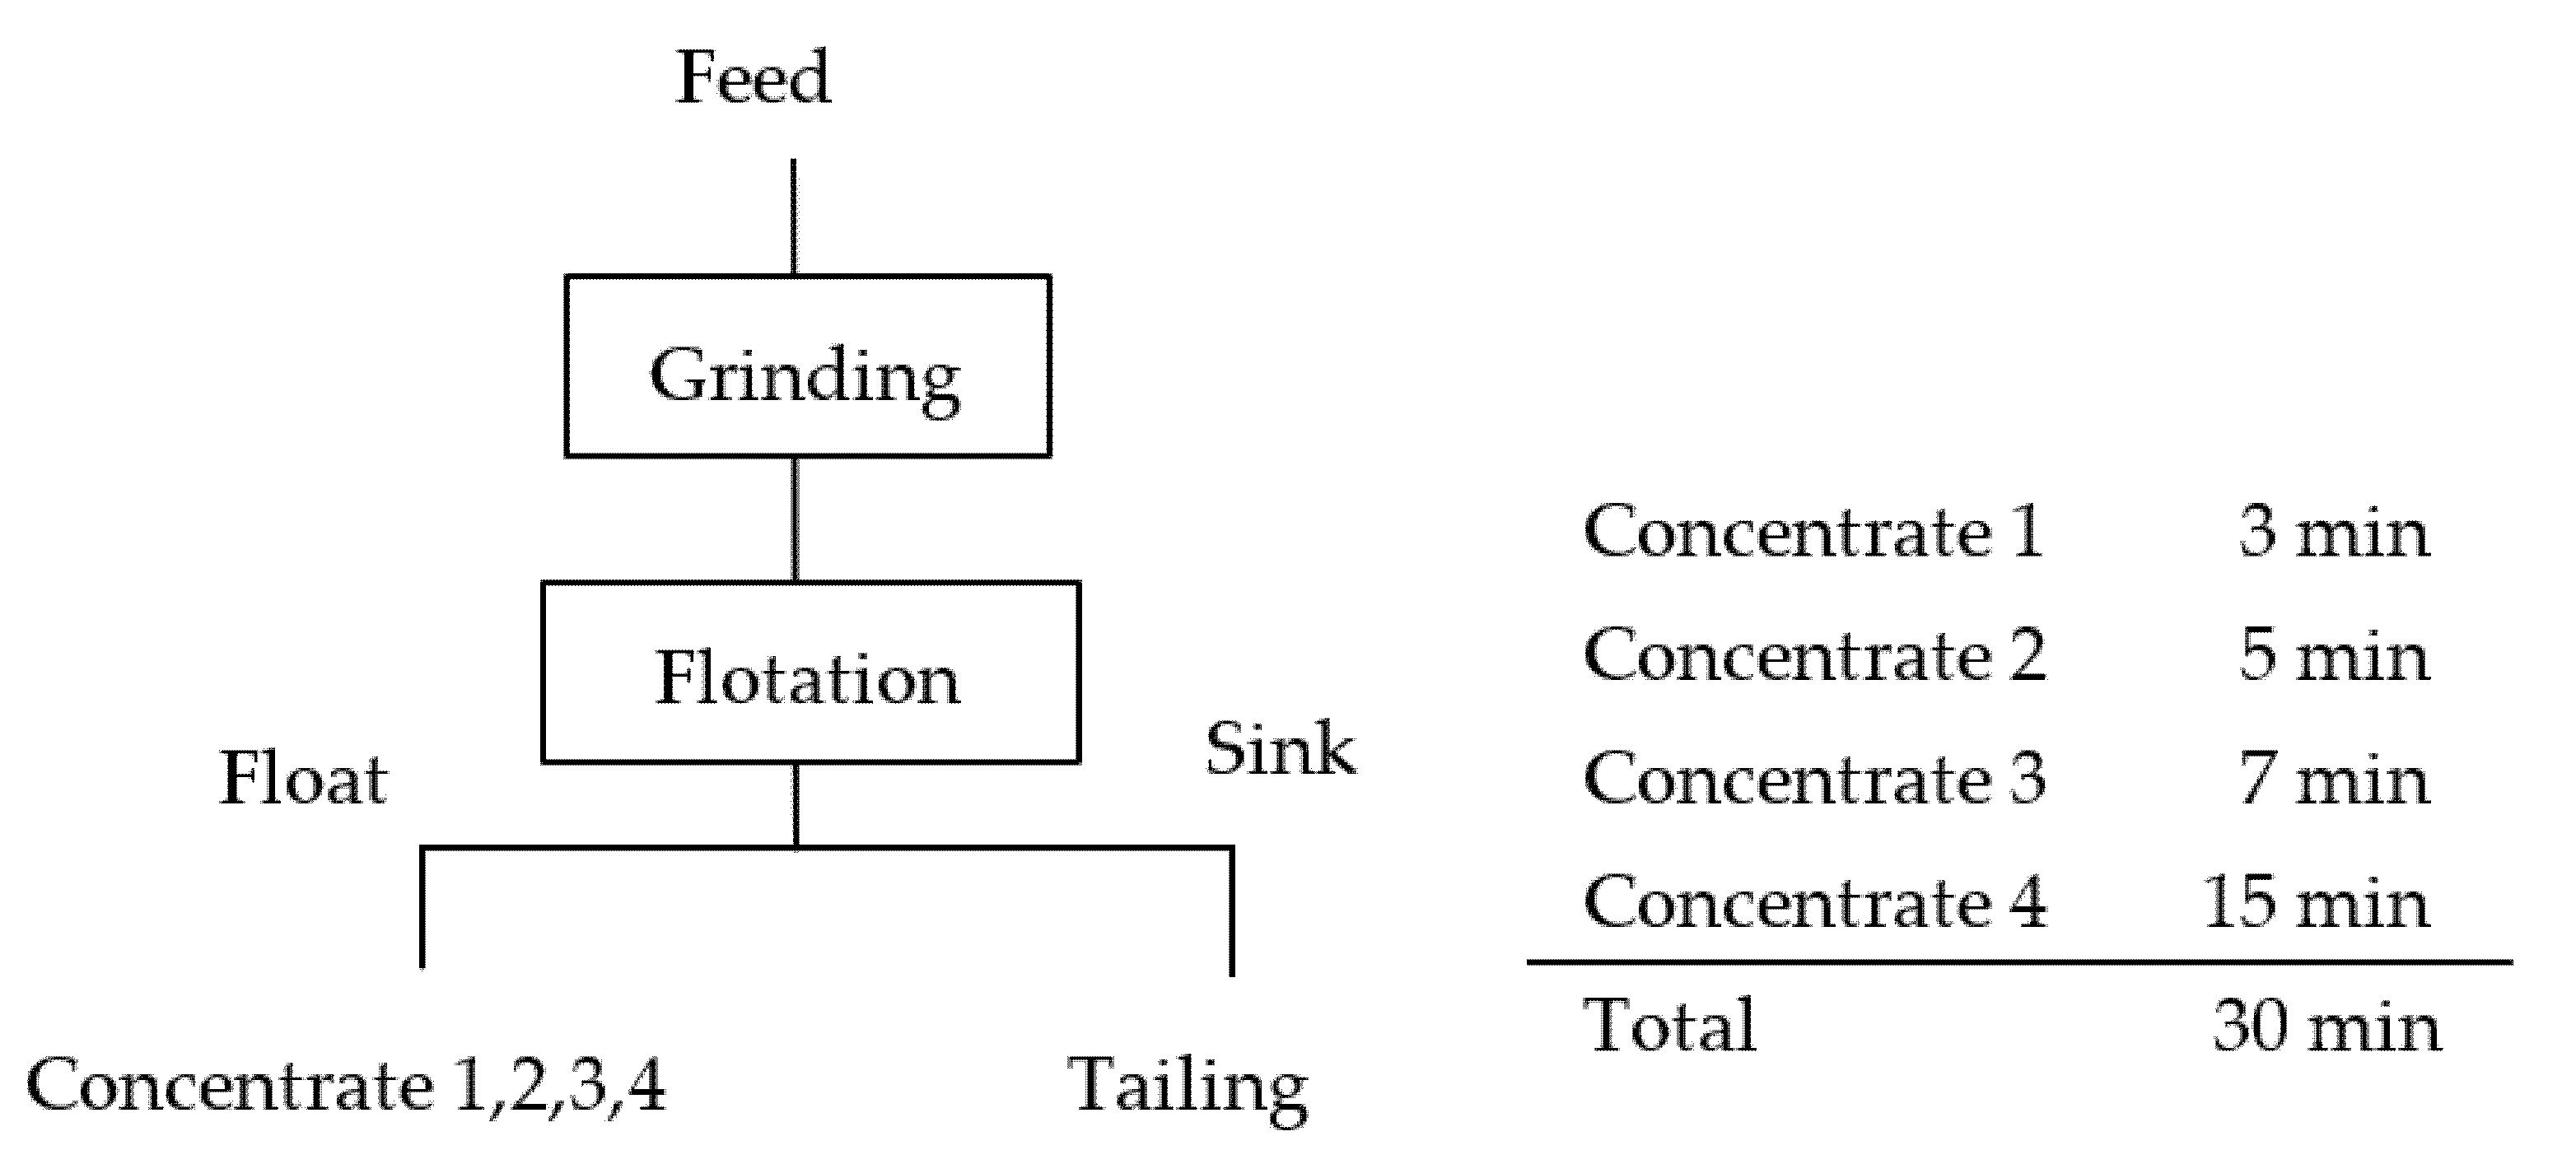
The ground product was fed into a 500 g flotation cell. Seawater was added to adjust the pulp density to 33 wt.%, and then MIBC (15 g/t) was added. The conditioning time was 1 min. Slaked lime was then added to adjust the pulp pH to 8.5. The flotation test was conducted for 30 min and the froth was collected every 3 min, 8 min, 15 min, and 30 min. Each product was filtered, dried at 110 °C, and weighed.
Figure 1 shows the flowsheet of the flotation experiment.
4. Conclusions
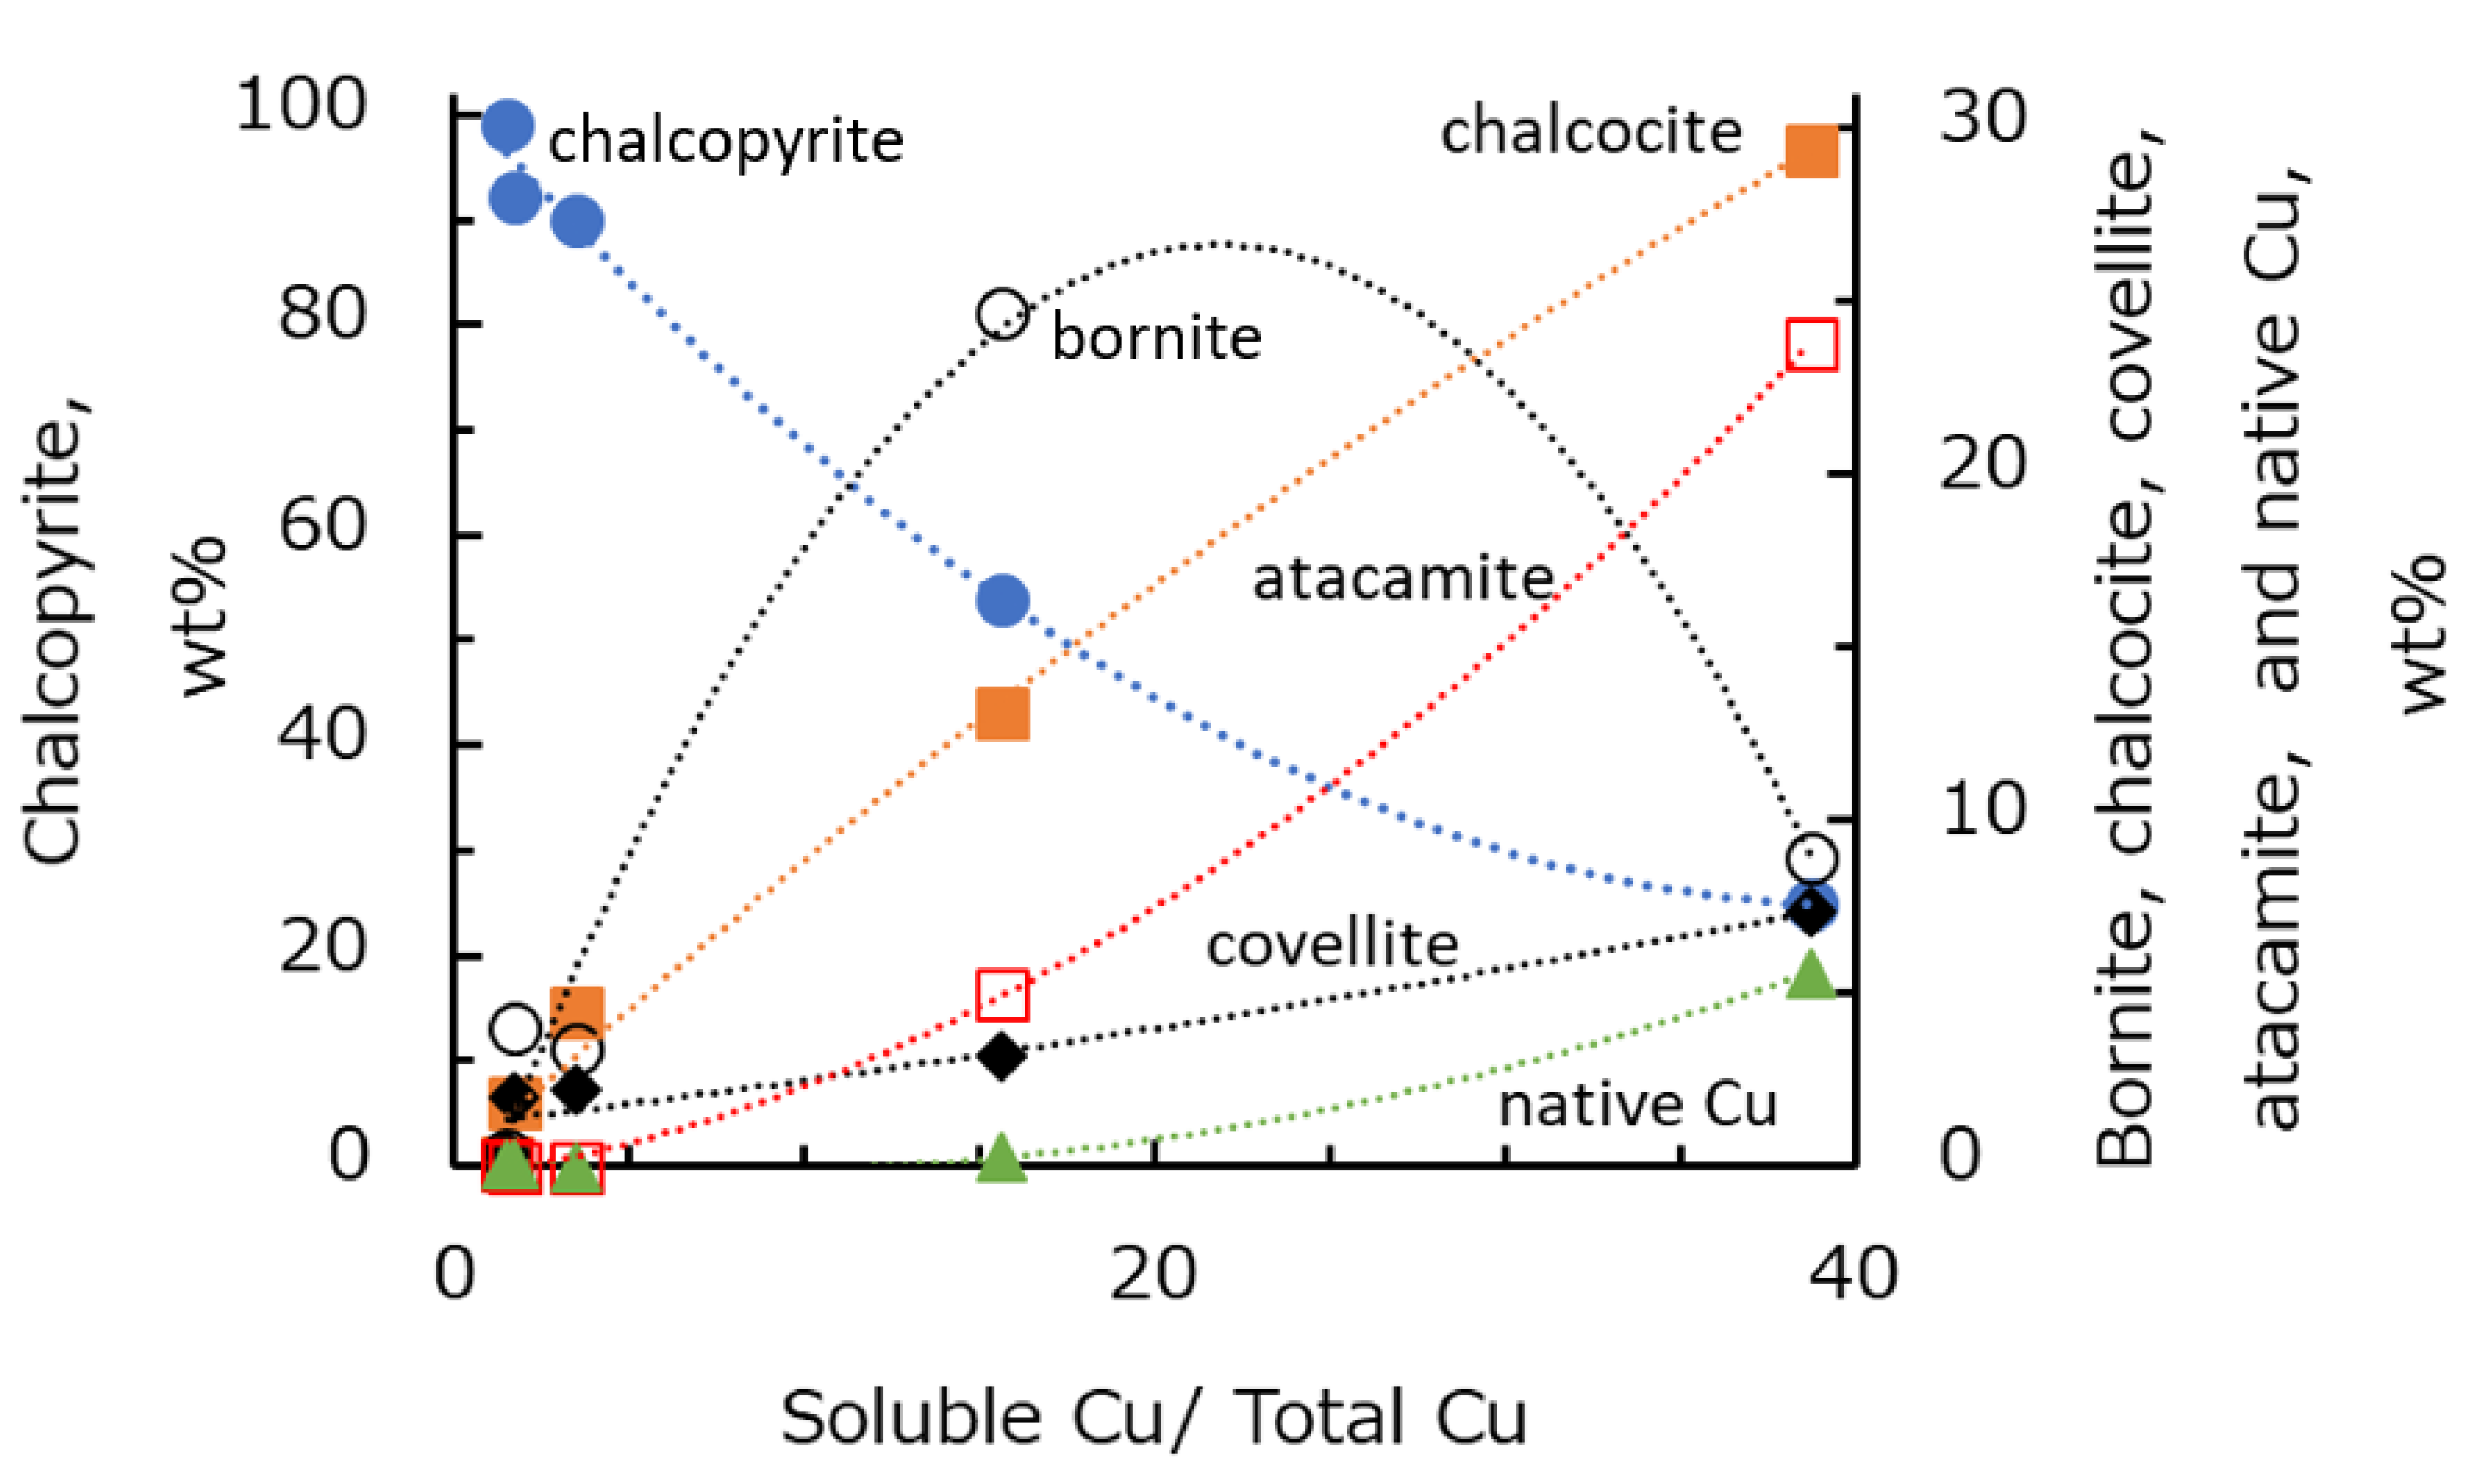
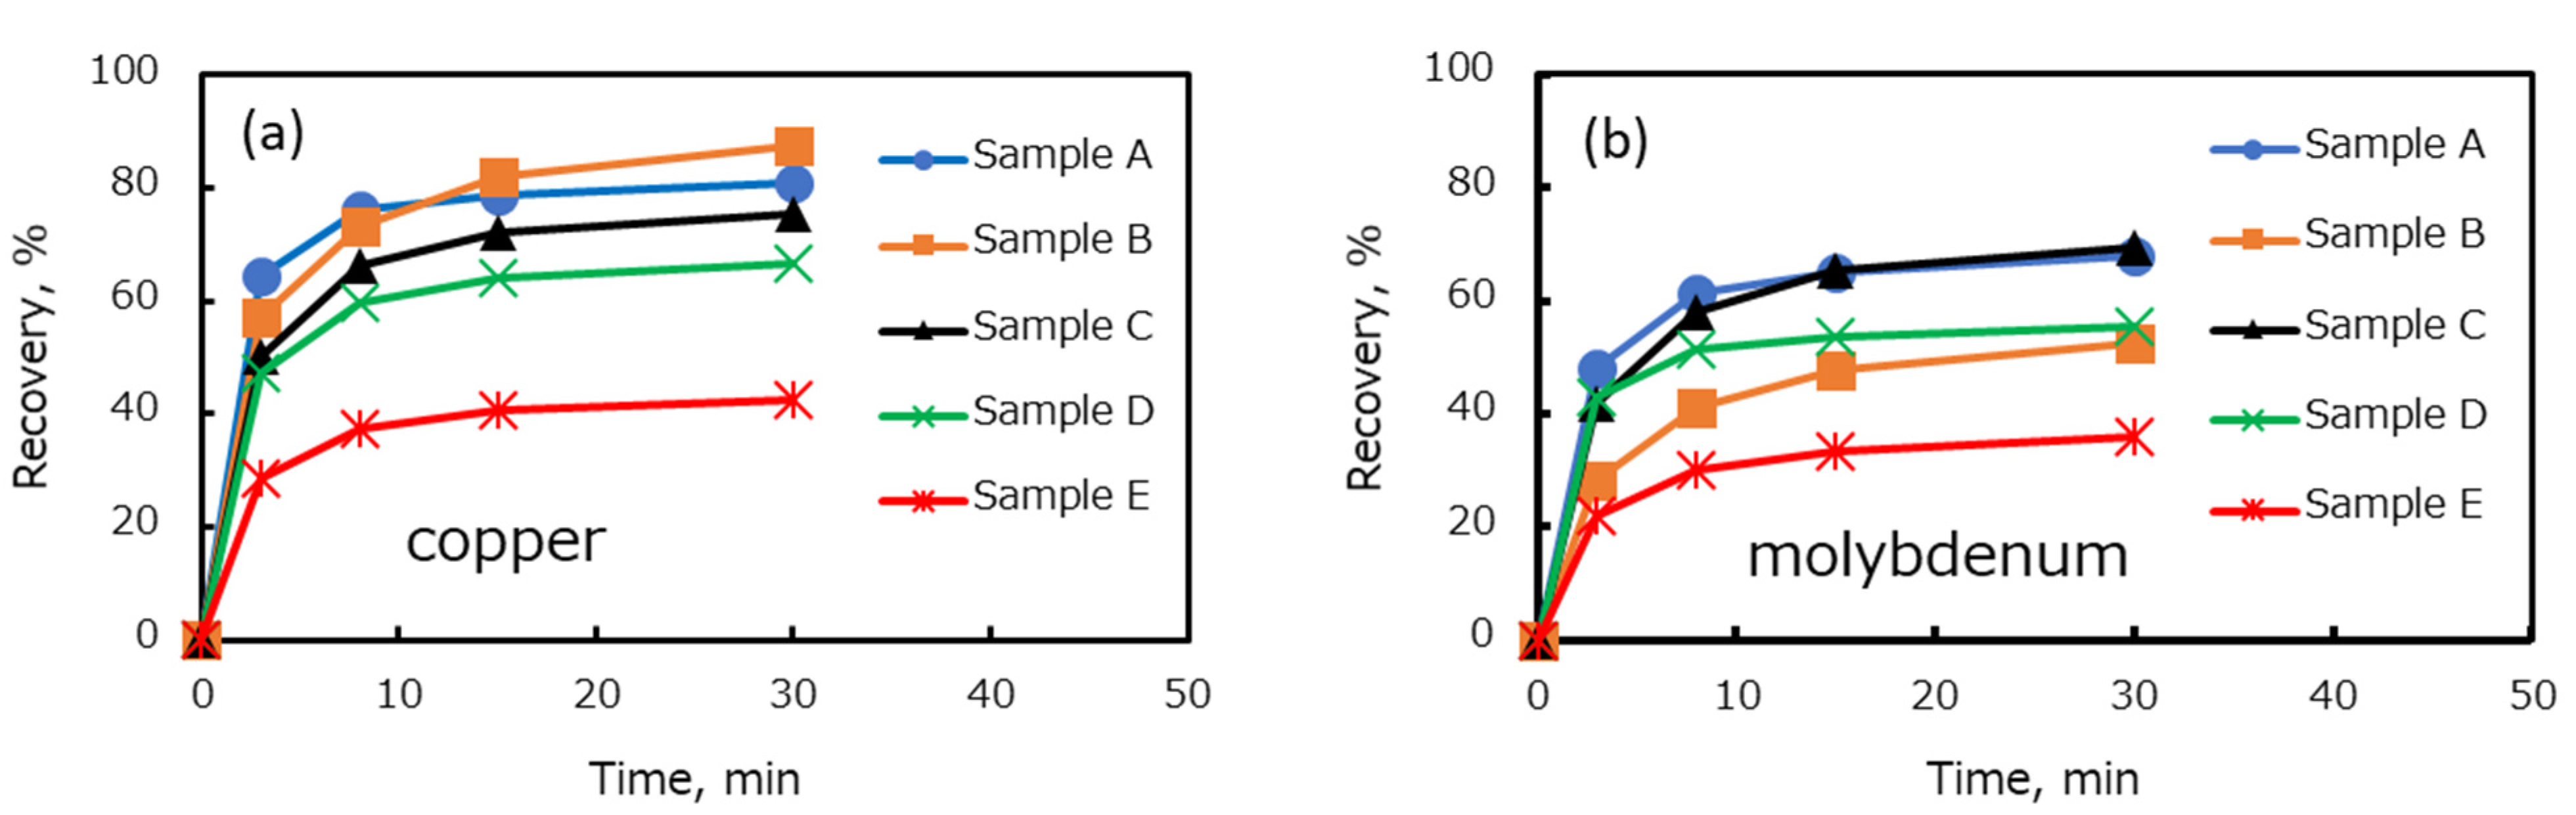
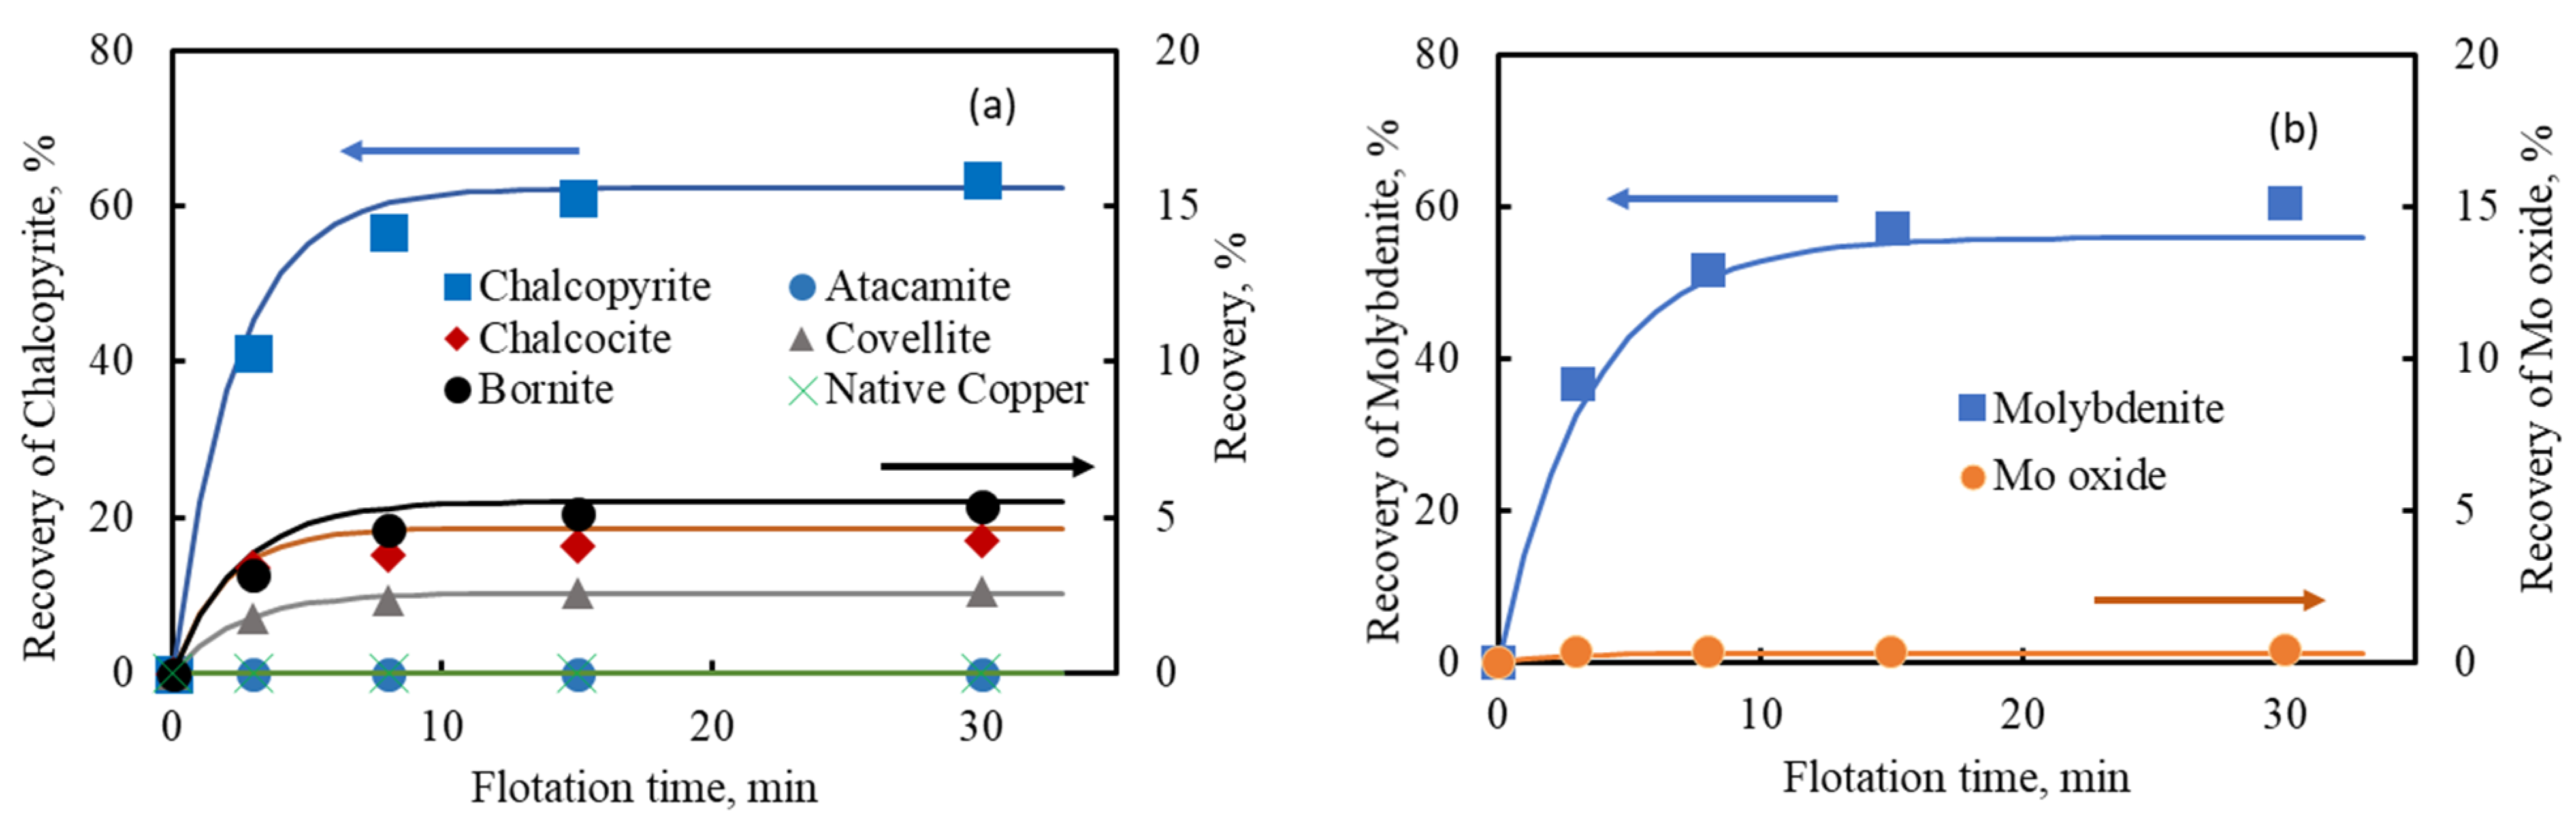
In this study, five types of Cu–Mo ore with different degrees of oxidation were collected from operated copper–molybdenum mines. The floatability test of individual and blended ores was carried out in seawater. Mineralogical analysis was performed to identify the copper and molybdenum minerals in each Cu–Mo ore. It was shown that the recovery of copper and molybdenum in seawater decreased with increasing copper oxidation degree in each Cu–Mo ore. In addition, the dissolved copper from copper oxidation during the grinding at low pH might precipitate on the surface of copper and molybdenum minerals at pH 8.5, thus suppressing the floatability of copper and molybdenum minerals. Mineralogical analysis showed that the copper and molybdenum minerals in each Cu–Mo ore were chalcopyrite, bornite, chalcocite, covellite, atacamite, native copper, molybdenite, and molybdenum oxide. The proportion of atacamite and native copper in the Cu–Mo ore was strongly correlated with the degree of copper oxidation.
The mineralogical prediction was performed on the basis of the flotation kinetics parameters (i.e., kinetics coefficient (k) and maximum recovery (Rmax)) of each copper and molybdenum mineral in the various Cu–Mo ores. The mineralogical prediction was used to estimate the flotation kinetics parameters of blended Cu–Mo ore. It was shown that a simple mineralogical prediction based on the Rmax and k of each copper and molybdenum minerals in the various Cu–Mo ores, the blending ratio of each Cu–Mo ore, total Cu or Mo and the mineral composition of the feed ore can be used to estimate the flotation recovery of blended Cu–Mo ore. This estimation method might be useful for industrial applications to predict the flotation behavior of blended Cu–Mo ore if the proportion of each Cu–Mo ore is known.


 ,
, 


