Article

Types and Quantitative Characterization of Microfractures in the Continental Shale of the Da’anzhai Member of the Ziliujing Formation in Northeast Sichuan, China

1
State Key Laboratory of Petroleum Resources and Prospecting, China University of Petroleum, Beijing 102249, China
2
Unconventional Natural Gas Research Institute, China University of Petroleum, Beijing 102249, China
3
Southern Company of Exploration SINOPEC, Chengdu 610041, China
*
Author to whom correspondence should be addressed.
Minerals 2021, 11(8), 870; https://doi.org/10.3390/min11080870
Submission received: 26 May 2021 / Revised: 17 July 2021 / Accepted: 3 August 2021 / Published: 12 August 2021
(This article belongs to the Section Mineral Deposits)

Abstract

:
A number of wells in the Sichuan Basin of China have tested industrial gas flow pressure arising from the shale of the Da’anzhai section of the Ziliujing Formation, revealing good exploration potential. Microfractures in shales affect the enrichment and preservation of shale gas and are important storage spaces and seepage channels for gas. In order to increase productivity and to reduce the risks associated with shale gas exploration, the types, connectivity, and proportion of microfractures in the Da’anzhai Member have been studied in this work by core and thin section observations, micro-CT, scanning electron microscopy, nitrogen adsorption, and high-pressure mercury intrusion. The results show that four types of fractures have developed in the shale of the Da’anzhai section: microfractures caused by tectonic stress, diagenetic shrinkage fractures of clay minerals, marginal shrinkage fractures of organic matter, and microfractures inside mineral particles. Among these, structural fractures and organic matter contraction fractures are the main types and are significant for shale reservoirs and seepage. The structural microfractures are mainly opened and are well-developed in the shale, with a straight shape, mainly between bedding, with the fracture surface being curved, fully opened, and mainly tensile. Organic matter fractures often develop on the edge of the contact between organic matter and minerals, presenting a slit-like appearance. The fractures related to bedding in the shale are particularly developed, with larger openings, wider extensions, intersecting and expanding, and forming a three-dimensional interconnected pore-fracture system. Based on image recognition, generally speaking, microfractures account for about 20% of the total pore volume. However, the degree of the microfractures’ development varies greatly, depending upon the structural environment, with the proportion of microfractures in fault-wrinkle belts and high-steep zones reaching 40% to 90% of the total pore space. On the other hand, micro-fractures in areas with underdeveloped structures account for about 10% of the total pore space.

1. Introduction

Fractures in shale affect the enrichment and preservation of shale gas [1,2,3,4,5], where they form the seepage channels for gas. Fracture studies in the shale gas exploration stage can therefore provide a reference for the optimal areas for shale gas exploration [6,7,8,9]. In the development stage of shale gas reservoirs, the effectiveness and permeability anisotropy of fractures directly affects the pattern of the deployment of the extraction wells and the reservoir fracturing reformation [10,11,12,13], which is an important reference for horizontal well deployment and geosteering [14]. In addition, the existence of shale cracks provides storage space for shale gas [15,16,17]. Fractures can be classified according to their cause and scale, and there are various classification schemes [18]. Due to their various scales and development characteristics, these fracture types have different effects on shale gas accumulation and enrichment [19,20,21]. For example, shrinkage fractures and abnormally high-pressure fractures account for a small proportion and are mostly filled by later mineralization [22,23,24], so they have little impact on the enrichment and preservation of shale gas. However, interlayer shear fractures, bedding detachment fractures, interlayer expansion fractures, and interlayer fractures have a greater impact on gas enrichment and preservation [25,26,27,28].
Microfractures are mainly micro-scale cracks smaller than 100 μm [29], which are difficult to identify with the naked eye, and their evaluation requires observation and statistical analysis with the help of microscopy instrumentation. In association with macroscopic fractures, microfractures also have an important influence on the physical and gas-bearing properties of shales [30,31]. In the process of shale gas development, natural gas is usually produced by gradual release, and the free gas in microfracture pores is discharged first [32]. Then, the adsorbed gas attached to the microfracture surface is released [33,34]. Finally, adsorbed gas escapes from the shale matrix. The desorption process of adsorbed gas is very slow, but when microfractures develop near the bottom of a well, the free gas in the microfractures quickly discharges, forming a low-pressure zone near the microfractures, in turn promoting the desorption of adsorbed gas in the area near the fractures and improving the gas production efficiency [35,36]. Microfractures in the shale can be used as penetration channels. Pores in a shale matrix are extremely undeveloped, being mostly microcapillary pores, and the permeability is much lower than that of tight sandstone; however, microfractures can significantly increase the permeability of this material [37,38,39,40]. Therefore, the development of effective microfractures is of great significance for increasing the permeability of shale. Previous descriptions of fractures have mainly focused on the core to outcrop scale, with few studies describing micro-scale fractures or the influence of microfracture development on shale reservoir space, with no quantitative studies to the authors’ knowledge of the influence of microfractures on the physical properties of shales.
In this work, we take the Yuanba 21, Yuanba 102, Yuanlu 4, and another 10 wells in Northeast Sichuan and carry out a detailed description, classification, and quantitative characterization of microfractures based on a large number of observations of core and thin section samples, micro-CT, scanning electron microscopy, nitrogen adsorption, and high-pressure mercury injection tests. These results potentially play an important role in clarifying the effective reservoir space and gas-bearing properties of continental shale gas in the Sichuan Basin and are of great significance in clarifying the enrichment mechanism of continental shale gas and in supporting the exploration and deployment of continental shale gas resources.

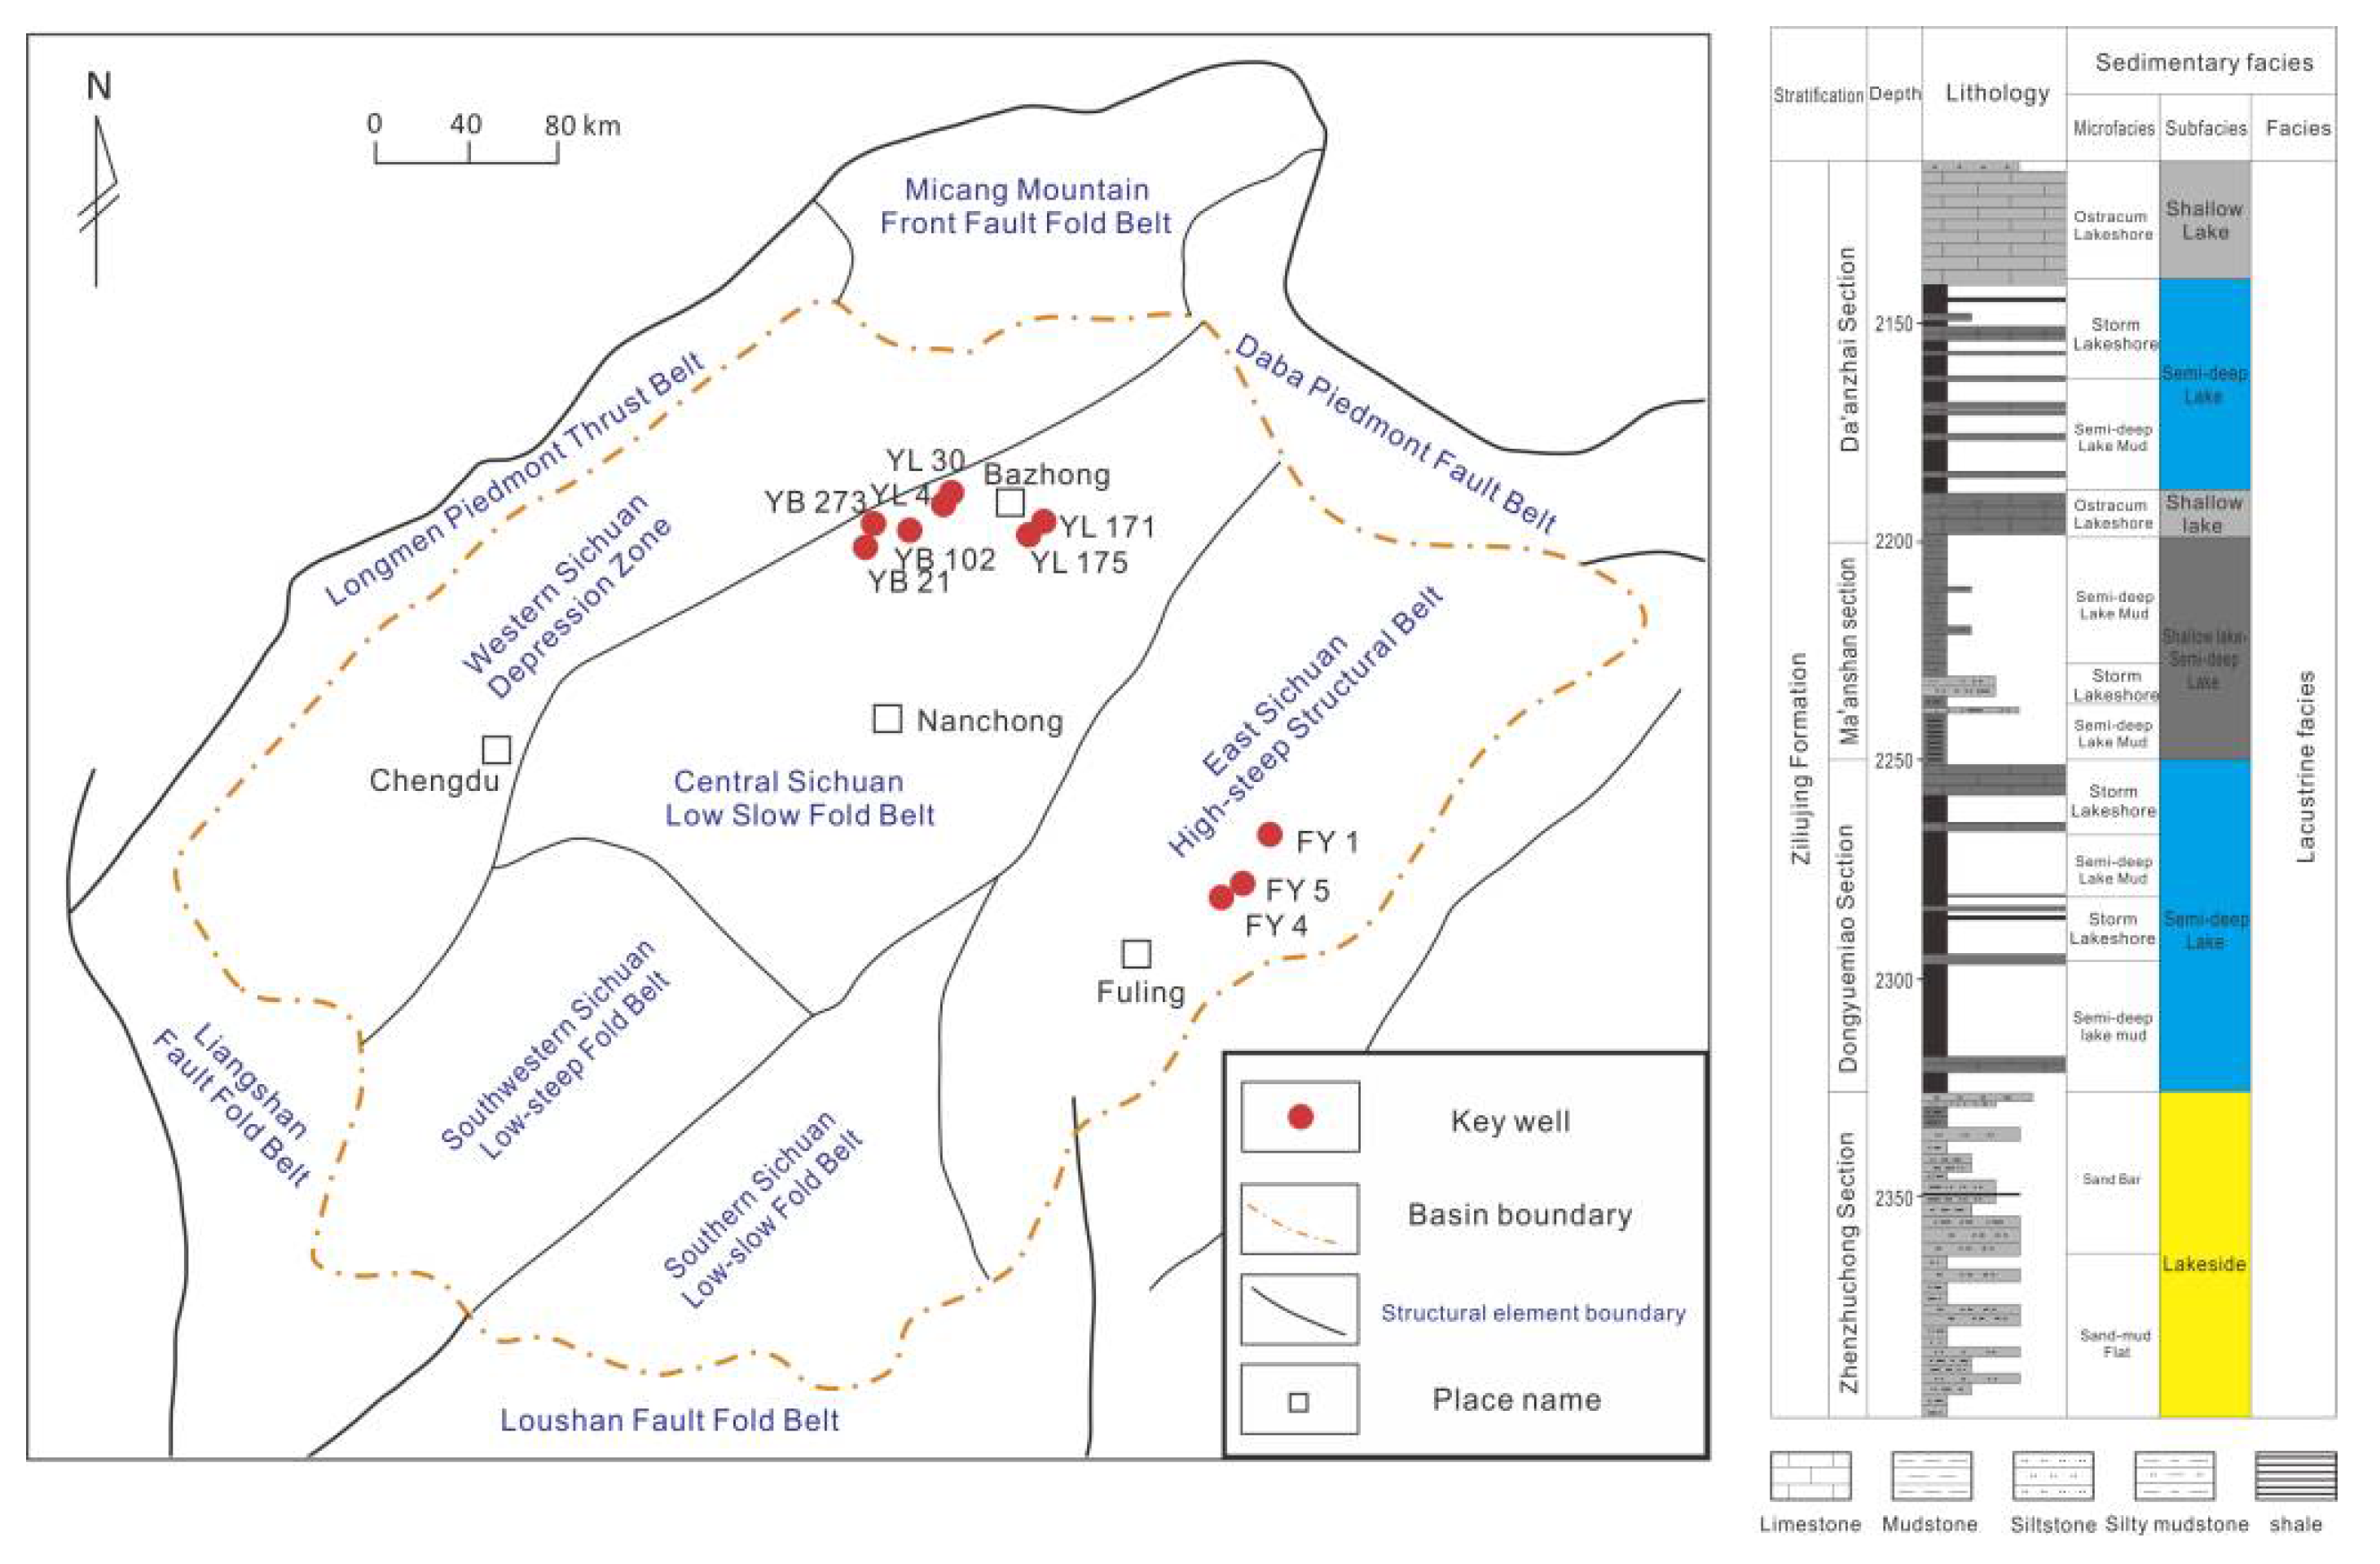
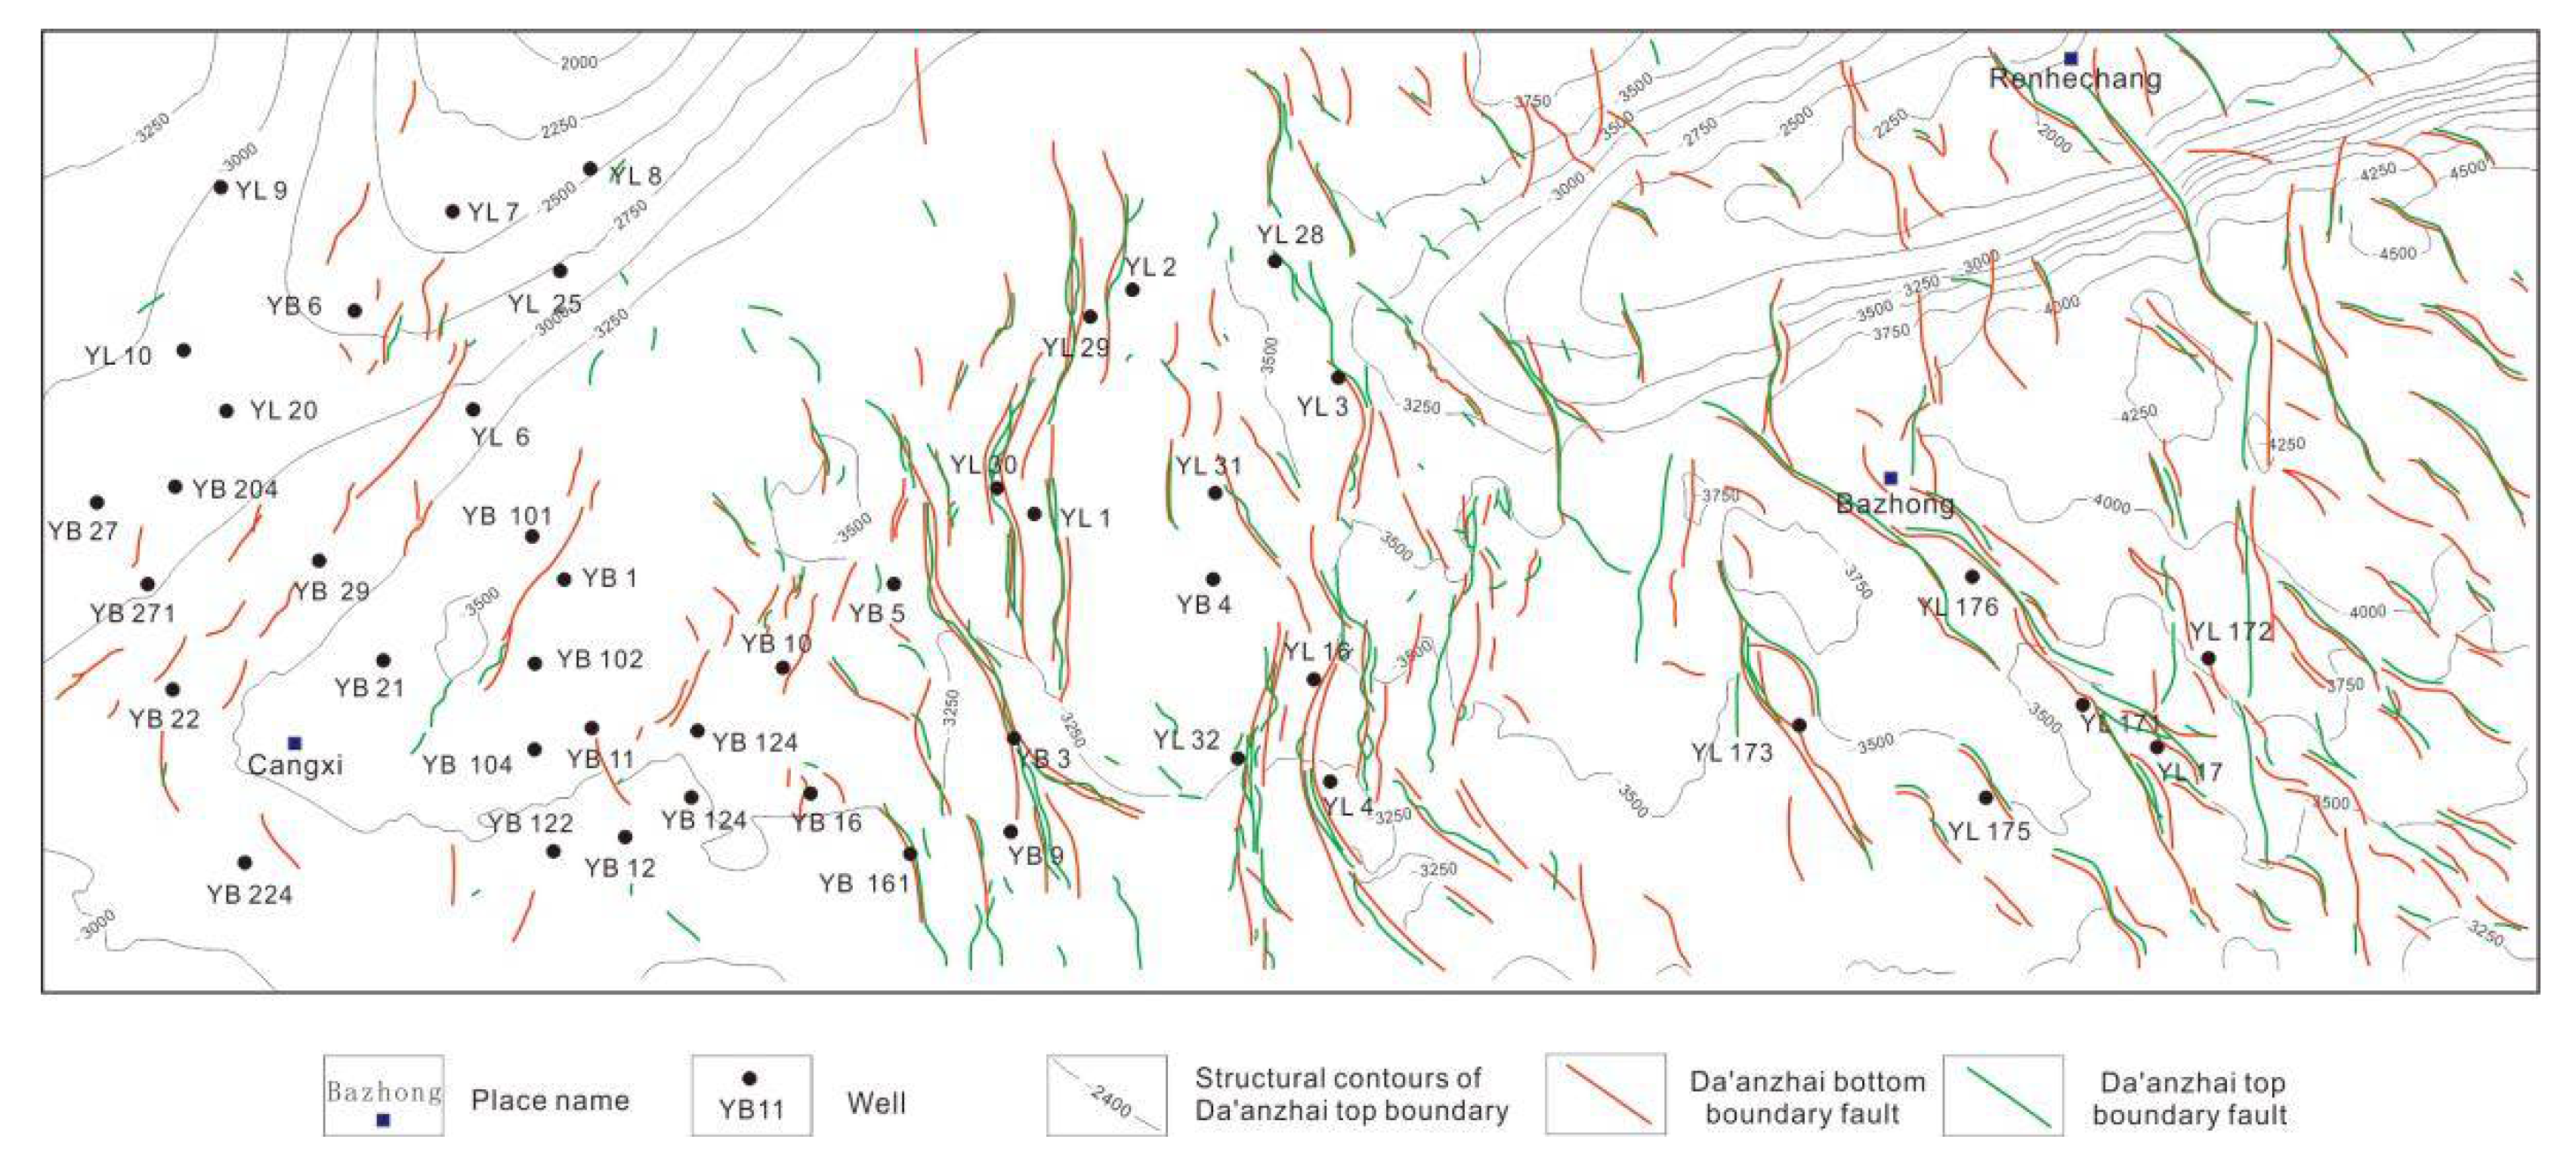
2. Geological Setting

The study area is located in the northeastern part of the Sichuan Basin, namely around the Longmen Mountain, Micang Mountain, and Daba Mountain front [41,42,43]. The structural division is located in the gentle fold belt of northern Sichuan and the highland fold belt of eastern Sichuan. North Sichuan is the main area for the exploration and development of shale gas reservoirs for the entire Sichuan Basin [44,45,46,47]. The study area is located on the northern margin of the Yangtze Plate and is adjacent to the Qinling fold belt. The Lower Jurassic Da’anzhai Member of the North Sichuan Basin is mainly distributed across the Micangshan and Dabashan arc structures [48,49,50]. The belt overlaps with the arc-shaped skirt belt in eastern Sichuan. During the Jurassic period, due to the disappearance of the Songpan Ganzi Sea and the Western Sea, all of the surrounding areas were surrounded and evolved into inland lakes [51,52,53]. The Early to Middle Jurassic basins were deep lakes, semi-deep lakes, and shallow lakes, where rivers, lakes, and deltas formed [54,55]. The facies are mainly composed of interbedded sand and mudstone. Among them, there are dark clastic rocks and carbonate strata from the Early to early Middle Jurassic and continental red strata from the late Middle Jurassic to the Paleogene [56,57]. The Lower Jurassic Da’anzhai Member is composed of lakeside, shallow lake, and semi-deep lake deposits, with a thickness ranging between 100 to 160 m in northeastern Sichuan (Figure 1). These deposits are mainly composed of shell limestone and dark shale interbedded with each other with unequal thicknesses, and siltstone can be seen locally [58]. These deposits are rich in freshwater bivalves and ostracod fossils, and are common in scale deposits. Among these deposits, the second member of the Da’anzhai Member is a semi-deep to deep lake deposit, and is the main mudstone development interval in this section [59,60].

3. Sampling and Laboratory Methods

In this study, samples were collected from 15 wells in the Yuanba area of the Sichuan Basin (YB 21, YB102, YB 104, YB 122, YB 221, YB 273, YL 4, YL 30. YL 17, YL 171, YL 175, YL 176, FY 1, FY 4, FY 5), with cores from the Da’anzhai section of the Ziliujing Formation. Some of the well positions are shown in Figure 1. The clay minerals in the Da’anzhai lake facies mud shale are very developed, making up from 21% to 56%, with most being about 40% (illite and Imonite mixed layer account for 50% and 25% of the clay minerals, respectively). The second most common are brittle minerals such as quartz and feldspar with a content of 30% to 45%, and 5% to 25% of carbonate minerals. The organic content is about 0.8%, and the mineral composition of the shale constitutes the material basis for the development of microscopic pores and fractures. The organic matter content of the lacustrine mudstone in the Da’anzhai section of the Yuanba area varies significantly, with the TOC total organic carbon (TOC) values of the analyzed samples ranging from 0.04 to 2.30%, of which more than half of the samples were higher than 0.5%, and 27% of the samples were higher than 1.0%, with some belonging to type III kerogen, and some to type II kerogen. The Ro of the samples shows little variation, ranging from 1.29% to 1.97%, with an average of 1.63%. Readers should note that the analyses undertaken for this work were carried out at the State Key Laboratory of Petroleum Resources and Prospecting, China University of Petroleum (Beijing), except where stated otherwise.

3.1. Rock Slices and Identification

Rock sections from the samples were polished and identified. To prevent man-made cracks from occurring, the samples were cut into sections of 3 to 5 cm in length and width with a wire cutting device. Then, sample which was processed was then glued onto the ground glass with epoxy resin. After gluing, the sample was placed on a fixed platform and baked at a low temperature of 50 °C for about 6 to 8 h to consolidate and harden to avoid rock fracturing caused by later observation. After the glue hardened, the specimen was cut on a petro-thin machine and ground to a thickness of between 100 and 150 μm, then ground on a Lapping plate to a standard thickness of 30 μm. A Leica DM4P polarized light microscope was used to observe the prepared rock slices, to determine the mineral composition of the sample, to study its structure, to analyze the sequence of mineral generation, and to determine the rock type and its microcrack characteristics.

3.2. Micro-CT Scanning

The micro-CT experiment was carried out at the Petroleum Geology Experiment Center, PetroChina Research Institute of Petroleum Exploration and Development. The instrument was a XRadia Ultra-XRM L200 stereoscopic microscope, with the voltage set to 8 kV, and the instrument’s limit resolution being 0.7 μm. The sample was made by vertical shale line cutting, and the samples’ shapes were cylinders about 1 cm in length and 4 mm in width. A sample would be fixed in the device vertically and X-ray scanning was used to obtain the three-dimensional data volume of the core. In this paper, the software named Avizo 9.0 was used for the routine analysis of the three-dimensional data. According to the different X-ray absorption capacities of materials with different densities and thicknesses, the materials in the shale could be divided into three types: iron-bearing minerals, mineral matrix, and pores and microcracks.

3.3. Field Emission Scanning Electron Microscope (FE-SEM) Analysis

FE-SEM analysis was performed using a Quanta200F cold-field scanning electron microscope. The Quanta 200 F is a high-performance multi-purpose high-resolution FE-SEM with a high comprehensive field emission electron microscope. Resolution and environmental scanning electron microscopes (ESEM) are suitable as they have the advantages of sample diversity and can perform static and dynamic observations and analyses of various samples in high vacuum mode, low vacuum mode, and environmental scanning mode. Each sample was cut along the direction perpendicular to the bedding and polished with an argon ion beam to produce a smooth and flat surface with little surface change. In a high vacuum with 30 kV, the highest resolution can reach 2 nm, while the low vacuum with 3 kV can reach 3 nm.

3.4. Nitrogen Adsorption

Nitrogen adsorption was performed using a Kangta AbsorbIQ gas adsorption analyzer. The experiment required the use of high-purity nitrogen, with the sample needing to be degassed before the test, as the extent of the degassing directly affects the test results. Generally, a vacuum degassing system is adopted. High-resolution physical adsorption, chemical adsorption, and vapor adsorption isotherms can be measured to obtain the most accurate estimates of the pore sizes, the surface areas, and the specific gas/solid interactions. The sample was grinded to 60 to 80 mesh particles and degassing at 150 °C for more than 12 h.

3.5. High-Pressure Mercury Injection

High-pressure mercury intrusion was performed using the Mike 9505 automatic mercury intrusion instrument. As mercury does not wet general solids, to make mercury enter the pores, an external pressure must be applied. The greater the external pressure, the smaller the radius of the pore that the mercury can enter. By measuring the amount of mercury entering the pores under different external pressures, the pore volume of the corresponding pore size can be found. The maximum pressure of the mercury porosimeter is about 228 MPa, and the diameters of the measurable holes range between 50 to 360 μm. These measurements are used to draw capillary pressure curves and can also be used to describe the characteristics of multiple reservoirs, especially the size distribution of pore bellows in porous media.

4. Results

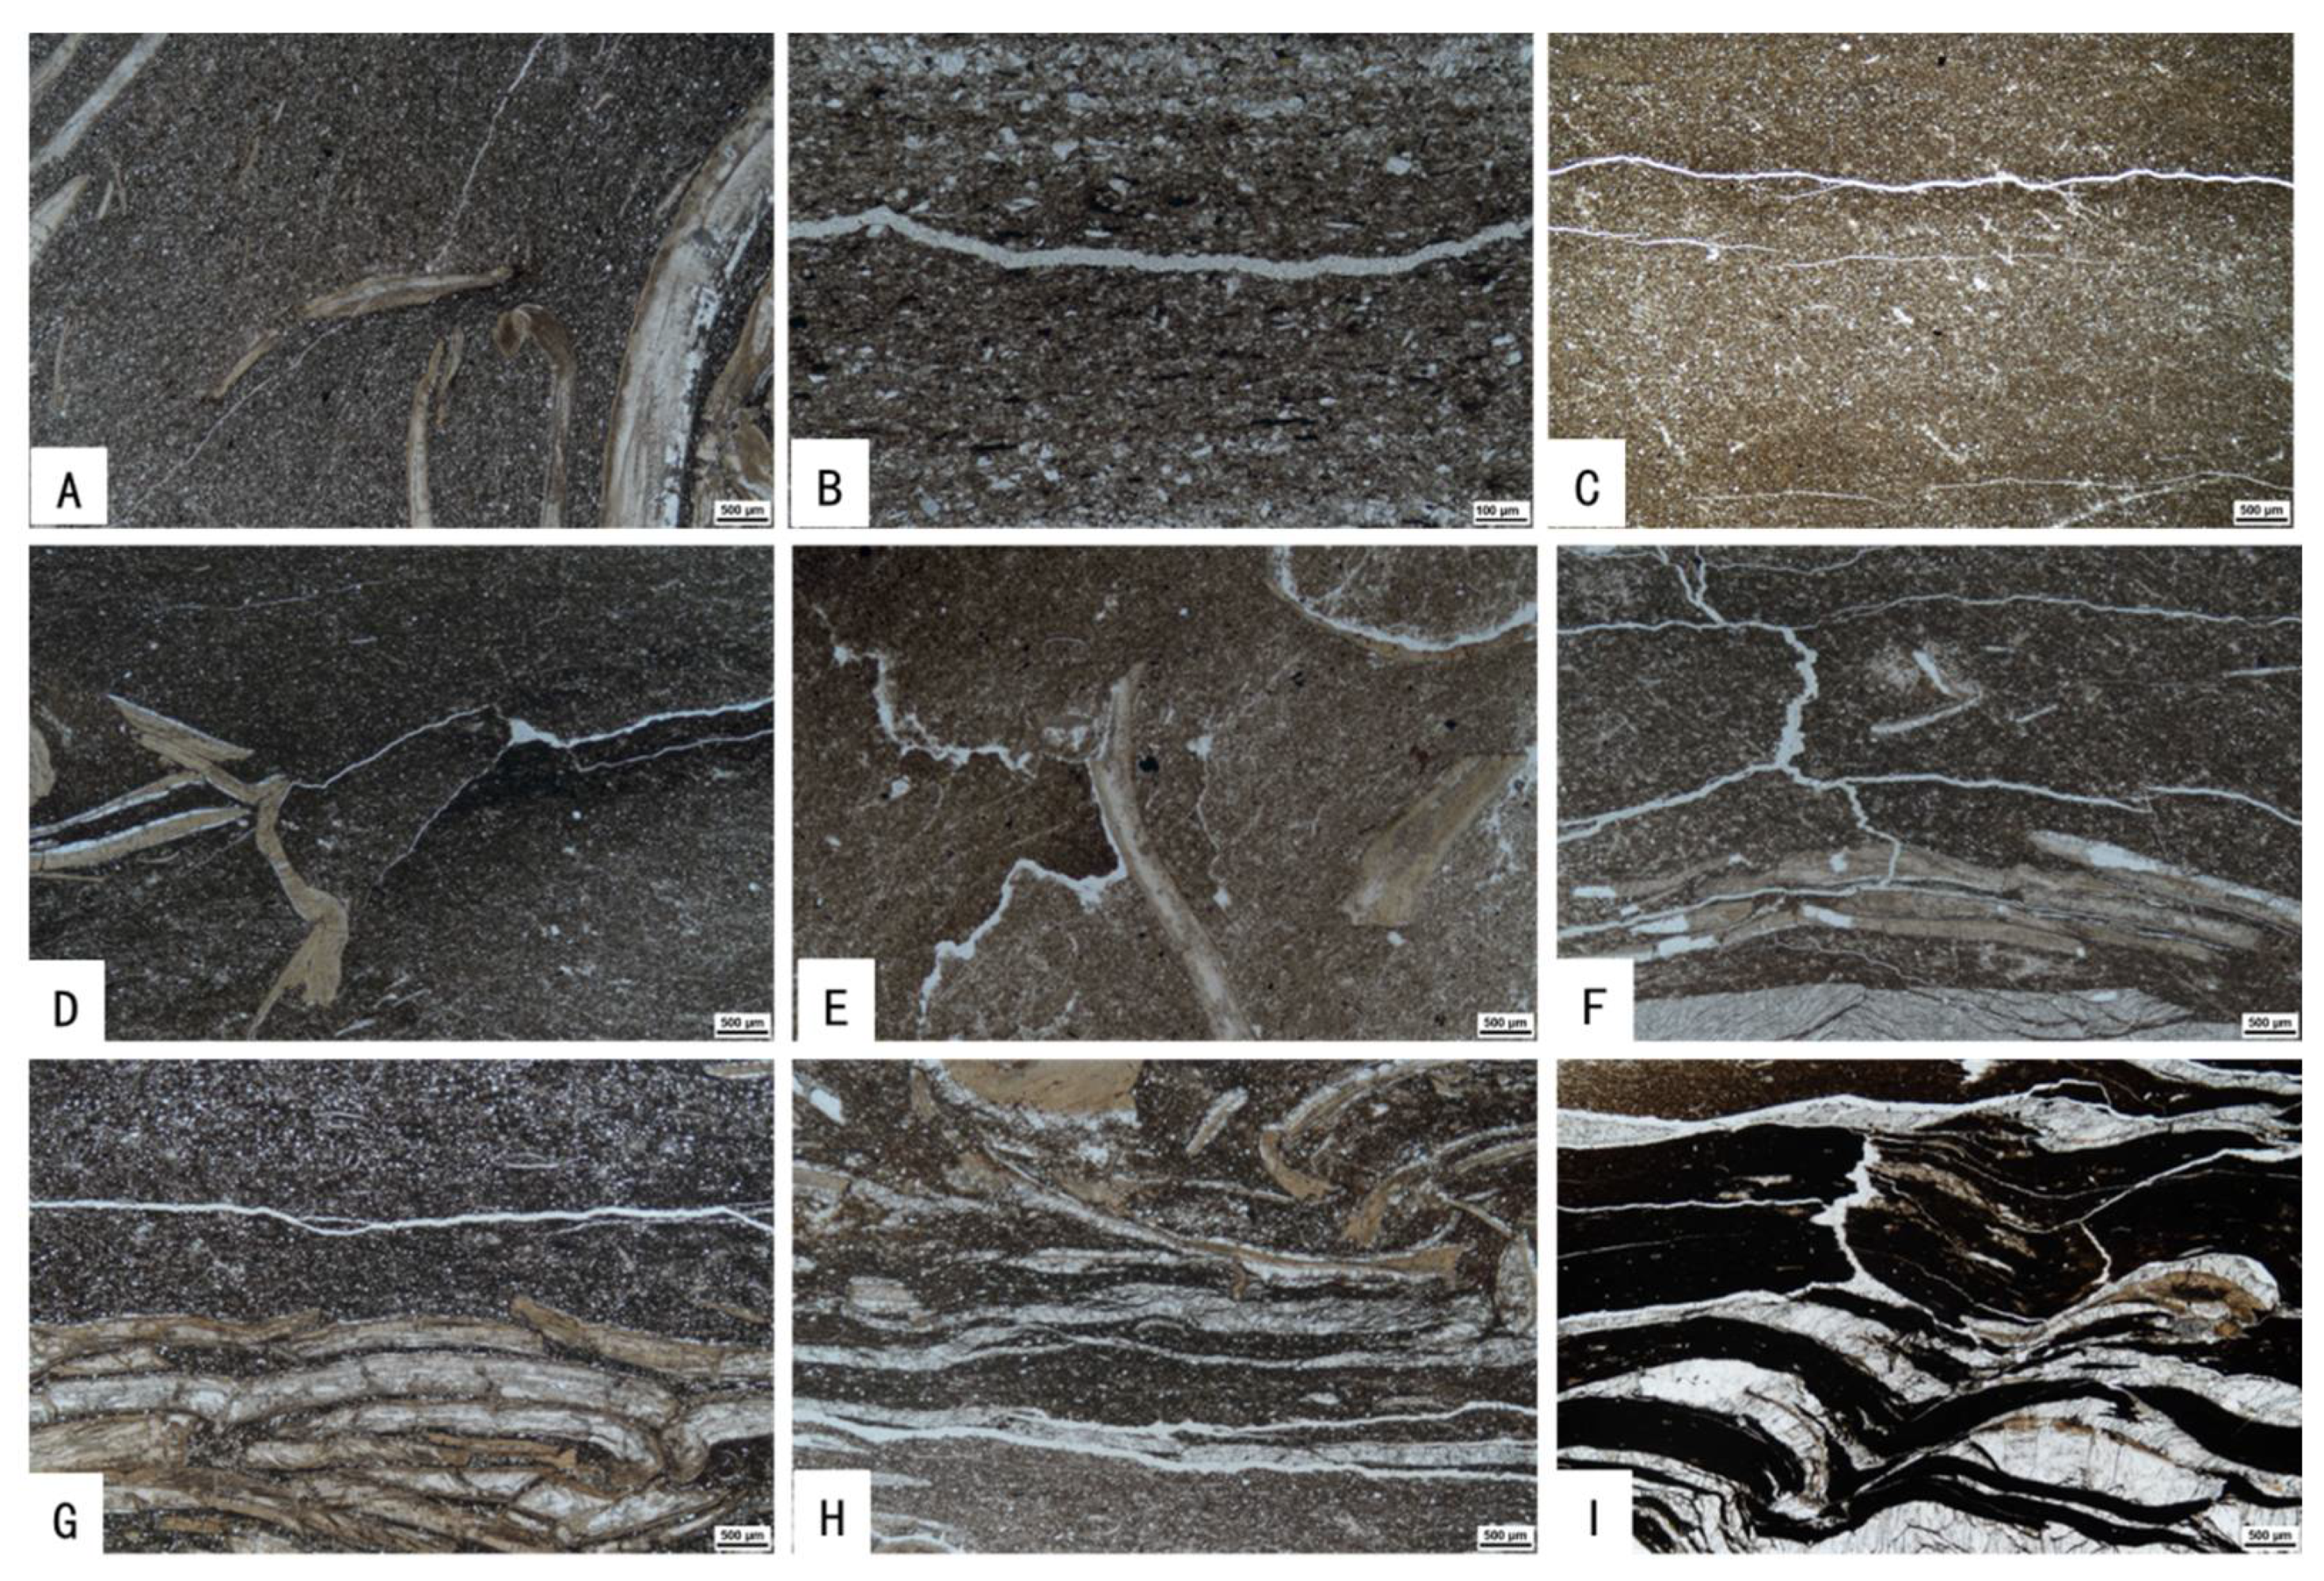
4.1. Feature of Fracture Morphology under Rock Slice

Mud shale is the main component of unconventional shale reservoirs in the second sub-member of the Sophomore stage. Through a microscope, we can see the clay structure, silt-containing clay structure, and silty-clay structure, among which shale is often seen. A small amount of scale fragments (two-petal species, mainly ostracods), and some silt particles can be seen. When the orientation of those detrital particles is more obvious, the direction of bedding can be identified, and some authigenic minerals are common (Figure 2). For example, in pyrite particles, a large amount of flaky organic matter orientated in the direction of the bedding can often be seen. The development forms of microcracks are mainly hairline, dendritic, and fractured networks. They are mainly distributed in the bedding and develop in the layers. In the well-defined shale, some shell-bearing shale and silt-bearing shale also have a few microcracks. Among them, silt-bearing shale has the least proportion of microcracks. When the silt content is high, it is difficult to find microcracks under the microscope.

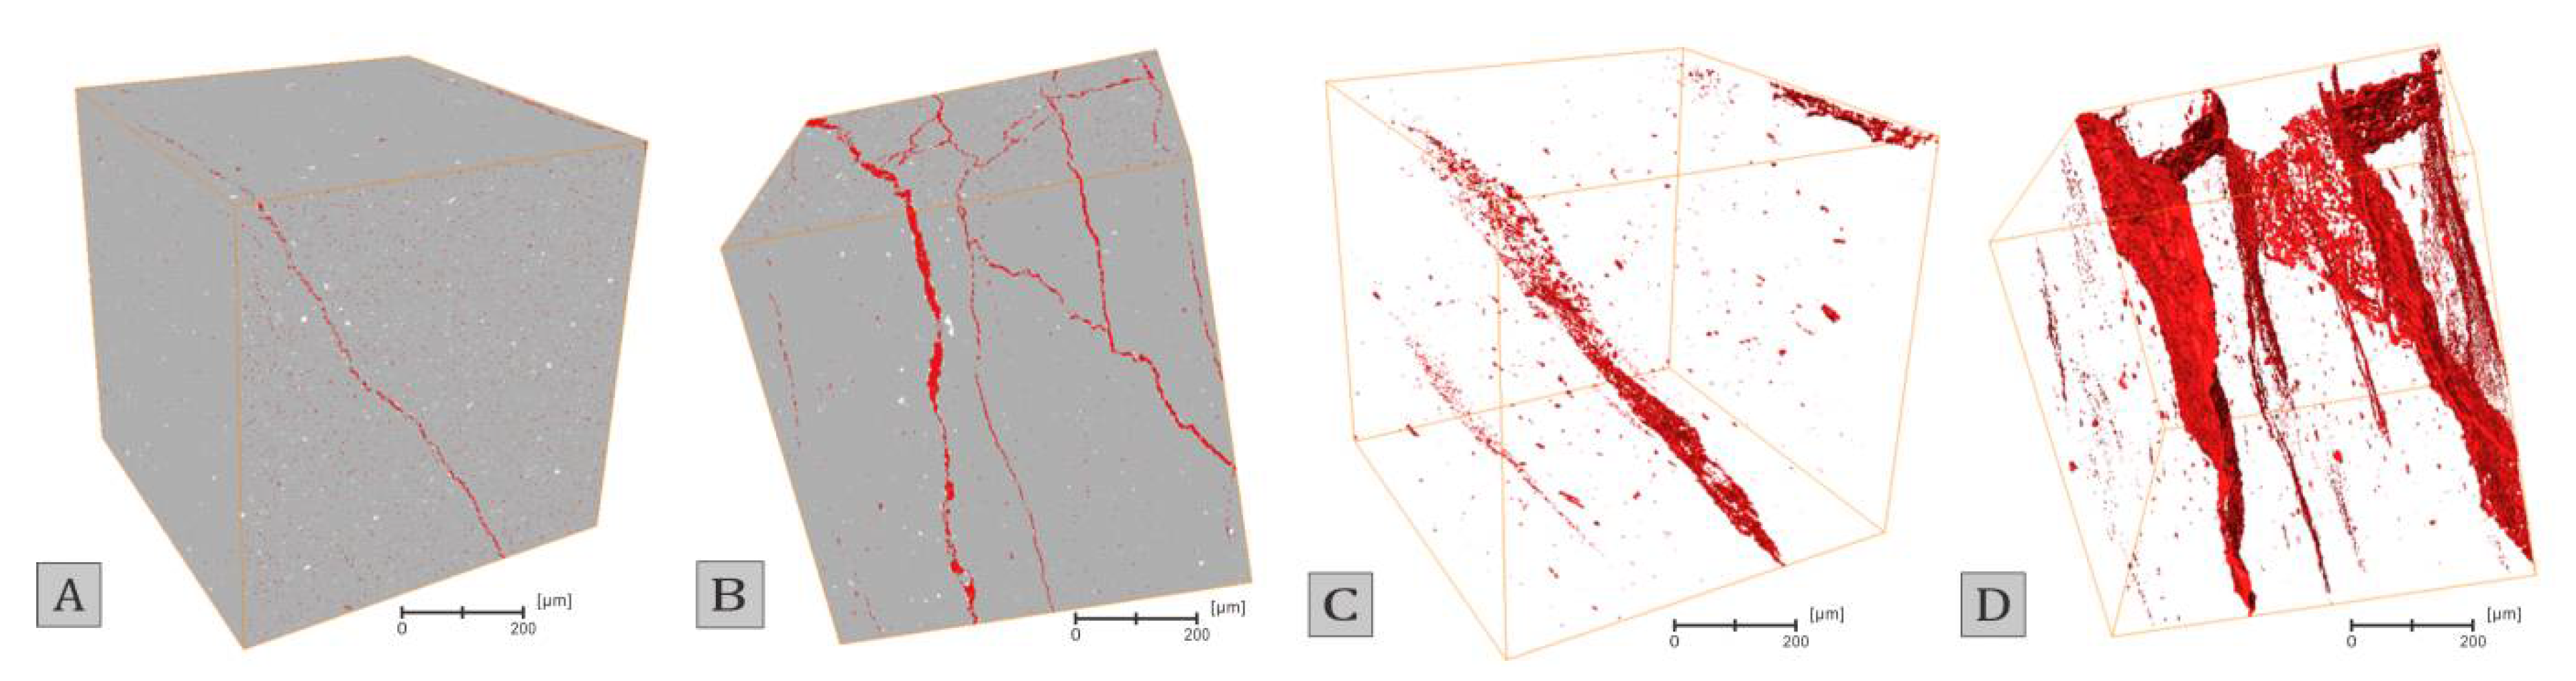
4.2. Type, Occurrence, and Scale of Micro-CT Scan Cracks

At the micrometer scale, the bedding phenomenon of the shale samples is not significant, but we can see from the three-dimensional display images that the microcracks are almost parallel and spread out in the layers. Excluding other influencing factors, we conclude that the microcracks we observe are bedding-related microcracks, which either extend along the bedding or the main body extends along the shale bedding, but intersects with it at a low angle. This is fully illustrated in the sample FY1-13 (Figure 3).

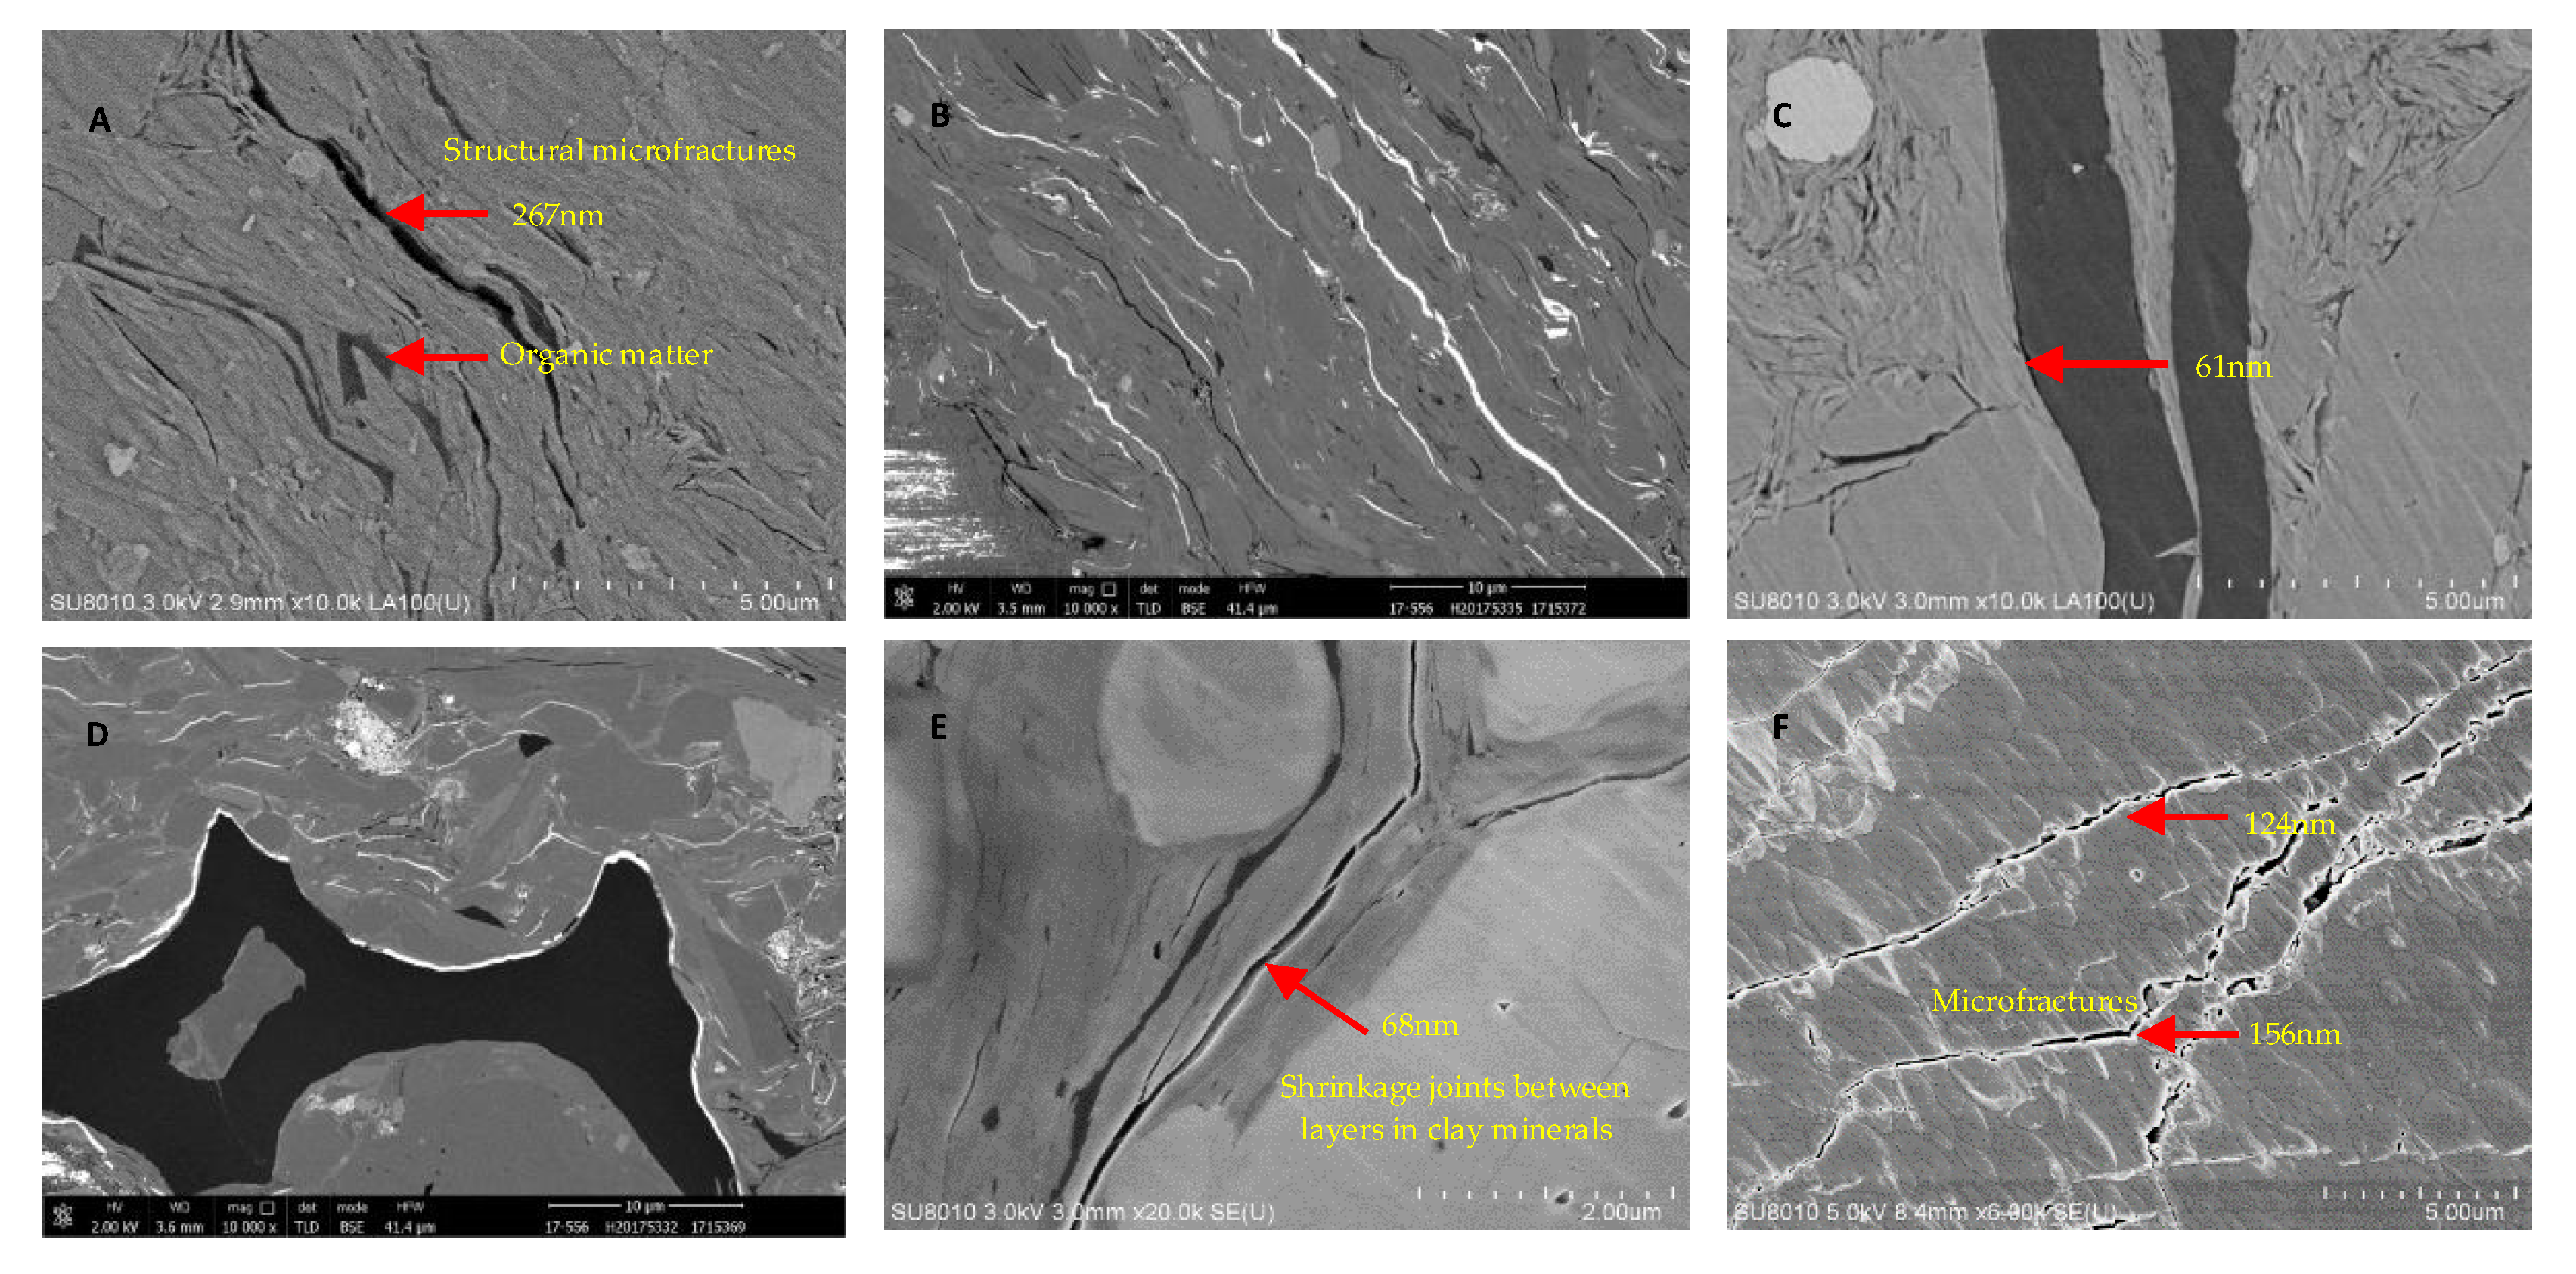
4.3. Types of Microcracks Observed under a Scanning Electron Microscope

According to our observations, there are mainly the following types of microfractures in the shale of the Da’anzhai section: structural microfractures, diagenetic shrinkage fractures of clay minerals, marginal shrinkage fractures of organic matter, and microfractures inside mineral particles. Among them, the structural microcracks that are of greatest significance are the extension of microcracks at the thin slice scale to the nanoscale. We have analyzed and counted them, and other types of microfractures are either too underdeveloped, or not typical enough, or even unable to be called fractures. While they have little impact on the reservoir, we nonetheless present here a brief introduction to them (Figure 4).

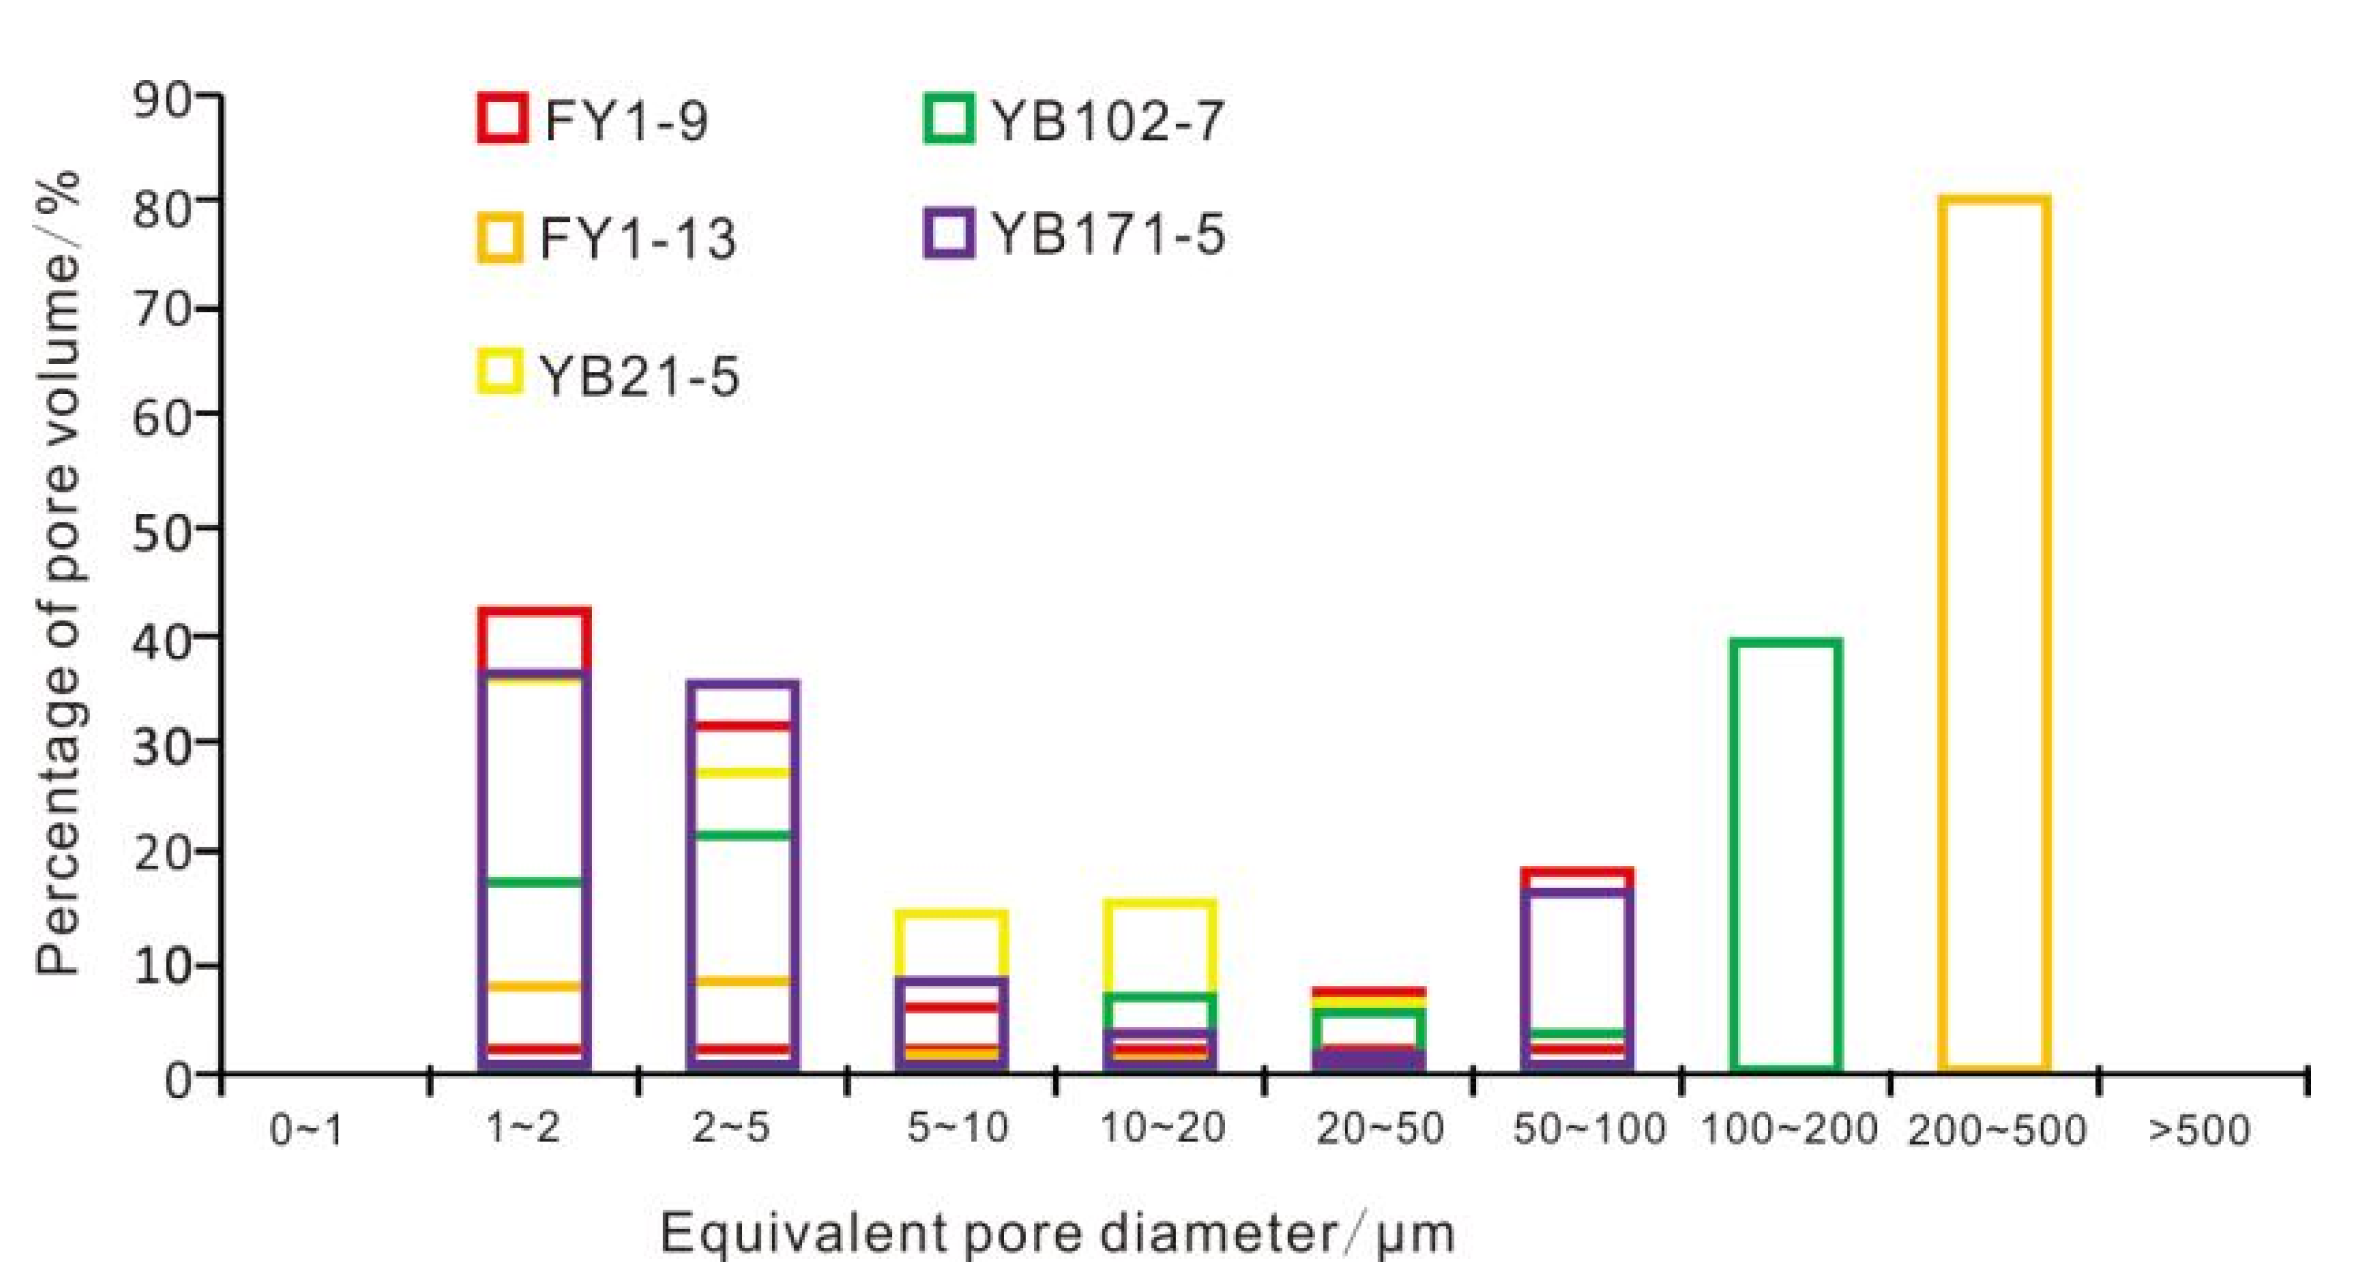
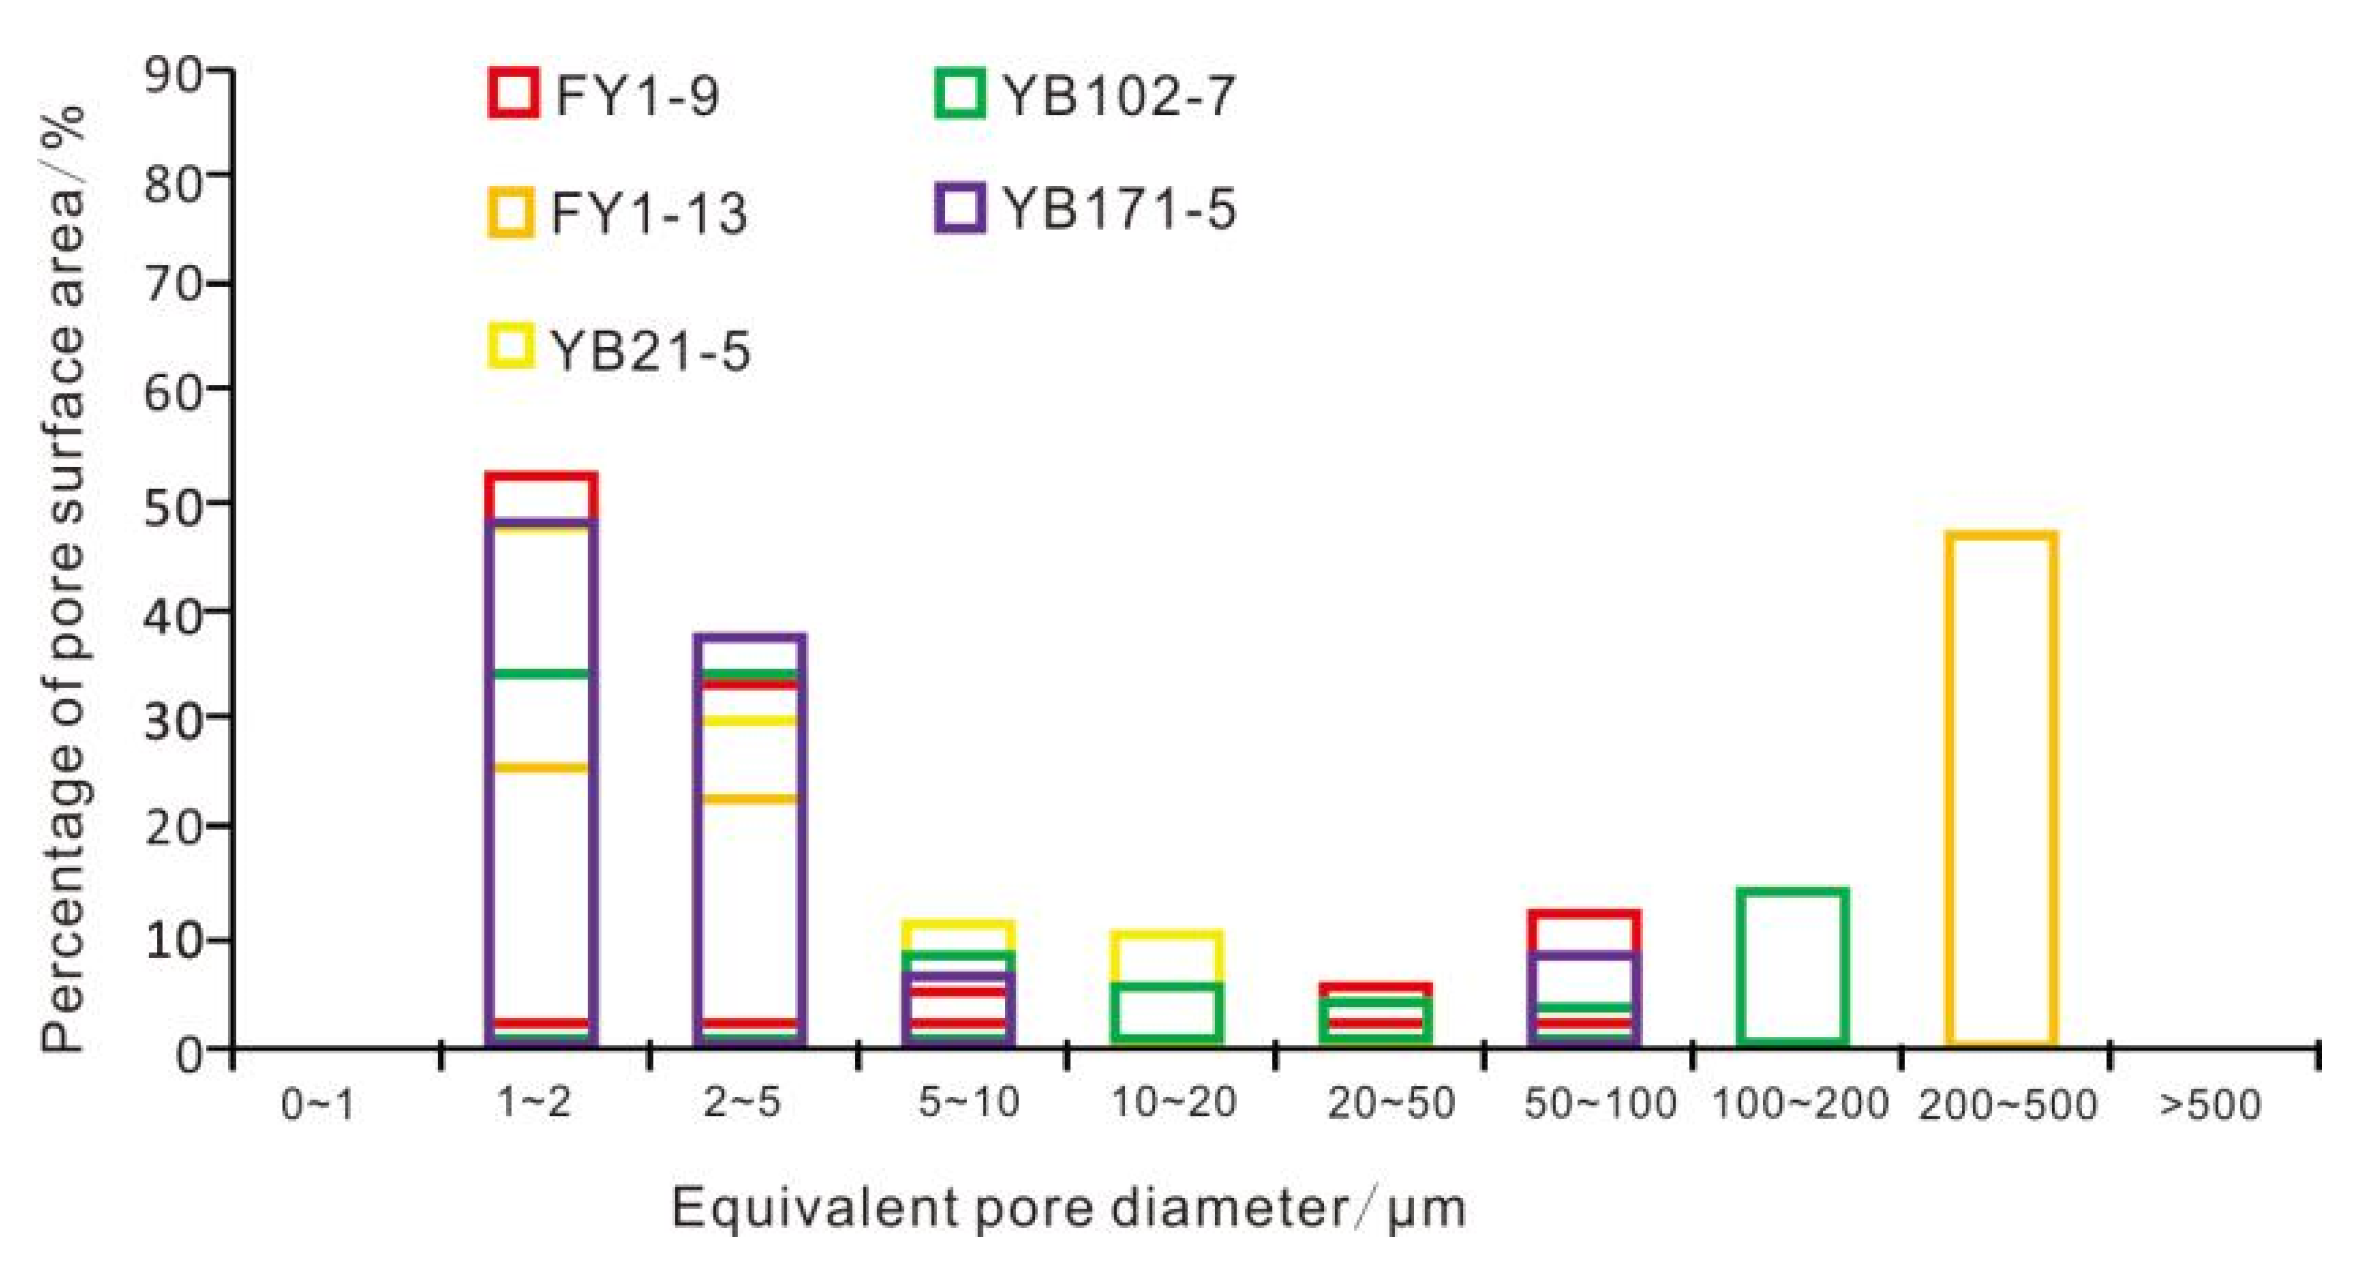
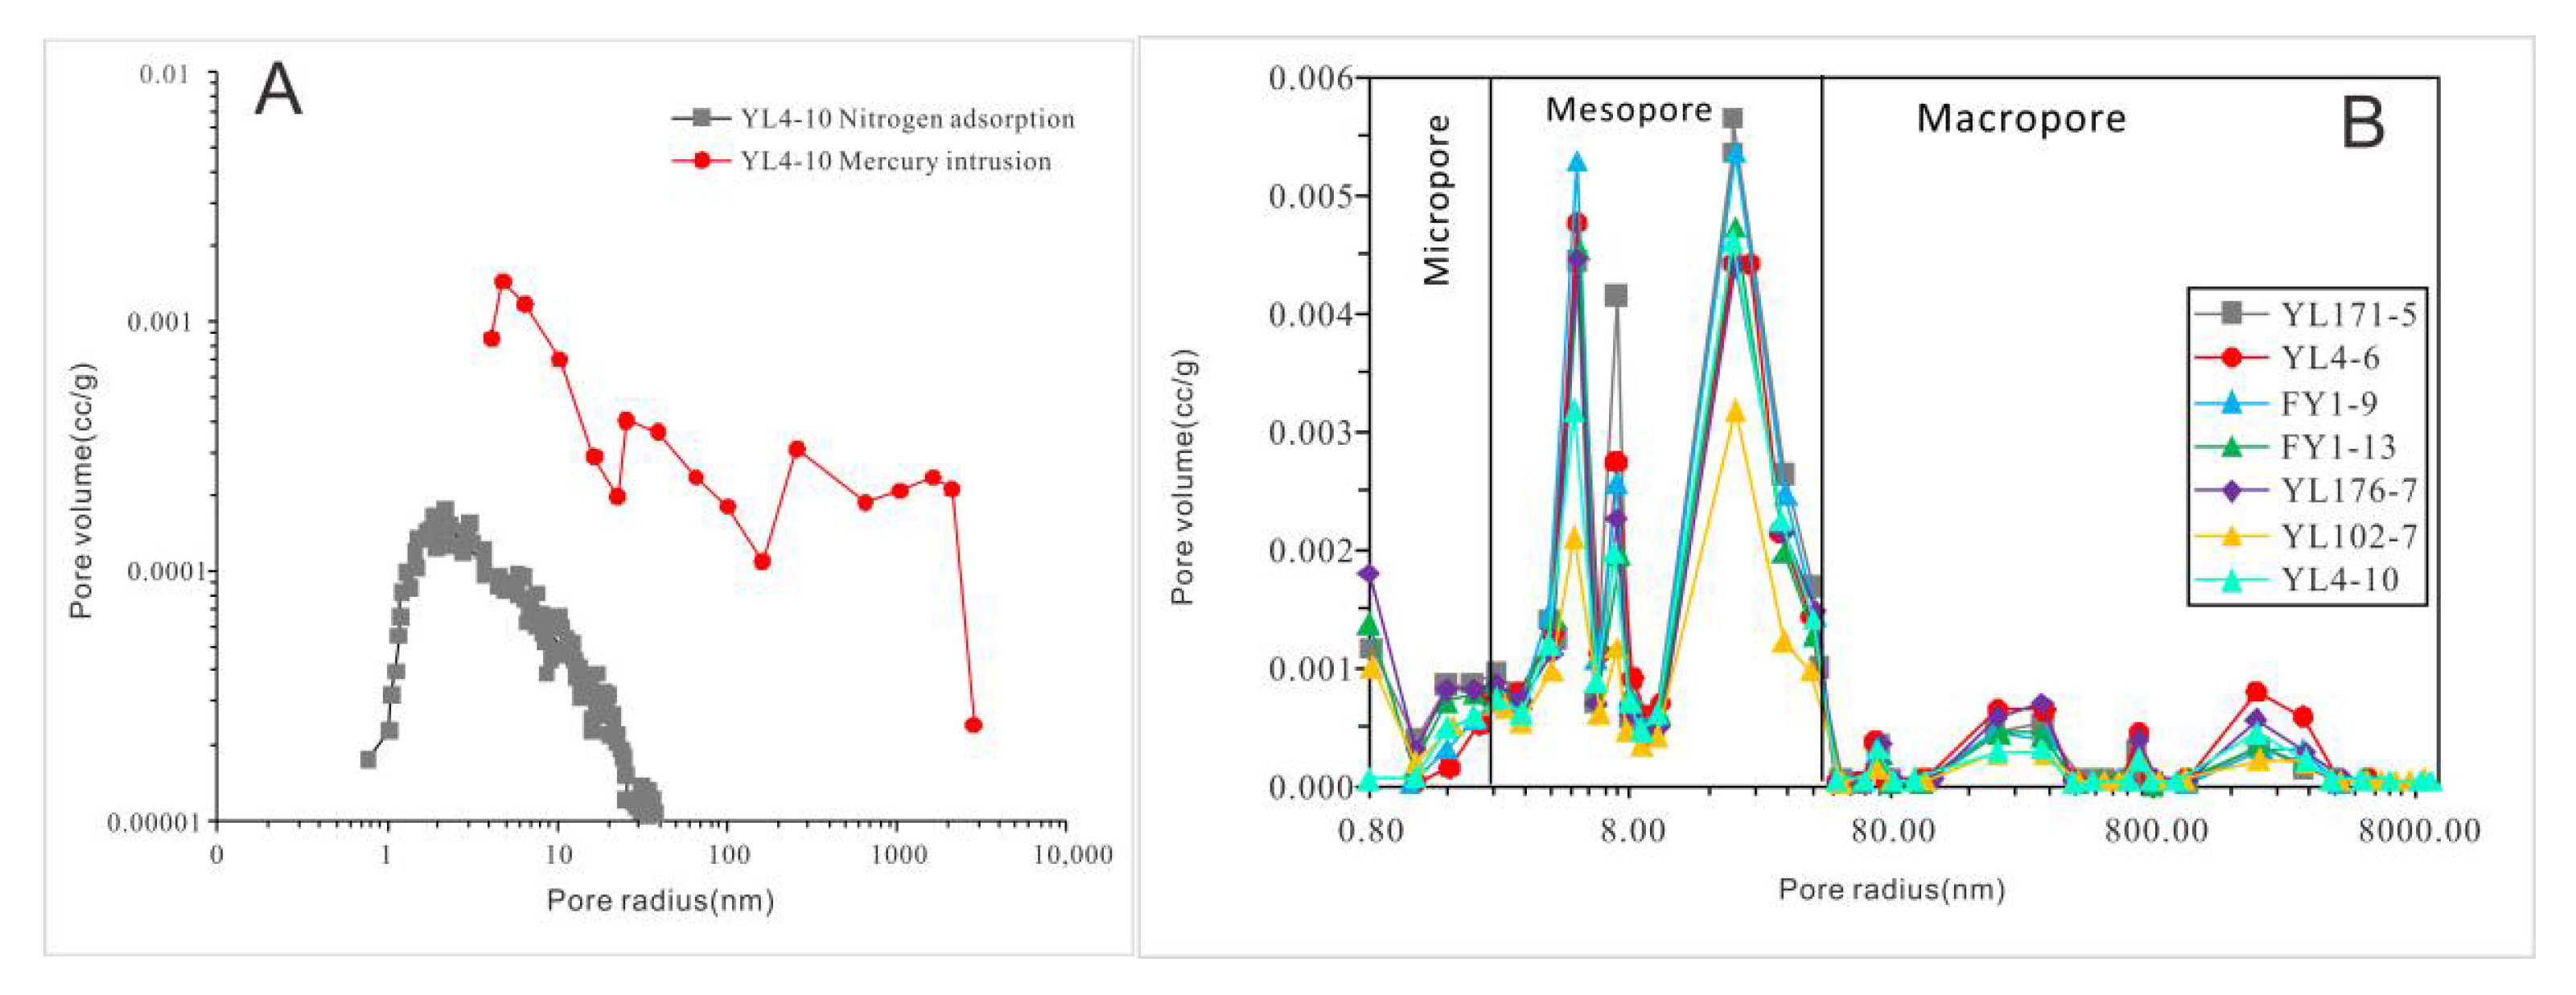
4.4. Joint Evaluation of Pore Structure by High-Pressure Mercury Intrusion and Nitrogen Adsorption

According to the International Union of Pure and Applied Chemistry (IUPAC) classification, the measured nitrogen adsorption curve belongs to a type IV loop, with the hysteresis loop similar to H2 and H4. It has the characteristics of flaky pores and ink bottle-like throat, with small pore packing, point B, and multi-layer adsorption. The capillary agglomerates multiple processes, reflecting the existence of micropores and mesopores, and finally, no platform appears, indicating the existence of macropores, which may be caused by microcracks (Figure 5A). In N2 adsorption, the NLDFT model pays more attention to the characterization of micro-mesopores, and the BJH model pays more attention to the characterization of meso-macropores. In this paper, N2 adsorption and high-pressure mercury injection were used to characterize the pore size, and the range of pore size selected by high-pressure mercury injection was greater than 50 nm. Therefore, NLDFT model, which focuses more on micro-mesopore characterization, was selected for characterization. We used the NLDFT model to explain its pore size distribution, and found that the pore size is mainly distributed between 1 to 2 nm (Figure 5B). The combination of mercury intrusion and nitrogen adsorption can measure the distribution of full-aperture pores and cracks from 0.8 to 1500 nm, with the high-pressure mercury intrusion being used to evaluate the development of microcracks. The flaky clay is plastic, and high pressure will produce cracks. There are errors in interpretation. Cracks and microcracks generally have a width of more than 100 nm, and a macro-hole radius of more than 50 nm is just in the macro-hole interval (Figure 6A,B). Therefore, the macro-hole is used to evaluate the proportion of microcracks, and the development degree of microcracks should not exceed this value.

5. Discussion

5.1. Comprehensive Qualitative Evaluation of Multi-Scale Microcracks

Through multi-scale analyses of the shale from the Da’anzhai Member, we have observed numerous micro-scale fractures. Generally speaking, the microfractures identified at the slice scale are similar to those observed at the core scale and are mainly microfractures caused by tectonic stress, followed by smaller clay mineral diagenetic shrinkage joints, organic matter edge shrinkage joints, and microcracks inside mineral particles.
Through the combined observation of single-biased and orthogonal light, we found that the structural microfractures are mainly open, developed in the bedding-developed shale, with straight shapes and mainly bedding. In some areas, interlayer fractures have developed and are connected into dendrites and nets in fine-grained mud shale deposits, since mud shale is composed of a large number of lamellar clay minerals which have cleavage. The development of most microcracks is bedding-compliant, and we believe this may be related to the sheet-like arrangement of clay minerals (Figure 2B–I). However, in other lithologies without obvious bedding, such as siltstone and fine sandstone, the microcracks are not developed. In addition, in the calcareous cement layers distributed along the beds in some mudstones and the calcareous cement near some organic fragments, microcracks (laminas) are particularly developed, which may have formed by stress. Under an electron microscope, the widths of the structural microfractures usually range between 0.1 and 3 μm, the fracture surfaces are curved, fully opened, mainly tensile, and often extend along the edges of the clay mineral flakes and brittle mineral particles (Figure 4A,B). They occasionally cut through particles, which can be simply divided into marginal fractures and interlaminar fractures according to their development positions. They are the nano-scale extension of microfractures observed at the slice scale, which play a major role in the quality of shale reservoirs. The communication effect is conducive to the improvement of its porosity and permeability, which may be caused by the stress generated by the source rock overpressure and the regional tectonic stress. Based on micro-CT imaging, we can clearly see that the seams related to the bedding are particularly developed, with larger openings, wider extensions, and some interlayer seams that cross and extend, constituting a three-dimensional interconnected hole-slit system (Figure 3C,D). We believe this is sufficient to show that the cracks we have identified are mainly bedding-related.
The other three fracture types have different degrees of development in different samples. The clay mineral composition of the Da’anzhai section contains more than 50% of illite, and more than 25% of the Imonite mixed layer. In the process of converting illite to montmorillonite, the syneresis of clay minerals will occur. During this process, a large number of diagenetic shrinkage microfractures will form, mainly in the clay mineral flakes. The edges without structural microfractures are rough, their extension length is short, and the fracture width is narrow. These are mainly less than 100 nm, concentrated in the range of 30 to 80 nm (Figure 4E). These appear less frequently than structural microcracks, and only in large numbers in a few samples. They are also identified as clay mineral interlayer pores in other pore and fracture classifications, and their pore size distribution interval is much smaller than that of conventional microfractures.
Organic matter edge shrinkage joints are formed by the volume shrinkage of organic matter during the thermal evolution associated with the burial and conversion of organic matter to hydrocarbons. They generally occur at the edges where organic matter and minerals are in contact, forming a slit-like shape. In the past, some researchers believed that these may be an important storage space for shale gas. In our observation of organic matter, their occurrence frequency is very high, and the fracture width is generally about 30 to 100 nm (Figure 4C,D).
The common minerals in the shale of the Da’anzhai Member are terrigenous quartz, feldspar debris, and some shell particles. In addition to some structural microcracks that are prone to occur on the edges of minerals, some microcracks also occur inside mineral particles. The widths of the fractures are very small and they are difficult to find, being more common in shells, quartz, and pyrite particles. Since shell limestone is also an important potential reservoir in the Da’anzhai Member, the pore structure inside shell particles will have a certain reference value, hence some examples are presented (Figure 4F).

5.2. Comprehensive Quantitative Characterization of Multi-Scale Microfractures

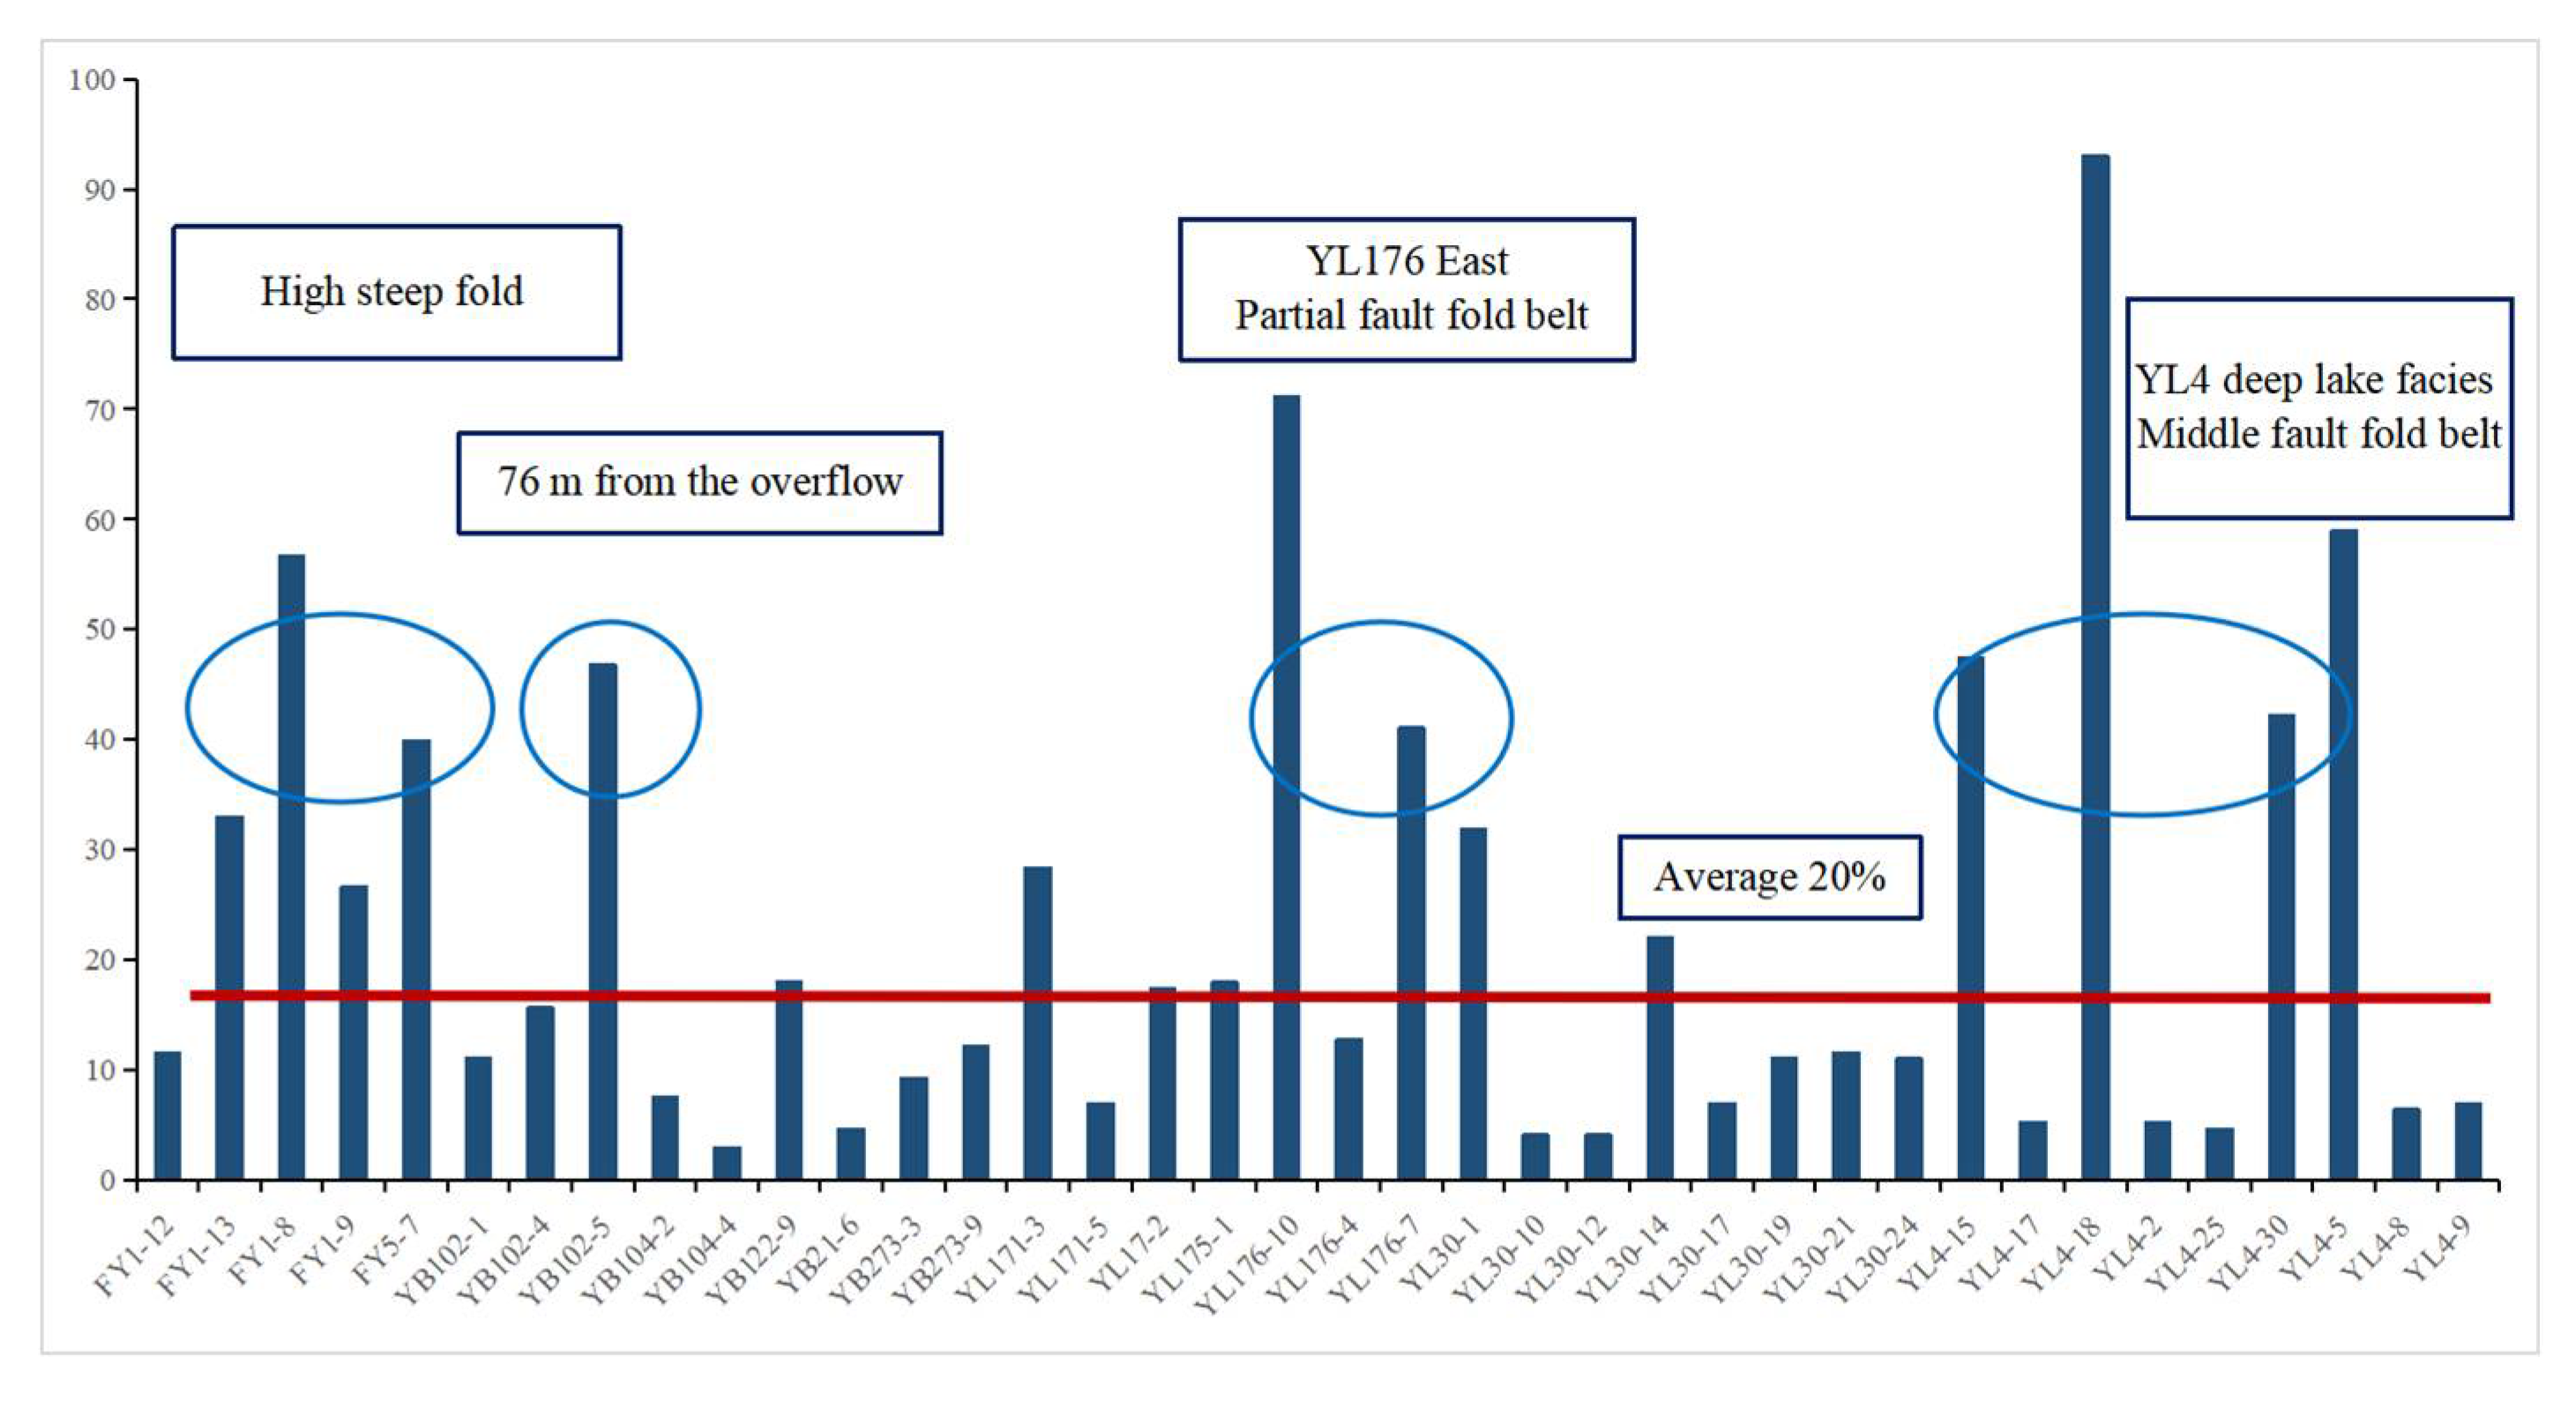
5.2.1. Quantitative Characteristics of Micro-CT Microcracks

Micro-CT images were segmented and reconstructed using Avizo software. Firstly, the units of interest are selected and the image is segmented by using the threshold tool in Avizo software. The brightness of the high-resolution image is proportional to the atomic number of the sample components, which can clearly show the difference in the gray value of shale pores and cracks, organic matter and inorganic mineral matrix. According to the above principle, manual threshold method is adopted to extract the pores and cracks, organic matter and minerals respectively, and display their three-dimensional spatial structure. Then the Avizo Pore Network Model (PNM) module software was used to analyze the pore structure. The data type stored by the PNM module represents a grid composed of multiple linear lines in three-dimensional space. The branches or endpoints of the grid represent pores, and the straight lines connecting the pores are called throats. For each pore and throat, parameters such as radius, throat length, and coordination number can be calculated. Using the model that comes with the software, we extracted the relevant parameters of the pores. We calculated the average porosity of the sample to be 1.49%. It is almost the same as the hole and seam distribution observed in our images and the actual test data. The volume and area percentages of the holes and seams were calculated, and the statistical results are as follows. The distribution first shows a two-peak situation, indicating that the sample is a double-porosity medium with small micropores and large cracks. We believe that the large pores identified by the software are the cracks that can be seen, but the pores with an equivalent diameter of 50 to 100 nm only account for 16.9% of the entire pore volume (Figure 7). This seems to be very low compared to the other peak, but the ratio is still high. Due to the problem of threshold segmentation, some of the fractures are divided into many disconnected points (as can be seen from the model), with the actual contribution of the fractures to the porosity being much greater than this value. We can see from the three-dimensional display of the pore model that the pore distribution in this sample is mainly related to pores of a size between 1 to 2 μm and 2 to 5 μm (Figure 8). They contribute more than 71% of the pore volume and 81% of the pore surface area, and show that the peak of the pore size distribution of 1 to 2 μm is higher and that the software cannot identify pores less than 1 μm in size. This means that although we have identified a large number of pores ranging between 1 to 2 μm, it may mean that there are more pores less than 1 μm in size that have not been identified. This is also one of the limitations of this method; however, there appears to be no issue when analyzing pores 1 μm or more in size.

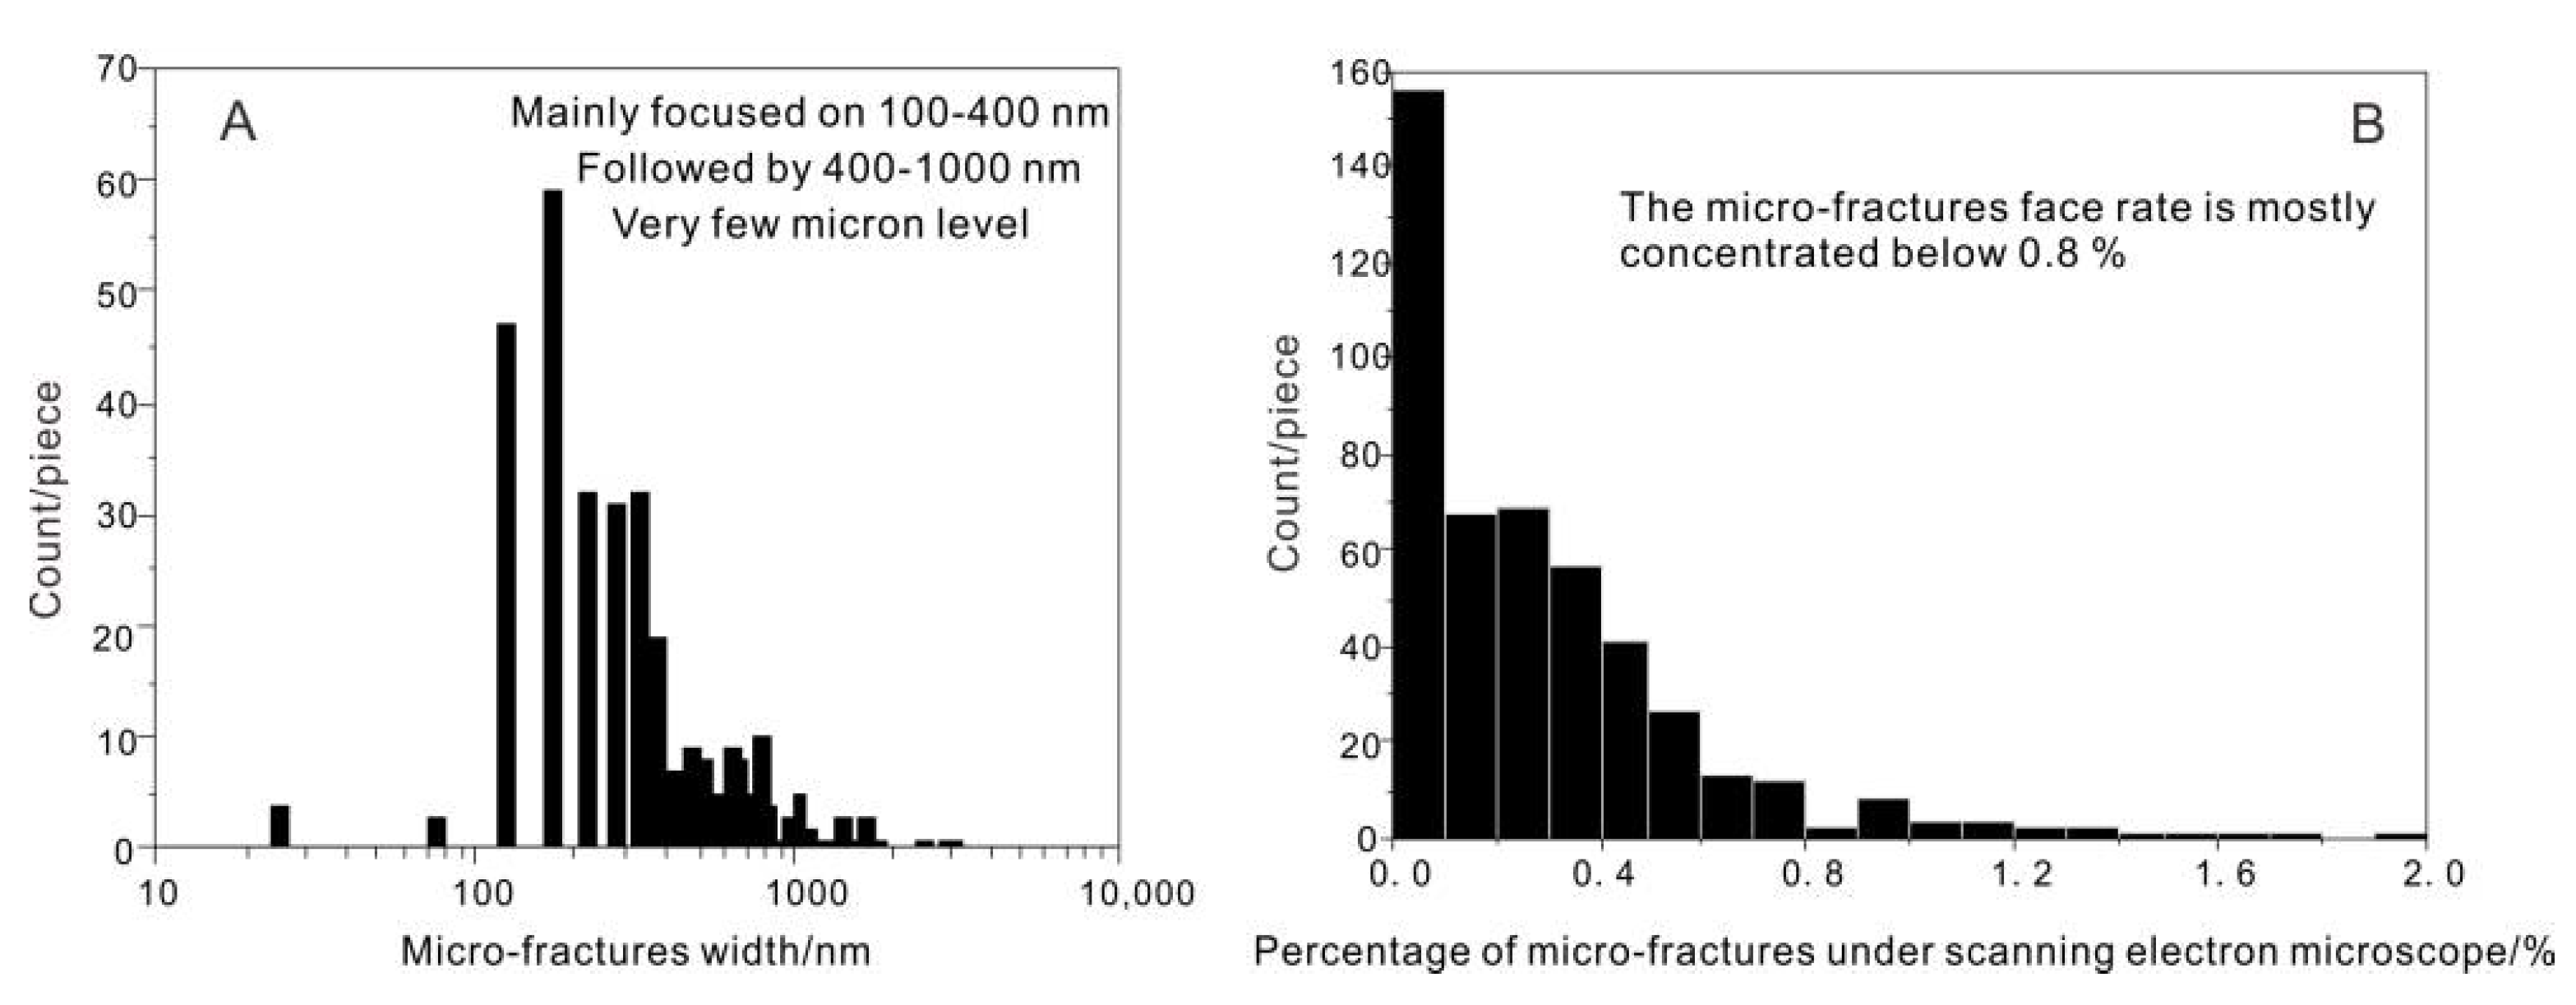
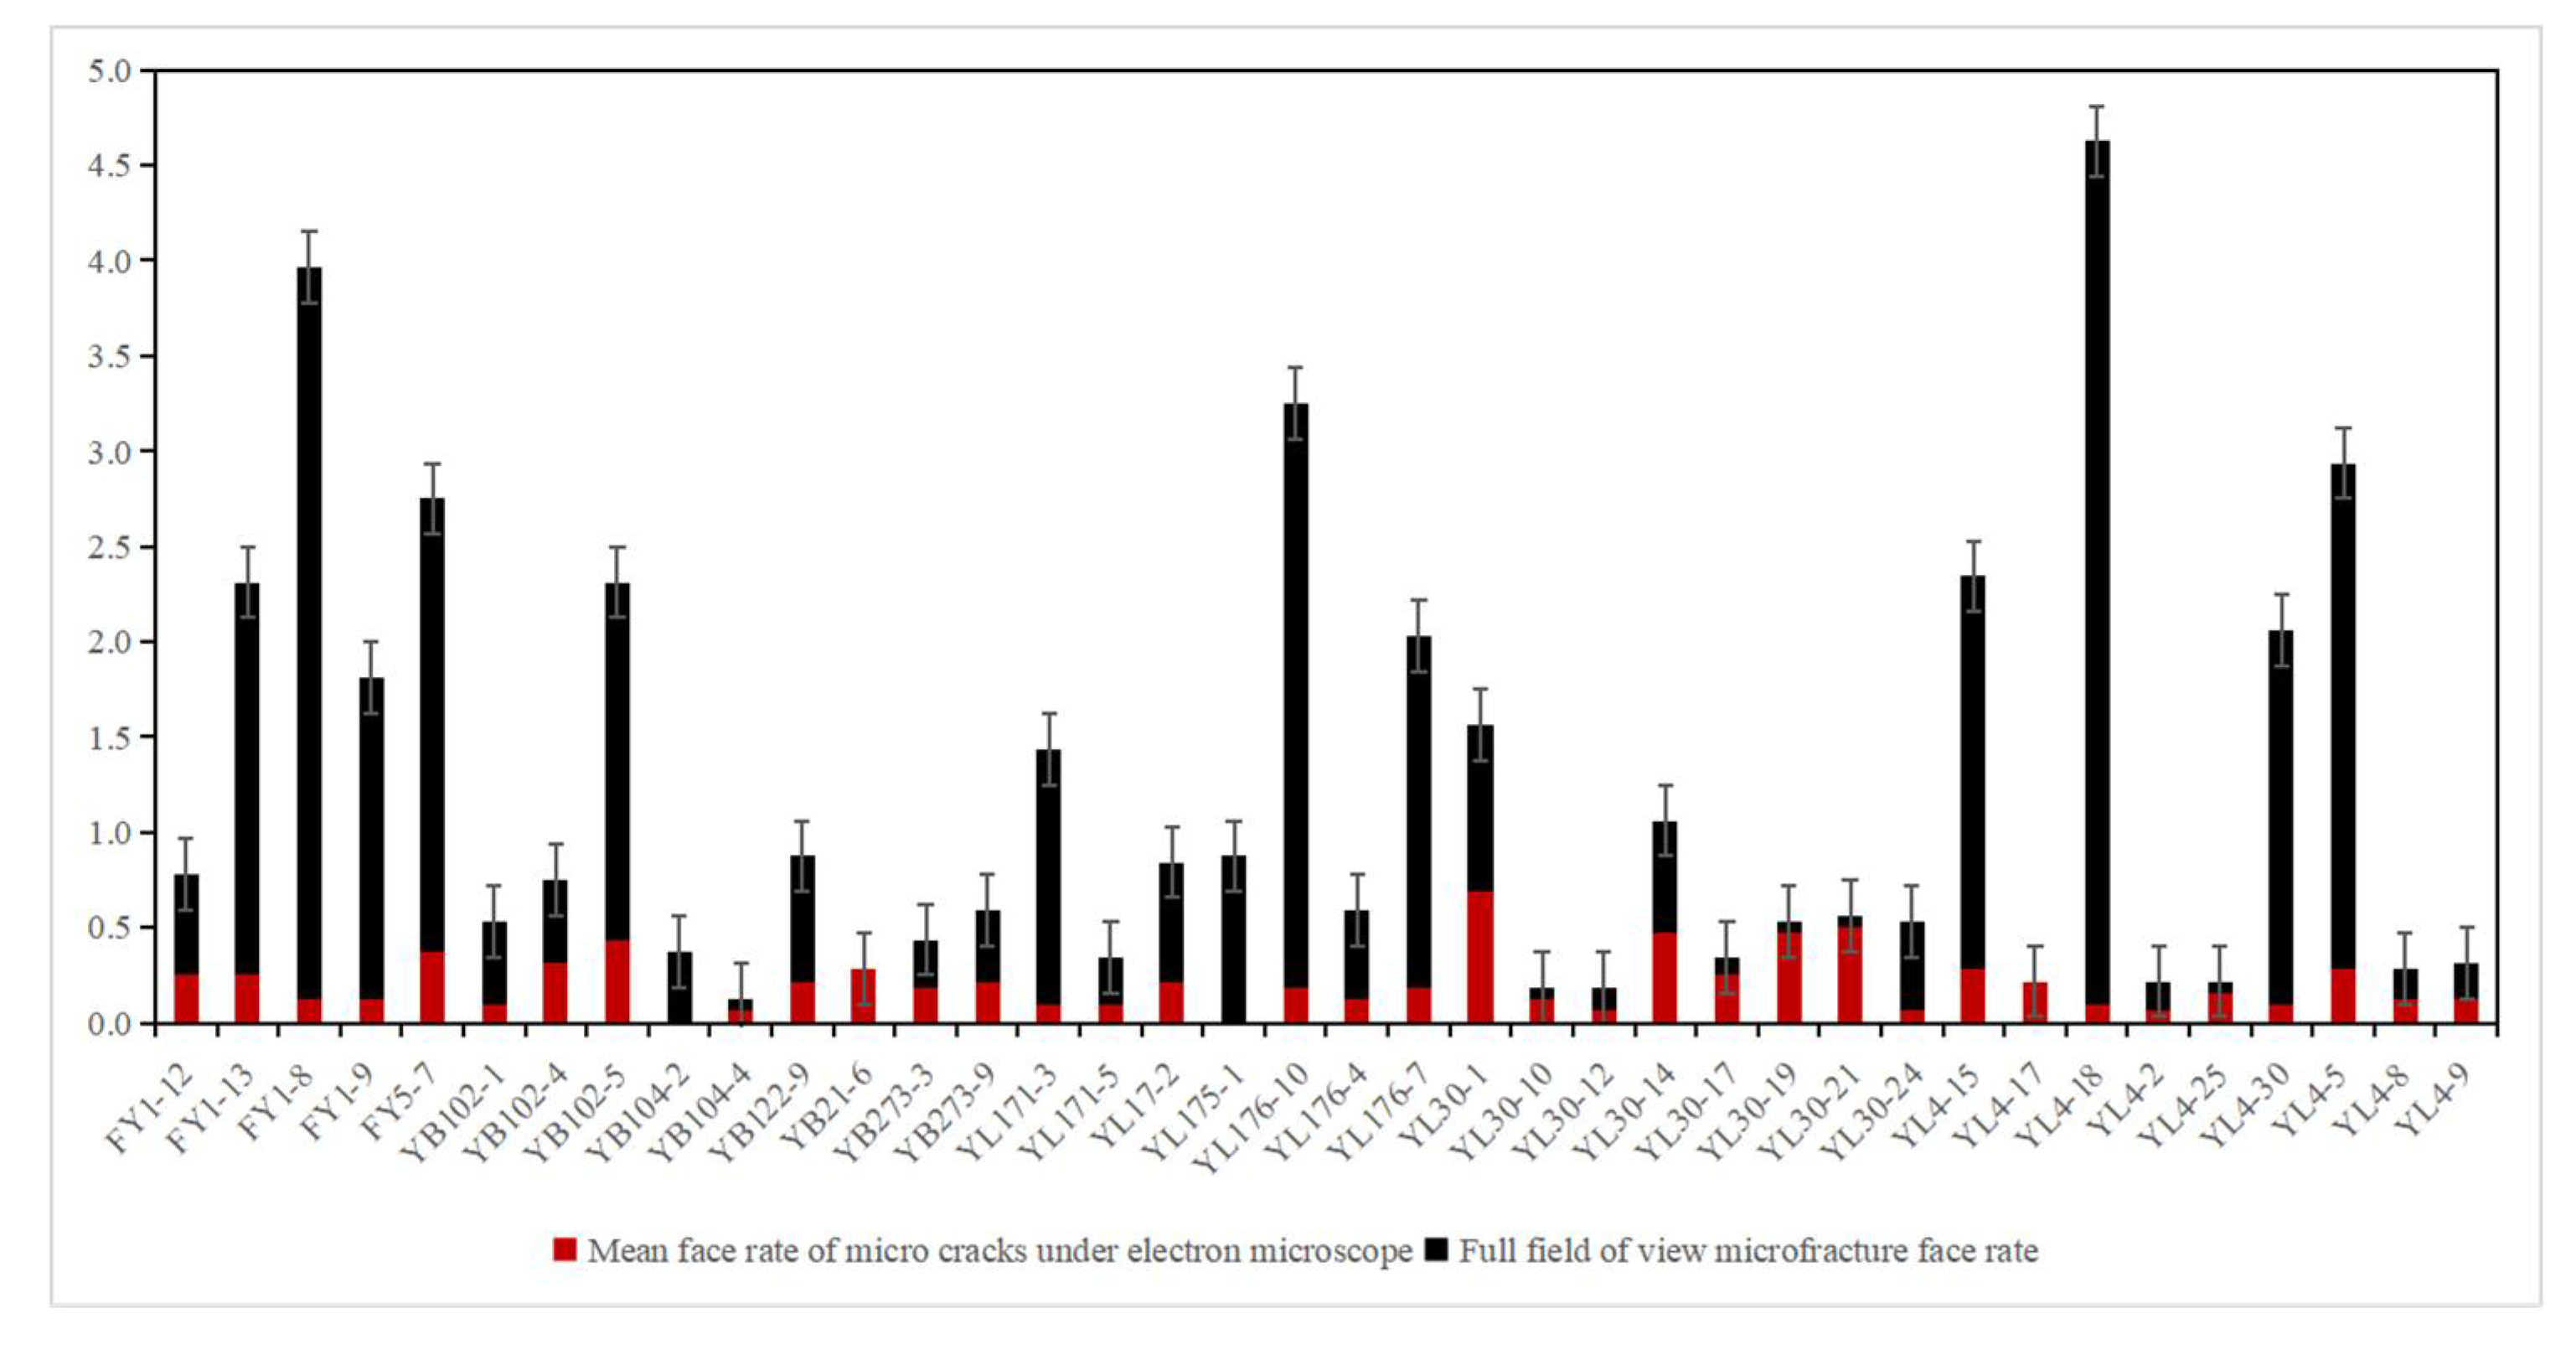
5.2.2. Quantitative Identification of Microcracks by Scanning Electron Microscopy

The microfractures observed under an electron microscope are all open, which is of great significance to the improvement of the porosity and permeability of shale reservoirs. Among them, a small number of fractures become channels for the migration and accumulation of hydrocarbons, which are contaminated by the migration of organic matter. Therefore, parameters such as the width and length of the fractures are critical to their connectivity. We have conducted statistical analyses on the distribution of the widths of the microcracks and found that they are mainly distributed between 200 to 400 nm, followed by between 400 to 1000 nm, and the number of microcracks can be ignored. To measure the degree of development of the microcracks, their face ratios in the electron microscope field of view is a parameter worth assessing (Figure 9A). We used a magnification of 500 to 2000 times to observe and photograph microcracks. After calculating their face ratios, we found that they are mainly distributed below 0.8%. Although this value is not high, it is indeed an objective microscopic channel for oil and gas migration and accumulation and is of great potential significance to improving shale storage and permeability (Figure 9B).

5.2.3. Comprehensive Quantitative Characterization of Multi-Scale Microfractures

Although we have obtained hole-fracture distribution information, we face new problems given that we intend to describe and characterize the microfractures in detail. A method such as micro-CT gives a too-low resolution in terms of its accuracy in recognizing microcracks, with the connected three-dimensionally distributed microcracks being identified as many isolated small holes. This leads to a decrease in the contribution of cracks to porosity and an increase in the contribution of porosity to porosity. In addition, the scale of various experiments is different, and it is difficult to determine the proportion of microfractures in the pore-fracture system.
On this basis, a comprehensive quantitative characterization of multi-scale microfractures was carried out. First, the combined quantitative characterization of high-pressure mercury intrusion and nitrogen adsorption can measure the distribution of pores over a range of 0.8 to 1500 nm. The pore size data interpreted by nitrogen adsorption give values below 50 nm, and the data interpreted by high-pressure mercury injection provide values above 50 nm. These were sampled and statistics at uniform intervals were undertaken to obtain the total pore size distribution of the shale (Figure 10A). It is found that the shale pore size has two peaks, both occupying the mesopore interval (2 to 50 nm), meaning the pore volume is mainly provided by mesopores. These peaks were at 1 to 10 nm and 10 to 100 nm, indicating that there are multiple types of pores. There were also multiple peaks above 100 nm, between 100 and 1000 nm, and between 1000 to 10,000 nm, but the ratios were small. This shows that the shale pore structure is complex, and multi-scale pores and fractures develop (Figure 10B). Observed by light and electron microscopes, microfractures are basically macro-pores with a diameter greater than 50 μm. From the point of view of pore size distribution, the error associated with using macropores to estimate the proportion of microfractures will not be too large. However, due to the low overall diagenesis of the continental shale in the study area, there are still some primary pores and clay mineral pores in the shale that will be counted among them.
Thin slices can allow macroscopic microcracks above 5 μm to be identified, and electron microscopy can identify microcracks below this size, with some overlap between the observable scales of these methods. According to the statistics of fracture width, the widths of microcracks are not arbitrary. The slit width of the sheet is mainly 10 to 100 μm, and the aperture ratio is about 1%. The slit widths under the electron microscope are mainly 100 to 1000 μm, and the aperture ratio is about 0.2%. The distribution of slit widths does not overlap, indicating that the observed objects are of different scales, so they can complement each other. Therefore, a full-scale quantitative evaluation of microcracks can be performed by combining thin slices and electron microscope crack identification methods. Due to different magnifications used under microscopes, differing minimum crack widths can be observed, i.e., the higher the magnification, the wider the scale of the microcrack that can be observed, and the greater the number of microcracks observed, the higher the calculated face rate. Therefore, the large image stitching function of the NIS-Elements software was used to continuously stitch multiple microscope images at high magnifications into a single large image. The image obtained in this way not only shows more microscopic microfractures, but also avoids the influence of heterogeneity of microfracture development in shale.
For example, using a 5× objective lens and a 10× eyepiece, stitching slices of the full field of view for statistical analysis, the average aperture ratio of microfractures is 1.08%, and the aperture ratio of most shale samples is mainly distributed below 0.7%. However, there are still some samples with exceptionally developed microcracks, with face ratios between 1.5% and 3%, and the standard deviation reaches 1.163%, which is higher than the average value, indicating that the data are very discrete. It also shows that the degree of differentiation of microfracture development is very high. We evaluated the development of microcracks in the microstructure by randomly taking more than ten photos of each sample under the electron microscope at magnifications of 400 to 2000 times. The average aperture ratio of the nano-scale microcracks under the electron microscope is 0.53%, and the difference is not large, with all of them concentrated below 0.8%, and mostly below 0.2%. We believe that the development of these nanoscale microfractures will play a positive role in shale reservoir properties. The microfracture contribution rate (the ratio of fracture porosity to total porosity), is calculated according to the porosity of different samples, including the total porosity of shale in the Yuanba area of northern Sichuan and the Fuling area of eastern Sichuan, which are 5% and 7%, respectively. Then, the microfractures’ contribution rates for different regions and wells are calculated. The data are highly dispersed, and in general, microfractures account for about 20% of the total pore volume (Figure 11).

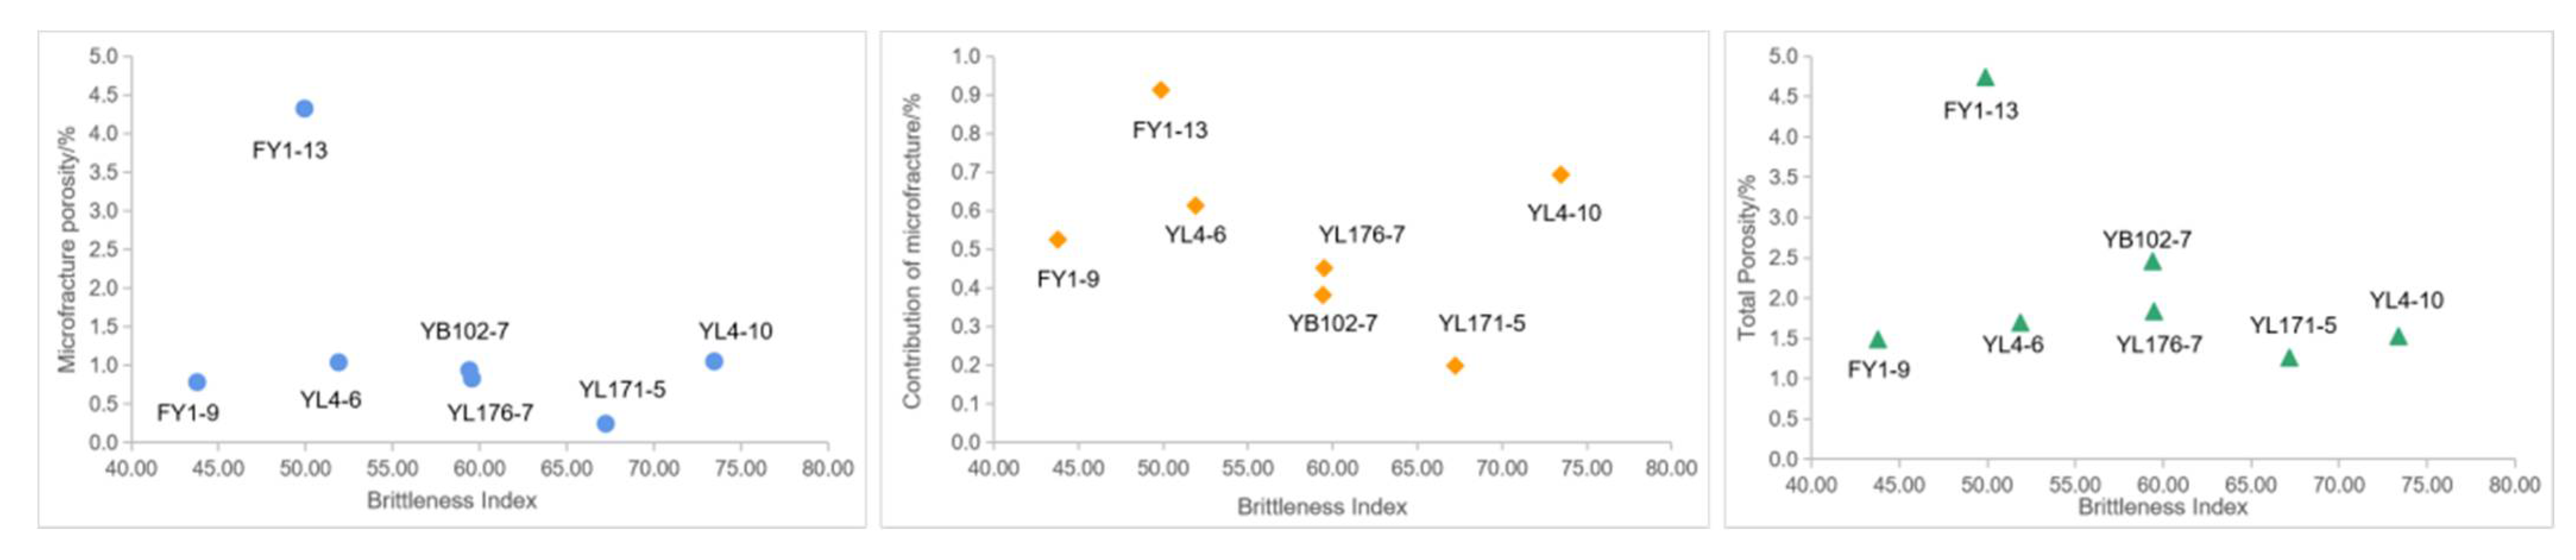
5.2.4. Controlling Factors of Microfractures Development

Through our analysis of the previously calculated microfracture contribution rate, we can see that the degree of the microfractures’ influence on the development of porosity is still very large. Generally speaking, the influencing factors of the development of microfractures in shale include the brittle mineral content, lithological combination, and regional structure. Therefore, we will discuss these three factors to determine which controls the development of microfractures.
We use the brittleness index (BI) to evaluate the evaluation index of brittle minerals. There are many calculation methods, with generally the method of rock mineralogy being used. Quartz, carbonate minerals account for percentage of quartz, carbonate minerals, and clay minerals. The percentage of these is the brittleness index. During our analysis, we found that in addition to these minerals, pyrite is also a component of our samples. However, pyrite is also a brittle mineral and is not accounted for. Therefore, we used the content of other minerals, except for clay minerals, to describe the brittleness index of shale, and calculated the brittleness index of each sample separately, and hence determined the brittleness index, porosity, fracture porosity, and fracture contribution rate (Table 1). These parameters were then, respectively, analyzed for correlations.
We analyzed the correlation between the three factors of total porosity, fracture porosity, and the contribution rate of fractures to porosity presented in Table 1 and the brittleness index. The analysis results are shown in Figure 12. From the results of the correlation analysis, these three parameters are seen to be very similar, and the resulting graphs are close to each other. However, from these results, we cannot prove that the total porosity, fracture porosity, and fracture-to-porosity of the rock have a significant correlation with the brittleness index of the rock.
In terms of the lithological combination, for the samples examined, there is no mutation from mudstone to limestone or sandstone in terms of their lithology. In a previous article, it was found that a small amount of biological shells and sandstone bands exist in some samples of the fracture morphology. In shell-bearing shale and silt-bearing shale, a small amount of microcracking can be seen, but their proportions are less than that of shale and cannot play a significant role in the development of microfractures.
In terms of regional structural distribution, wells YB21 and YB102 are located in structurally stable areas, and large regional faults are not developed in their vicinity. The porosity in this area is well developed, but the contribution rate of microcracks to porosity is not high, with the microcracks accounting for about 10% of the total pores. Wells YL4, YL171, and YL176 are located in structurally developed areas, with fault-folded belts and high-steep belts. Their porosity is similar, but their microfractures lead to very high porosity, with the microfractures accounting for up to 40% to 90% (Figure 13). Through the above discussion of the contribution rate of microfractures, we gain the following basic understanding that the contribution rate of microfractures is less correlated with the content of brittle minerals, and the contribution of microfractures is higher in areas with developed structures than in areas with underdeveloped structures (Figure 14). The development of shale microfractures is mostly shale-related microfractures, and their degree of development is related to the development of the shale, and the regional tectonic environment.

6. Conclusions

Through thin slice section, micro-CT scanning, scanning electron microscopy analysis, and nitrogen adsorption and high-pressure mercury intrusion measurements, we analyzed the characteristics of microfractures in the Da’anzhai shale from Lower Jurassic artesian wells in northeastern Sichuan. The conclusions are as follows:
(1) Four types of fractures appear to have developed in the shale of the Da’anzhai section: mainly microfractures caused by tectonic stress, followed by smaller clay mineral diagenetic shrinkage fractures, organic marginal shrinkage fractures, and microfractures inside mineral particles. Among them, structural fractures and organic matter contraction fractures are the main development types and are of significance for shale reservoir development and seepage.
(2) The structural microfractures are mainly open and have developed in the bedding-developed shale, with straight shapes and bedding orientation. In some areas, interlayer seams are developed and formed into dendritic and net-like shapes, with curved seam surfaces, fully opened, and mainly tensile. Organic matter cracks often develop on the edge of the contacts between organic matter and minerals, showing a slit-like shape. Through micro-CT imaging, we clearly see that the seams related to the bedding are particularly developed, with larger openings, wider extensions, intersecting and expanding, forming a three-dimensional interconnected hole-slit system.
(3) Multi-scale stitching allows the calculation of the contribution rate of microfractures for different regions and wells. Generally, microfractures account for about 20% of the total pore volume. However, the degree of development of microfractures in different structural regions varies greatly. Microfractures in fault-wrinkle belts and high-steep belts can account for up to 40% to 90%, and microfractures in areas with underdeveloped structures account for about 10% of the total pore volume.

Author Contributions

Conceptualization, Z.L. and H.Q.; methodology, F.W.; software, F.W.; validation, Z.Y., Z.S.; formal analysis, H.Q.; investigation, R.L., X.W.; resources, Z.J.; data curation, Z.L.; writing—original draft preparation, H.Q.; writing—review and editing, Z.J.; visualization, D.W.; supervision, Z.S.; project administration, F.C.; funding acquisition, Z.J. All authors have read and agreed to the published version of the manuscript.

Funding

This study is supported by the National Natural Science Foundation of China (no. 41872135 & no.42072151)and the National Major Science and Technology Projects of China (2016ZX05034001-005).

Data Availability Statement

The data presented in this study are available on request from the corresponding author. The data are not publicly available due to some basic research involves confidentiality.

Acknowledgments

The Southern Company of Exploration SINOPEC is thanked for providing shale samples and geological background references. We are grateful to editors and reviewers for their constructive comments and suggestions.

Conflicts of Interest

The authors declare no conflict of interest.

References

  1. Zeng, L.B.; Lyu, W.Y.; Li, J.; Zhu, L.F.; Weng, J.Q.; Yue, F.; Zu, K.W. Natural fractures and their influence on shale gas enrichment in Sichuan Basin, China. J. Nat. Gas Sci. Eng. 2016, 30, 1–9. [Google Scholar] [CrossRef]
  2. Zhang, W.Z.; Xie, L.Q.; Yang, W.W.; Qin, Y.; Peng, P.A. Micro fractures and pores in lacustrine shales of the Upper Triassic Yanchang Chang7 Member, Ordos Basin, China. J. Pet. Sci. Eng. 2017, 156, 194–201. [Google Scholar] [CrossRef]
  3. Guo, T.l. Key geological issues and main controls on accumulation and enrichment of Chinese shale gas. Pet. Explor. Dev. 2016, 3, 349–359. [Google Scholar] [CrossRef]
  4. He, Z.L.; Hu, Z.Q.; Nie, H.K.; Li, S.J.; Xu, J. Characterization of shale gas enrichment in the Wufeng Formation–Longmaxi Formation in the Sichuan Basin of China and evaluation of its geological construction–transformation evolution sequence. J. Nat. Gas Geosci. 2017, 2, 1–10. [Google Scholar] [CrossRef]
  5. Yi, J.Z.; Bao, H.Y.; Zheng, A.W.; Zhang, B.Q.; Shu, Z.G.; Li, J.Q.; Wang, C. Main factors controlling marine shale gas enrichment and high-yield wells in South China, a case study of the Fuling shale gas field. Mar. Pet. Geol. 2019, 103, 114–125. [Google Scholar] [CrossRef]
  6. Liu, C.; Liu, H.; Zhang, Y.P.; Deng, D.W.; Wu, H.A. Optimal spacing of staged fracturing in horizontal shale-gas well. J. Nat. Gas Sci. Eng. 2015, 132, 86–93. [Google Scholar] [CrossRef]
  7. Dong, D.Z.; Shi, Z.S.; Guan, Q.Z.; Jiang, S.; Zhang, M.Q.; Zhang, C.C.; Wang, S.Y.; Sun, S.S.; Yu, R.Z.; Liu, D.X.; et al. Progress, challenges and prospects of shale gas exploration in the Wufeng–Longmaxi reservoirs in the Sichuan Basin. Nat. Gas Ind. B 2018, 5, 415–424. [Google Scholar] [CrossRef]
  8. Ma, Y.S.; Cai, X.Y.; Zhao, P.R. China’s shale gas exploration and development, Understanding and practice. Pet. Explor. Dev. 2018, 45, 589–603. [Google Scholar] [CrossRef]
  9. Zhao, J.Z.; Ren, L.; Shen, C.; Li, Y.G. Latest research progresses in network fracturing theories and technologies for shale gas reservoirs. Nat. Gas Ind. B 2018, 5, 533–546. [Google Scholar] [CrossRef]
  10. Mao, P.X.; Sun, J.X.; Ning, F.L.; Hu, G.W.; Wan, Y.Z.; Gao, X.X.; Wu, N.Y. Effect of permeability anisotropy on depressurization-induced gas production from hydrate reservoirs in the South China Sea. Energy Sci. Eng. 2020, 8, 2690–2707. [Google Scholar] [CrossRef] [Green Version]
  11. Chen, S.Y.; Wang, Y.J.; Guo, J.Y.; He, Q.L.; Yin, X.R. Multi-scale evaluation of fractured carbonate reservoir and its implication to sweet-spot optimization, A case study of Tazhong oilfield, Central Tarim Basin, China. Energy Rep. 2021, 7, 2976–2988. [Google Scholar] [CrossRef]
  12. Morrow, C.A.; Lockner, D.A.; Moore, D.E.; Hickman, S. Deep permeability of the San Andreas fault from San Andreas fault observatory at depth (SAFOD) core samples. J. Struct. Geol. 2014, 64, 99–114. [Google Scholar] [CrossRef]
  13. Han, D.Y.; Wang, Z.M.; Song, Y.C.; Zhao, J.F.; Wang, D.Y. Numerical analysis of depressurization production of natural gas hydrate from different lithology oceanic reservoirs with isotropic and anisotropic permeability. J. Nat. Gas Sci. Eng. 2017, 46, 575–591. [Google Scholar] [CrossRef]
  14. Barrie, C.D.; Donohue, C.M.; Zumberge, J.A.; Zumberge, J.E. Production Allocation: Rosetta Stone or Red Herring? Best Practices for Understanding Produced Oils in Resource Plays. Minerals 2020, 10, 1105. [Google Scholar] [CrossRef]
  15. He, Z.L.; Li, S.J.; Nie, H.K.; Yuan, Y.S.; Wang, H. The shale gas “sweet window”, “The cracked and unbroken” state of shale and its depth range. Mar. Pet. Geol. 2019, 101, 334–342. [Google Scholar] [CrossRef]
  16. Borjigin, T.; Shen, B.J.; Yu, L.J.; Yang, Y.F.; Zhang, W.T.; Tao, C.; Xi, B.B.; Zhang, Q.Z.; Bao, F.; Qin, J.Z. Mechanisms of shale gas generation and accumulation in the Ordovician Wufeng-Longmaxi Formation, Sichuan Basin, SW China. Pet. Explor. Dev. 2017, 44, 69–78. [Google Scholar] [CrossRef]
  17. Chen, S.; Han, Y.; Fu, C.; Zhang, H.; Zhu, Y.; Zuo, Z. Micro and nano-size pores of clay minerals in shale reservoirs, Implication for the accumulation of shale gas. Sediment. Geol. 2016, 342, 180–190. [Google Scholar] [CrossRef]
  18. Li, Y.; Hou, J.G.; Li, Y.Q. Features and classified hierarchical modeling of carbonate fracture-cavity reservoirs. Pet. Explor. Dev. 2016, 43, 655–662. [Google Scholar] [CrossRef]
  19. Xu, S.; Gou, Q.; Hao, F.; Zhang, B.; Zhang, Y. Multiscale faults and fractures characterization and their effects on shale gas accumulation in the Jiaoshiba area, Sichuan Basin, China. J. Pet. Sci. Eng. 2020, 189, 107026. [Google Scholar] [CrossRef]
  20. Fan, C.H.; Li, H.; Qin, Q.R.; He, S.; Zheng, C. Geological conditions and exploration potential of shale gas reservoir in Wufeng and Longmaxi Formation of southeastern Sichuan Basin, China. J. Pet. Sci. Eng. 2020, 191, 107138. [Google Scholar] [CrossRef]
  21. Guo, T.L.; Zhang, H.R. Formation and enrichment mode of Jiaoshiba shale gas field, Sichuan Basin. Pet. Explor. Dev. 2014, 41, 31–40. [Google Scholar] [CrossRef]
  22. Wang, P.K.; Huang, X.; Pang, S.J.; Zhu, Y.H.; Lu, Z.Q.; Zhang, S.; Liu, H.; Yang, K.L.; Li, B. Geochemical dynamics of the gas hydrate system in the Qilian Mountain Permafrost, Qinghai, Northwest China. Mar. Pet. Geol. 2015, 59, 72–90. [Google Scholar] [CrossRef]
  23. Cheng, W.; Yang, R.; Zhang, Q. Origin of a Petrographic Coal Structure and Its Implication for Coalbed Methane Evaluation. Minerals 2020, 10, 543. [Google Scholar] [CrossRef]
  24. Mendhe, V.A.; Mishra, S.; Khangar, R.G.; Kamble, A.D.; Kumar, D.; Varma, A.K.; Singh, H.; Kumar, S.; Bannerjee, M. Organo-petrographic and pore facets of Permian shale beds of Jharia Basin with implications to shale gas reservoir. J. Earth Sci. 2017, 28, 897–916. [Google Scholar] [CrossRef]
  25. Guo, R.B.; Zhang, J.C.; Zhao, P.W.; Liu, Z.Y. Influence of interbedded rock association and fracture characteristics on gas accumulation in the lower Silurian Shiniulan formation, Northern Guizhou Province. Open Geosci. 2021, 13, 606–625. [Google Scholar] [CrossRef]
  26. He, X.P.; He, G.S.; Gao, Y.Q.; Zhang, P.X.; Lu, S.F.; Wan, J.Y. Geological characteristics and enrichment laws of normal-pressure shale gas in the basin-margin transition zone of SE Chongqing. Nat. Gas Ind. B 2019, 6, 333–346. [Google Scholar] [CrossRef]
  27. He, J.L.; Wang, J.; Milsch, H.; Qiu, Z.; Yu, Q. The characteristics and formation mechanism of a regional fault in shale strata, Insights from the Middle-Upper Yangtze, China. Mar. Pet. Geol. 2020, 121, 104592. [Google Scholar] [CrossRef]
  28. Guo, L.; Jiang, Z.; Guo, F. Mineralogy and fracture development characteristics of marine shale-gas reservoirs, A case study of Lower Silurian strata in southeastern margin of Sichuan Basin, China. J. Cent. South Univ. 2015, 22, 1847–1858. [Google Scholar] [CrossRef]
  29. Chan, H.; Roberts, S.G.; Gong, J. Micro-scale fracture experiments on zirconium hydrides and phase boundaries. J. Nucl. Mater. 2016, 475, 105–112. [Google Scholar] [CrossRef] [Green Version]
  30. Li, F.L.; Jiang, B.; Cheng, G.X.; Song, Y.; Tang, Z. Structural and evolutionary characteristics of pores-microfractures and their influence on coalbed methane exploitation in high-rank brittle tectonically deformed coals of the Yangquan mining area, northeastern Qinshui basin, China. J. Pet. Sci. Eng. 2019, 174, 1290–1302. [Google Scholar]
  31. Zeng, L. Microfracturing in the Upper Triassic Sichuan Basin tight-gas sandstones, Tectonic, overpressure, and diagenetic origins. AAPG Bull. 2010, 94, 1811–1825. [Google Scholar] [CrossRef]
  32. Zhang, H.J.; Jiang, Y.Q.; Zhou, K.M.; Fu, Y.H.; Zhong, Z.; Zhang, X.M.; Qi, L.; Wang, Z.L.; Jiang, Z.Z. Connectivity of pores in shale reservoirs and its implications for the development of shale gas, A case study of the Lower Silurian Longmaxi Formation in the southern Sichuan Basin. Nat. Gas Ind. B 2020, 7, 348–357. [Google Scholar] [CrossRef]
  33. Harpalani, S.; Schraufnagel, R.A. Shrinkage of coal matrix with release of gas and its impact on permeability of coal. Fuel 1990, 69, 551–556. [Google Scholar] [CrossRef]
  34. Zhu, H.J.; Ju, Y.W.; Huang, C.; Chen, F.W.; Chen, B.Z.; Yu, K. Microcosmic gas adsorption mechanism on clay-organic nanocomposites in a marine shale. Energy 2020, 197, 117256. [Google Scholar] [CrossRef]
  35. Zhang, X.L.; Wu, C.F.; He, J.X.; Ren, Z.Q.; Zhou, T.T. The Controlling Effects of Compositions on Nanopore Structure of Over-Mature Shale from the Longtan Formation in the Laochang Area, Eastern Yunnan, China. Minerals 2019, 9, 403. [Google Scholar] [CrossRef] [Green Version]
  36. Zhu, H.J.; Ju, Y.W.; Huang, C.; Qi, Y.; Ju, L.T.; Yu, K.; Li, W.Y.; Su, X.; Feng, H.Y.; Qiao, P. Tectonic and thermal controls on the nano-micro structural characteristic in a Cambrian organic-rich shale. Minerals 2019, 9, 354. [Google Scholar] [CrossRef] [Green Version]
  37. Mitchell, T.M.; Faulkner, D.R. Towards quantifying the matrix permeability of fault damage zones in low porosity rocks. Earth Planet. Sci. Lett. 2012, 339, 24–31. [Google Scholar] [CrossRef]
  38. Nara, Y.; Meredith, P.G.; Yoneda, T.; Kaneko, K. Influence of macro-fractures and micro-fractures on permeability and elastic wave velocities in basalt at elevated pressure. Tectonophysics 2011, 503, 52–59. [Google Scholar] [CrossRef] [Green Version]
  39. Bolton, A.J.; Maltman, A.J.; Fisher, Q. Anisotropic permeability and bimodal pore-size distributions of fine-grained marine sediments. Mar. Pet. Geol. 2000, 17, 657–672. [Google Scholar] [CrossRef]
  40. Mitchell, T.M.; Faulkner, D.R. Experimental measurements of permeability evolution during triaxial compression of initially intact crystalline rocks and implications for fluid flow in fault zones. J. Geophys. Res. Solid Earth 2008, 113. [Google Scholar] [CrossRef]
  41. Zhou, L.; Chen, B.; Fan, R.; Yang, S.W.; Zhou, K.; Zhou, X.F. Characteristics and Formation Mechanism of Ultra-low Permeability Tight Sandstone Reservoirs under Multi-source Systems. Electron. J. Geotech. Eng. 2016, 21, 2389–2403. [Google Scholar]
  42. Wang, E.; Meng, K.; Su, Z.; Meng, Q.R.; Chu, J.J.; Chen, Z.L.; Wang, G.; Shi, X.H.; Liang, X.Q. Block rotation, Tectonic response of the Sichuan basin to the southeastward growth of the Tibetan Plateau along the Xianshuihe-Xiaojiang fault. Tectonics 2014, 33, 686–718. [Google Scholar] [CrossRef]
  43. Meng, K.; Wang, E.; Wang, G. Uplift of the Emei Shan, western Sichuan basin: Implication for eastward propagation of the Tibetan plateau in early Miocene. J. Asian Earth Sci. 2016, 115, 29–39. [Google Scholar] [CrossRef] [Green Version]
  44. Ma, X.H.; Xie, J. The progress and prospects of shale gas exploration and development in southern Sichuan Basin, SW China. Pet. Explor. Dev. 2018, 45, 172–182. [Google Scholar] [CrossRef]
  45. Zhai, G.Y.; Li, J.; Jiao, Y.; Wang, Y.F.; Liu, G.H.; Xu, Q.; Wang, C.; Chen, R.; Guo, X.B. Applications of chemostratigraphy in a characterization of shale gas Sedimentary Microfacies and predictions of sweet spots—taking the Cambrian black shales in Western Hubei as an example. Mar. Pet. Geol. 2019, 109, 547–560. [Google Scholar] [CrossRef]
  46. Ma, X. A golden era for natural gas development in the Sichuan Basin. Nat. Gas Ind. B 2017, 4, 163–173. [Google Scholar] [CrossRef]
  47. Jizhong, H. Exploration prospect of shale gas and coal-bed methane in Sichuan Basin. Lithol. Reserv. 2009, 21, 116–120. [Google Scholar]
  48. Su, K.M.; Lu, J.G.; Zhang, G.W.; Chen, S.J.; Li, Y.; Xiao, Z.L.; Wang, P.; Qiu, W. Origin of natural gas in Jurassic Da’anzhai Member in the western part of central Sichuan Basin, China. J. Pet. Sci. Eng. 2018, 167, 890–899. [Google Scholar] [CrossRef]
  49. Yang, G.; Huang, D.; Huang, P.H.; Yan, W.P.; Yang, T.Q.; Dai, H.M.; Lin, J.P. Control factors of high and stable production of Jurassic Da’anzhai Member tight oil in central Sichuan Basin, SW China. Pet. Explor. Dev. 2017, 44, 866–875. [Google Scholar] [CrossRef]
  50. Chen, S.J.; Zhang, H.X.; Lu, J.G.; Yang, Y.M.; Liu, C.W.; Wang, L.; Zou, X.L.; Yang, J.J.; Tang, H.P.; Yao, Y.T.; et al. Controlling factors of Jurassic Da’anzhai Member tight oil accumulation and high production in central Sichuan Basin, SW China. Pet. Explor. Dev. 2015, 42, 206–214. [Google Scholar] [CrossRef]
  51. Chang, E.Z. Collisional orogene between north and south China and its eastern extension in the Korean Peninsula. J. Southeast Asian Earth Sci. 1996, 13, 267–277. [Google Scholar] [CrossRef]
  52. Liang, Y.Y.; Xia, R.; Shan, X.Y.; Ma, Y.; Zhao, E.Q.; Guo, W.H. Geochronology and geochemistry of ore-hosting rhyolitic tuff in the Kengdenongshe polymetallic deposit in the Eastern Segment of the East Kunlun Orogen. Minerals 2019, 9, 589. [Google Scholar] [CrossRef] [Green Version]
  53. Tan, X.C.; Xia, Q.S.; Chen, J.S.; Li, L.; Liu, H.; Luo, B.; Xia, J.W.; Yang, J.J. Basin-scale sand deposition in the Upper Triassic Xujiahe Formation of the Sichuan Basin, Southwest China, Sedimentary framework and conceptual model. J. Earth Sci. 2013, 24, 89–103. [Google Scholar] [CrossRef]
  54. Li, L.; Liu, Z.J.; George, S.C.; Sun, P.C.; Xu, Y.B.; Meng, Q.T.; Wang, K.B.; Wang, J.X. Lake evolution and its influence on the formation of oil shales in the Middle Jurassic Shimengou Formation in the Tuanyushan area, Qaidam Basin, NW China. Geochemistry 2019, 79, 162–177. [Google Scholar] [CrossRef]
  55. Yao, Z.Q.; Li, S.L.; Yu, X.H.; Deleqiati, J.; Yang, F.; Wang, W.; Wang, W.F.; Akedan, S.; Yang, X.T.; Zheng, B.; et al. Effects of the interaction of tectonics, eustasy, climate, and minerals on the sedimentary evolution of early-middle Jurassic in the Hongshanzui region in Junggar Basin. J. Pet. Sci. Eng. 2021, 196, 107967. [Google Scholar] [CrossRef]
  56. Lawton, T.F.; Molina Garza, R.S. U-Pb geochronology of the type Nazas Formation and superjacent strata, northeastern Durango, Mexico, Implications of a Jurassic age for continental-arc magmatism in north-central Mexico. Bulletin 2014, 126, 1181–1199. [Google Scholar] [CrossRef]
  57. Ding, W.L.; Wan, H.; Zhang, Y.Q.; Han, G.Z. Characteristics of the Middle Jurassic marine source rocks and prediction of favorable source rock kitchens in the Qiangtang Basin of Tibet. J. Asian Earth Sci. 2013, 66, 63–72. [Google Scholar] [CrossRef]
  58. Wang, X.Y.; Jin, Z.K.; Zhao, J.H.; Zhu, Y.X.; Hu, Z.Q.; Liu, G.X.; Jiang, T.; Wang, H.; Li, S.; Shi, S.T. Depositional environment and organic matter accumulation of Lower Jurassic nonmarine fine-grained deposits in the Yuanba Area, Sichuan Basin, SW China. Mar. Pet. Geol. 2020, 116, 104352. [Google Scholar] [CrossRef]
  59. Peng, C.Z.; Peng, J.; Chen, Y.H.; Zhang, H.R. Seismic prediction of sweet spots in the Da’anzhai shale play, Yuanba area, the Sichuan Basin. Nat. Gas Ind. B 2014, 1, 185–191. [Google Scholar]
  60. Kang, Y.S.; Rao, Q.; Zhao, Q. Exploration and development potential of the low-maturity continental shale gas in the Fuxin Basin. Nat. Gas Ind. B 2019, 6, 435–443. [Google Scholar] [CrossRef]
Figure 1. Structural of the Sichuan Basin and histogram of regional Lower Jurassic stratigraphy.
Minerals 11 00870 g001
Figure 2. Photograph of typical micro-fractures under shale thin section. (A) YL30-2, 3597.36 m, mudstone with shell, micro-fractures cutting through shell particles; (B) YB21-2, 4026.05 m, mudstone, micro-fractures along the bedding unfilled; (C) YL30-24, 4007.5 m, mudstone, nearly parallel micro-fractures in mudstone; (D) YL4-6, 3748.38 m, mudstone, micro-fractures extending along the edge of the shell into the mudstone, unfilled; (E) YL4-12, 3753.38 m, mudstone, along the shell micro-fractures extending from the edge to mudstone, unfilled; (F) YL4-16, 3756.4 m, calcareous mudstone, interlayer fractures and nearly parallel fractures connected into a network; (G) YL17-2, 3864.22 m, calcareous mudstone, unfilled micro-fractures; (H) YB102-6, 3922.79 m, shell mudstone, micro-fractures, severe silicification of bioclastic edges; (I) FY1-1, 2571 m, calcareous mudstone, networked micro-fractures in mudstone.
Minerals 11 00870 g002
Figure 3. Three-dimensional distribution of bedding-related micro-fractures. (A) YB102-7 3923.19 m 3D gray scale model of the core; (B) FY1-13 2636 m 3D gray scale model of the core; (C) YB102-7 3923.19 m 3D pore model of the core; (D) FY1-13 2636 m 3D pore model of the core.
Minerals 11 00870 g003
Figure 4. Three-dimensional distribution of bedding-related micro-fractures. (A) YL30-19 Structure micro-fractures, cracks are impregnated with organic matter; (B) YL4-20 Bedding structure micro-fractures; (C) YL171-5 Organic matter edge shrinkage seam; (D) YB21-2 Organic matter edge shrinkage seam; (E) FY1-13 Diagenetic shrinkage joints in clay minerals; (F) YL4-8 Internal micro-fractures of shell particles.
Minerals 11 00870 g004
Figure 5. N2 adsorption and desorption curve (A) and pore size distribution of shale N2 adsorption NLDFT model (B).
Minerals 11 00870 g005
Figure 6. The curve of mercury intrusion volume with pressure in high pressure mercury intrusion (A) and pore size distribution explained by high pressure mercury injection (B).
Minerals 11 00870 g006
Figure 7. Percentage distribution of pore volume of different equivalent diameters of micron CT.
Minerals 11 00870 g007
Figure 8. Percentage distribution of specific surface area of pores with different equivalent diameters in micron CT.
Minerals 11 00870 g008
Figure 9. Statistical graph of we have observed numerous micro-scale fractures width under scanning electron microscope (A), and statistics of micro-crack face rate under scanning electron microscopel (B).
Minerals 11 00870 g009
Figure 10. N2 adsorption and mercury porosity distribution diagram (YL4-10) (A) and shale N2 adsorption-high pressure mercury injection full pore size distribution (B).
Minerals 11 00870 g010
Figure 11. Micro-slice photos and scanning electron microscope full-scale micro-fractures hole ratio evaluation.
Minerals 11 00870 g011
Figure 12. The relationship between sample brittleness index and microfracture porosity, contribution of microfracture and total porosity.
Minerals 11 00870 g012
Figure 13. Relationship between the contribution of microfracture porosity and the degree of regional tectonic development.
Minerals 11 00870 g013
Figure 14. Distribution map of the top boundary and bottom boundary of the Da’anzhai section in Yuanba area.
Minerals 11 00870 g014
Table 1. Brief table of brittleness index calculation results of the sample.
Sample IDClayQuartzPotash FeldsparPlagioclaseCalciteDolomiteSideritePyriteBrittleness Index BITotal Porosity
FY1-956.231.20.82.58.2 1.143.81.49
FY1-1350.128.6 1.918.11.3 49.94.74
YB102-740.645.80.71.88.42.7 59.42.46
YL171-532.826.917.430 0.71.267.21.26
YL176-740.531.51.12.423.4 1.1 59.51.83
YL4-648.134.11.24.69.1 1.51.451.91.70
YL4-1026.616.2 1.655.6 73.41.53
Publisher’s Note: MDPI stays neutral with regard to jurisdictional claims in published maps and institutional affiliations.

