Article

The Relation between Trace Element Composition of Cu-(Fe) Sulfides and Hydrothermal Alteration in a Porphyry Copper Deposit: Insights from the Chuquicamata Underground Mine, Chile

1
Andean Geothermal Center of Excellence (CEGA), Department of Geology, Facultad de Ciencias Físicas y Matemáticas, Universidad de Chile, Plaza Ercilla 803, Santiago 8370450, Chile
2
Millennium Nucleus for Metal Tracing Along Subduction, Facultad de Ciencias Físicas y Matemáticas, Universidad de Chile, Santiago 8370450, Chile
3
Department of Earth Sciences, University of Toronto, 22 Russell Street, Toronto, ON M5S 3B1, Canada
4
CODELCO, Gerencia de Exploraciones, Casa Matriz, Huérfanos 1270, Santiago 8370450, Chile
*
Author to whom correspondence should be addressed.
Minerals 2021, 11(7), 671; https://doi.org/10.3390/min11070671
Submission received: 30 April 2021 / Revised: 20 June 2021 / Accepted: 20 June 2021 / Published: 24 June 2021
(This article belongs to the Special Issue 10th Anniversary of Minerals: Frontiers of Mineral Science)

Abstract

:
Porphyry Cu-Mo deposits are among the world’s largest source of Cu, Mo, and Re, and are also an important source of other trace elements, such as Au and Ag. Despite the fact that chalcopyrite, bornite, and pyrite are the most common sulfides in this deposit type, their trace element content remains poorly constrained. In particular, little is known about minor and trace elements partitioning into Cu-(Fe) sulfides as a function of temperature and pH of the hydrothermal fluid. In this study, we report a comprehensive geochemical database of chalcopyrite, bornite, and pyrite in the super-giant Chuquicamata porphyry Cu-Mo deposit in northern Chile. The aim of our study, focused on the new Chuquicamata Underground mine, was to evaluate the trace element composition of each sulfide from the different hydrothermal alteration assemblages in the deposit. Our approach combines the electron microprobe analysis (EMPA) and laser ablation inductively coupled plasma mass spectrometry (LA-ICP-MS) of sulfide minerals obtained from six representative drill cores that crosscut the chloritic (propylitic), background potassic, intense potassic, and quartz-sericite (phyllic) alteration zones. Microanalytical results show that chalcopyrite, bornite, and pyrite contain several trace elements, and the concentration varies significantly between hydrothermal alteration assemblages. Chalcopyrite, for example, is a host of Se (≤22,000 ppm), Pb (≤83.00 ppm), Sn (≤68.20 ppm), Ag (≤45.1 ppm), Bi (≤25.9 ppm), and In (≤22.8 ppm). Higher concentrations of Se, In, Pb, and Sn in chalcopyrite are related to the high temperature background potassic alteration, whereas lower concentrations of these elements are associated with the lower temperature alteration types: quartz-sericite and chloritic. Bornite, on the other hand, is only observed in the intense and background potassic alteration zones and is a significant host of Ag (≤752 ppm) and Bi (≤2960 ppm). Higher concentrations of Ag and Sn in bornite are associated with the intense potassic alteration, whereas lower concentrations of those two elements are observed in the background potassic alteration. Among all of the sulfide minerals analyzed, pyrite is the most significant host of trace elements, with significant concentrations of Co (≤1530 ppm), Ni (≤960 ppm), Cu (≤9700 ppm), and Ag (≤450 ppm). Co, Ni, Ag, and Cu concentration in pyrite vary with alteration: higher Ag and Cu concentrations are related to the high temperature background potassic alteration. The highest Co contents are associated with lower temperature alteration types (e.g., chloritic). These data indicate that the trace element concentration of chalcopyrite, bornite, and pyrite changed as a function of hydrothermal alteration is controlled by several factors, including temperature, pH, fO2, fS2, and the presence of co-crystallizing phases. Overall, our results provide new information on how trace element partitioning into sulfides relates to the main hydrothermal and mineralization events controlling the elemental budget at Chuquicamata. In particular, our data show that elemental ratios in chalcopyrite (e.g., Se/In) and, most importantly, pyrite (e.g., Ag/Co and Co/Cu) bear the potential for vectoring towards porphyry mineralization and higher Cu resources.

1. Introduction

Porphyry copper deposits are currently the world’s largest source of Cu, Mo, and Re [1]. In these deposits, chalcopyrite, and bornite are the main primary copper sulfides, and pyrite is a ubiquitous and abundant gangue sulfide. In the few last decades, a large number of microanalytical studies have focused on determining the trace element geochemistry of Fe, Cu-Fe, and Cu sulfides in several types of ore deposits ([2,3,4], and references therein). However, most studies have targeted sulfides (predominantly pyrite) from volcanogenic massive sulfide deposits, sedimentary-hosted copper/uranium deposits, magmatic nickel-copper deposits and Archean to Mesozoic lode, epithermal, and Carlin-type gold deposits (e.g., [5,6,7,8,9,10,11,12,13,14,15,16,17,18,19,20,21]). In contrast and despite their economic importance, micro-analytical data for ore and gangue sulfides in porphyry copper deposits are sparse and are mostly focused on precious metals (Au and Ag) and platinum group elements (PGE) (e.g., [22,23,24,25,26,27]).
In porphyry copper and epithermal gold deposits, studies have reported that pyrite can host important concentrations of Au, Ni, Co, Cu, As, and Te, in some cases, reaching weight-percent levels [14,23,24,26,27,28,29,30,31,32,33,34]. Data show that chalcopyrite can also host significant amounts of Ag, Au, Bi, In, Cd, Zn, Co, Ni, Te, As, Sb, Cr, Se, and even PGEs [19,20,22,23,26,27,30,35,36,37,38]. However, chalcopyrite is a relatively poor host for trace elements when compared to bornite [12], although microanalytical data for the latter are limited in porphyry systems. Bornite is a well-known host of Ag and Bi in several ore deposit types, and in porphyries, scarce studies report significant amounts of As, Au, Te, Pd, Pt, and Se [12,23,26,27,30,36,37].
Despite these advances, geochemical studies of sulfides in porphyry copper deposits are still exploratory. For example, little is known about the trace element signature of the different sulfide minerals as a function of hydrothermal alteration type. In porphyry systems, the trace element content of each sulfide will depend on the elemental concentrations of the mineralizing fluids, the mineral/fluid partitioning behavior of the elements, and the presence of co-crystallizing sulfide phases. Therefore, changes in the physicochemical conditions of the hydrothermal fluids and the thermodynamic stability of mineral assemblages will likely induce variations in the trace element content of the ore and gangue sulfides. Hence, one fundamental question relates to which elements are incorporated (and potentially concentrated) into specific sulfides in the porphyry environment. A question of equal importance is the type and intensity of the hydrothermal events that contributed key elements that were incorporated into the sulfides during the formation of the deposit. These two questions are closely linked because the trace elements associated with different hydrothermal pulses or events will probably concentrate and partition into different sulfide minerals, for instance, chalcopyrite, bornite, or pyrite. This may result in different concentration ranges (e.g., ppb to wt.% levels) and variable mineralogical forms of incorporation, e.g., solid solution versus micro- to nano-sized inclusions. Consequently, a precise knowledge regarding the trace element abundance in Cu-(Fe) sulfides as a function of alteration type in porphyry systems is of paramount importance to: (1) better understand elemental partitioning under variable physicochemical conditions and evaluate their concentration (or dispersal) in the different hydrothermal alteration events (e.g., potassic, phyllic, or propylitic), and (2) potentially identifying the mineralogical and geochemical features of the sulfides that may be diagnostic for vectoring to porphyry mineralization and use as complementary exploration tools to find higher grade resources.
In this study, we carried out a microanalytical investigation of chalcopyrite, bornite, and pyrite in the super-giant Chuquicamata porphyry Cu-Mo deposit in northern Chile. The purpose of our research was to evaluate how the trace element signature of each sulfide relates to the different hydrothermal alteration types. In particular, we focused on the new Chuquicamata Underground mine, which officially started operations in 2019. This new mine development, which will extend the life of the Chuquicamata deposit for the next 40 years, offers a unique opportunity to investigate the geochemical signature of the major ore and gangue sulfides in depth. To ensure that the samples were representative, we carried out a comprehensive drill core sampling of all of the major hydrothermal alteration types, taking into consideration their spatial distribution within the deposit. Samples of each alteration type were characterized petrographically using optical and electron microscopy methods, followed by in situ mineral analyses using a combination of electron microprobe (EMPA) for the major and minor elements and laser ablation inductively coupled plasma mass spectrometry (LA-ICP-MS) for the trace elements. Our main goal is to determine how the minor and trace elements are distributed into chalcopyrite, bornite, and pyrite during the evolution of a porphyry system. These data are further explored to provide insights into how sulfide precipitation—and hence trace element incorporation—relates to the changing physicochemical conditions (i.e., temperature, pH, fO2, fS2) of the hydrothermal fluid.

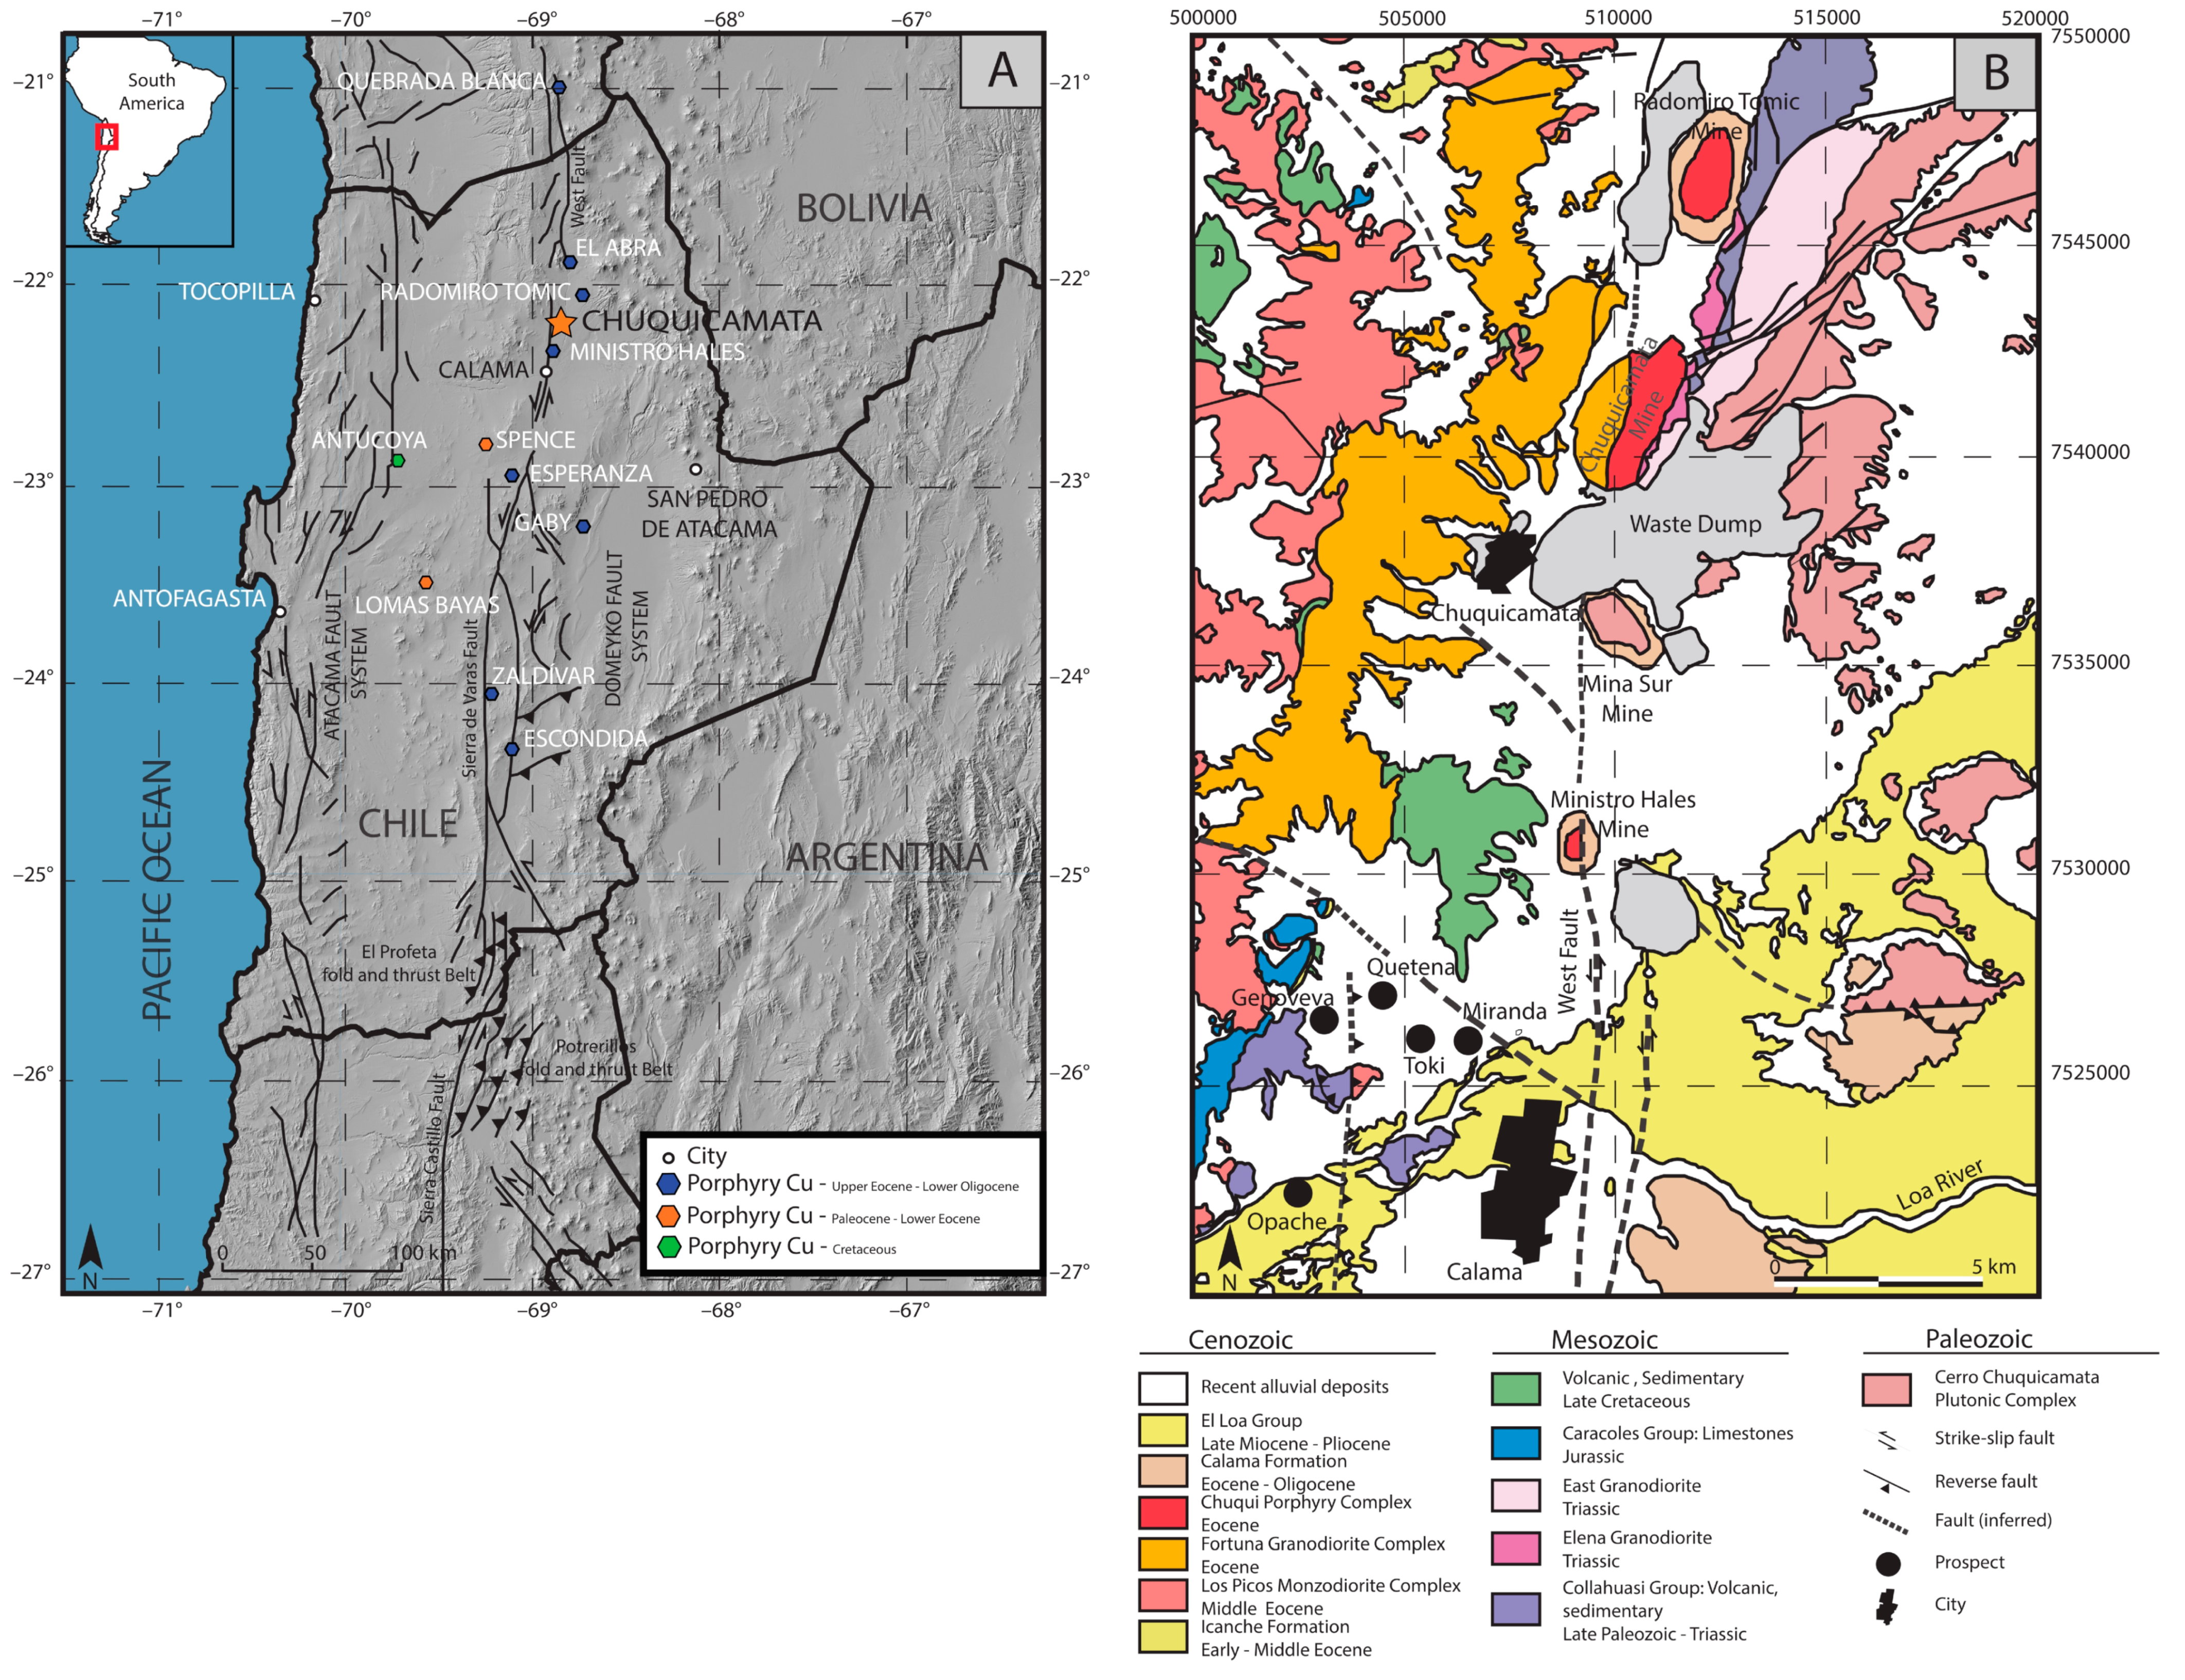
2. Geological Background

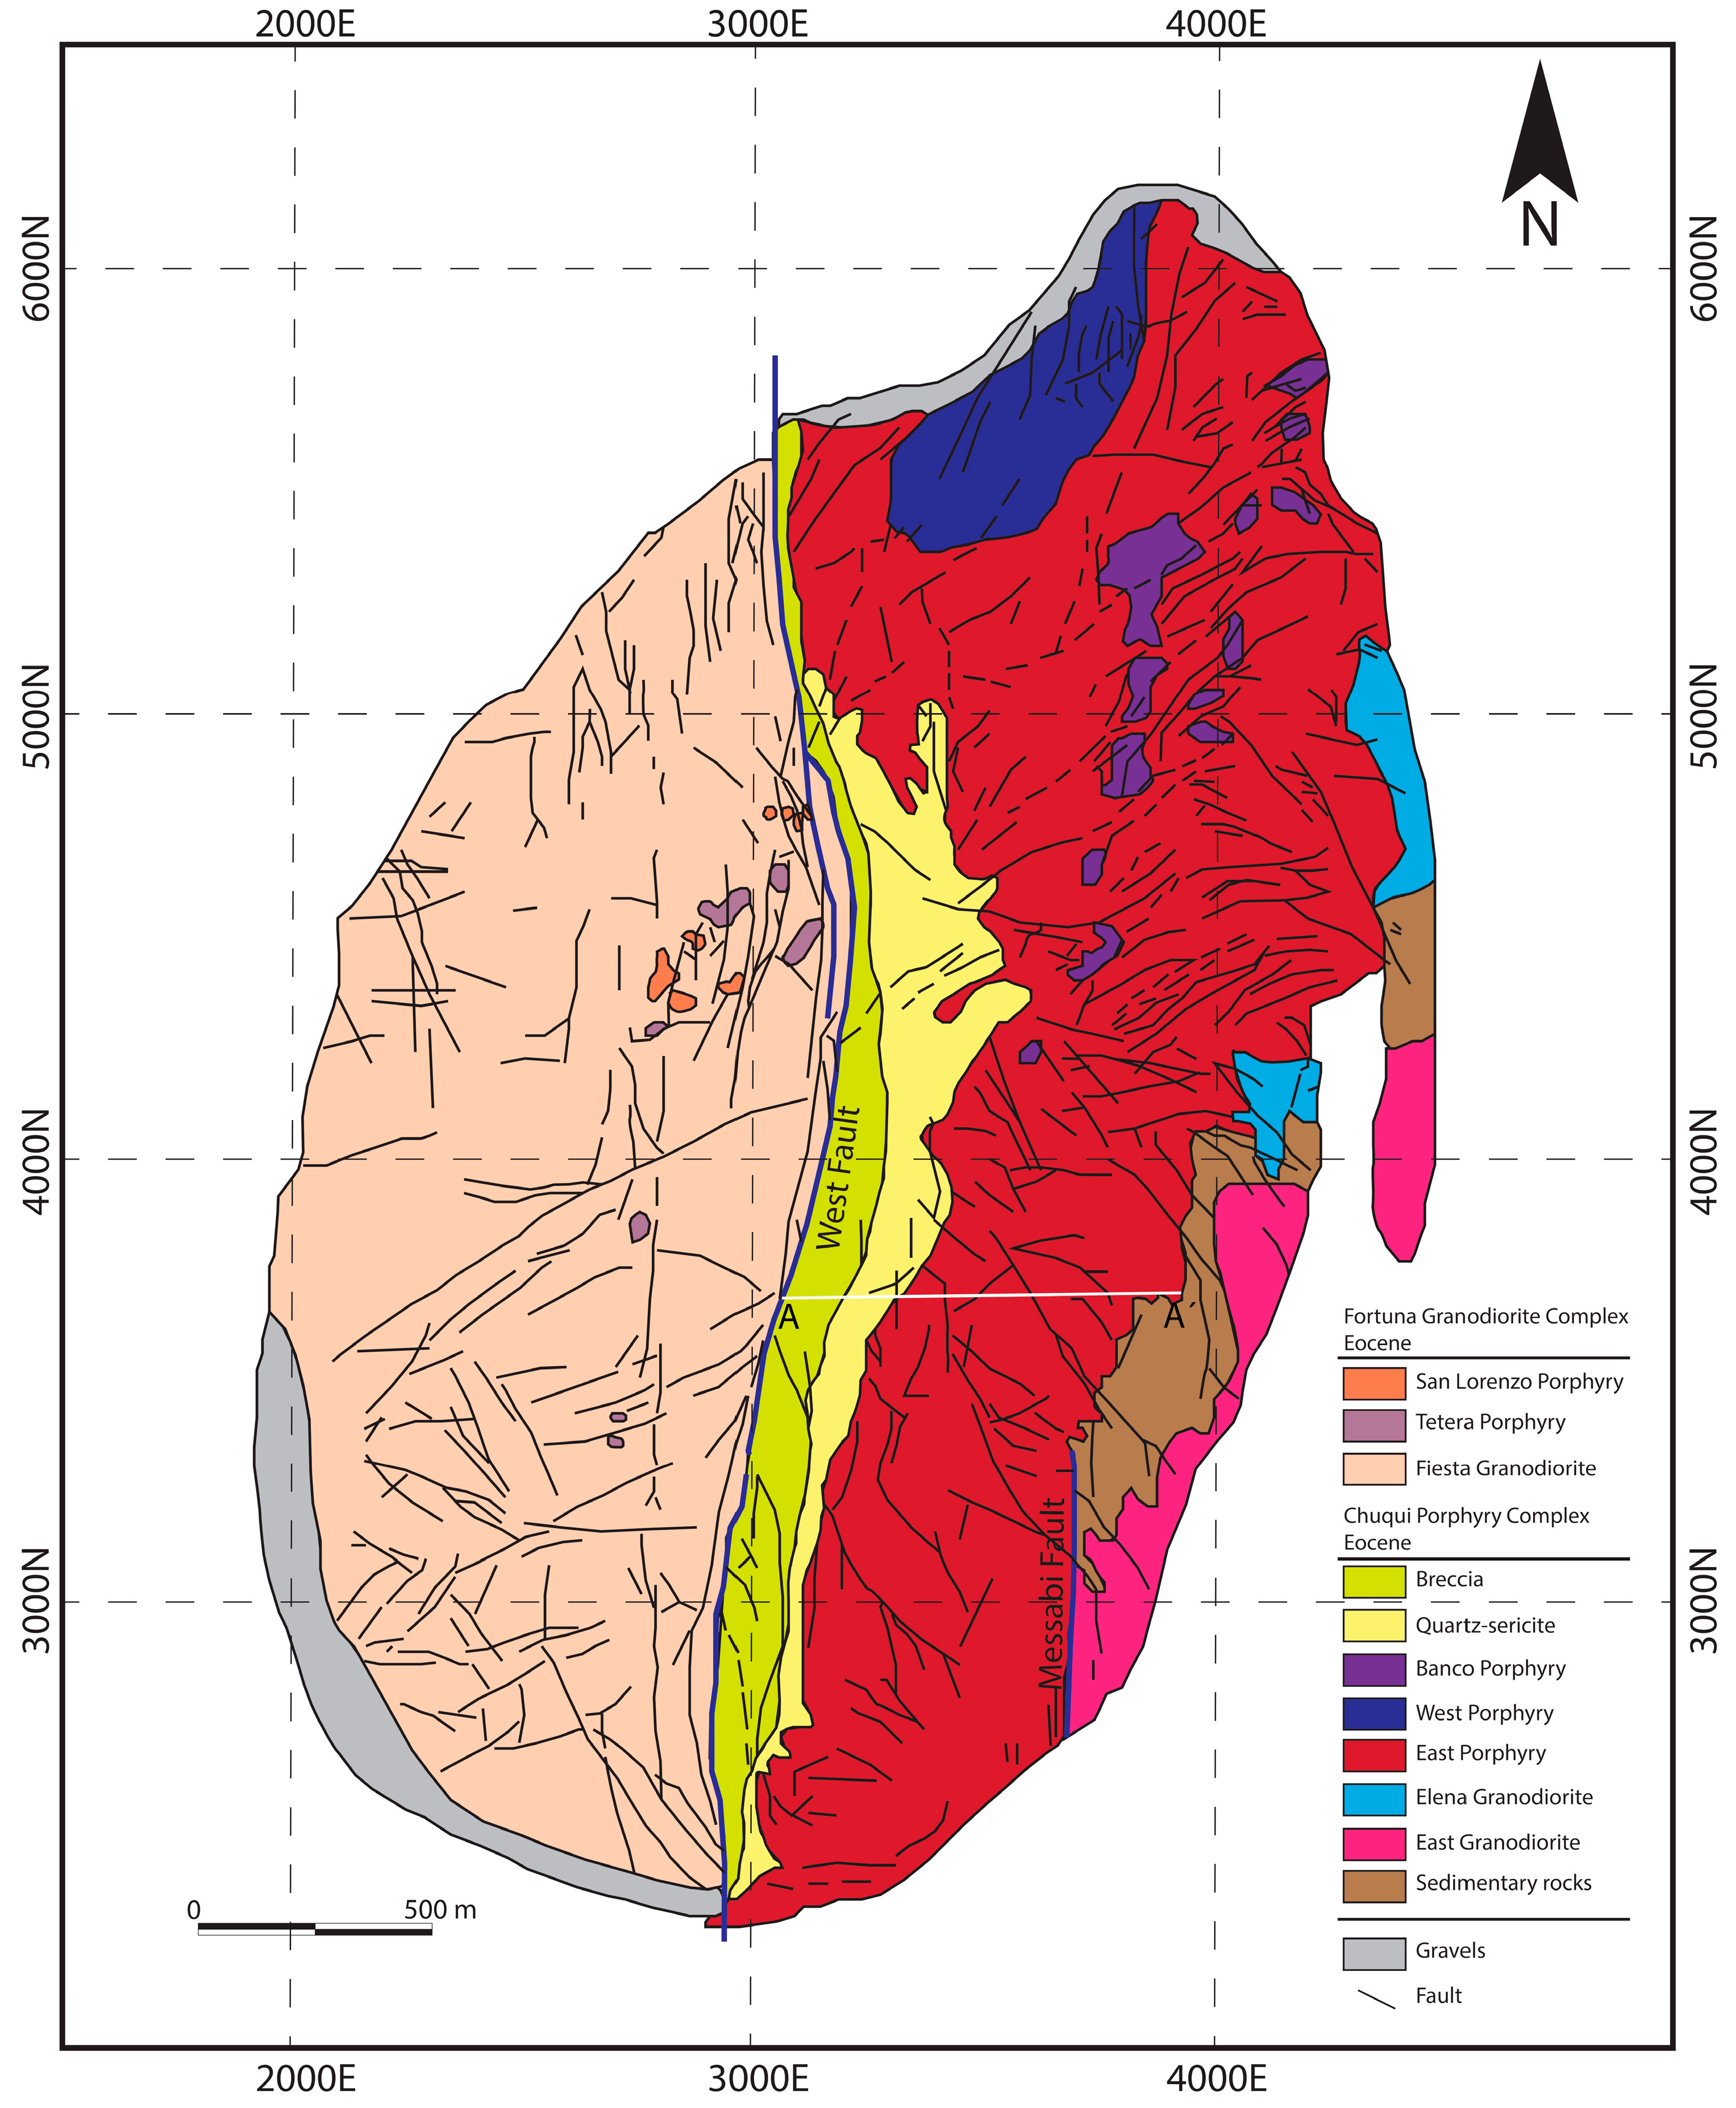
2.1. Geology of the Chuquicamata Deposit

The Chuquicamata porphyry Cu-Mo deposit is located in the Atacama Desert of northern Chile, ~15 km north of Calama and at an altitude of 2800 m above sea level (Figure 1A). Chuquicamata is the largest deposit in the Chuquicamata district, which includes Radomiro Tomic, the exotic copper deposit of Mina Sur, the Ministro Hales mine, and the deposits of the Toki cluster (prospects) (Figure 1B). The total identified resources in the Chuquicamata district are estimated at 113.4 Mt of fine copper, considering a cut-off Cu grade of 0.2 wt.%, from which the Chuquicamata porphyry Cu-Mo deposit contributes 63.7 Mt [39].
The porphyry deposits of the Chuquicamata district are part of a major belt of porphyry Cu deposits aligned along the Domeyko Fault System [40,41,42], where the main structural feature observed is the West Fault (Figure 1B). The Late Eocene-Early Oligocene (43–31 Ma) porphyry copper belt extends for about 1400 km, from 18 to 31 °S [43,44]. On its western margin, the Chuquicamata deposit is truncated by the West Fault, which locally separates weakly mineralized rocks from the barren Fortuna Granodiorite Complex in the west (Figure 1B and Figure 2). The Fortuna Granodiorite Complex, a stock of hornblende-biotite granodiorite with phaneritic texture, has reported zircon U-Pb ages of 39.1 ± 0.4 and 38.5 ± 0.4 Ma [45]. The Triassic Elena Granodiorite, on the other hand, is located on the southeastern margin of the deposit (ca. 233 Ma; [46]).
The Chuquicamata deposit includes both the open pit and the new underground mine and is hosted entirely within the Chuquicamata Intrusive Complex [42,46,47,48] (Figure 1B). This complex is divided into three main intrusive facies, the East, Banco, and West Porphyries [47,49] (Figure 2). The East Porphyry (zircon U-Pb age of 36.2 ± 0.4 Ma; 46) is volumetrically the most important and hosts most of the mineralization. It is locally intruded by smaller bodies of the Banco and West porphyries, both of which are most commonly located in the northern part of the deposit and have a similar composition to that of the East Porphyry (Figure 2). The SHRIMP U-Pb zircon ages of the West and Banco porphyries are 34.03 ± 0.3 Ma and 34.10 ± 0.3 Ma, respectively [45,50].

2.2. Hydrothermal Alteration and Mineralization

In the following sections, the different alteration types at Chuquicamata are described in detail. It is important to note that for this study, we have used the alteration terminology defined in several previous works at the Chuquicamata deposit (e.g., [41,46,47,48]). The alteration terminology follows the established terms for porphyry systems. However, for the sake of clarity, we note that the terms “chloritic”, and “quartz-sericitic” used here are equivalent to propylitic and phyllic, respectively.

2.2.1. Background Potassic and Chloritic Alteration

Hydrothermal alteration at Chuquicamata developed synchronously with the intrusion of the West and Banco porphyries in a ductile to brittle regime, related to a dextral strike-slip system [49]. This early event produced an intense stockwork of “A-type” bornite-chalcopyrite quartz veinlets with a background potassic alteration halo defined by the selective replacement of mafic minerals by secondary biotite and K-feldspar partially replacing plagioclase. This alteration halo affects most of the deposit, carrying scarce and mostly disseminated chalcopyrite, pyrite, and bornite [47]. It has been constrained by K-feldspar and biotite 40Ar/39Ar ages between 33.7 ± 0.2 Ma and 31.9 ± 0.2 Ma [52]. In the outer fringes of this halo, chloritic alteration predominates with the selective chloritization of mafic minerals and micro-veinlets of calcite, ankerite, and hematite. Mineralization associated with the chloritic alteration corresponds mainly to pyrite with minor chalcopyrite [47,48].

2.2.2. Intense Potassic Alteration

Following this early event, an intense potassic alteration event took place and was responsible for the main hypogene mineralization at Chuquicamata. This event occurred with a preferred NNE orientation, probably related to repeated reactivation of the Messabi Fault-East Deformation Zone [48]. The intense potassic alteration is characterized by the destruction of porphyritic textures and abundant veining and disseminated assemblages of bornite, digenite, chalcopyrite, and covellite. This event was defined by two pulses, the first of which is characterized by an intense replacement of plagioclase and biotite by secondary K-feldspar, in some cases with secondary albite. The second pulse is characterized by the presence of grey-green sericite, which occurs disseminated in the halos of quartz veinlets. This event has been dated at 31.8 ± 0.4 Ma (40Ar/39Ar biotite; [53]).
During the transition between these two consecutive pulses of intense potassic alteration, a series of massive quartz-molybdenite, “B-type” veinlets were formed. This veining produced a tabular, subvertical, NS to NNE oriented core zone in the central south portion of the deposit, with average Mo grades ranging from 0.1 to 0.2% [47,48]. The Re-Os molybdenite ages for the “B-type” veinlets are between 32.9 ± 0.2 Ma and 31.7 ± 0.2 Ma [53,54]. During the waning stage of the intense potassic alteration, chalcopyrite was deposited on the fringes of the alteration halo, generating an average grade of 0.8% Cu [47]. This event mainly caused the formation of abundant chalcopyrite veinlets, which crosscut the “B-type” veinlets [48].

2.2.3. Quartz-Sericite and Relict Intense Potassic Alteration

The intense potassic event was followed by a pervasive stage of quartz-sericite alteration (phyllic) distributed along a north-south elongated zone in the western part of the deposit, affecting mainly the area east of the West Fault. This alteration is characterized by the presence of aggregates of sericite, quartz, and clays (kaolinite and illite), which generated a pervasive replacement of feldspar and biotite, obliterating the original texture of the porphyry [46,47,48]. Sulfide mineralization mainly consists of pyrite with variable amounts of digenite, covellite, enargite, chalcopyrite, tennantite, and bornite and occurs in “D-type” veinlets [47,48,49]. This event has been dated between 31.9 ± 0.5 Ma and 30.6 ± 0.4 Ma, determined by 40Ar/39Ar in sericite, biotite, and K-feldspar [52,53]. As a result of the superimposed quartz-sericite alteration on the intense potassic alteration, an intense potassic relict alteration was defined. Finally, hydrothermal alteration at Chuquicamata was followed by a stage of supergene oxidation, dated between 19 ± 0.7 and 15.2 ± 0.5 Ma (K/Ar in supergene alunite; [55]). The main copper oxides developed in the supergene zone are chrysocolla, atacamite, brochantite, and copper wad [47,48,56].

3. Samples and Methods

Core samples were collected from six representative drill cores (CHDD 3618, CHDD 4587, CHDD 7795, CHDD 7808, CHDD 7815, and CHDD 8710) from the central and southern parts of the Chuquicamata Underground mine. The selected drill cores crosscut the main alteration and mineralization units from top to bottom, ensuring that the main alteration types are adequately represented. Figure 3 shows two of the six projected drill holes in a central section of the deposit (cross-section A-A’ in Figure 2). Drill core CHDD 4587 starts from the old part of the pit, and cuts through the intense and background potassic alterations, whereas the longer CHDD 7808 drill core starts in the underground mine and cuts through most alteration zones (described in Section 4.1). From all six drill cores, a total of 120 samples representative of the chloritic, background potassic, intense potassic, and quartz-sericite alterations were chosen. Among these, 40 samples were inspected using polarized-light and scanning electron microscopy. Based on petrographic observation, a subset of 19 representative samples were selected for sulfide microanalysis. The sulfide minerals studied here include chalcopyrite, bornite, and pyrite, which are the most abundant sulfides in the deposit.
Scanning electron microscopy (SEM) observations were carried out at the Andean Geothermal Centre of Excellence (CEGA), Universidad de Chile, using a FEI Quanta 250 SEM equipped with secondary electron (SE), energy dispersive X-ray spectrometry (EDS), and backscattered electron (BSE) detectors. The analytical parameters were: an accelerating voltage of 15–20 kV and an emission current of ~80 µA, a takeoff angle of ~35°, a spot beam of 4–5 µm in diameter, and a working distance of ~10 mm. SEM observations were aimed at characterizing the sulfide and silicate paragenesis in detail and recognizing diagnostic micro-textures as well as detecting the presence of micro-inclusions within sulfides.
Electron microprobe analysis (EMPA) of sulfide minerals was performed using a JEOL JXA-8230 microprobe equipped with five wavelength-dispersive spectrometers at the Electron Probe X-Ray Microanalyzer Laboratory of the University of Toronto in Canada. Operating conditions were: a fully focused beam, a beam energy of 20 keV, and a beam size of ~1 µm in diameter. The beam current was 50 nA for spot analysis. Elements (represented by spectral lines) were acquired using the following analyzing crystals: LIF for Co Kα, Cu Kα, Fe Kα, Zn Kα, and Ni Kα; TAP for As Lα and Se Lα; and PETH for Te Lα, Ag Lα, Pb Mα, Pd Lα, Pt Mα, S Kα, Hg Mα, Bi Mα, Sb Lα, and Au Mα. The standard specimens used for calibration were CoS (for Co), CuFeS2 (for Cu, Fe, and S), ZnS (for Zn), (Ni,Fe)9S8 (for Ni), FeAsS (for As), CuSe (for Se), PdTe (for Pd and Te), AgBiS2 (for Ag and Bi), PbS (for Pb), PtTe2 (for Pt), HgS (for Hg), PdSb (for Sb), and (Au, Cu)0 (80/20) (for Au). The counting times (peak) were 20 s for Co Kα, Cu Kα, Fe Kα, Zn Kα, Ni Kα, Te Lα, Ag Lα, Pd Lα, and S Kα; 30 s for Sb Lα; 40 s for Pb Mα, Pt Mα, Hg Mα, and Bi Mα; 60 s for As Lα and Se Lα; and 120 s for Au Mα. The same (peak) counting times were used for total background readings. The mean detection limits ranged from 0.01 to 0.04 wt.% for most of the analyzed elements.
Laser ablation inductively coupled plasma mass spectrometry (LA-ICP-MS) analyses were acquired on selected sulfide grains following the procedure described in [57]. LA-ICP-MS analyses were carried out using a 193 nm ArF excimer laser (Teledyne-Photon Machines Analyte G2) coupled to a quadrupole ICP-MS (Thermo Fisher Scientific iCAP-Q) at the Mass Spectrometry Laboratory of the Andean Geothermal Center of Excellence (CEGA), Department of Geology, Universidad de Chile. Before each analytical session, the ICP-MS was tuned by ablating a NIST SRM 610 glass to ensure acceptable levels of plasma robustness (i.e., 238U+/232Th+ between 0.95–1.05), oxide production (ThO+/Th+ < 0.5%), and double-charged production (22M+/46Ca++ < 0.01%) [57]. Ablation was carried out using a laser pulse frequency of 4 Hz, an energy density of 2 J/cm2, and a spot size of 40 µm in most cases when the grain size allowed it. The laser spot size was reduced to 30–25 µm when analyzing small grains and to prevent ablating visible mineral inclusions. Pure He was used as a carrier gas, and Ar was added to the gas stream to improve aerosol transport. For each analysis, gas background collection was measured for 30 s followed by a 52 s laser ablation period. The isotopes monitored were: 34S, 51V, 52Cr, 53Cr, 55Mn, 57Fe, 59Co, 60Ni, 63Cu, 65Cu, 66Zn, 69Ga, 72Ge, 73Ge, 75As, 77Se, 82Se, 95Mo, 97Mo, 105Pd, 107Ag, 109Ag, 111Cd, 115In, 118Sn, 120Sn, 121Sb, 123Sb, 125Te, 182W, 185Re, 189Os, 195Pt, 197Au, 202Hg, 205Tl, 206Pb, 207Pb, 208Pb, and 209Bi. A dwell time of 10 ms was used for all elements except for Ag, Cd, In, Sn, Te, Au, and Bi, for which 30 ms were used. The calibration procedure considered both external and internal standard calibration [58]. The total Fe concentrations previously obtained by EMPA were used as the internal standard for chalcopyrite, bornite, and pyrite. The MASS-1 pressed synthetic sulfide reference material [59] was used as the primary standard. In addition, the GSE-1G glass reference material [60] was employed as a secondary standard for quality control (Table S1). External standard measurements were performed at the beginning and at the end of each analysis round of 20 spot analyses. Data integration and reduction was performed using the IoliteTM (v. 3.63) data reduction software [61].
It is important to note that elemental concentrations determined by means of EMPA can be higher than those quantified by LA-ICP-MS in some cases, most likely due to the higher detection limit of the EMPA method. For example, discrepancies between the two techniques for the selected elements (e.g., Co, Zn, and Ag in chalcopyrite; Zn, Co, Ag, and Bi in bornite; and Co in pyrite) may occur when concentrations in the sulfides are close to the detection limit of the EMPA but have a background signal strong enough to obtain a quantitative value. Additionally, differences in the elemental concentrations between the EMPA and LA-ICP-MS methods may arise due to the presence of sub micrometer-sized inclusions, which can be detected and filtered in LA-ICP-MS depth-concentration profiles.

4. Results

4.1. Hydrothermal Alteration and Mineralization

Historically, four main types of hydrothermal alteration have been described in the Chuquicamata deposit, i.e., background potassic, chloritic, intense potassic, and quartz-sericite alteration (e.g., [46,47,48,49,62,63]) (Figure 3). These four types are also recognized in the underground mine in addition to the relict intense potassic alteration [48]. Figure 4 shows photographs of the main alteration types, which are described in detail in the next paragraphs.
The background potassic alteration is an early-stage alteration style characterized by abundant secondary biotite, K-feldspar, albite, and minor calcite. The sulfide mineralogy comprises mainly chalcopyrite, with bornite and pyrite occurring only locally. Mineralization occurs as disseminations and to a lesser extent, as micro-veinlets. This alteration is represented by irregular “A-type” quartz-bearing veinlets, which are usually characterized by K-feldspar halos (Figure 4A).
The chloritic (propylitic) alteration occurs in the most external portions of the system and is dominated by the presence of chlorite with albite, hematite, and minor calcite-ankerite. Epidote is recognized locally in distal zones. Sulfide mineralization associated with this alteration type is mainly pyrite with local chalcopyrite. The chloritic alteration is represented by three types of veinlets: (i) continuous mm-to-cm thick chlorite veinlets without an alteration halo (Figure 4B); (ii) discontinuous hematite veinlets without an alteration halo, commonly a few mm thick (Figure 4C); (iii) continuous pyrite veinlets, commonly associated with chlorite or magnetite disseminated in the veinlets without an alteration halo (Figure 4D).
The intense potassic alteration is characterized by the presence of secondary K-feldspar accompanied by secondary albite and quartz. Grey-green sericite is also present but is found only locally. The fabric of this alteration is cataclastic, frequently forming a micro-breccia with a fine matrix of micro- to crypto-crystalline quartz and K-feldspar, which are also present as micro-veinlets. Mineralization occurs as abundant fine disseminations and in micro-veinlets and comprises of assemblages of bornite ± digenite ± covellite or chalcopyrite ± bornite ± covellite ± digenite. Pyrite is not usually present in this alteration type. It is important to note that mineralization is not associated with the grey-green sericite. This alteration is characterized by two types of veinlets: (i) continuous, cm-thick chalcopyrite veinlets (Figure 4E); (ii) “B-type” veinlets, which are cm-thick, continuous, and banded, usually without alteration halos, and composed of quartz ± molybdenite (Figure 4F).
East of the west fault (Figure 3), a late quartz-sericite (phyllic) alteration is superimposed on the previous potassic alteration. The quartz-sericite alteration comprises sericite aggregates with quartz that obliterate the original texture of the porphyry through the intensive replacement of feldspars and biotite. Higher sulfidation assemblages include pyrite ± chalcopyrite, pyrite ± digenite (±bornite), pyrite ± covellite (±enargite), pyrite ± enargite (±sphalerite), and pyrite ± Cu sulfosalts. This alteration is characterized by the presence of cm-thick “D-type” veinlets that are continuous and are composed of Cu-sulfides (chalcocite, covellite or digenite) and Cu-sulfosalt (enargite or tennantite) with pyrite as the dominant sulfide and are usually associated with quartz (Figure 4G,H). The relict intense potassic alteration is a superimposition of the quartz-sericite alteration over the intense potassic alteration and is characterized by the presence of minor grey-green sericite, micro- to crypto-crystalline quartz, and K-feldspar, which is typical of the intense potassic alteration zone, with abundant aggregates of quartz and sericite from the quartz-sericite alteration. Sulfides observed in this alteration include pyrite ± digenite, ±covellite, and ±bornite. Finally, supergene alteration is also observed at Chuquicamata Underground, and is represented by secondary chalcocite and covellite. Locally, sulfates and carbonates can be observed.
It is important to note that the relict intense potassic alteration and any other relation of superimposition (i.e., transition zones) are not considered in this study due to their possible complexity. Thus, only sulfides from clearly identified units (i.e., chloritic, background potassic, intense potassic, and quartz-sericite alteration) were studied.

4.2. Sulfide Textures and Mineral Inclusions

Figure 5 presents a paragenetic sequence for the Chuquicamata deposit. Chalcopyrite is the dominant Cu sulfide and is recognized in all four alteration zones, although it occurs predominantly within the background and intense potassic zones. Bornite is the second most important Cu sulfide within the Chuquicamata Underground mine. It occurs as anhedral grains, and it is primarily present in the intense potassic alteration zone, and to a lesser degree, in the background potassic and quartz-sericite zones. Pyrite is the main gangue sulfide and is present mostly in the chloritic and quartz-sericite alteration zones.
Texturally, chalcopyrite, bornite, and pyrite show different modes of occurrence (Figure 6A–D). Chalcopyrite occurs as anhedral to subhedral grains with variable pores and mineral micro-inclusions; it may show intergrowth and replacement textures with pyrite, bornite, and covellite, and in some cases, with chalcocite and sphalerite (Figure 6A,B). Bornite occurs as anhedral grains, showing porous textures and abundant mineral inclusions in some cases. Replacement textures are recognized between bornite and chalcopyrite, covellite, and digenite (Figure 6C). Pyrite occurs both as euhedral and pristine grains without mineral inclusions and as anhedral to subhedral grains with porous textures and abundant micro-inclusions. In addition, it can form intergrowth and replacement textures with chalcopyrite, bornite, chalcocite, covellite, Cu-sulfosalts, and molybdenite (Figure 6D).
SEM observations revealed the presence of several types of mineral inclusions within the studied sulfides (Figure 6E–H). In chalcopyrite, inclusions of sphalerite, galena, scheelite (CaWO4), and electrum were recognized, although their occurrence is generally scarce. Bornite, on the other hand, usually contains more inclusions than chalcopyrite, most frequently Au-Ag tellurides, electrum, and wittichenite (Cu3BiS3) (Figure 6F,G). In general, bornite from the intense potassic alteration contains more inclusions than bornite from the background potassic alteration. Finally, inclusions in pyrite are commonly observed and are very abundant in some cases. Among these, galena, wittichenite, scheelite, and wolframite ((Fe-Mn)WO4) were recognized (Figure 6H). In addition, Cu-sulfosalts and Au-Ag bearing inclusions were also observed in pyrite.

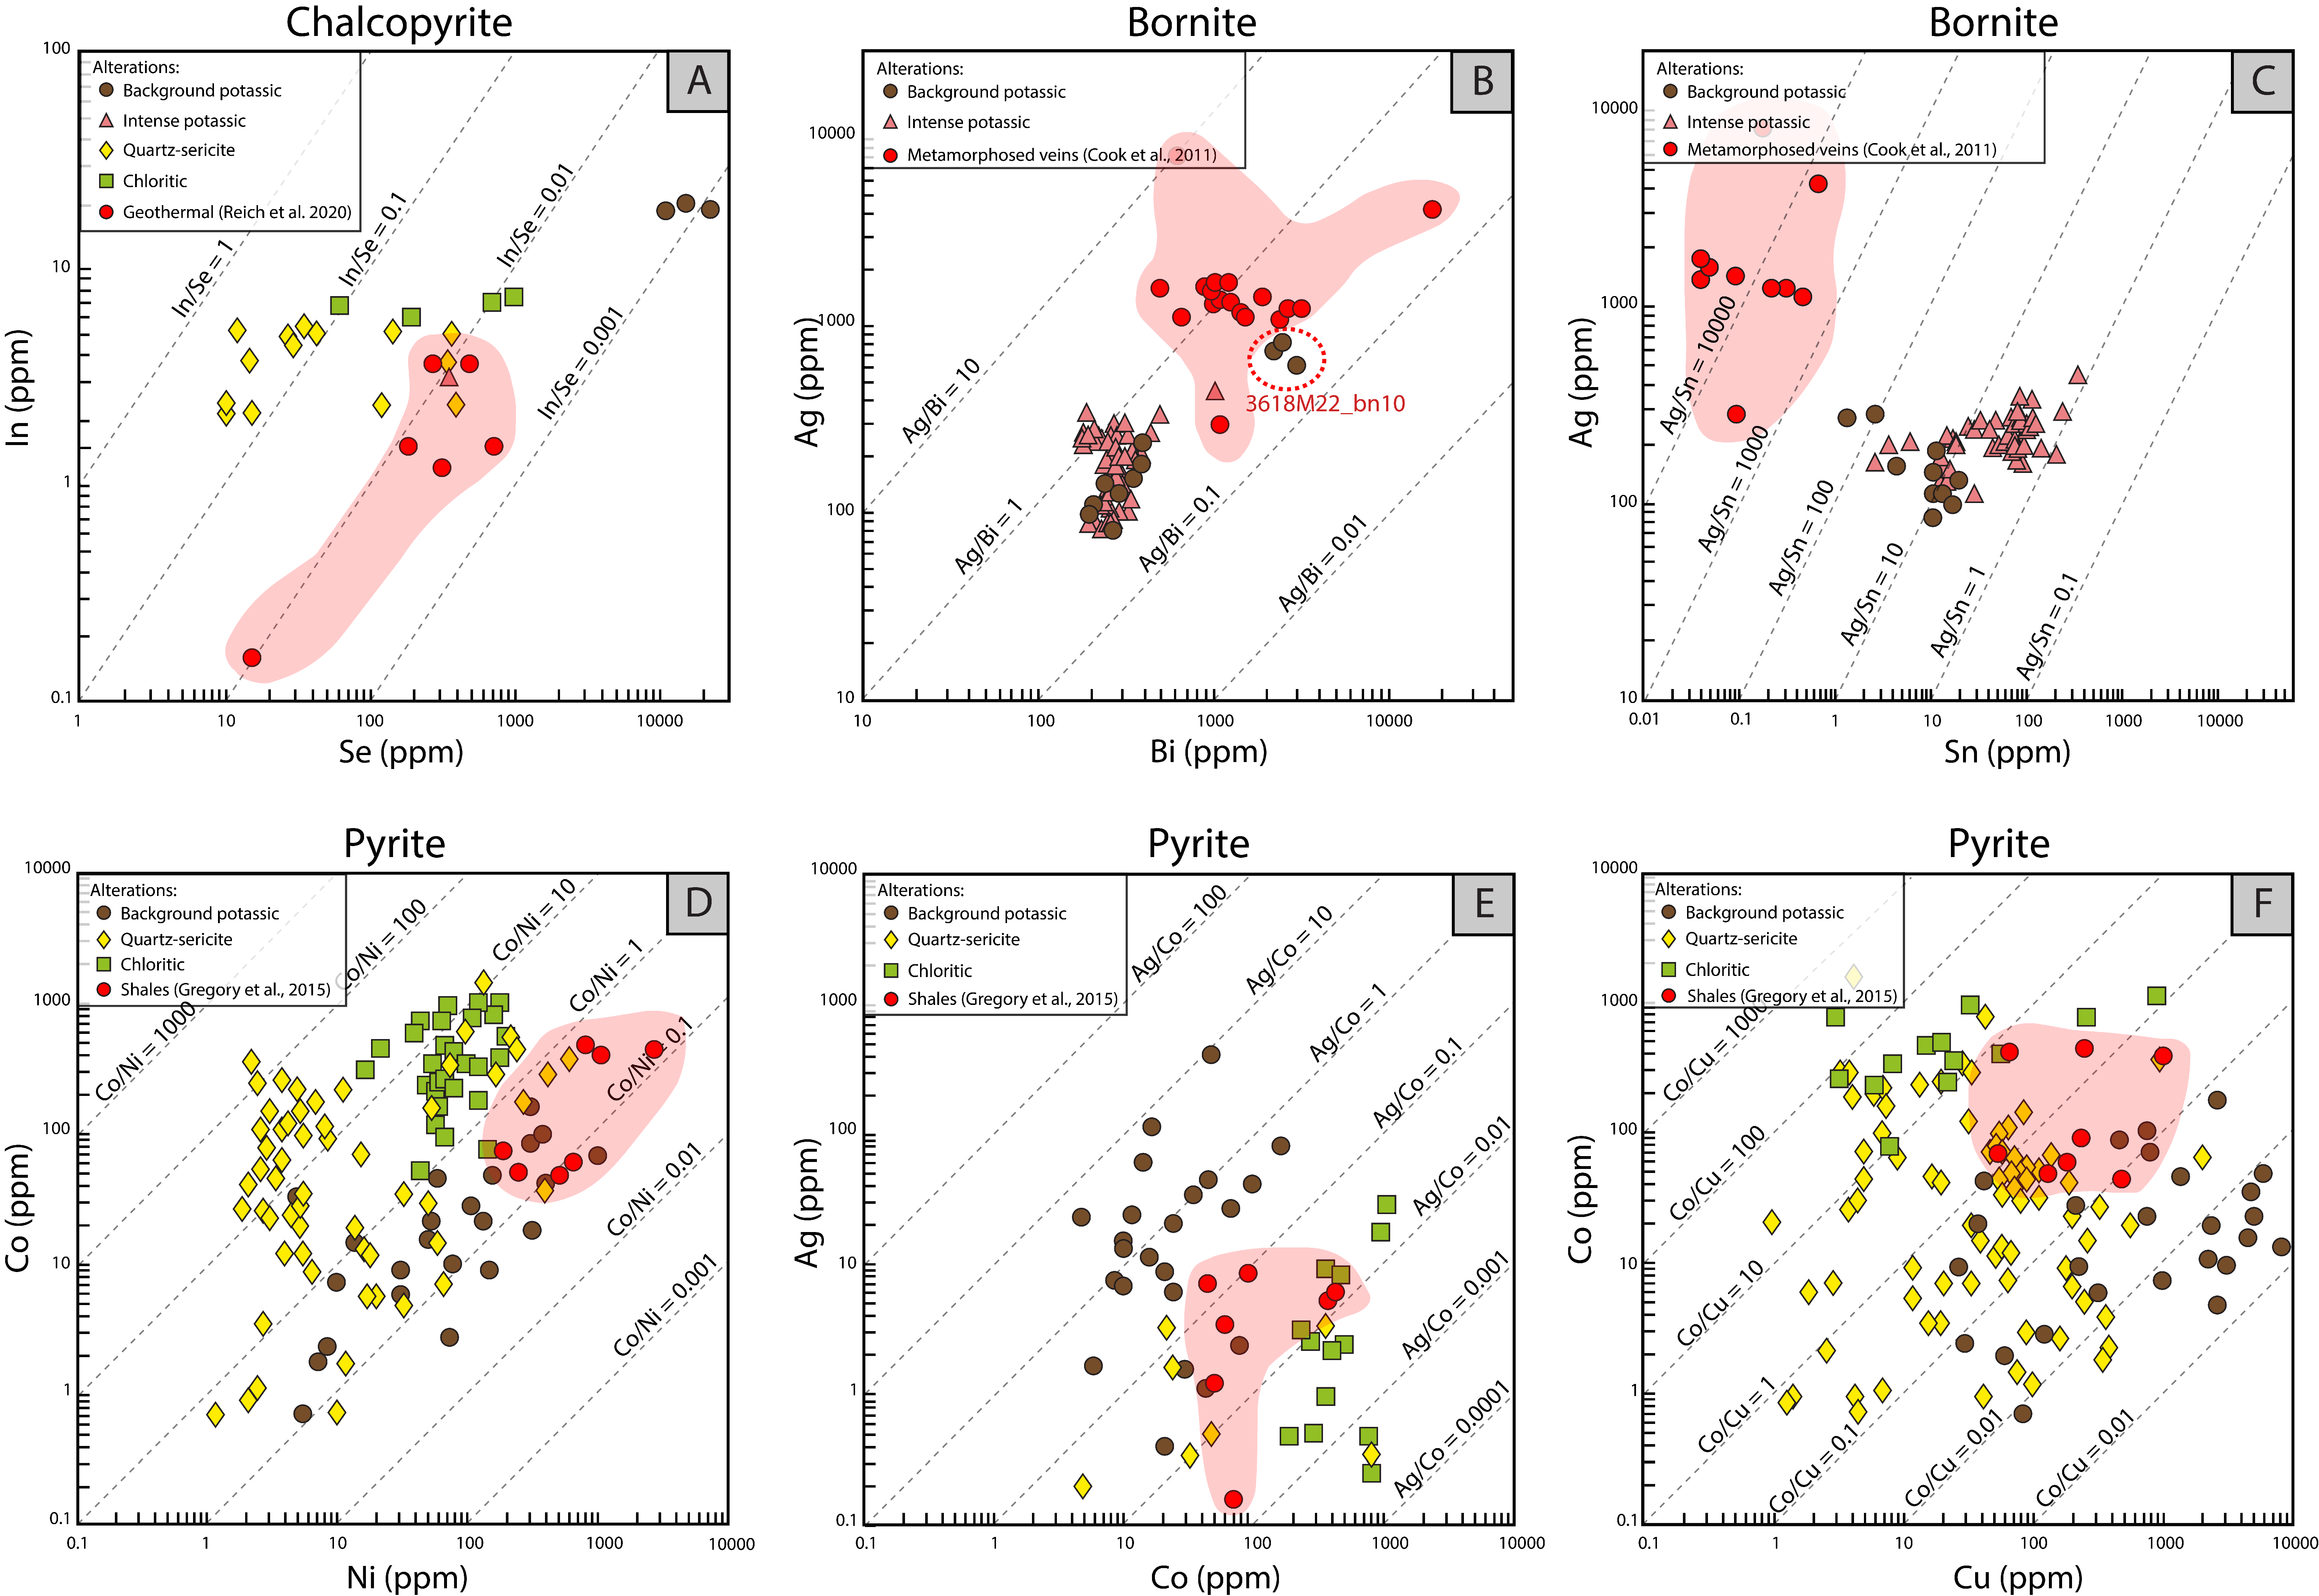
4.3. Major, Minor and Trace Elements Concentrations in Sulfide Minerals

EMPA and LA-ICP-MS data for chalcopyrite, bornite, and pyrite are reported in Tables S2 and S3. It is important to note that analyses were performed on clean mineral surfaces with no visible mineral inclusions. However, it is well documented that LA-ICP-MS spot analyses can be affected by the presence of (subsurface) micro- to nano-inclusions containing several elements (e.g., [15,57]). Therefore, all LA-ICP-MS time vs. intensity depth-concentration profiles were carefully inspected for the presence of spikes indicating mineral inclusions. Results show that no significant contribution from any inclusions is present, with the exception of a few spot analyses in pyrite (see Section 5.1).
Figure 7 displays all of the LA-ICP-MS data presented as boxplots for each sulfide, while Table 1 shows summary statistics of selected trace elements (the statistics for all of the elements are in Table S4). Most elements show a similar range of concentration in all sulfides (Figure 7A), usually below 1000 ppm. However, it is relevant to note that chalcopyrite has the highest concentrations of Se, In, and Au of all of the analyzed sulfides. Indium is systematically detected in all spots, while Se and Au are only detected in a few grains, which could be due to the presence of nano-inclusions. Bornite, on the other hand, shows the highest contents of Ag, Bi, Cd, and Sn, and all of these elements are detected in almost all spots, except for Cd. Pyrite has the highest concentrations of Co, As, Sb, and Pb in the deposit in comparison with chalcopyrite and bornite, although As and Sb are only sporadically detected.

4.3.1. Chalcopyrite

EMPA data show that major element concentrations in chalcopyrite range from 33.52 to 35.34 wt.% for Cu, 29.46 to 31.07 wt.% for Fe, and 33.69 to 35.42 wt.% for S (Table S2A). Additionally, minor elements such as Co, Zn, and Ag were detected, with concentrations of up to 0.05 wt.%, 0.36 wt.%, and 0.08 wt.%, respectively (Table S2A).
LA-ICP-MS analyses of chalcopyrite are shown in Figure 7B and presented in Table S3A (summary statistics in Table 1 and Table S4). All elements are below 100 ppm, with the exception of Se, which shows high concentrations (up to 22,000 ppm) in a few spots, with only 15% of the analyses above the detection limit. Ag and In were detected in 87.2% and 100% of the analyzed spots, with concentrations ranging from 0.82 to 45.1 ppm, and 1.08 to 22.8 ppm, respectively. Other elements detected systematically, although in minor concentrations, were Sn (≤68.2 ppm), Pb (≤83 ppm), and Bi (≤25.9 ppm), with 89.5%, 65.3%, and 67.6% of the analyses above the detection limit, respectively. All other elements in Figure 7B were detected in only a few spots, with concentrations below 5 ppm (≤3.8 ppm for W, ≤1.26 ppm for Au, ≤2.3 ppm for Hg, and ≤0.25 ppm for Tl). Usually, these elements were above detection in less than 10% of all analyses.
When the trace element dataset of chalcopyrite is inspected as a function of alteration (Figure 7B), it is observed that several elements show the highest concentrations in the background potassic alteration, e.g., Se, In, Sn, W, and Pb. Bismuth and Ag, in contrast, show similar concentrations in all four alteration zones.

4.3.2. Bornite

Major element EMPA data in bornite show concentrations ranging from 60.20 to 68.55 wt.% for Cu, 7.24 to 11.71 wt.% for Fe, and 24.63 to 26.75 wt.% for S (Table S2B). Additionally, minor elements, including Ag, Bi, and Zn, were measured, with concentrations reaching 0.53 wt.%, 0.5 wt.%, and 0.06 wt.%, respectively (Table S2B).
LA-ICP-MS analyses of bornite are reported in Table S3B, and summary statistics for selected elements are presented in Table 1 (statistics for all of the elements are in Table S4). Figure 7C shows that Bi was detected in all of the analyzed spots and has the highest concentrations of all of the elements (182–2960 ppm), followed by Ag (81–752 ppm), which was detected in 98.75% of the analyses. Other measured elements include Se (119–770 ppm), with only 10% of the data points above the detection limit; Sn (1.29–352 ppm), which was detected in 75% of the analyses; W (0.02–18.90 ppm); and Au (0.02–0.23 ppm), with less than 10% of the analyses above the detection limits. Lead (0.67–43 ppm) was detected in 73.75% of the analyses.
When plotted against alteration, LA-ICP-MS data show that bornite from the intense potassic alteration presents the highest Sn, W, and Pb concentrations, while bornite from the background potassic alteration shows the highest Bi concentrations (Figure 7C).

4.3.3. Pyrite

EMPA data for pyrite show major element concentrations from 45.70 to 47.78 wt.% for Fe and 50.21 to 53.91 wt.% for S (Table S2C). In addition, minor elements such as Co, Ni, and Cu were measured as well, with concentrations of up to 1.43 wt.%, 0.12 wt.%, and 2.35 wt.%, respectively (Table S2C). Due to its low concentrations, As could not be quantified by EMPA.
Trace element LA-ICP-MS data for pyrite are summarized in Figure 7D and reported in Table S3C, while summary statistics of key elements are shown in Table 1 (see Table S4 for summary of all elements). The data show that pyrite has a high trace element content, including Co (0.71–1530 ppm) and Cu (0.96 and 9700 ppm), with more than 80% of data points above the detection limit. Nickel (1.18 and 960 ppm) was detected in 61% of the analyses; in contrast, Mn (4.8–1080 ppm), Zn (14–1200 ppm), Sb (1.5–930 ppm), and As (4.9–1760 ppm) were detected in less than 10% of the measured points. Selenium (5–2700 ppm) was detected in 18.42% of the analyses, while Ag (0.2–450 ppm), Pb (0.15–2250 ppm), and Bi (0.05–460 ppm) were detected in 28–50% of the analyses. Other trace elements are mostly below 30 ppm, i.e., Ge (≤10.1 ppm) was detected in 46.31% of the spots, and Cd (≤4.3 ppm), In (≤0.9 ppm), Sn (≤47 ppm), Te (≤23 ppm), W (≤2.3 ppm), and Au (≤8.6 ppm) were detected in less than 10% of the analyses.
Pyrite from the chloritic alteration zone shows the highest Co concentrations (Figure 7D), and also contains elevated Ge, Se, Te, W, and Au contents, whereas pyrite from the background potassic alteration shows elevated Mn, Ni, Cu, Zn, As, Ag, In, Sn, Sb, and Pb concentrations. In the quartz-sericite alteration zone, pyrite displays intermediate concentrations of all of the elements.

5. Discussion

5.1. Incorporation of Trace Elements in Chalcopyrite, Bornite and Pyrite

Despite the importance of chalcopyrite as the most common Cu sulfide, its trace element content has been poorly investigated in porphyry-related environments. Cook et al., 2011 [12], reported that chalcopyrite is a relatively poor host for trace elements compared to bornite and chalcocite. It is also the least preferred host when co-crystallizing with sphalerite and galena [19]. However, it has been documented that chalcopyrite can host a wide range of elements, including Ag, Au, Bi, In, Cd, Zn, Co, Ni, Te, As, Sb, Cr, Se, and PGEs [20,22,23,26,27,30,35,36,37]. Additionally, several studies have demonstrated that chalcopyrite can host important concentrations of Se [20,38,64], In [12,19,20,64,65,66,67], and Sn [19,20,35]. Our chalcopyrite data from the Chuquicamata Underground mine are in agreement with results from [27], which presented a trace element dataset for chalcopyrite from the Río Blanco porphyry Cu-Mo deposit in central Chile. They reported significant Se (≤14,100 ppm) and Ag, In, and Sn concentrations of up to 12.8 ppm, 26.30 ppm, and 110 ppm, respectively, which are consistent with our values for Chuquicamata. Zn is, in general, a relevant trace element detected in chalcopyrite from most deposit types, including porphyries [20,27,35,37]. However, at Chuquicamata Underground, Zn was only detected in two of the measured samples, probably because Zn is preferentially partitioned into sphalerite and galena over chalcopyrite [20].
Figure 8A shows time-resolved down-hole profiles collected by LA-ICP-MS for chalcopyrite. Based on the relatively flat shape of the transient signal and the lack of major spikes pointing to inclusions, we infer that most trace elements are incorporated in a solid solution within the chalcopyrite structure. However, the high concentration of Se found in some spots suggests that this element might also be present as clusters of micro- or nano-inclusions of selenides. In addition, mineral inclusions of scheelite and electrum were observed in certain grains of chalcopyrite from the background potassic alteration zone (Figure 6E).
The incorporation of trace elements in the chalcopyrite structure is complex and several substitution mechanisms have been evaluated, including coupled substitutions as proposed by [68], based on synchrotron XRF and XANES data. This coupled substitution involves monovalent (Cu+, Ag+), divalent (Zn+2, Cd+2, Pb+2), trivalent (Fe+3, In+3, Sb+3), and/or tetravalent (Se+4, Sn+4, Bi+4, Ge+4) ions. Coupled substitution is also proposed as a possible mechanism to explain trace element incorporation in Ag-rich chalcopyrite from the Cerro Pabellón geothermal system in Chile [38].
After chalcopyrite, bornite is a major host of Cu in porphyry copper deposits. Although data for porphyry systems are still limited, it has been reported that bornite in these deposits is a relevant host of Ag and Bi. Cioacă et al., 2014 [30], documented that Ag and Bi in bornite from porphyry copper deposits in Romania can reach concentrations of up to 4830 and 1540 ppm, respectively. Additionally, Crespo et al. (2020) [27] reported high contents of Ag (106–1380 ppm) and Bi (3.4–5940 ppm) in the Río Blanco porphyry Cu-Mo deposit in Chile. Bornite is the second most important ore mineral at Chuquicamata Underground, and despite the fact that it incorporates only a limited range of trace elements, Ag and Bi are significantly concentrated. These two elements range from 100s to 1000s ppm, respectively (Figure 7C and Table S3B), making bornite the major host of Ag and Bi among all of the analyzed sulfides (Figure 7A).
Ag and Bi incorporation into bornite is most likely in solid solution, based on the relatively flat signal in time-resolved down-hole profiles collected by LA-ICP-MS (Figure 8B). Experimental studies in bornite have demonstrated that it can host significant concentrations of Bi, as much as 17 wt.% at 420 °C [69,70], supporting a mechanism of solid solution incorporation. On the other hand, there is limited information about the solubility of Ag in sulfides [12]. Therefore, even though some mineral inclusions of electrum, wittichenite, and Au-Ag tellurides were detected in bornite during SEM observation (Figure 6F,G), it is expected that Ag and Bi are dominantly incorporated as structurally bound elements in bornite via coupled substitution [12].
Pyrite has been traditionally selected for geochemical studies in several ore-forming environments due to its ability to incorporate a large number of trace elements, including Au, As, Cu, Co, Ni, Pd, Pt, Se, and Te [14,23,24,27,28,29,30,32,33,71]. At Chuquicamata Underground, the measured concentrations of Co, Ni, Cu, Zn, As, Se, Pb, Bi, and Ag in pyrite were above 100 ppm (Figure 7A,D). Among these, Co and Ni are the most relevant, spanning three orders of magnitude, ranging from ~1 to ~1000 ppm. Copper contents are significantly higher, reaching up to ~10,000 ppm. It is likely that some of these higher Cu concentrations in pyrite are related to the presence of Cu-bearing nano-inclusions and/or contamination from neighboring/concealed grains of chalcopyrite and bornite. However, our data show that pyrite in Chuquicamata may contain significant Cu in solid solution (as suggested by [29]), considering that more than 80% of the analyses were above detection.
The 59Co signal in time-resolved down-hole profiles collected by LA-ICP-MS, (Figure 8C), strongly suggests that Co is dominantly present as a structurally bound element within pyrite. However, the presence of Co-bearing inclusions was inferred based on a few spiky spectra (Figure 8D). It is likely that Co dominantly substitutes for Fe within the pyrite structure due to the similar ionic radii and structural affinity between FeS2 and CoS2 end-members [15,16,72,73,74]. Similarly, the 60Ni signals (Figure 8C,D) also point to a solid solution incorporation mechanism for this element. In contrast, high Cu and Pb contents are most likely related to the presence of Cu- and Pb-bearing inclusions, respectively, as evidenced by spiky LA-ICP-MS profiles (Figure 8D).

5.2. Geochemical Signature of Cu-(Fe) Sulfides as a Function of Alteration

Geochemical data from the different sulfide species allows for investigation of the trace element signature of the studied sulfides with respect to hydrothermal alteration. At the Chuquicamata Underground mine, four main hydrothermal alterations and Cu-(Fe) sulfide mineralization events were identified, i.e., background potassic, intense potassic, chloritic, and quartz-sericite (see Section 4.1). The earliest event was associated with a high temperature magmatic-hydrothermal fluid that generated the background potassic alteration with chalcopyrite and minor bornite and pyrite. Based on mineralogical associations, this event occurred at temperatures of ~600–450 °C and under neutral to alkaline conditions (i.e., [49,75,76,77,78]). This same (early) fluid generated a distal chloritic halo as it cooled down, probably due to mixing with meteoric water. The resulting chloritic alteration is characterized by the presence of pyrite and lesser chalcopyrite (bornite in this alteration is absent). Mineral assemblages indicate formation under a low temperature (~250–200 °C) and neutral to alkaline conditions (similar to background potassic alteration), which is typically reported for this alteration type in porphyry copper deposits (i.e., [40,75,76,77,79,80,81]). The main Cu mineralization event was related to an intense potassic alteration that is dominated by abundant bornite and chalcopyrite and minor Cu-sulfides, i.e., digenite and covellite. This event was generated at an intermediate temperature, i.e., ~400 °C and under neutral to alkaline conditions (i.e., [49,75,79,82,83]). On the other hand, the quartz-sericite alteration was associated with a low temperature (250–300 °C) and more acidic fluid (pH ~5–6) (e.g., [49,75,78,80,81]). This alteration event comprises pyrite, minor chalcopyrite, Cu sulfides and sulfosalts, and scant bornite.
The trace element signature of chalcopyrite, bornite, and pyrite as a function of alteration type is discussed below based on key variations observed in elemental biplots (Figure 9). Figure 9A shows that higher concentrations of Se and In in chalcopyrite are related to the background potassic alteration, while lower concentrations of these two elements are associated with the quartz-sericite alteration. Chalcopyrite from the chloritic alteration shows intermediate Se and In concentrations. As seen in Figure 9A, In/Se ratios in chalcopyrite vary from ~1.0–0.01 for the chloritic and quartz-sericite zones (including one data point for the intense potassic alteration at 0.01), while lower In/Se ratios (~0.001) are characteristic of chalcopyrite from the background potassic alteration. Although no experimental data are available for Se and In partitioning into chalcopyrite, data in Figure 9A are in agreement with several studies documenting that the incorporation of Se and In into sulfide minerals is favored by high formation temperatures [84,85,86,87]. However, the low-temperature chloritic alteration also has a relatively high Se concentration when compared to the intense potassic (one data point) and quartz-sericite alteration. This feature indicates that temperature is not the only factor controlling Se incorporation into chalcopyrite, and thus variability must be examined with caution. Studies in other sulfide minerals (e.g., pyrite) have proposed that the incorporation of Se in pyrite varies as a function of redox and pH conditions [88,89], although [90] compared all these variables for various deposits and concluded that the main factor that controls Se incorporation is fluid temperature. For the case of In, complexation studies indicate that in Cl-rich systems, cooling can be an effective mechanism for complex destabilization [91]. Moreover, it is reported that a decrease in temperature would have a strong impact on the solubility of In, and thus mixing with meteoric waters would be an effective mechanism for In enrichment [86]. At the Chuquicamata Underground mine, In concentrations are also important in the low-temperature chloritic zone, suggesting that cooling and mixing may have impacted the stability of In-Cl complexes, enhancing In incorporation into chalcopyrite. Therefore, it is likely that temperature is the dominant control on Se and In concentrations in chalcopyrite, although other potential factors, including pH and redox changes and the presence of co-crystallizing phases, may also play a role [12,19,20,64,67,85]. Thus, the variability of Se concentrations in chalcopyrite between alteration types, as recognized here, may point to changes in the physicochemical properties of the fluid.
Ag vs. Bi data are plotted for bornite from the background potassic and intense potassic alteration zones (Figure 9B). An almost vertical cluster of Ag-Bi values is observed, spanning Ag/Bi ratios of 0.5–3. Crespo et al., 2020 [27] reported a positive correlation between Ag and Bi at the Río Blanco porphyry Cu deposit in Chile and noted that the Ag concentrations in bornite increased with cooling. Those authors interpreted that the increase in Ag/Bi ratios was likely due to variations in temperature related to the alteration type. However, and as noted above, we did not observe a correlation between alteration type and Ag/Bi ratios (Figure 9B). We explain this feature as the result of co-crystallization partitioning controls on Ag and Bi attributable to coexisting minerals that are associated with bornite at Chuquicamata Underground, i.e., chalcocite, covellite, and wittichenite (Figure 6C). Cook et al., 2011 [12], proposed that when bornite and Cu-sulfides (chalcocite/digenite) coexist, Ag is preferentially concentrated into chalcocite/digenite, whereas Bi concentrations in coexisting Cu-sulfides are notably lower than bornite. The behavior of these two elements can be further analyzed in Figure 9B, where most data points are associated with bornite coexisting with chalcocite/digenite/covellite assemblages. In contrast, the outlier bornite sample 3618M22_bn10 is not associated with chalcocite/digenite/covellite. Therefore, we suggest that the high concentration of Ag and Bi in the aforementioned sample is directly related to the absence of co-crystallizing Cu-sulfides. These results are in good agreement with those reported by [12], which also noted that in the absence of Cu-sulfides, bornite showed a higher concentration of Ag and Bi. Therefore, we conclude that the Ag-Bi relation in bornite at Chuquicamata Underground is more likely controlled by the presence of coexisting Cu-S phases rather than temperature.
Figure 9C shows a positive trend between Ag and Sn in bornite. Higher concentrations of Ag and Sn are related to the intense potassic alteration, while lower concentrations are associated with the background potassic alteration. Specifically, bornite from the background potassic alteration is characterized by Ag/Sn ratios between ~100 and 10, while the Ag/Sn ratio in bornite from the intense potassic alteration vary significantly from ~100 down to ~1. It is well documented that the solubility of Ag is a function of temperature, pH, fH2S, and salinity [92]. On the other hand, previous studies have reported that the solubility of cassiterite in HCl-bearing water vapor and granitic melts decreases with decreasing temperature, salinity, and fO2 (i.e., [93,94]). Even though no experimental data are available to precisely assess the physicochemical controls on Ag and Sn partitioning into bornite, it is possible that lower temperatures (and lower fO2 conditions?) may have favored the incorporation of Ag and Sn in bornite during the intense potassic alteration stage. Furthermore, and considering that both the Ag and Sn content are closely related to Cu grades in hydrothermal ore deposits [64,92,95], we argue that higher concentrations of Ag and Sn in bornite in the intense potassic alteration may also be related to the higher Cu precipitation during this stage when compared to the background potassic alteration event.
Cobalt vs. Ni data of pyrite from the background potassic, chloritic, and quartz-sericite alteration are displayed in Figure 9D. In general, Co/Ni ratios range between ~0.1 and ~100. It is important to note that all pyrite data from the background potassic alteration zone plot below Co/Ni = 1, whereas Co and Ni data of pyrite from the chloritic alteration are concentrated in the upper part of the diagram at higher Co contents (Co/Ni ~1–10). Co-Ni data for pyrite from the quartz-sericite alteration are more scattered, although most data points plot above the 1:1 line, with maximum Co/Ni ratios at ~100. Previous studies have reported that Co in hydrothermal solutions is transported as Cl- complexes, which are more susceptible to physicochemical changes [96,97]. In particular, these studies have identified that cooling may have an important effect on the destabilization of Co-Cl complexes, i.e., a decrease in temperature from 300 °C to 25 °C may generate a drop in Co solubility from 142 ppm to 5 ppm [97]. This is consistent with the higher concentration of Co in pyrite from the low temperature chloritic alteration (Figure 9D). In addition, it has been reported that an increase in pH and a decrease in ƒO2 could also trigger the destabilization of Co-Cl complexes [97,98]. Although these effects need to be further evaluated in future studies, it is likely that the pH changes were less important to the behavior of Co at Chuquicamata due to the fact that background potassic and chloritic alteration formed under similar pH conditions (neutral to slightly alkaline) but have the lowest and highest Co concentrations in pyrite, respectively (Figure 9D). On the other hand, a decrease in Cl concentration could have considerably impacted the concentration of Co in the chloritic alteration zone as a result of fluid dilution caused by mixing with meteoric waters.
Ni is expected to behave similarly to Co, considering that a decrease in temperature, Cl, and fO2 and an increase in pH can lead to a lower Ni solubility [99,100]. However, Co is more mobile than Ni in hydrothermal fluids [98]. Therefore, considering that Ni concentrations in pyrite at Chuquicamata are widely distributed in all alteration types (Figure 9D), a more complex combination of physicochemical factors may have generated the observed distribution of Co and Ni in pyrite.
The cobalt concentration in pyrite from each alteration type is plotted with respect to Ag (Figure 9E) and Cu (Figure 9F). In these diagrams, distinct clusters can be observed for pyrite from the different alteration types. For example, higher Ag and Cu concentrations in pyrite are related to high temperature alteration (e.g., background potassic), while higher Co contents are associated with chloritic alteration. Pyrite Ag/Co ratios in the background potassic alteration vary between ~0.01 and 10, while pyrite from the chloritic alteration shows a Ag/Co ratio <0.1. On the other hand, Co/Cu ratios are higher in the pyrite from the chloritic alteration (>1) and lower (<1) in the background potassic event. These observations are consistent with the microanalytical data of pyrite reported for Río Blanco, showing that Ag and Cu are generally higher in the high temperature alteration assemblages [27]. In hydrothermal systems, Ag and Cu are transported as chloride complexes [92,101,102,103,104]. The solubility of Ag and Cu in aqueous solutions is a function of temperature, pH, fH2S, and salinity. Hence, complex destabilization is caused by chloride removal (or dilution), fluid neutralization, an increase in fO2, or a decrease in temperature of the fluid. At Chuquicamata Underground, the highest concentrations of Ag and Cu in pyrite are detected in the background potassic alteration (Figure 9E,F), which was generated at temperatures between 450 and 600 °C. This temperature range is consistent with changes in the solubility of Ag and Cu in fluids, which may have affected the stability of the metal complex, and consequently, a more efficient incorporation into pyrite. The estimated temperatures for the chloritic and quartz-sericite alterations are around 200–250 °C and 250–300 °C, respectively, which may explain the similar Ag and Cu concentrations in pyrite in both alteration types (Figure 7D). However, more data are needed to better constrain the key parameters that control Ag and Cu incorporation in pyrite.
Additionally, in Figure 9, we have compared our trace element data with previously published results for pyrite, chalcopyrite, and bornite from non-porphyry, unmineralized, and distal systems [12,15,38]. Our data show some distinct differences. For chalcopyrite within the chloritic alteration at Chuquicamata, it is possible to observe slightly higher concentrations than chalcopyrite from unmineralized (distal) systems (e.g., geothermal, [38]), while Se concentration are similar (Figure 9A). For bornite, the differences are considerable, with Ag and Bi concentrations in metamorphosed veins [12] being higher than bornite at Chuquicamata (Figure 9B) and Sn concentrations being significantly lower (1–2 orders of magnitude) (Figure 9C). Finally, pyrite at Chuquicamata shows some distinct differences when compared to pyrite in unmineralized rocks (e.g., shales, [15]). Even though the elemental concentrations are broadly similar, the Co/Ni ratios of pyrite from the chloritic and quartz-sericitic alterations are higher (Figure 9D), and Ag/Co ratios of pyrite from the background potassic alteration are distinctly higher (Figure 9E). We stress that this is a broad and first-order comparison, and more comprehensive studies are needed to fully evaluate the geochemical footprints of mineralized porphyries versus un-mineralized systems.

5.3. Implications for Sulfide Chemistrys as Vectors towards Cu Mineralization

Several studies have proposed that sulfide geochemistry can be used as a tool to vector towards ore mineralization. Most recent examples are limited to pyrite in sedimentary exhalative (SEDEX) deposits [105], volcanogenic hosted massive sulfide (VHMS) deposits [66,106], epithermal Au [57,107,108], or transitional epithermal-porphyry deposits [33,35]. Furthermore, [109] presented a statistical methodology to distinguish barren sedimentary pyrite from ore deposit pyrites, including SEDEX, VHMS, iron oxide-copper-gold (IOCG), orogenic Au, and porphyry Cu systems. Besides pyrite, Cook et al., 2011 [12], suggested that Se concentrations in Cu-Fe sulfides, such as bornite, could be used as a vector in exploration, indicating the possibility to track fluid sources in magmatic-hydrothermal deposits. Despite the fact that pyrite and chalcopyrite are ubiquitous in porphyry Cu deposits and that both sulfides are present in distal propylitic alteration halos, their potential as exploratory tools have not been fully investigated, mainly because few studies have systematically reported geochemical data that can be correlated, in both time and space, with hydrothermal alteration types. Our data from the wt.% provide a unique opportunity to further evaluate the potential of Cu-(Fe) sulfides to explore for concealed porphyry Cu deposits or vector towards ore zones as a complementary tool to porphyry indicator minerals such as zircon, apatite, magnetite, and epidote/chlorite [110,111,112,113,114].
Based on our results, the use of Se and In concentrations may bear potential to discriminate chalcopyrite formed at high vs. low temperature conditions. Our data show that distinct variations in the chalcopyrite Se/In ratio are a function of temperature and by inference alteration type. Figure 10A shows that lower Se/In ratios are related to the chloritic and quartz-sericite alterations, while higher Se/In ratios are characteristic of the background potassic alteration (intense potassic alteration is only represented by one data point). On average and as a first approximation, the chalcopyrite Se/In ratio varies from ca. 30 to >300 in the low temperature alterations (quartz-sericite and chloritic) to the high temperature background potassic alteration, indicating an increase of almost two orders of magnitude. Despite the fact that only three Se data points are available for chalcopyrite in the background potassic alteration, this element is commonly detected in chalcopyrite in other deposits. As mentioned in the previous section, Se concentration in chalcopyrite seems to be strongly dependent on temperature. In Figure 10B, we further explored this trend by plotting the Se and In data for chalcopyrite reported by Crespo et al., 2020 [27], for the Río Blanco porphyry Cu-Mo deposit. In fact, Figure 10B shows that higher Se/In ratios are related to the background potassic alteration (higher temperature), while lower Se/In ratios are characteristic of the quartz-sericite alteration (lower temperature). It is possible to see that, on average, the Se/In ratios of chalcopyrite in the Río Blanco porphyry varies from ca. 10 to >500, which is similar to and consistent with our Se/In chalcopyrite data from Chuquicamata. However, we note that this trend should be corroborated in future studies and completed with more data from other porphyry Cu deposits.
Due to its ubiquity and widespread occurrence, pyrite is perhaps the most promising sulfide for geochemical vectoring. At Chuquicamata Underground, Ag/Co and Co/Cu ratios are proposed here based on the fact that they show opposite trends. As discussed in the previous section, higher Ag/Co ratios characterize pyrite from the background potassic alteration, whereas lower ratios are observed in the chloritic alteration (Figure 9E). Co/Cu ratios, in contrast, are higher in the chloritic alteration and lower in the background potassic alteration (Figure 9F). The Ag/Co vs. Co/Cu plot in Figure 10C shows a well-defined array, where the Ag/Co ratios span four orders of magnitude increasing from ~0.001 to 10 from the chloritic to background potassic alteration, while the Co/Cu ratios decrease from ~100 to 0.001 from the chloritic to background potassic alteration, spanning five orders of magnitude. Intermediate ratios are identified in pyrite from the quartz-sericite alteration (Ag/Co~0.01–0.2; Co/Cu~0.01–1). Hence, we propose that the Ag/Co and Co/Cu ratios in pyrite could be used as a potential tool to discriminate between the low temperature distal zones of porphyry Cu deposits and the high temperature central core.

6. Concluding Remarks

The data presented in this study allow for constraining the trace element signature of Cu-(Fe) sulfides at the Chuquicamata Underground mine and evaluate their geochemical variability as a function of hydrothermal alteration. Microanalyses of chalcopyrite, bornite, and pyrite show that these sulfides contain several trace elements that are dominantly present in solid solution, although micro-particulate occurrences were also observed. Most of the elements detected show a similar range of concentration in the studied sulfides (usually <1000 ppm), albeit wt.% levels of certain elements were found in some cases. Chalcopyrite, the main Cu ore phase, hosts relevant (albeit sporadically detected) concentrations of Se and important contents of In, Ag, Sn, and Pb, whereas bornite is a significant carrier of Ag, Bi, Pb, and Sn. In comparison, pyrite contains the largest diversity of trace elements, with relevant concentrations of Co, Ni, and generally low but occasionally elevated As, Sb, and Pb and hosting also high concentrations of Cu, among other elements.
Cu-(Fe) sulfides at Chuquicamata show distinct geochemical signatures that are characteristic of each hydrothermal alteration type within this porphyry deposit. For example, high concentrations of Se and In in chalcopyrite are related to the high temperature background potassic alteration, and lower concentrations of these two elements are associated with the lower temperature quartz-sericite and chloritic alteration zones. Selected variations in trace element concentration were also reported for bornite, with higher contents of Ag and Sn related to the intense potassic alteration and lower concentrations in the background potassic alteration. Pyrite shows the most notable variation in trace element concentration at Chuquicamata, with Co, Ag, and Cu indicating distinct relations with alteration type. Higher Co concentrations occur in pyrite from the low temperature alteration (chloritic), while higher Ag and Cu contents are associated with high temperature background potassic alteration. Based on these characteristics, the Se/In ratio in chalcopyrite and, most importantly, the Ag/Co vs. Co/Cu plot for pyrite are proposed to discriminate between the high temperature central core of porphyry Cu-Mo systems and the low temperature distal zones.
It is important to highlight that physicochemical conditions and co-crystallizing phases (in Cu-sulfides in particular, such as chalcocite, digenite, and covellite), play a pivotal role in controlling trace element distribution in the studied Cu-(Fe) sulfides. Factors such as the temperature, pH, fO2, fH2S, and salinity of the hydrothermal fluid are the most critical parameters in controlling the partitioning of trace elements in different sulfide phases. Further studies are needed to experimentally constrain the speciation and mineralogical siting of trace elements in chalcopyrite, bornite, and pyrite and to assess the solubility limits for trace elements under temperature, pressure, and oxygen/sulfur fugacity relevant to porphyry systems. Such studies should also assess the potential crystallographic controls on elemental partitioning in sulfides and the role of co-crystallizing phases, which remain largely unconstrained for most elements.
We stress that the reported trace element variations provide an opportunity to further explore the potential use of sulfide geochemistry in vectoring studies. However, we note that the use of elemental ratios in sulfides as vectors towards ore zones must follow a careful characterization of the ore and gangue minerals and a comprehensive statistical data analysis. Among many other factors, multiple mineralization pulses and the superposition of hydrothermal events can dramatically change the distribution of trace elements within the sulfides. Furthermore, the concentration and distribution of trace elements in sulfides will depend on different factors, including the metal concentration in the hydrothermal fluid, the salinity, pH, and the presence of complexing agents [115,116]. Therefore, more data from other porphyry Cu deposits are required to compare results and test the use of the proposed ratios. Despite these inherent limitations, we conclude that geochemical vectoring methods using sulfides, particularly pyrite, hold a promising potential as complementary exploration tools in porphyry Cu-Mo systems.

Supplementary Materials

The following are available online at https://www.mdpi.com/article/10.3390/min11070671/s1, Table S1: GSE-1G standard analyses (ppm) from Chuquicamata Underground deposit, Table S2A: EMPA analyses (wt.%) of pyrite from Chuquicamata Underground deposit, Table S2B: EMPA analyses (wt.%) of chalcopyrite from Chuquicamata Underground deposit, Table S2C: EMPA analyses (wt.%) of bornite from Chuquicamata Underground deposit, Table S3A: LA-ICP-MS analyses (ppm) of chalcopyrite from Chuquicamata Underground deposit, Table S3B: LA-ICP-MS analyses (ppm) of bornite from Chuquicamata Underground deposit, Table S3C: LA-ICP-MS analyses (ppm) of pyrite from Chuquicamata Underground deposit, Table S4: LA-ICP-MS sulfide statistics from Chuquicamata Underground deposit.

Author Contributions

C.R.-R. collected the samples, performed the SEM, EMPA and LA-ICP-MS analyses, and reduced the data. All authors (C.R.-R., M.R., F.B., D.G. and S.P.) discussed the results and evaluated the data. C.R.-R., M.R. and F.B. wrote and organized the paper. S.P. provided geological information and granted access to the mine and drillcores. All authors have read and agreed to the published version of the manuscript.

Funding

This study was funded by ANID through the Millennium Science Initiative Program (NCN13_065). Additional support was provided by FONDAP project15090013 “Centro de Excelencia en Geotermia de Los Andes, CEGA”. The LA-ICP-MS analytical work was funded by CONICYT-FONDEQUIP instrumentation grant EQM120098.

Acknowledgments

We thank Yanan Liu at the University of Toronto and Rurik Romero at Universidad de Chile for their help with the electron microprobe and LA-ICP-MS analyses, respectively. Fernando Ramírez at CODELCO-Chuquicamata is acknowledged for his help during core sampling. We thank CODELCO-Gerencia de Exploraciones and CODELCO-Chuquicamata for providing data and access to the deposit and drill core mapping data. Constanza Rivas Romero is thankful for the financial support from a M.Sc. scholarship from Iniciativa Científica Milenio. We thank Liqiang Yang and two anonymous referees for their comments and suggestions, which helped improve the final version of the manuscript.

Conflicts of Interest

The authors declare no conflict of interest.

References

  1. John, D.A.; Taylor, R.D. By-products of porphyry copper and molybdenum deposits. Rev. Econ. Geol. 2016, 18, 137–164. [Google Scholar]
  2. Cook, N.J.; Ciobanu, C.L.; George, L.L.; Zhu, Z.Y.; Wade, B.; Ehrig, K. Trace element analysis of minerals in magmatic-hydrothermal ores by laser ablation inductively-coupled plasma mass spectrometry: Approaches and opportunities. Minerals 2016, 6, 111. [Google Scholar] [CrossRef] [Green Version]
  3. Fontboté, L.; Kouzmanov, K.; Chiaradia, M.; Pokrovski, G.S. Sulfide minerals in hydrothermal deposits. Elements 2017, 13, 97–103. [Google Scholar] [CrossRef]
  4. Reich, M.; Large, R.; Deditius, A. New advances in trace element geochemistry of ore minerals and accessory phases. Ore Geol. Rev. 2017, 87, 1215–1217. [Google Scholar] [CrossRef]
  5. Large, D.J.; Sawlowocz, Z.; Spratt, J. A cobaltite-framboidal pyrite association from the Kupferschiefer; possible implications for trace element behaviour during the earliest stages of diagenesis. Mineral. Mag. 1999, 63, 353–361. [Google Scholar] [CrossRef]
  6. Pals, D.; Spry, P.; Chryssoulis, S. Invisible Gold and Tellurium in Arsenic-Rich Pyrite from the Emperor Gold Deposit, Fiji: Implications for Gold Distribution and Deposition. Econ. Geol. 2003, 98, 479–493. [Google Scholar] [CrossRef]
  7. Vaughan, J.P.; Kyin, A. Refractory gold ores in Archean greenstones, Western Australia: Mineralogy, gold paragenesis, metallurgical characterization and classification. Mineral. Mag. 2004, 68, 255–277. [Google Scholar] [CrossRef]
  8. Palenik, C.S.; Utsunomiya, S.; Reich, M.; Kesler, S.E.; Ewing, R.C. “Invisible” gold revealed: Direct imaging of gold nanoparticles in a Carlin-type deposit. Am. Miner. 2004, 89, 1359–1366. [Google Scholar] [CrossRef]
  9. Reich, M.; Kesler, S.E.; Utsunomiya, S.; Palenik, C.S.; Chryssoulis, S.; Erwing, R.C. Solubility of gold in arsenian pyrite. Geochim. Cosmochim. Acta 2005, 69, 2781–2796. [Google Scholar] [CrossRef]
  10. Barker, S.L.L.; Hickey, K.A.; Cline, J.S.; Dipple, G.M.; Kilburn, M.R.; Vaughan, J.R.; Anthony Longo, A.A. Uncloaking invisible gold: Use of NanoSIMS to evaluate gold, trace elements, and sulfur isotopes in pyrite from Carlin-type gold deposits. Econ. Geol. 2009, 104, 897–904. [Google Scholar] [CrossRef]
  11. Large, R.R.; Danyushevsky, L.V.; Hollit, C.; Maslennikov, V.; Meffre, S.; Gilbert, S.E.; Bull, S.; Scott, R.J.; Emsbo, P.; Thomas, H.; et al. Gold and trace element zonation in pyrite using a laser imaging technique: Implications for the timing of gold in orogenic and Carlin-style sediment-hosted deposits. Econ. Geol. 2009, 104, 635–668. [Google Scholar] [CrossRef]
  12. Cook, N.J.; Ciobanu, C.L.; Danyushevsky, L.V.; Gilbert, S. Minor and trace elements in bornite and associated Cu-(Fe) sulfides: A LA-ICP-MS study. Geochim. Cosmochim. Acta 2011, 75, 6473–6496. [Google Scholar] [CrossRef]
  13. Godel, B.M.; Barnes, S.J.; Barnes, S.J. Deposition mechanisms of magmatic sulphide liquids: Evidence from high-resolution X-ray computed tomography and trace element chemistry of komatiite-hosted disseminated sulphides. J. Petrol. 2013, 54, 1455–1486. [Google Scholar] [CrossRef] [Green Version]
  14. Deditius, A.; Reich, M.; Kesler, S.E.; Utsunomiya, S.; Chryssoulis, S.; Walshe, J.L.; Hough, R.; Ewing, R.C. The coupled geochemistry of Au and As in pyrite from hydrothermal ore deposits. Geochim. Cosmochim. Acta 2014, 140, 644–670. [Google Scholar] [CrossRef] [Green Version]
  15. Gregory, D.D.; Large, R.R.; Halpin, J.A.; Baturina, E.L.; Lyons, T.W.; Wu, S.; Dantushevsky, L.; Sack, P.L.; Chappaz, A.; Maslennikov, V.V.; et al. Trace element content of sedimentary pyrite in black shales. Econ. Geol. 2015, 110, 1389–1410. [Google Scholar] [CrossRef]
  16. Gregory, D.D.; Large, R.R.; Halpin, J.A.; Steadman, J.A.; Hickman, A.H.; Ireland, T.R.; Holden, P. The chemical conditions of the late Archean Hamersley basin inferred from whole rock and pyrite geochemistry with Δ33S and δ34S isotope analyses. Geochim. Cosmochim. Acta 2015, 149, 223–250. [Google Scholar] [CrossRef]
  17. Gregory, D.D.; Large, R.R.; Bath, A.B.; Steadman, J.A.; Wu, S.; Danyushevsky, L.; Bull, S.W.; Holden, P.; Ireland, T.R. Trace Element Content of Pyrite from the Kapai Slate, St. Ives Gold District, Western Australia. Econ. Geol. 2016, 111, 1297–1320. [Google Scholar] [CrossRef]
  18. Wohlgemuth-Ueberwasser, C.C.; Viljoen, F.; Petersen, S.; Vorster, C. Distribution and solubility limits of trace elements in hydrothermal black smoker sulfides: An in-situ LA-ICP-MS study. Geochim. Cosmochim. Acta 2015, 159, 16–41. [Google Scholar] [CrossRef]
  19. George, L.L.; Cook, N.J.; Ciobanu, C.L. Partitioning of trace elements in co-crystallized sphalerite-galena-chalcopyrite hydrothermal ores. Ore Geol. Rev. 2016, 77, 97–116. [Google Scholar] [CrossRef]
  20. George, L.L.; Cook, N.J.; Crowe, B.B.P.; Ciobanu, C.L. Trace elements in hydrothermal chalcopyrite. Mineral. Mag. 2018, 82, 59–88. [Google Scholar] [CrossRef]
  21. Kusebauch, C.; Gleeson, S.A.; Oelze, M. Coupled partitioning of Au and As into pyrite controls formation of giant Au deposits. Sci. Adv. 2019, 5, eaav5891. [Google Scholar] [CrossRef] [PubMed] [Green Version]
  22. Kesler, S.E.; Chryssoulis, S.L.; Simon, G. Gold in porphyry copper deposits: Its abundance and fate. Ore Geol. Rev. 2002, 21, 103–124. [Google Scholar] [CrossRef]
  23. Arif, J.; Baker, T. Gold paragenesis and chemistry at Batu Hijau, Indonesia: Implications for gold-rich porphyry copper deposits. Min. Depos. 2004, 39, 523–535. [Google Scholar] [CrossRef]
  24. Pašava, J.; Vymazalova, A.; Kosler, J.; Koneev, R.; Jukov, A.V.; Khalmatov, R.A. Platinum-group elements in ores from the Kalmakyr porphyry Cu-Au-Mo deposit, Uzbekistan: Bulk geochemical and laser ablation ICP-MS data. Miner. Depos. 2010, 45, 411–418. [Google Scholar] [CrossRef]
  25. McFall, K.A.; Naden, J.; Roberts, S.; Baker, T.; Spratt, J.; McDonald, I. Platinum-group minerals in the Skouries Cu-Au (Pd, Pt, Te) porphyry deposit. Ore Geol. Rev. 2018, 99, 344–364. [Google Scholar] [CrossRef]
  26. Crespo, J.; Reich, M.; Barra, F.; Verdugo, J.J.; Martínez, C. Critical metal particles in ore sulfides from the Río Blanco porphyry Cu-Mo deposit, Chile. Minerals 2018, 8, 519. [Google Scholar] [CrossRef] [Green Version]
  27. Crespo, J.; Reich, M.; Barra, F.; Verdugo, J.J.; Martínez, C.; Leisen, M.; Romero, R.; Morata, D.; Marquardt, C. Ocurrence and distribution of silver in the world-class Río Blanco porphyry Cu-Mo deposit, Central Chile. Econ. Geol. 2020, 115, 1619–1644. [Google Scholar] [CrossRef]
  28. Hanley, J.J.; MacKenzie, M.K. Incorporation of platinum-group elements and cobalt into subsidiary pyrite in alkali Cu-Au porphyry deposits: Significant implications for precious metal distribution in felsic magmatic-hydrothermal systems. In AGU Spring Meeting Abstracts; American Geophysical Union: Washington, DC, USA, 2009; Volume 2009, p. V14A-03. [Google Scholar]
  29. Reich, M.; Deditius, A.; Chryssoulis, S.; Li, J.W.; Ma, C.Q.; Parada, M.A.; Barra, F.; Mittermayr, F. Pyrite as a record of hydrothermal fluid evolution in a porphyry copper system: A SIMS/EMPA trace element study. Geochim. Cosmochim. Acta 2013, 104, 42–62. [Google Scholar] [CrossRef]
  30. Cioacă, M.E.; Munteanu, M.; Qi, L.; Costin, G. Trace element concentrations in porphyry copper deposits from Metalliferi Mountains, Romania: A reconnaissance study. Ore Geol. Rev. 2014, 63, 22–39. [Google Scholar] [CrossRef]
  31. Peterson, E.C.; Mavrogenes, J.A. Linking high-grade gold mineralization to earthquake-induced fault-valve processes in the Porgera gold deposit, Papua New Guinea. Geology 2014, 42, 383–386. [Google Scholar] [CrossRef]
  32. Zwahlen, C.; Cioldi, S.; Wagner, T.; Rey, R.; Heinrich, C. The porphyry Cu-(Mo-Au) deposit at Altar (Argentina): Tracing gold distribution by vein mapping and LA-ICP-MS mineral analysis. Econ. Geol. 2014, 109, 1341–1358. [Google Scholar] [CrossRef] [Green Version]
  33. Franchini, M.; McFarlane, C.; Maydagán, L.; Reich, M.; Lentz, D.R.; Meinret, L.; Bouhier, V. Trace metals in pyrite and marcasite from the Agua Rica porphyry-high sulfidation epithermal deposit, Catamarca, Argentina: Textural features and metal zoning at the porphyry to epithermal transition. Ore Geol. Rev. 2015, 66, 366–387. [Google Scholar] [CrossRef]
  34. Tanner, D.; Henley, R.W.; Mavrogenes, J.A.; Holden, P. Sulfur isotope and trace element systematics of zoned pyrite crystals from the El Indio Au-Cu-Ag deposit, Chile. Contrib. Mineral. Petrol. 2016, 171, 1–17. [Google Scholar] [CrossRef] [Green Version]
  35. Maydagán, L.; Franchini, M.; Lentz, D.; Pons, J.; McFarlane, C. Sulfide composition and isotopic signature of the Altar Cu-Au deposit, Argentina: Constraints on the evolution of the porphyry-epithermal system. Can. Miner. 2013, 51, 813–840. [Google Scholar] [CrossRef]
  36. Reich, M.; Palacios, C.; Barra, F.; Chryssoulis, S. “Invisible” silver in chalcopyrite and bornite from the Mantos Blancos copper deposit. Eur. J. Mineral. 2013, 25, 453–460. [Google Scholar] [CrossRef]
  37. Liu, R.; Chen, G.; Yang, J. Compositions of Cu-(Fe)-Sulfides in the 109 Reduced Granite-Related Cu Deposit, Xinjiang, Northwest China: Implications to the Characteristics of Ore-Forming Fluids. Geofluids 2020, 1–11. [Google Scholar] [CrossRef]
  38. Reich, M.; Román, N.; Barra, F.; Morata, D. Silver-Rich Chalcopyrite from the Active Cerro Pabellón Geothermal System, Northern Chile. Minerals 2020, 10, 113. [Google Scholar] [CrossRef] [Green Version]
  39. CODELCO, Memoria Anual. 2018. Available online: https://www.codelco.com/memoria2018/site/docs/20190405/20190405152423/memoria_anual_codelco_2018.pdf (accessed on 15 March 2021).
  40. Boric, R.; Díaz, F.; Maksaev, V. Geología y Yacimientos Metalíferos de la Región de Antofagasta. Serv. Nac. Geol. Min. Bol. 1990, 40, 246. [Google Scholar]
  41. Lindsay, D.D.; Zentilli, M.; Rojas, J. Evolution of an active ductile to brittle shear system controlling mineralization at the Chuquicamata porphyry copper deposit, northern Chile. Int. Geol. Rev. 1995, 37, 945–958. [Google Scholar] [CrossRef]
  42. Dilles, J.H.; Tomlinson, A.J.; Martin, M.W.; Blanco, N. El Abra and Fortuna Complexes: A porphyry copper batholith sinistrally displaced by the Falla Oeste. In Actas VIII Congreso Geológico Chileno; SERNAGEOMIN: Antofagasta, Chile, 1997; Volume 3, pp. 1883–1887. [Google Scholar]
  43. Sillitoe, R.H. Epochs of intrusion-related copper mineralization in the Andes. J. S. Am. Earth Sci. 1998, 1, 89–108. [Google Scholar] [CrossRef]
  44. Sillitoe, R.H.; Perelló, J. Andean copper province: Tectonomagmatic settings, deposit types, metallogeny, exploration, and discovery. In 100th Aniversary Volume; Hedenquist, J.W., Thompson, J.F.H., Goldfarb, R.J., Richards, J.P., Eds.; Society of Economic Geologists: Littleton, CO, USA, 2005; pp. 845–890. [Google Scholar]
  45. Ballard, J.R.; Palin, J.M.; Williams, I.S.; Campbell, I.H.; Faunes, A. Two ages of porphyry intrusion resolved for the super-giant Chuquicamata copper deposit of northern Chile by ELA-ICP-MS and SHRIMP. Geology 2001, 29, 383–386. [Google Scholar] [CrossRef]
  46. Rivera, S.; Alcota, H.; Proffett, J.; Díaz, J.; Leiva, G.; Vergara, M. Update of the Geologic Setting and Cu-Mo Deposits of the Chuquicamata District, Northern Chile. In Geology and Genesis of Major Copper Deposits and Districts of the World: A Tribute to Richard H. Sillitoe and J.W. Hedenquist; Harris, M., Camus, F., Eds.; Society of Economic Geologists: Littleton, CO, USA, 2012; Volume 16, pp. 19–54. [Google Scholar]
  47. Ossandón, G.; Fréraut, R.; Gustafson, L.; Lindsay, D.; Zentilli, M. Geology of the Chuquicamata Mine: A Progress Report. Econ. Geol. 2001, 96, 249–270. [Google Scholar] [CrossRef]
  48. Faunes, A.; Hintze, F.; Siña, A.; Véliz, H.; Vivanco, M. Chuquicamata, Core of a Planetary Scale Cu-Mo Anomaly. In Super Porphyry Copper and Gold Deposits: A Global Perspective; Porter, T.M., Ed.; PGC Publishing: Adelaide, Australia, 2005; Volume 1, pp. 151–174. [Google Scholar]
  49. Lindsay, D.D. Structural Control and Anisotropy of Mineralization within the Chuquicamata Porphyry Copper Deposit, Northern Chile. Ph.D. Thesis, Dalhousie University, Halifax, NS, Canada, 1997; p. 404, Unpublished. [Google Scholar]
  50. Campbell, I.H.; Ballard, J.R.; Palin, J.M.; Allen, C.; Faunes, A. U-Pb zircon geochronology of granitic rocks from the Chuquicamata-El Abra porphyry copper belt of Northern Chile: Excimer laser ablation ICP-MS analysis. Econ. Geol. 2006, 101, 1327–1344. [Google Scholar] [CrossRef]
  51. Zentilli, M.; Maksaev, V.; Boric, R.; Wilson, J. Spatial coincidence and similar geochemistry of Late Triassic and Eocene-Oligocene magmatism in the Andes of northern Chile: Evidence from the MMH porphyry type Cu-Mo deposit, Chuquicamata District. Int. J. Earth Sci. 2018, 107, 1097–1126. [Google Scholar] [CrossRef]
  52. Reynolds, P.; Ravenhurst, C.; Zentilli, M.; Lindsay, D.D. High precision 40Ar/39Ar dating of two consecutive hydrothermal events in the Chuquicamata porphyry copper system, Chile. Chem. Geol. 1998, 148, 45–60. [Google Scholar] [CrossRef]
  53. Barra, F.; Alcota, H.; Rivera, S.; Valencia, V.; Munizaga, F.; Maksaev, V. Timing and formation of porphyry Cu-Mo mineralization in the Chuquicamata district, northern Chile: New constraints from the Toki cluster. Miner. Depos. 2013, 48, 629–651. [Google Scholar] [CrossRef]
  54. Mathur, R.; Ruiz, J.; Munizaga, F. Insights into Andean metallogenesis from the perspective of Re-Os analyses of sulfides. Extended Abstract Volume (CD Version). In South American Symposium on Isotope Geology; Sociedad Geológica de Chile: Santiago, Chile, 2001; Volume 3, pp. 34–36. [Google Scholar]
  55. Sillitoe, R.H.; Mckee, E.H. Age of Supergene Oxidation and Enrichment in the Chilean Porphyry Copper Province. Econ. Geol. 1996, 91, 164–179. [Google Scholar] [CrossRef]
  56. Reich, M.; Snyder, G.T.; Álvarez, F.; Pérez, A.; Palacios, C.; Vargas, G.; Cameron, E.M.; Muramatsu, Y.; Fehn, U. Using iodine isotopes to constrain supergene fluid sources in arid regions: Insights from the Chuquicamata oxide blanket. Econ. Geol. 2013, 108, 163–171. [Google Scholar] [CrossRef]
  57. Román, N.; Reich, M.; Leisen, M.; Morata, D.; Barra, F. Geochemical and micro-textural fingerprints of boiling in pyrite. Geochim. Cosmochim. Acta 2019, 246, 60–85. [Google Scholar] [CrossRef]
  58. Longerich, H.P.; Jackson, S.E.; Günther, D. Laser ablation inductively coupled plasma mass spectrometric transient signal data acquisition and analyte concentration calculation. J. Anal. At. Spectrom. 1996, 11, 899–904. [Google Scholar] [CrossRef]
  59. Wilson, S.A.; Ridley, W.L.; Koenig, A.E. Development of sulfide calibration standards for the laser ablation inductively-coupled plasma mass spectrometry technique. J. Anal. At. Spectrom. 2002, 17, 406–409. [Google Scholar] [CrossRef]
  60. Jochum, K.P.; Willbold, M.; Raczek, I.; Stoll, B.; Herwing, K. Chemical Characterisation of the USGS Reference Glasses and BIR-1G Using EMPA, ID-TIMS, ID-ICP-MS and LA-ICP-MS. Geostand. Newslett. 2005, 29, 285–302. [Google Scholar] [CrossRef]
  61. Paton, C.; Hellstrom, J.; Woodhead, J.; Hergt, J. Iolite: Freeware for the visualisation and processing of mass spectrometric data. J. Anal. At. Spectrom. 2011, 26, 2508–2518. [Google Scholar] [CrossRef]
  62. Arnott, A. Evolution of the Hydrothermal Alteration at the Chuquicamata Porphyry Copper System, Northern Chile. Ph.D. Thesis, Dalhousie University, Halifax, NS, Canada, 2003; p. 455, Unpublished. [Google Scholar]
  63. Demané, E.; Borquez, K.; Realini, G. Informe Geológico Actualización Modelos de Cobre, Molibdeno y Aresénico PND 2020, División Chuquicamata Superintendencia de Geología Gerencia de Recursos Mineros y Desarrollo: Internal Report CODELCO; Superintendencia de Geología: Calama, Chile, 2018. [Google Scholar]
  64. Carvalho, J.; Relvas, J.; Pinto, A.; Frenzel, M.; Krause, J.; Gutzmer, J.; Pacheco, N.; Fonseca, R.; Santos, S.; Caetano, P.; et al. Indium and selenium distribution in the Neves-Corvo deposit, Iberian Pyrite Belt, Portugal. Mineral. Mag. 2018, 82, S5–S41. [Google Scholar] [CrossRef] [Green Version]
  65. Kieft, K.; Damman, H. Indium-bearing chalcopyrite and sphalerite from the Gasborn area, West Bergslagen, central Sweden. Mineral. Mag. 1990, 54, 109–112. [Google Scholar] [CrossRef] [Green Version]
  66. Huston, D.; Sie, S.; Suter, G.; Cooke, D.; Both, R. Trace elements in sulfide minerals from eastern Australian volcanic-hosted massive sulfide deposits; Part I, Proton microprobe analyses of pyrite, chalcopyrite, and sphalerite, and Part II, Selenium levels in pyrite; comparison with delta 34S values and implications for the source of sulfur in volcanogenic hydrothermal systems. Econ. Geol. 1995, 90, 1167–1196. [Google Scholar]
  67. Sinclair, W.D.; Kooiman, G.; Martin, D.; Kjarsgaard, I.M. Geology, geochemistry and mineralogy of indium resources at Mount Pleasant, New Brunswick, Canada. Ore Geol. Rev. 2006, 28, 123–145. [Google Scholar] [CrossRef]
  68. Belissont, R.; Munoz, M.; Boiron, M.C.; Luais, B.; Mathon, O. Germanium Crystal Chemistry in Cu-Bearing Sulfides from Micro-XRF Mapping and Micro-XANES Spectroscopy. Minerals 2019, 9, 227. [Google Scholar] [CrossRef] [Green Version]
  69. Sugaki, A.; Kitakaze, A.; Harada, H. Synthesis of minerals in the Cu-Fe-Bi-S system under hydrothermal condition and their phase relations. Bull. Mineral. 1981, 104, 484–495. [Google Scholar] [CrossRef]
  70. Sugaki, A.; Kitakaze, A.; Harada, H. Hydrothermal synthesis and phase relations of the polymetallic sulfide system, especially on the Cu-Fe-Bi-S system. In Materials Science of the Earth’s Interior; Sungawa, I., Ed.; Terra Publ: Tokyo, Japan, 1984; pp. 545–583. [Google Scholar]
  71. Deditius, A.P.; Utsunomiya, S.; Ewing, R.; Kesler, S.E. Nanoscale “liquid” inclusions of As-Fe-S in arsenian pyrite. Am. Mineral. 2009, 94, 391–394. [Google Scholar] [CrossRef]
  72. Vaughan, J.P.; Craig, J.R. Mineral Chemistry of Metal Sulfides; Cambridge University Press: Cambridge, UK, 1978. [Google Scholar]
  73. Tossell, J.A.; Vaughan, D.J.; Burdett, J.K. Pyrite, marcasite, and arsenopyrite type minerals: Crystal chemical and structural principles. Phys. Chem. Miner. 1981, 7, 177–184. [Google Scholar] [CrossRef]
  74. Abraitis, P.K.; Pattrick, R.A.D.; Vaughan, D.J. Variations in the compositional, textural and electrical properties of natural pyrite: A review. Int. J. Miner. Process. 2004, 74, 41–59. [Google Scholar] [CrossRef]
  75. Gustafson, L.B.; Hunt, J.P. The porphyry copper deposit at El Salvador, Chile. Econ. Geol. 1975, 70, 875–912. [Google Scholar] [CrossRef]
  76. Einaudi, M.; Hedenquist, J.; Inan, E. Sulfidation state of hydrothermal fluids: The porphyry-epithermal transition and beyond. In Volcanic, Geothermal and Ore-Forming Fluids: Rulers and Witnesses of Processes within the Earth; Simmons, S.F., Graham, I.J., Eds.; Society of Economic Geologists: Littleton, CO, USA, 2003; Volume 10, pp. 285–313. [Google Scholar]
  77. Richards, J. Cumulative factors in the generation of giant calc-alkaline porphyry Cu deposits. In Super Porphyry Copper and Gold Deposits: A Global Perspective; Porter, T.M., Ed.; PGC Publishing: Linden Park, South Australia, 2005; Volume 1, pp. 7–25. [Google Scholar]
  78. Bodnar, R.; Lecumberri-Sanchez, P.; Moncada, D.; Steele-Macinnis, M. Fluid inclusions in Hydrothermal Ore Deposits. In Treatise Cheochem, 2nd ed.; Holland, H.D., Turekian, K.K., Eds.; Elsevier: Oxford, UK, 2014; Volume 13, pp. 119–142. [Google Scholar]
  79. Dilles, J.; Einaudi, M. Wall-rock alteration and hydrothermal flow paths about the Ann-Mason porphyry copper deposits, Nevada; a 6 km vertical reconstruction. Econ. Geol. 1992, 87, 1963–2001. [Google Scholar] [CrossRef]
  80. Corbett, G.J.; Leach, T.M. Southwest Pacific Rim Gold-Copper Systems: Structure, Alteration and Mineralization; Society of Economic Geologists: Littleton, CO, USA, 1998; Volume 6, p. 240. [Google Scholar]
  81. John, D.A.; Ayuso, R.A.; Barton, M.D.; Blakely, R.J.; Bodnar, R.J.; Dilles, J.H.; Gray, F.; Graybeal, F.T.; Mars, J.C.; McPhee, D.K.; et al. Porphyry Copper Deposit Model, Chap. B of Mineral Deposit Models for Resource Assessment: U.S. Geological Survey Scientific Investigations Report 2010–5070-B; Survey U.S.G: Reston, VA, USA, 2010; p. 169. [Google Scholar]
  82. Ulrich, T.; Heinrich, C. Geology and genesis of the Bajo de la Alumbrera porphyry Cu-Au deposit, Argentina. Econ. Geol. 2001, 96, 1743–1774. [Google Scholar] [CrossRef]
  83. Rusk, B.G.; Reed, M.H.; Dilles, J.H. Fluid inclusion evidence for magmatic-hydrothermal fluid evolution in the porphyry copper-molybdenum deposit at Butte, Montana. Econ. Geol. 2008, 103, 307–334. [Google Scholar] [CrossRef]
  84. Auclair, G.; Fouquet, Y.; Bohn, M. Distribution of selenium in high-temperature hydrothermal sulfide deposits at 13° North, East Pacific Rise. Can. Min. 1987, 25, 577–587. [Google Scholar]
  85. Qian, Z.; Xinzhi, Z.; Jiayong, P.; Shuxun, S. Geochemical Enrichment and Mineralization of Indium. Chin. J. Geochem. 1998, 17, 221–225. [Google Scholar] [CrossRef]
  86. Schwarz-Schampera, U.; Herzig, P.M. Indium: Geology, Mineralogy, and Economics; Springer: Berlin/Heidelberg, Germany, 2002. [Google Scholar]
  87. Frenzel, M.; Hirsch, T.; Gutzmer, J. Gallium, germanium, indium, and other trace and minor elements in sphalerite as a function of deposit type—A meta-analysis. Ore Geol. Rev. 2016, 76, 52–78. [Google Scholar] [CrossRef]
  88. Yamamoto, M.; Kase, K.; Tsutsumi, M. Fractionation of Sulfur Isotopes and Selenium between Coexisting Sulfide Minerals from the Besshi Deposit, Central Shikoku, Japan. Miner. Depos. 1984, 19, 237–242. [Google Scholar] [CrossRef]
  89. Layton-Matthews, D.; Peter, J.M.; Scott, S.D.; Leybourne, M. Distribution, mineralogy, and geochemistry of selenium in felsic volcanic-hosted massive sulfide deposits of the Finlayson Lake district, Yukon Territory, Canada. Econ. Geol. 2008, 103, 61–88. [Google Scholar] [CrossRef]
  90. Keith, M.; Smith, D.; Jenkin, G.; Holwell, D.; Dye, M. A review of Te and Se systematics in hydrothermal pyrite from precious metal deposits: Insights into ore-forming processes. Ore Geol. Rev. 2018, 96, 269–282. [Google Scholar] [CrossRef]
  91. Loges, A.; Testemale, D.; Huotari, S.; Honkanen, A.P.; Potapkin, V.; Wagner, T. Hydrothermal fluoride and chloride complexation of indium: An EXAFS study. Geophys. Res. Abstr. 2017, 19, 5392. [Google Scholar]
  92. Pokrovski, G.; Roux, J.; Ferlat, G.; Jonchiere, R.; Seitsonen, A.; Vuilleumier, R.; Hazemann, J.L. Silver in geological fluids from in situ X-ray absorption spectroscopy and first-principles molecular dynamics. Geochim. Cosmochim. Acta 2013, 106, 501–523. [Google Scholar] [CrossRef] [Green Version]
  93. Bhalla, P.; Holtz, F.; Linnen, R.L.; Behrens, H. Solubility of cassiterite in evolved granitic melts: Effect of T, fO2, and additional volatiles. Lithos 2005, 80, 387–400. [Google Scholar] [CrossRef]
  94. Migdisov, A.A.; Williams-Jones, A.E. An experimental study of cassiterite solubility in HCl-bearing water vapour at temperatures up to 350 °C. Implications for tin ore formation. Chem. Geol. 2005, 217, 29–40. [Google Scholar] [CrossRef]
  95. Huston, D.; Relvas, J.; Gemmell, J.; Drieberg, S. The role of granites in volcanic-hosted massive sulphide ore-forming systems: An assessment of magmatic-hydrothermal contributions. Miner. Depos. 2011, 46, 473–507. [Google Scholar] [CrossRef]
  96. Migdisov, A.A.; Zezin, D.; Williams-Jones, A.E. An experimental study of cobalt (II) complexation in Cl- and H2S-bearing hydrothermal solutions. Geochim. Cosmochim. Acta 2011, 75, 4065–4079. [Google Scholar] [CrossRef]
  97. Liu, W.; Borg, S.; Testemale, D.; Etschmann, B.; Hazemann, J.L.; Brugger, J. Speciation and thermodynamic properties for cobalt chloride complexes in hydrothermal fluids at 35–440 °C and 600 bar: An in-situ XAS study. Geochim. Cosmochim. Acta 2011, 75, 1227–1248. [Google Scholar] [CrossRef]
  98. Brugger, J.; Liu, W.; Etschmann, B.; Mei, Y.; Sherman, D.; Testemale, D. A review of the coordination chemistry of hydrothermal systems, or do coordination changes make ore deposits? Chem. Geol. 2016, 447, 219–253. [Google Scholar] [CrossRef]
  99. Liu, W.; Migdisov, A.; Williams-Jones, A. The stability of aqueous nickel (II) chloride complexes in hydrothermal solutions: Results of UV-visible spectroscopic experiments. Geochim. Cosmochim. Acta 2012, 94, 276–290. [Google Scholar] [CrossRef]
  100. Jiang, J.; Zhu, Y. Geology and geochemistry of the Jianchaling hydrothermal nickel deposit: T-pH-ƒO2- ƒS2 conditions and nickel precipitation mechanism. Ore Geol. Rev. 2017, 91, 216–235. [Google Scholar] [CrossRef]
  101. Zotov, A.V.; Kudrin, A.V.; Levin, K.A.; Shikina, N.D.; Var’yash, L.N. Experimental studies of the solubility and complexing of selected ore elements (Au, Ag, Cu, Mo, As, Sb, Hg) in aqueous solutions. In Fluids in the Crust Equilibrium and Transport; Shmulovich, K.I., Yardley, B.W.D., Gonchar, G.G., Eds.; Chapman & Hall: London, UK, 1995; pp. 95–138. [Google Scholar]
  102. Liu, W.; McPhail, D.C. Thermodynamic properties of copper chloride complexes and copper transport in magmatic-hydrothermal solutions. Chem. Geol. 2005, 221, 21–39. [Google Scholar] [CrossRef]
  103. Brugger, J.; Etschmann, B.; Liu, W.; Testemale, D.; Hazemann, J.L.; Emerich, H.; Van Beek, W.; Proux, O. An XAS study of the structure and thermodynamics of Cu (I) chloride complexes in brines up to high temperature (400 °C, 600 bar). Geochim. Cosmochim. Acta 2007, 71, 4920–4941. [Google Scholar] [CrossRef]
  104. Yin, Y.; Zajacz, Z. The solubility of silver in magmatic fluids: Implications for silver transfer to the magmatic-hydrothermal ore-forming environment. Geochim. Cosmochim. Acta 2018, 238, 235–251. [Google Scholar] [CrossRef]
  105. Mukherjee, I.; Large, R. Application of pyrite trace element chemistry to exploration for SEDEX style Zn-Pb deposits: McArthur Basin, Northern Territory, Australia. Ore Geol. Rev. 2017, 81, 1249–1270. [Google Scholar] [CrossRef]
  106. Soltani, A.; McFarlane, C.; Lentz, D.; Walker, J. Assessment of pyrite composition by LA-ICP-MS techniques from massive sulfide deposits of the Bathurst Mining Camp, Canada: From textural and chemical evolution to its application as a vectoring tool for the exploration of VMS deposit. Ore Geol. Rev. 2018, 92, 656–671. [Google Scholar] [CrossRef]
  107. Baker, T.; Mustard, R.; Brown, V.; Pearson, N.; Stanley, C.R.; Radford, N.W.; Butler, I. Textural and chemical zonation of pyrite at Pajingo: A potential vector to epithermal gold veins. Geochem. Explor. Environ. Anal. 2006, 6, 283–293. [Google Scholar] [CrossRef]
  108. Kouhestani, H.; Ghaderi, M.; Large, R.; Zaw, K. Texture and chemistry of pyrite at Chah Zard epithermal gold-silver deposit, Iran. Ore Geol. Rev. 2017, 84, 80–101. [Google Scholar] [CrossRef]
  109. Gregory, D.D.; Cracknell, M.J.; Large, R.R.; McGoldrick, P.; Kuhn, S.; Maslennikov, V.V.; Baker, M.J.; Fox, N.; Belousov, I.; Figueroa, M.C.; et al. Distinguishing Ore Deposit Type and Barren Sedimentary Pyrite Using Laser Ablation-Inductively Coupled Plasma-Mass Spectrometry Trace Element Data and Statistical Analysis of Large Data Sets. Econ. Geol. 2019, 114, 771–786. [Google Scholar] [CrossRef]
  110. Wilkinson, J.; Chang, Z.; Cooke, D.; Baker, M.; Wilkinson, C.; Inglis, S.; Chen, H.; Gemmell, J. The chlorite proximitor: A new tool for detecting porphyry ore deposits. J. Geochem. Explor. 2015, 152, 10–26. [Google Scholar] [CrossRef] [Green Version]
  111. Wilkinson, J.J.; Cooke, D.R.; Baker, M.J.; Chang, Z.; Wilkinson, C.C.; Chen, H.; Fox, N.; Hollings, P.; White, N.C.; Gemmell, J.B.; et al. Porphyry indicator minerals and their mineral chemistry as vectoring and fertility tools. In Application of Indicator Mineral Methods to Bedrock and Sediments; Geological Survey of Canada: Ottawa, Canada, 2017; p. 90. [Google Scholar]
  112. Cooke, D.R.; Agnew, P.; Hollings, P.; Baker, M.; Chang, Z.; Wilkinson, J.J.; White, N.; Zhang, L.; Thompson, J.; Gemmell, J.B.; et al. Porphyry indicator minerals (PIMS) and porphyry vectoring and fertility tools (PVFTS)—Indicators of mineralization styles and recorders of Hypogene geochemical dispersion halos. In Proceedings of the Decennial Mineral Exploration Conferences 17, Toronto, ON, Canada, 22–25 October 2017. [Google Scholar]
  113. Cooke, D.; Agnew, P.; Hollings, P.; Baker, M.; Chang, Z.; Wilkinson, J.; Ahmed, A.; White, N.; Zhang, L.; Thompson, J.; et al. Recent advances in the application of mineral chemistry to exploration for porphyry copper-gold-molybdenum deposits: Detecting the geochemical fingerprints and footprints of hypogene mineralization and alteration. Geochem. Explor. Environ. Anal. 2020, 20, 176. [Google Scholar] [CrossRef]
  114. Pacey, A.; Wilkinson, J.; Owens, J.; Priest, D.; Cooke, D.; Millar, I. The Anatomy of an Alkalic Porphyry Cu-Au System: Geology and Alteration at Northparkes Mines, New South Wales, Australia. Econ. Geol. 2019, 114, 441–472. [Google Scholar] [CrossRef]
  115. Kouzmanov, K.; Pokrovski, G.S. Hydrothermal Controls on Metal Distribution in Porphyry Cu (-Mo-Au) Systems; Society of Economic Geologists: Littleton, CO, USA, 2012; Volume 16, pp. 573–618. [Google Scholar]
  116. Audétat, A. The Metal Content of Magmatic-Hydrothermal Fluids and Its Relationship to Mineralization Potential. Econ. Geol. 2019, 114, 1033–1056. [Google Scholar] [CrossRef]
Figure 1. (A) Location of the Chuquicamata porphyry Cu-Mo deposit in relation to other deposits in the Antofagasta region, northern Chile. (B) Geological map of the Chuquicamata district. Modified from [51].
Minerals 11 00671 g001
Figure 2. Geology of the Chuquicamata porphyry Cu-Mo deposit. Modified from Ossandón et al., 2001 [47]. Datum: WGS84 Huso 19.
Minerals 11 00671 g002
Figure 3. Representative cross-section showing the distribution of alteration zones in the Chuquicamata Underground mine. The upper limits of the alteration zones correspond to the bottom of the Chuquicamata open pit. Drill cores CHDD4587 and CHDD7808 are also shown. Relative positions of selected samples within the drill cores are shown in gray and white.
Minerals 11 00671 g003
Figure 4. Photographs of main veinlet-types recognized at the Chuquicamata Underground mine. (A) “A-type” veinlets with quartz and a halo of biotite; (B) Chlorite veinlets with magnetite cross-cutting K-feldspar alteration; (C) Hematite veinlets with magnetite; (D) Pyrite veinlets with chlorite and magnetite associated with chloritic alteration; (E) Chalcopyrite veinlets; (F) “B-type” veinlet composed of quartz and molybdenite; (G) “D-type” veinlet with pyrite-quartz-molybdenite-enargite; (H) “D-type” veinlet with pyrite-chalcocite. Cct: Chalcocite, Chl: Chlorite, Ccp: Chalcopyrite, Eng: Enargite, Hem: Hematite, Kfs: K feldspar, Mag: Magnetite, Mol: Molybdenite, Pl: Plagioclase, Py: Pyrite, Qz: Quartz, Ser: Sericite.
Minerals 11 00671 g004
Figure 5. Paragenetic sequence for the Chuquicamata Underground deposit. * Data sources: Sillitoe and McKee, 1996 [54], Reynolds et al., 1998 [50], Mathur et al. [53], Ballard et al., 2001 [44], Rivera et al., 2012 [45], and Barra et al., 2013 [52].
Minerals 11 00671 g005
Figure 6. Reflected light photomicrographs and SEM images of chalcopyrite, bornite, and pyrite from representative samples. (A) pyrite-chalcopyrite veinlet from the chloritic alteration; (B) chalcopyrite replaced by covellite and digenite from the intense potassic alteration; (C) covellite and bornite replacing chalcopyrite from the intense potassic alteration; (D) pyrite-digenite-covellite veinlet in the quartz-sericite alteration; (E) scheelite micro-inclusion in chalcopyrite from the background potassic alteration zone; (F) Au-Ag-telluride micro-inclusions in bornite from the intense potassic alteration zone; (G) wittichenite inclusions in bornite-digenite in the quartz-sericite alteration zone; (H) wolframite micro-inclusion in pyrite from the quartz-sericite alteration zone. Bn: Bornite, Ccp: Chalcopyrite, Cv: Covellite, Dg: Digenite, Eng: Enargite, Py: Pyrite, Sch: Scheelite, Wf: Wolframite, Witt: Wittichenite.
Minerals 11 00671 g006
Figure 7. Concentration plot for minor and trace elements in sulfides from the Chuquicamata Underground mine. Data are plotted in parts per million (ppm) on a vertical logarithmic scale. In each boxplot, minimum, median, and maximum concentrations are indicated, and the number of analyses above detection limit for each element is displayed inside each box. (A) Boxplot of LA-ICP-MS data for selected minor and trace elements detected in all sulfides (chalcopyrite, bornite, and pyrite). (BD) Boxplots of LA-ICP-MS data for selected minor and trace elements in chalcopyrite, bornite, and pyrite, respectively, from different alteration zones in the Chuquicamata Underground mine.
Minerals 11 00671 g007
Figure 8. Representative LA-ICP-MS depth-concentration profiles (time vs. intensity) of selected isotopes in sulfides (chalcopyrite, bornite, and pyrite). (A) Depth-concentration profile of spot analysis from chalcopyrite, where flat signals are observed. (B) Depth-concentration profile of spot analysis from bornite, where flat signals are shown. (C) Depth-concentration profile of spot analysis from pyrite, where mostly “flat” signals are identified. (D) Depth-concentration profile of spot analysis from pyrite, where the presence of galena, wittichenite (coupled 63Cu and 209Bi peaks), Cu, Co, and Ag mineral particles are inferred.
Minerals 11 00671 g008
Figure 9. Elemental concentration scatterplots of sulfides as a function of alteration from the Chuquicamata Underground mine. (A) In vs. Se scatterplot for chalcopyrite. (B) Ag vs. Bi scatterplot for bornite. In the red circle, outlier of bornite sample 3618M22_bn10 that is not associated with chalcocite/digenite/covellite. (C) Ag vs. Sn scatterplot for bornite. (D) Co vs. Ni scatterplot for pyrite. (E) Ag vs. Co scatterplot for pyrite. (F) Co vs. Cu scatterplot for pyrite. Data are plotted in parts per million (ppm) on a logarithmic scale. Only LA-ICP-MS data included. In (AF), comparisons with published data from un-mineralized and distal systems are provided (red fields).
Minerals 11 00671 g009
Figure 10. (A) Se/In ratios of chalcopyrite from the Chuquicamata Underground deposit as a function of alteration. The average of each element ratio for each alteration is observed next to the horizontal line. (B) Se/In ratios of chalcopyrite from the Río Blanco porphyry deposit (data taken from [26]). As in (A), data was plotted as a function of alteration. (C) Ag/Co vs. Co/Cu scatterplot for pyrite from Chuquicamata Underground deposit. Elemental ratios are plotted in on a logarithmic scale (only LA-ICP-MS data included).
Minerals 11 00671 g010
Table 1. Summary statistics of LA-ICP-MS analyses for selected trace elements in sulfides from the Chuquicamata Underground deposit. Q1: first quartile (25% of the data below this concentration), Q3: third quartile (75% of the data below this concentration). Data are displayed in parts per million by weight (ppm).
CHALCOPYRITE
ElementGaSeAgInSnTeWAuPbBi
Points analysed173173173173173173173173173173
Measurements a.d.l172615117315581119113117
m.d.l (ppm)1.809.800.800.060.770.100.100.060.230.23
Median concentration (ppm)19.00275.008.905.9025.302.400.240.254.401.86
Q1 (ppm)14.9530.743.983.1716.300.3120.100.131.731.04
Q3 (ppm)24.05620.4815.007.9039.803.990.690.5211.502.94
90% value (ppm)34.2012,600.0023.0811.2452.066.602.400.7424.825.76
Min (ppm)11.2010.000.821.081.200.100.050.010.740.24
Max (ppm)43.0022,000.0045.1022.8068.206.603.801.2683.0025.90
BORNITE
ElementZnSeAgCdInSnTeWPbBi
Points analysed80808080808080808080
Measurements a.d.l338793539601265980
m.d.l (ppm)8.5150.820.10.10.890.270.060.600.27
Median concentration (ppm)31.15485.00191.3010.800.8849.100.860.167.10267.50
Q1 (ppm)22.34279.27131.508.890.7714.670.490.074.42236.00
Q3 (ppm)44.90651.97247.3913.301.0289.002.000.338.74308.71
90% value (ppm)77.80770.00291.6017.601.28115.8023.1118.9012.621054.60
Min (ppm)9.20119.0081.000.110.441.290.320.020.67182.00
Max (ppm)810.00770.00752.0056.002.70352.0031.0018.9043.002960.00
PYRITE
ElementCoNiCuGeSeAgSnTePbBi
Points analysed190190190190190190190190190190
Measurements a.d.l15811615288355320206494
m.d.l (ppm)0.450.810.791.304.700.120.190.010.130.11
Median concentration (ppm)45.5033.8060.302.5093.006.4016.950.6610.451.02
Q1 (ppm)11.335.3215.002.0233.001.590.810.180.750.31
Q3 (ppm)204.88102.98280.003.10200.0028.6730.254.5091.399.50
90% value (ppm)483.70241.302428.004.73484.0075.2041.919.60405.0036.56
Min (ppm)0.711.180.961.325.000.200.200.020.150.04
Max (ppm)1530.00960.009700.0010.102700.00450.0047.0023.002250.00460.00
Publisher’s Note: MDPI stays neutral with regard to jurisdictional claims in published maps and institutional affiliations.

