
Multi-Proxy Provenance Analyses of the Kingriali and Datta Formations (Triassic–Jurassic Transition): Evidence for Westward Extension of the Neo-Tethys Passive Margin from the Salt Range (Pakistan)


Abstract
1. Introduction
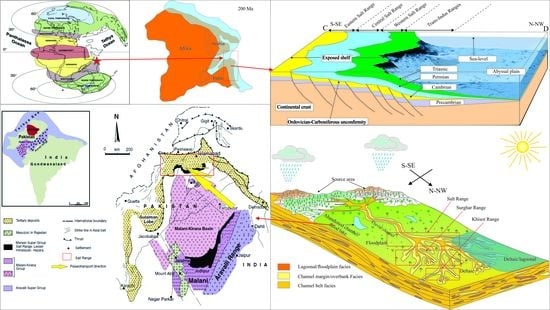
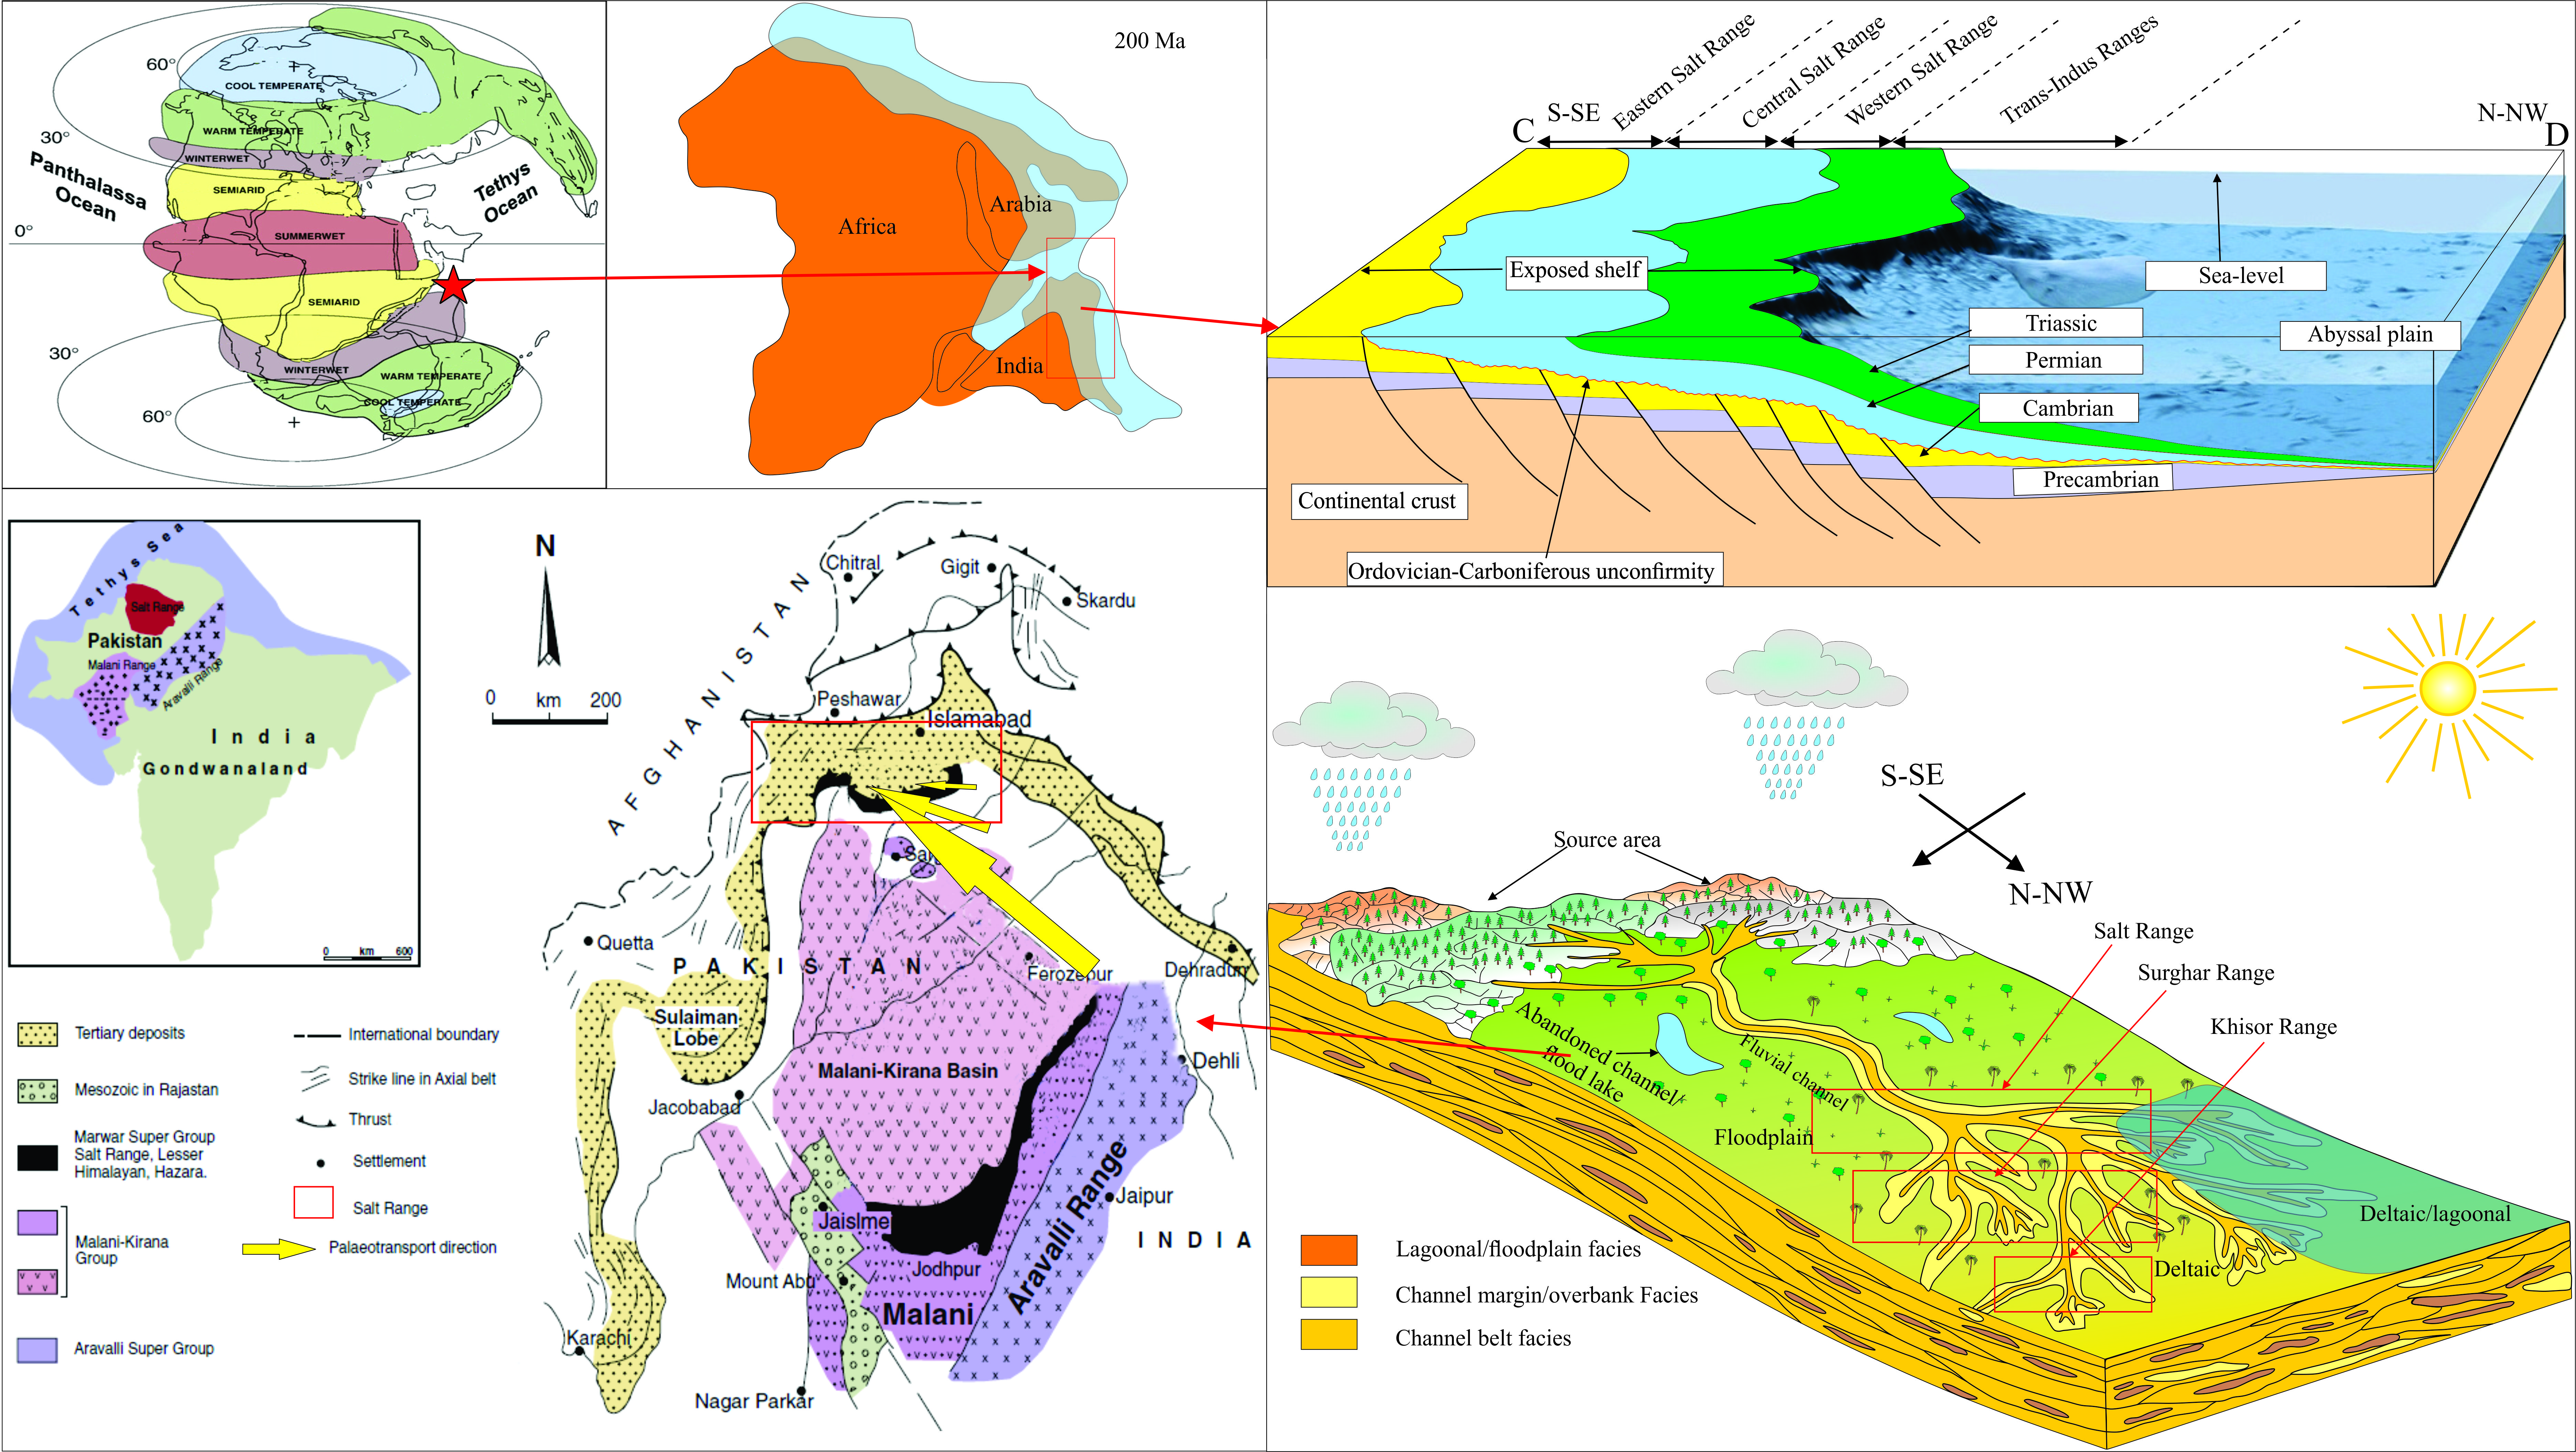
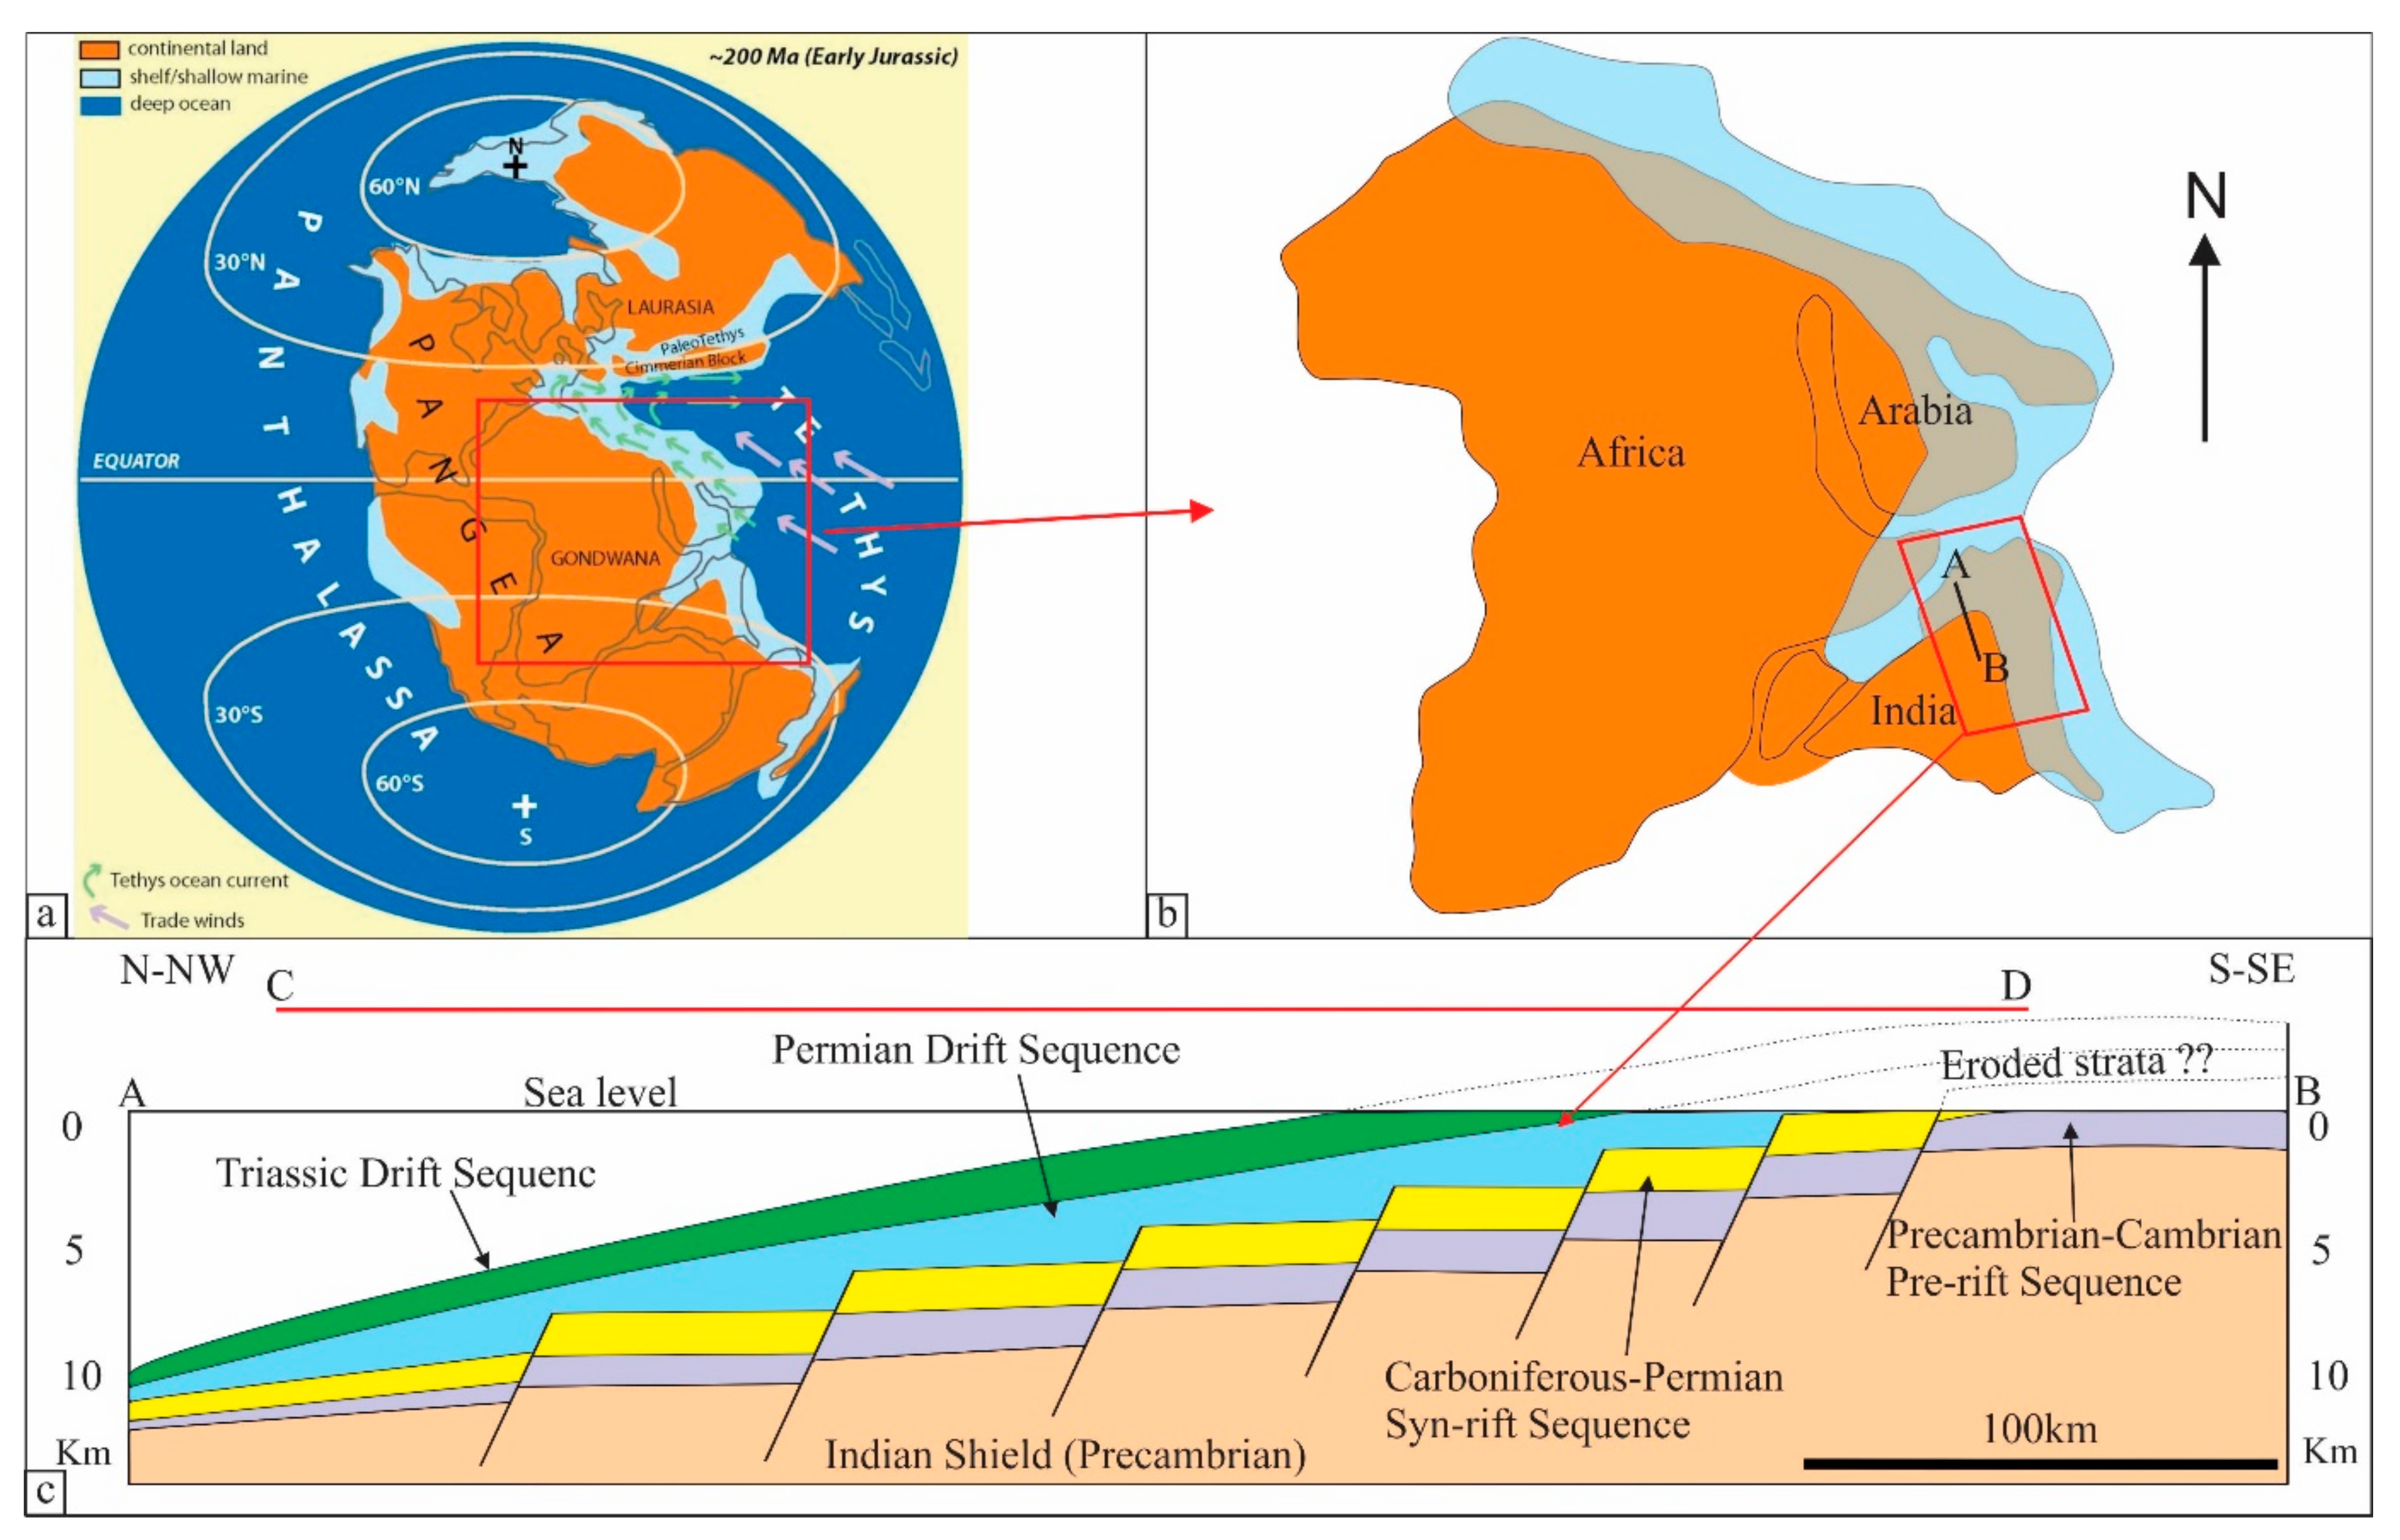
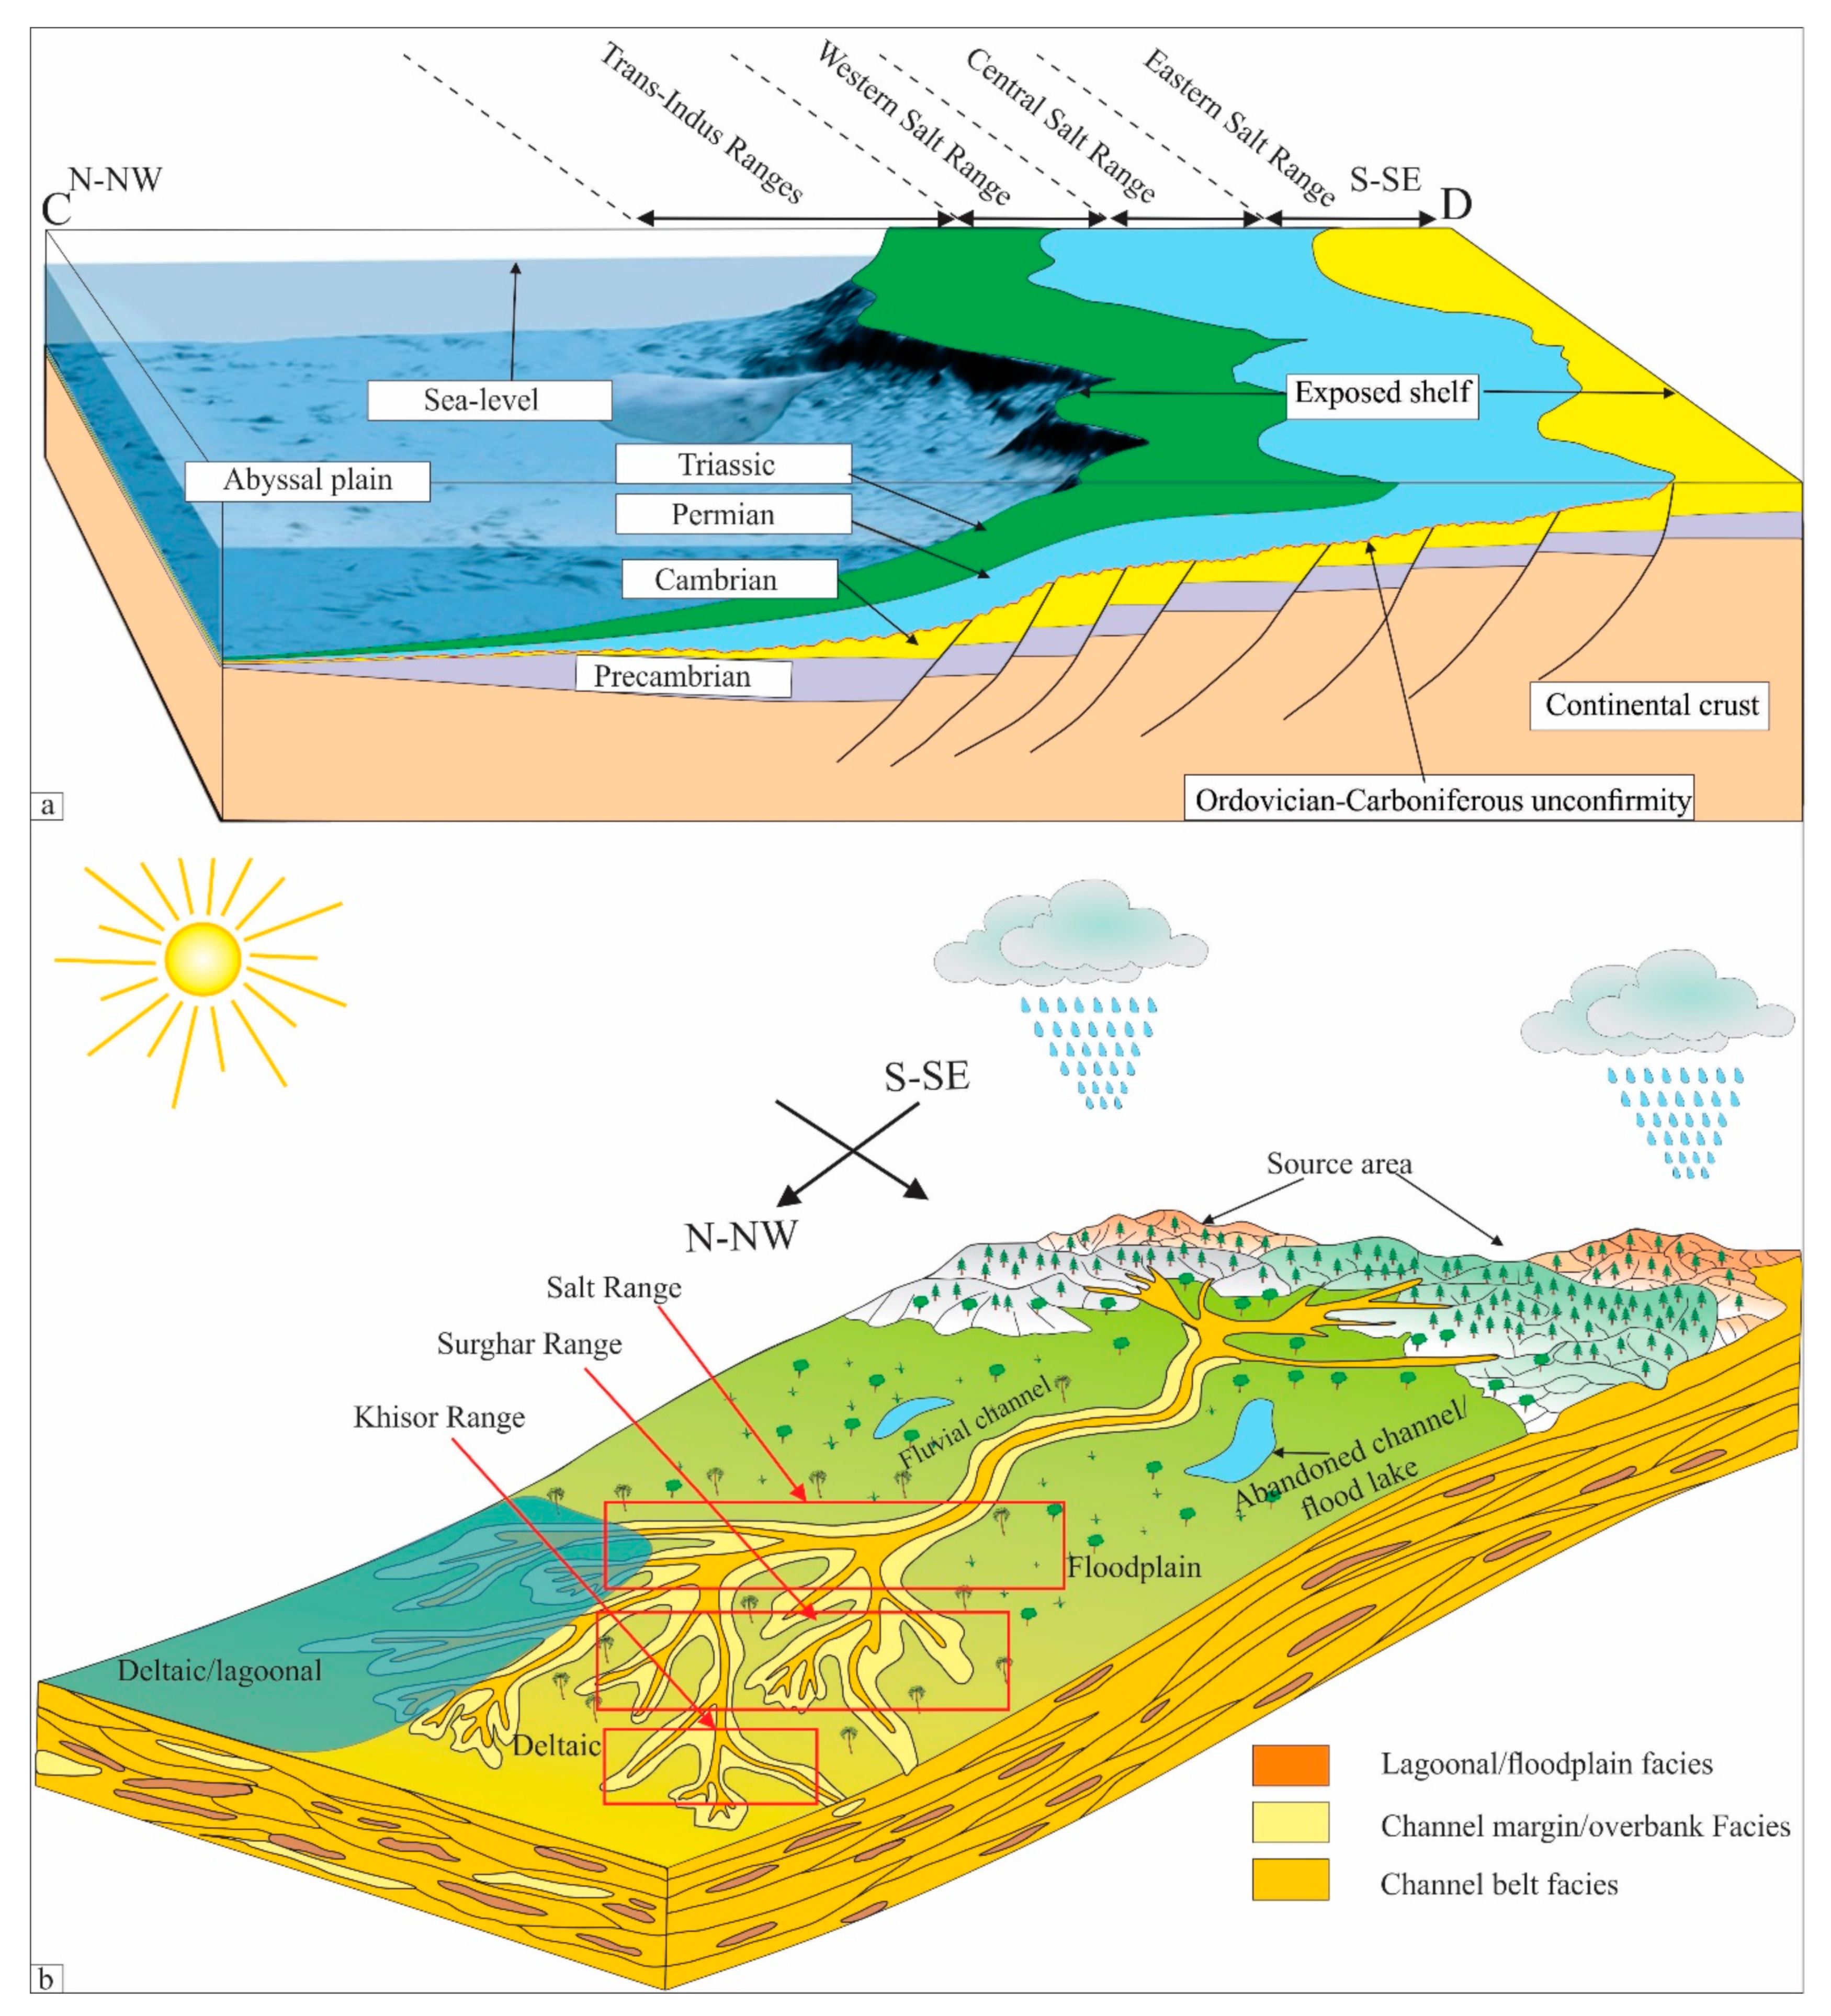
2. Geological Setting and Palaeogeography
3. Material and Methods
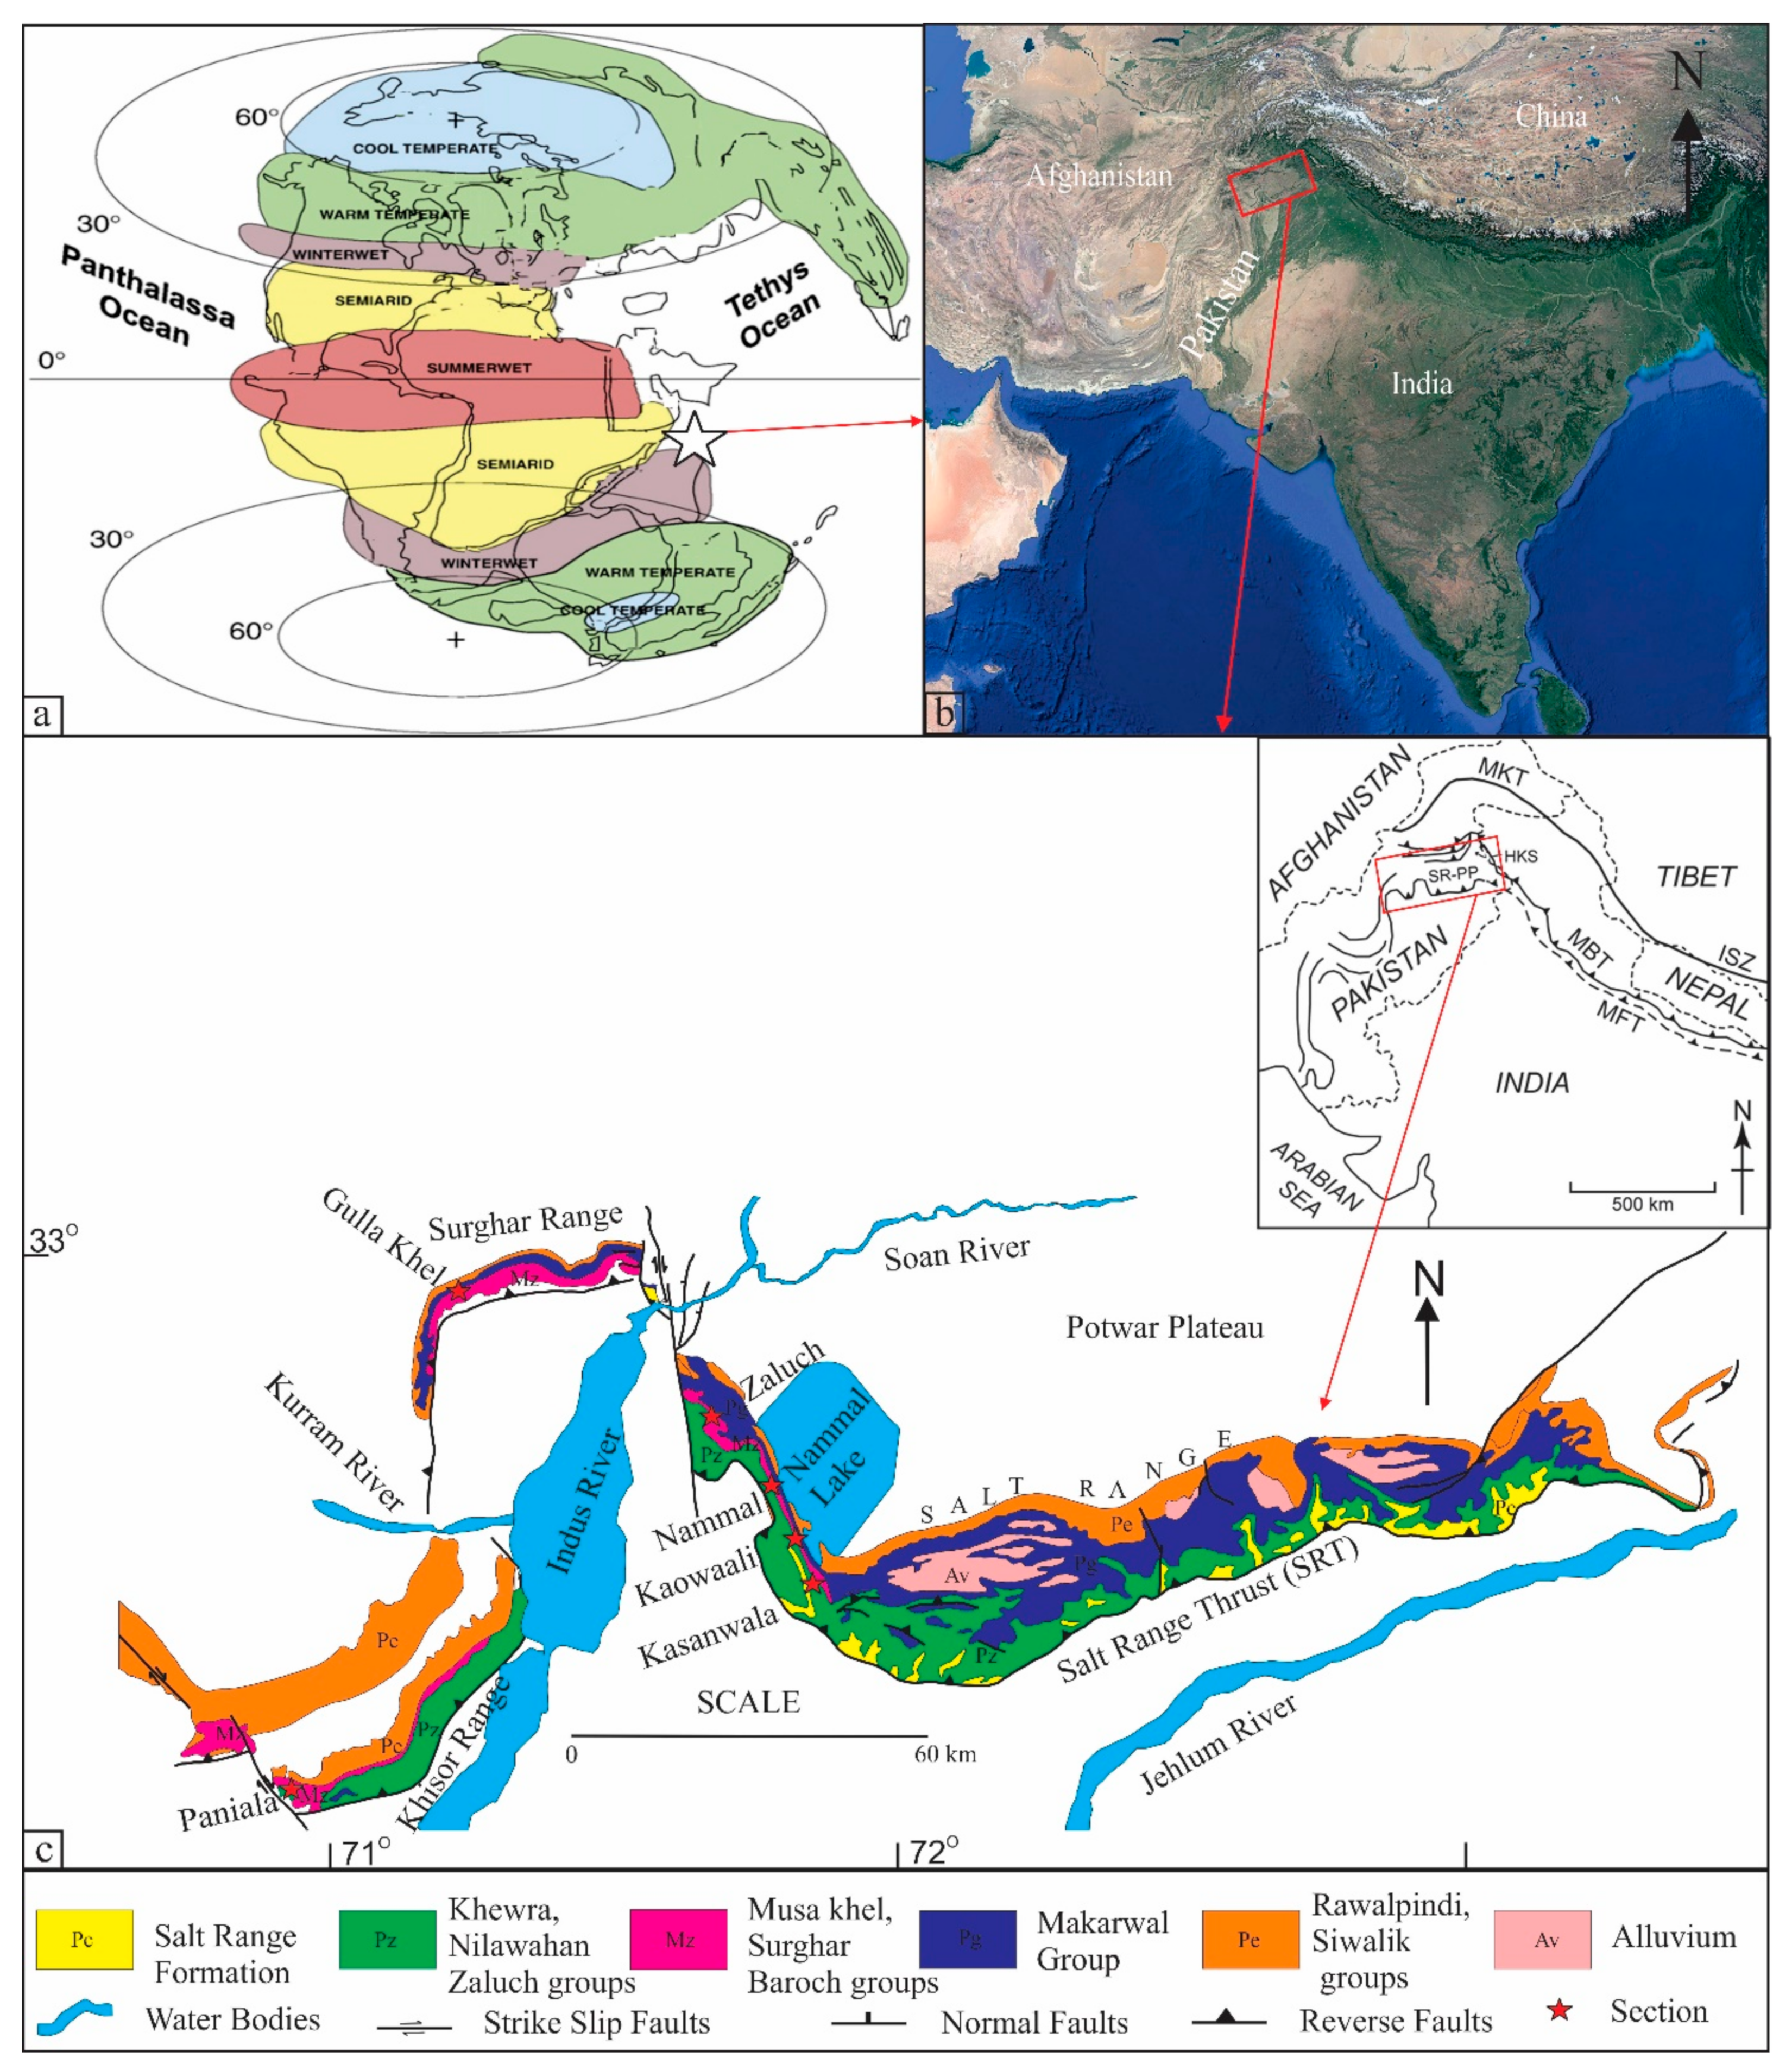
3.1. Fieldwork and Sampling
3.2. Palaeocurrent Analysis
3.3. Petrographic Studies
3.4. Clay Mineralogy/XRD Separation
3.5. Bulk Geochemistry
3.6. Heavy Minerals
4. Results
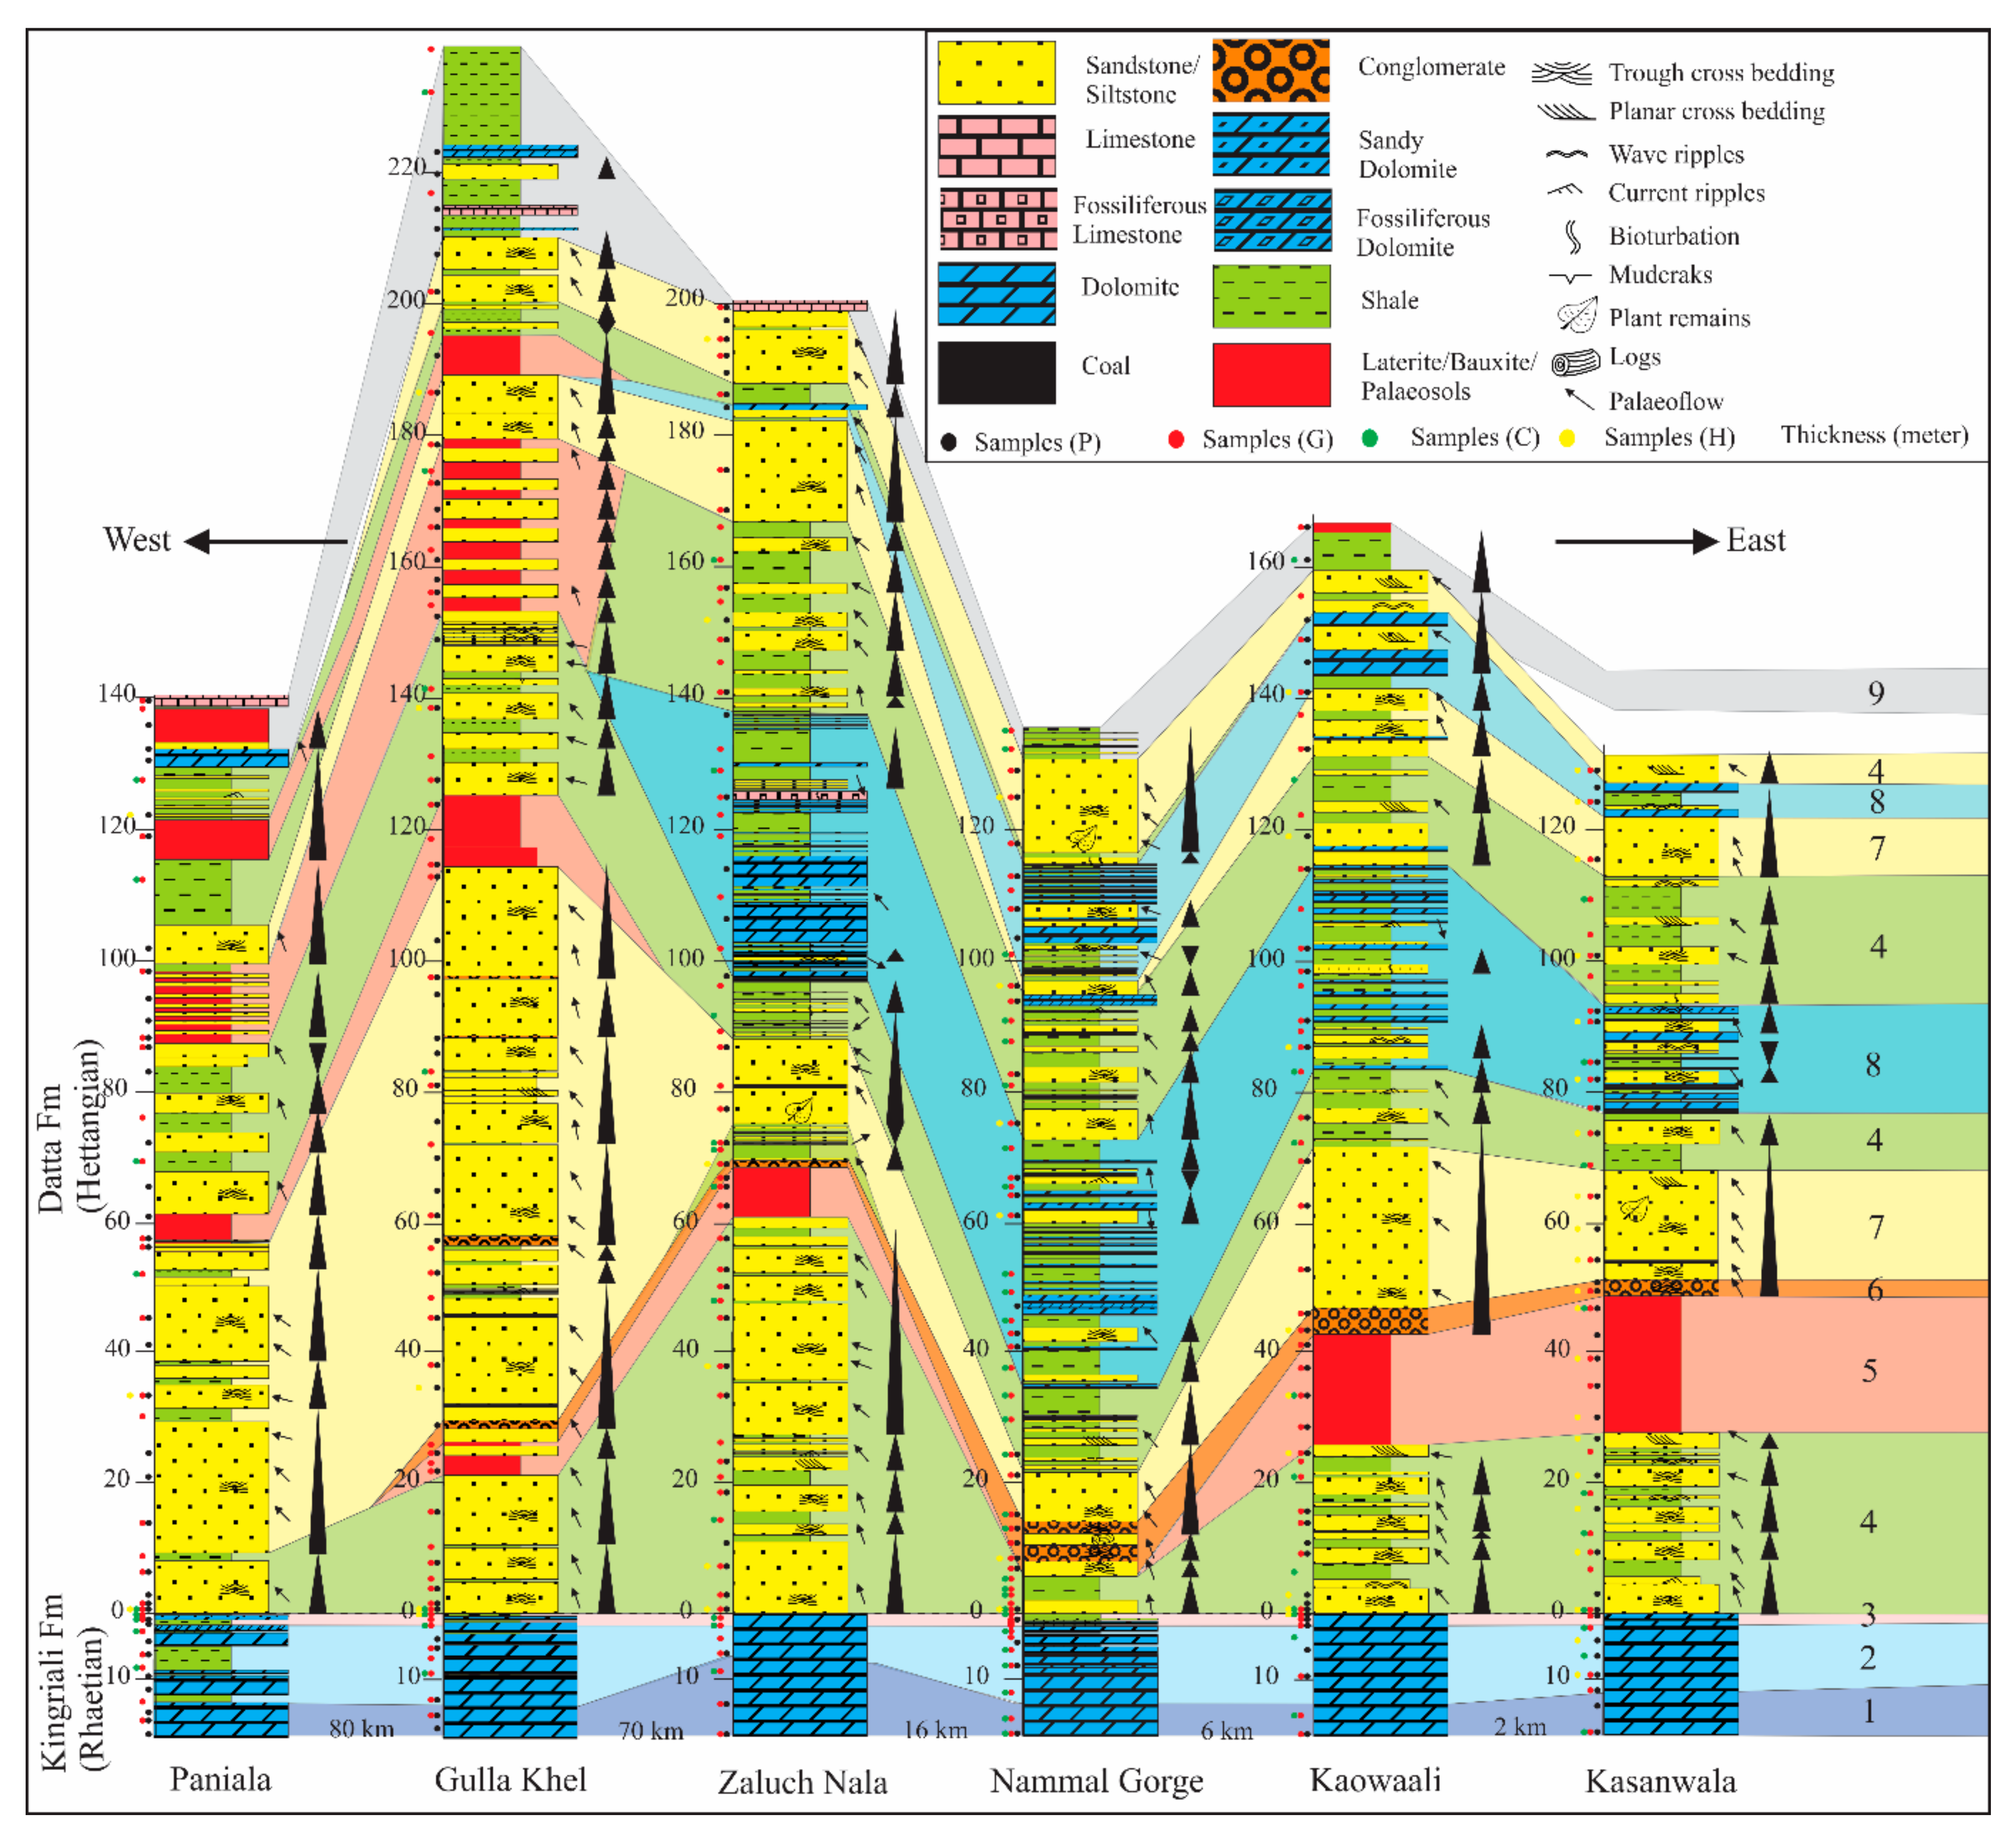
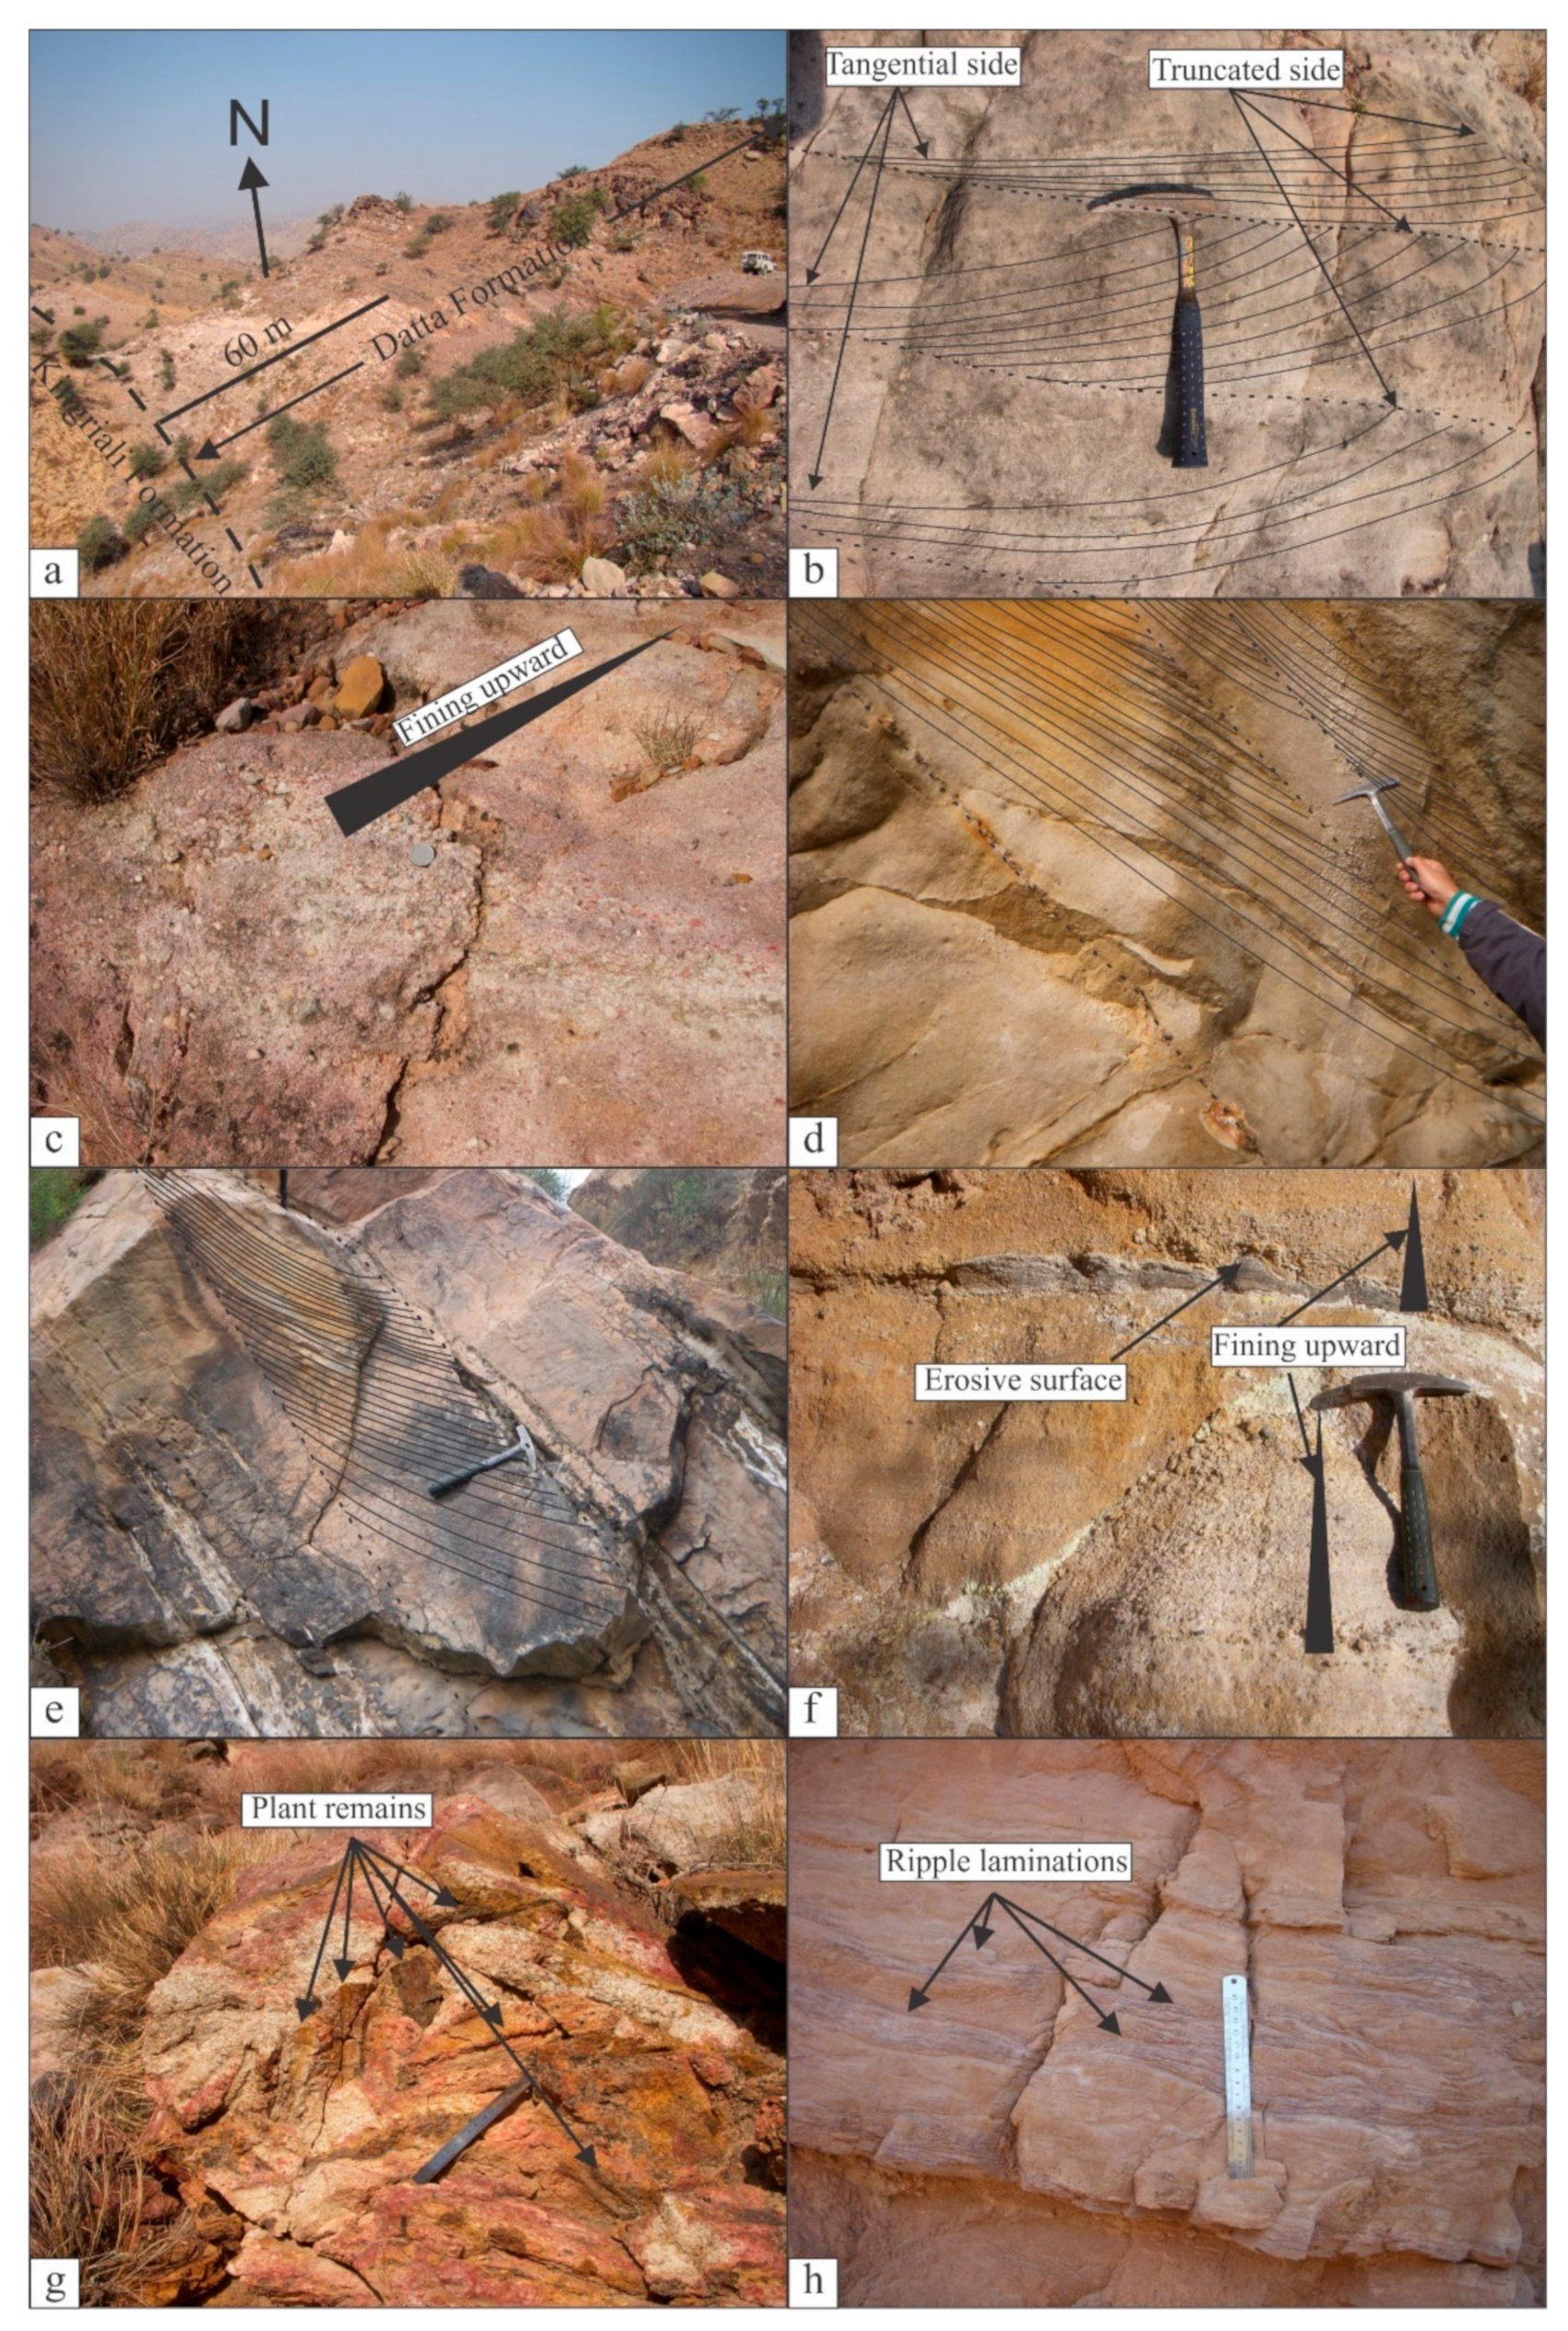
4.1. Field Data
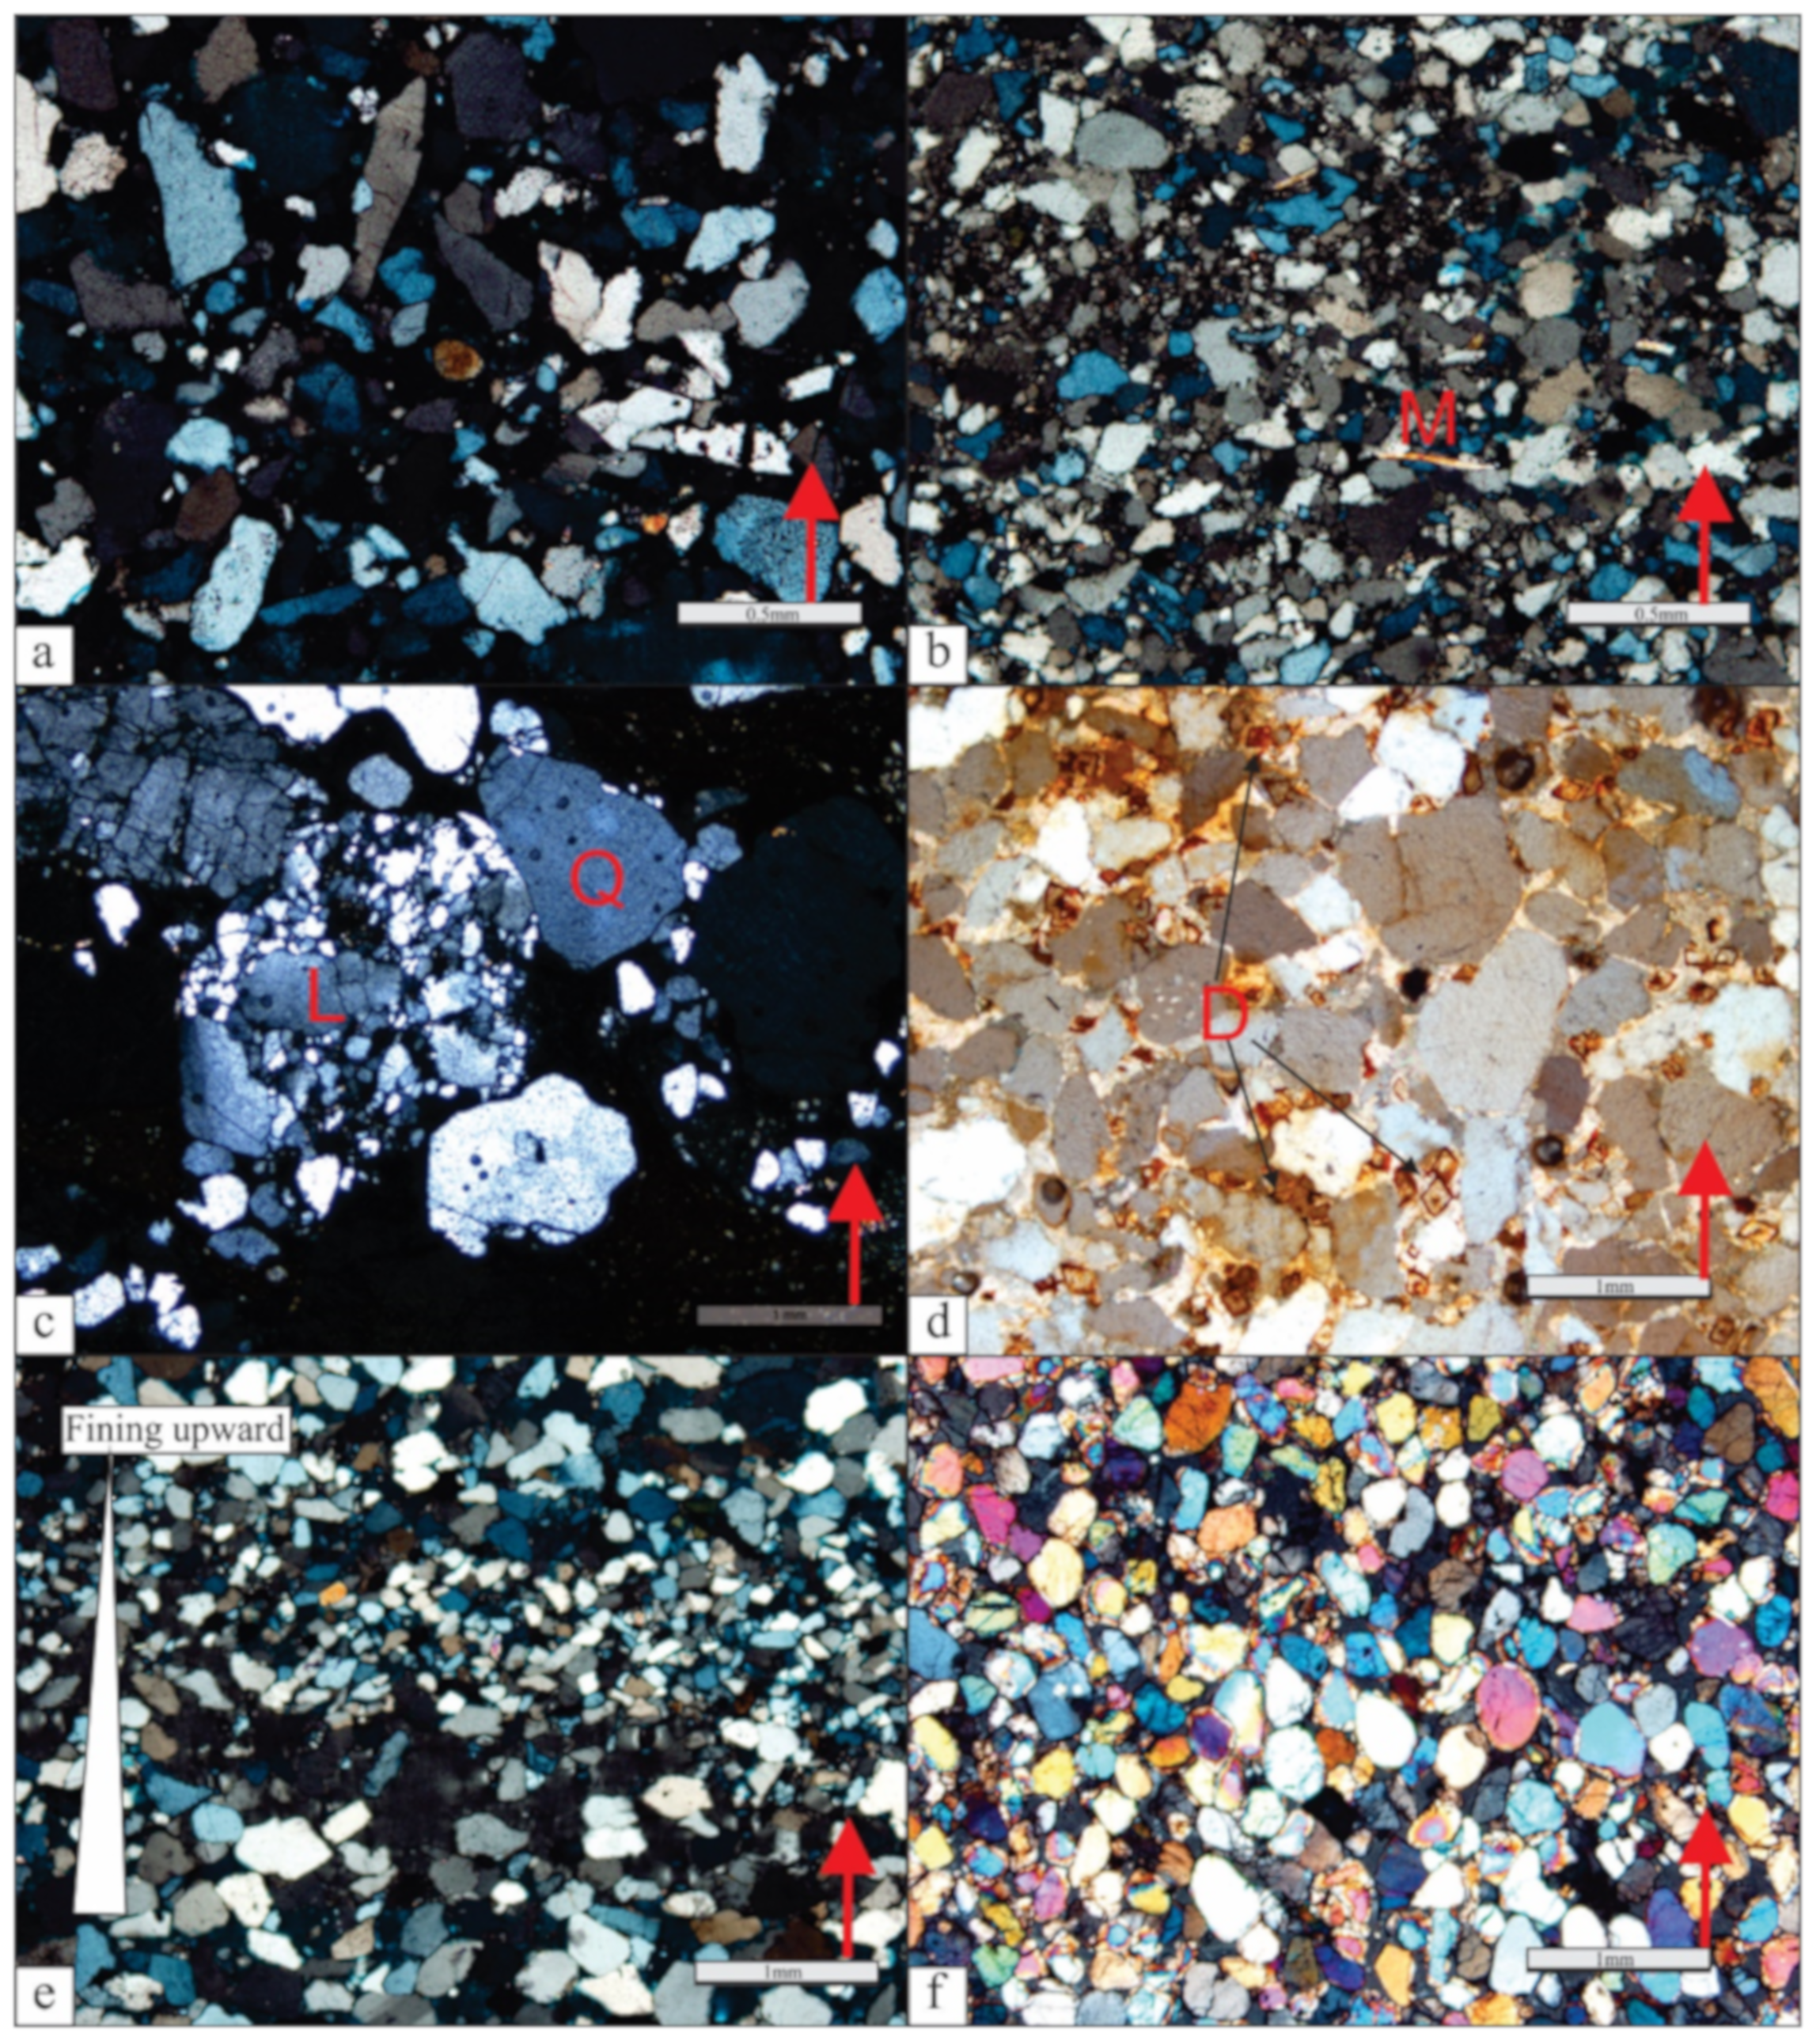
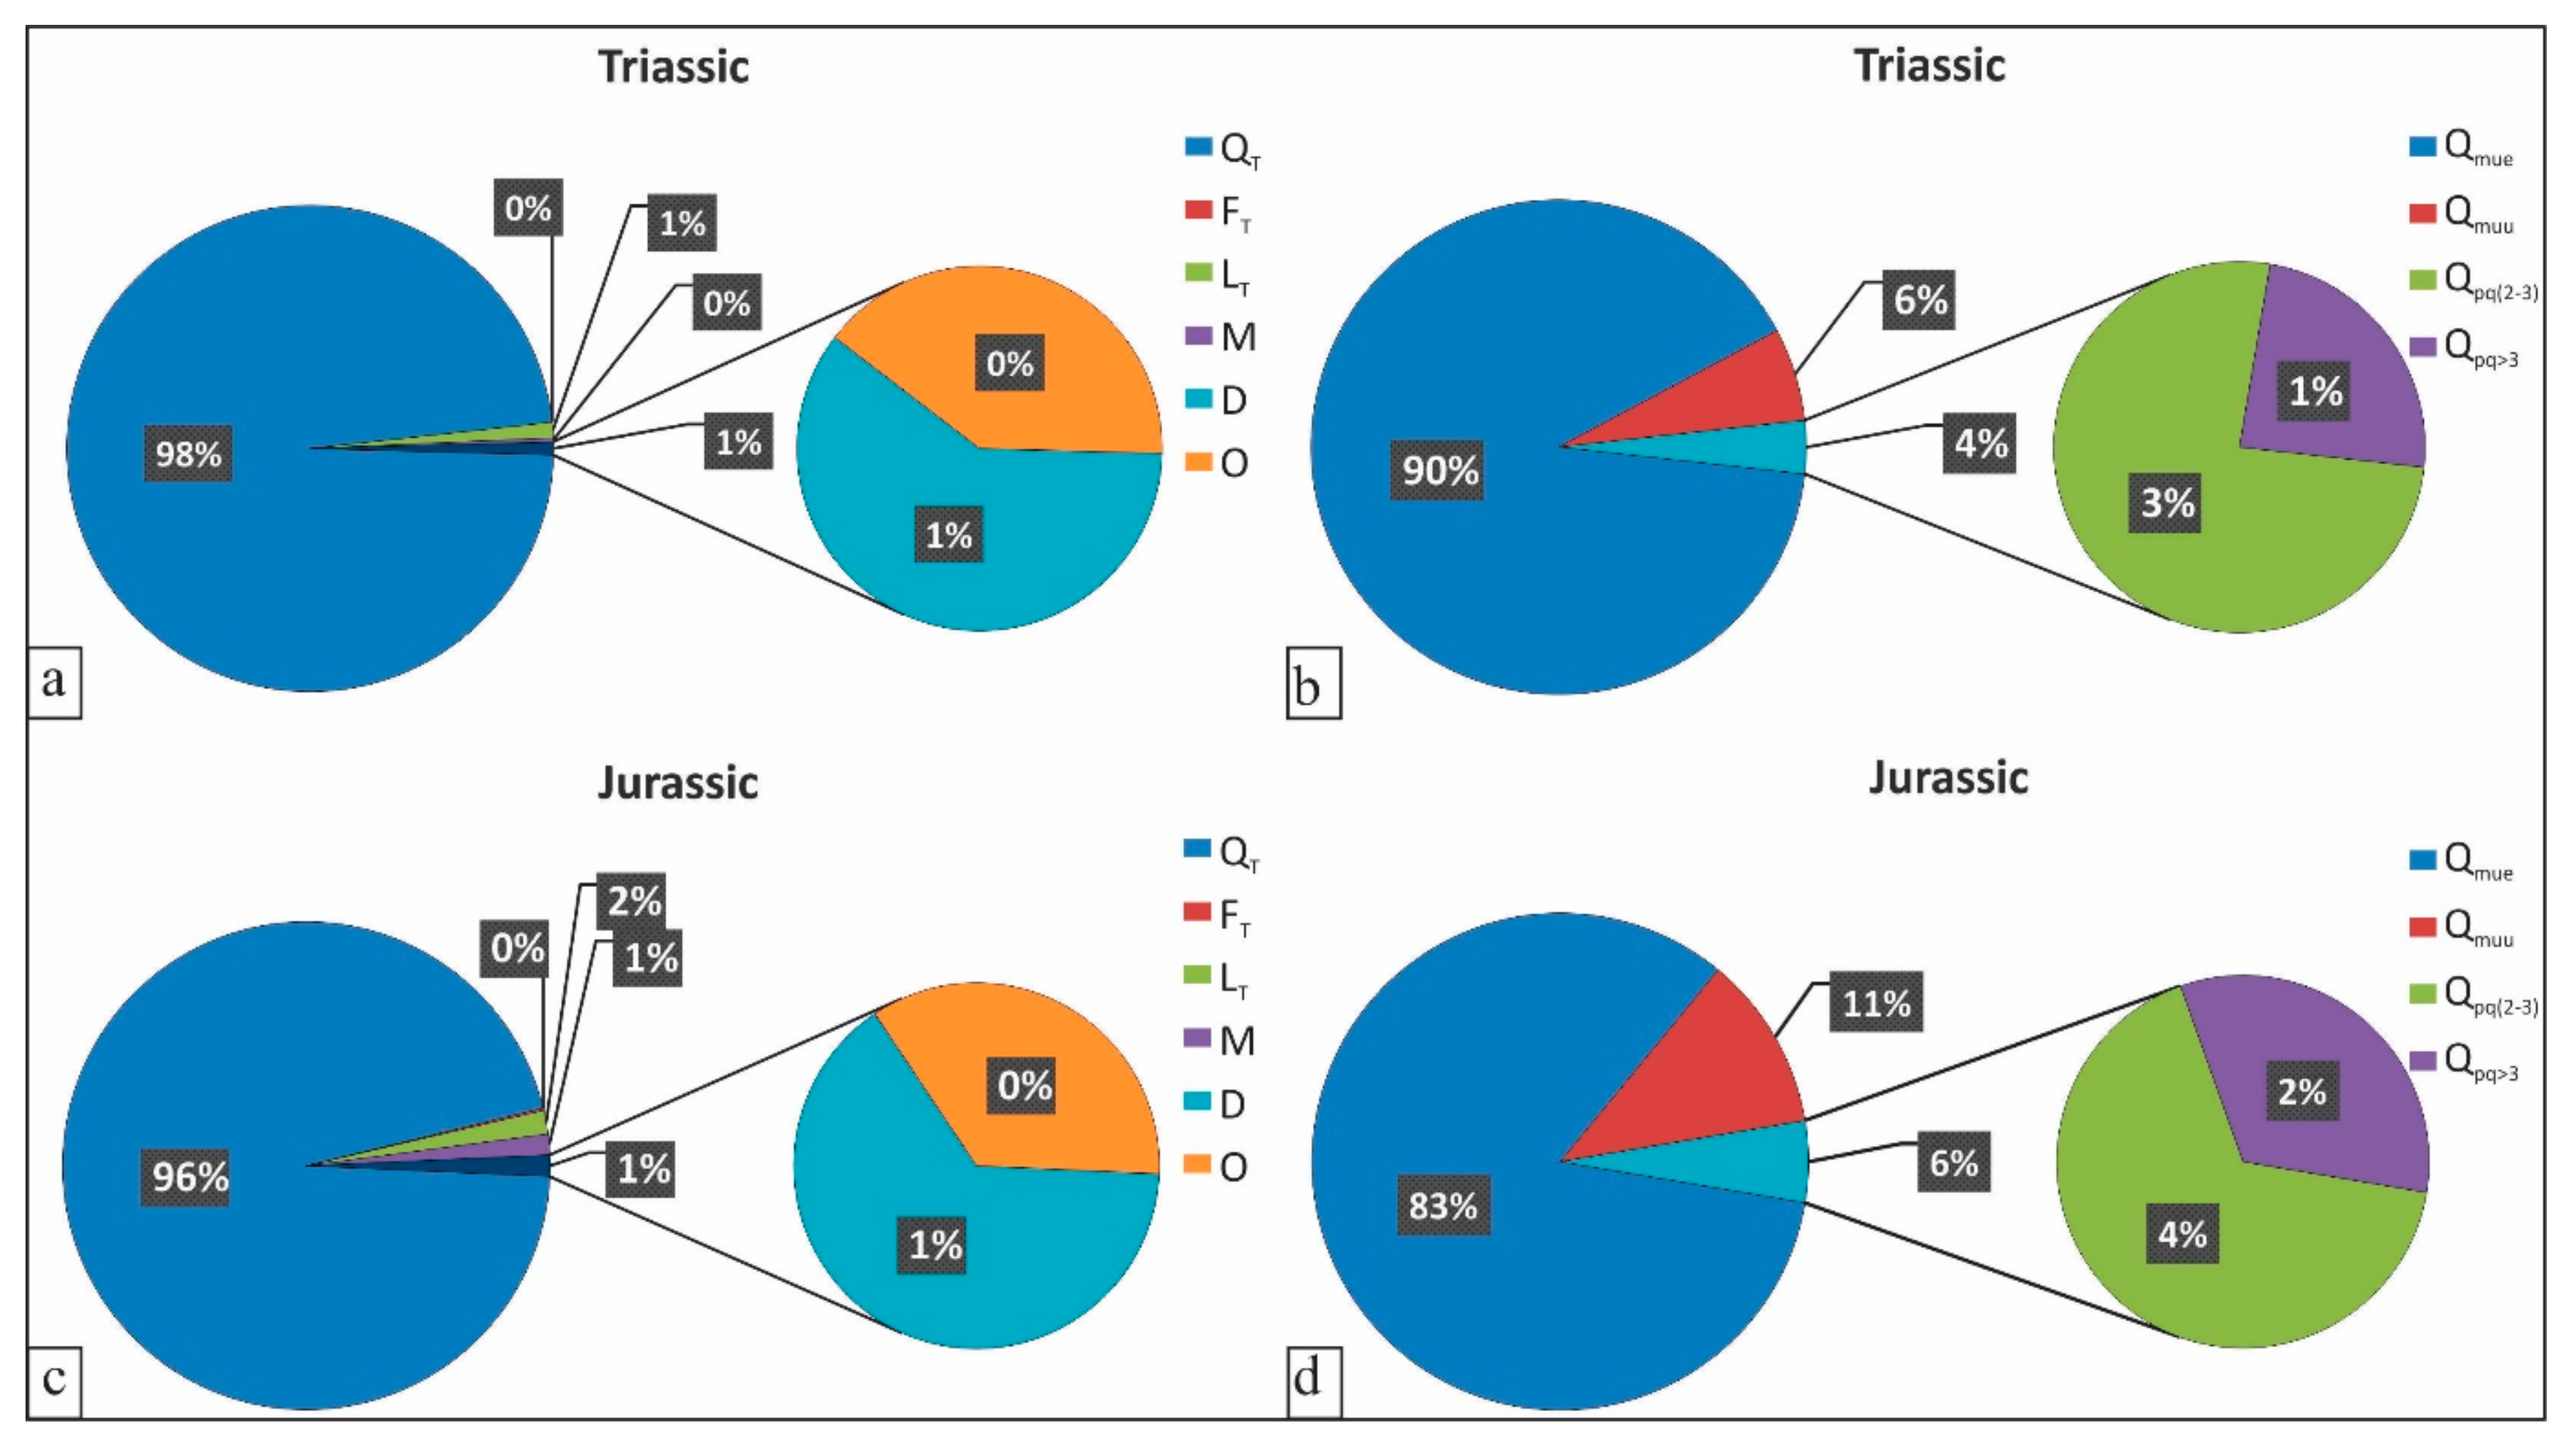
4.2. Framework Composition/Petrographic Studies
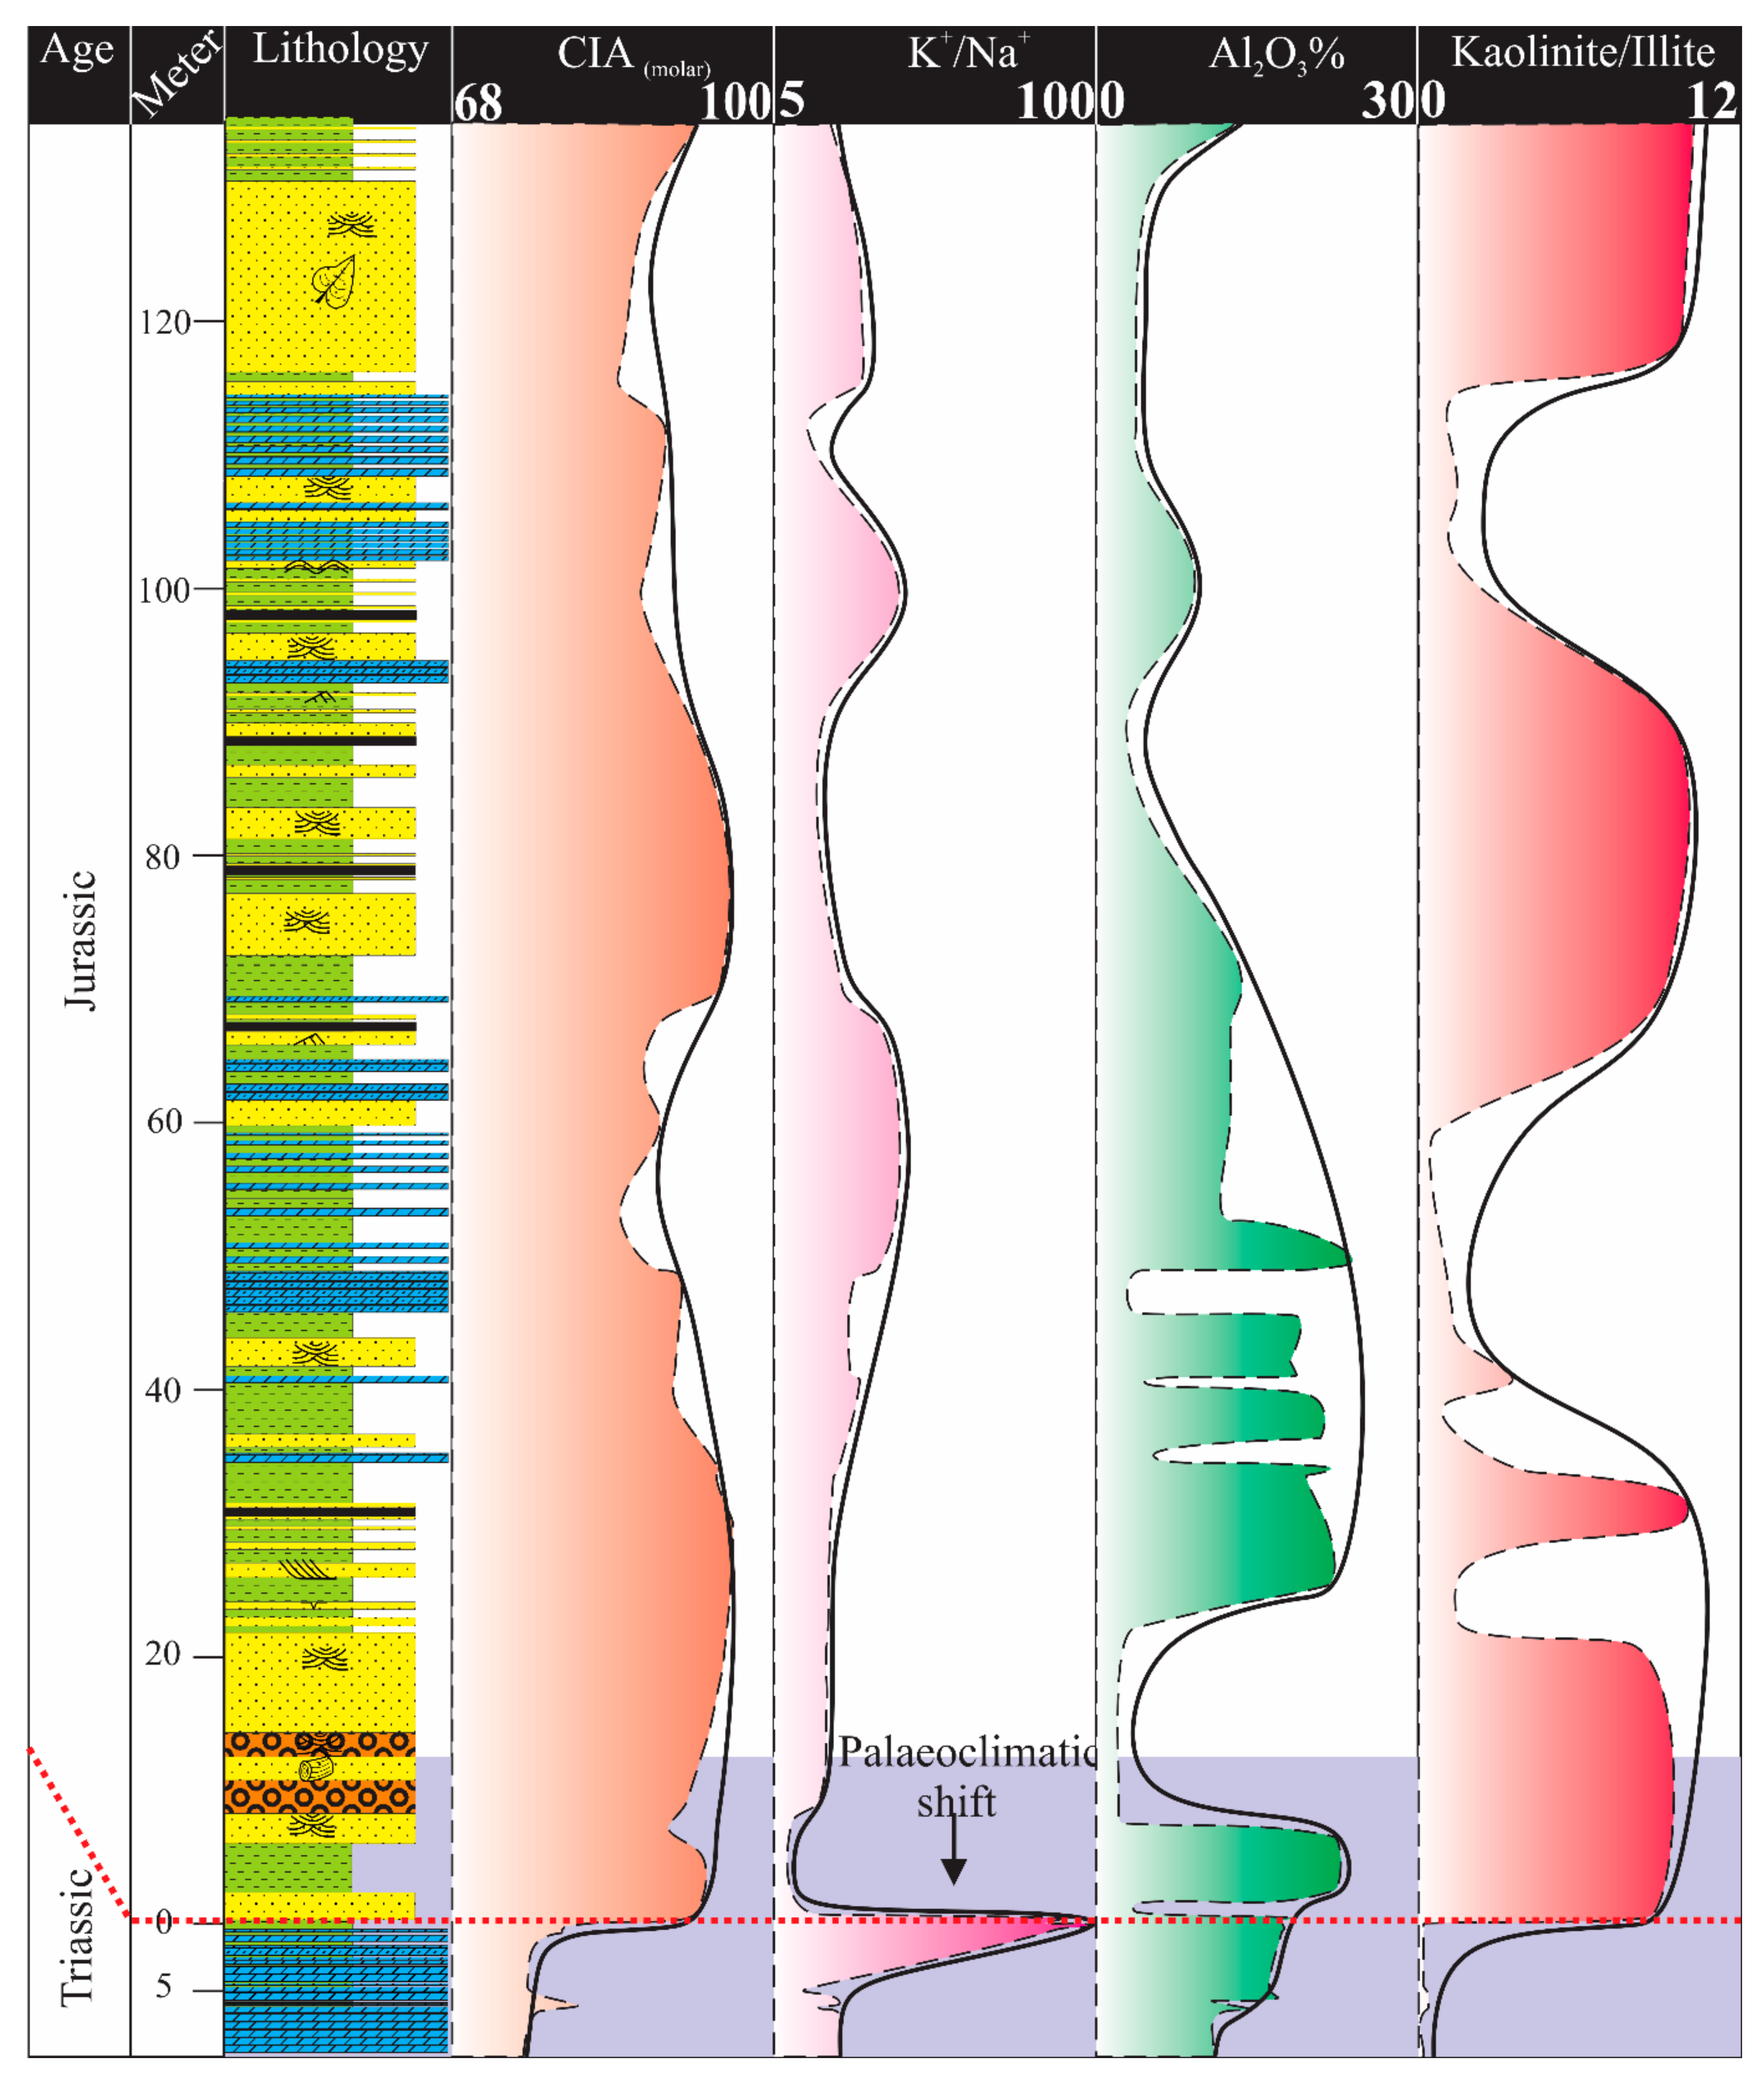
4.3. Clay Mineralogy
4.4. Bulk Geochemical Proxies
4.4.1. Tectonic Settings Discrimination Plots
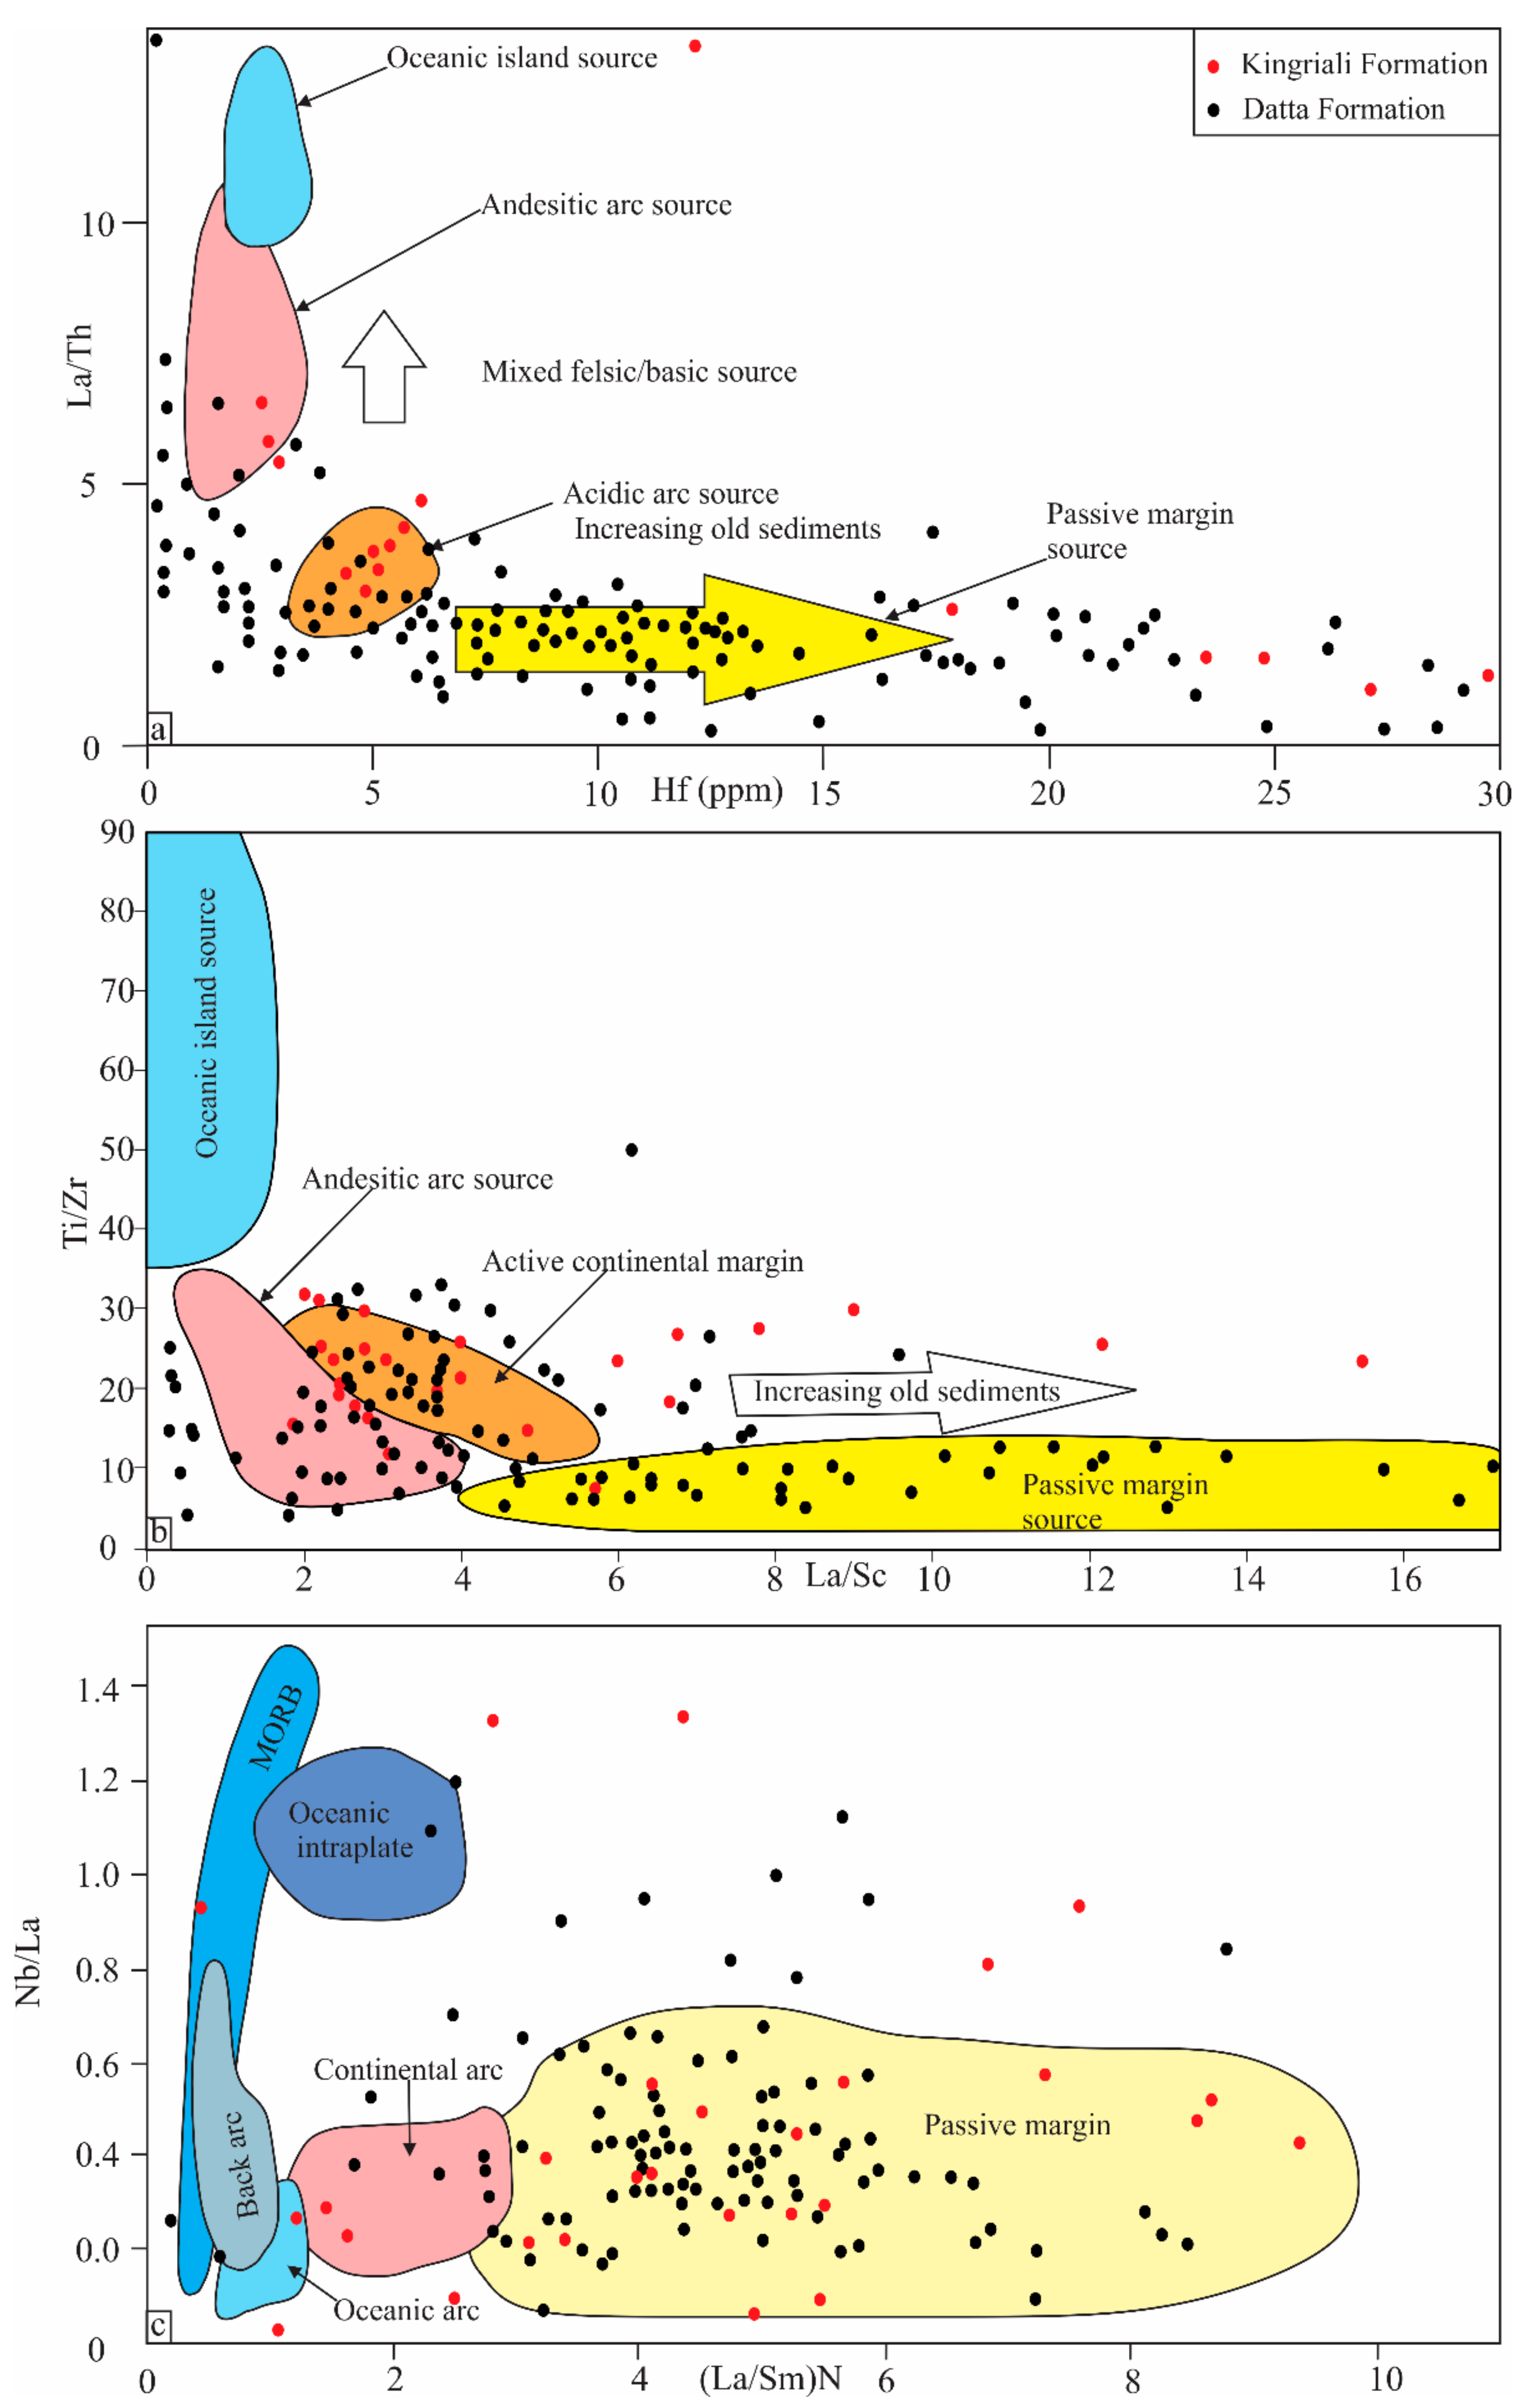
La/Th versus Hf(ppm), Ti/Zr versus La/Sc, and Nb/La versus (La/Sm)N Plots
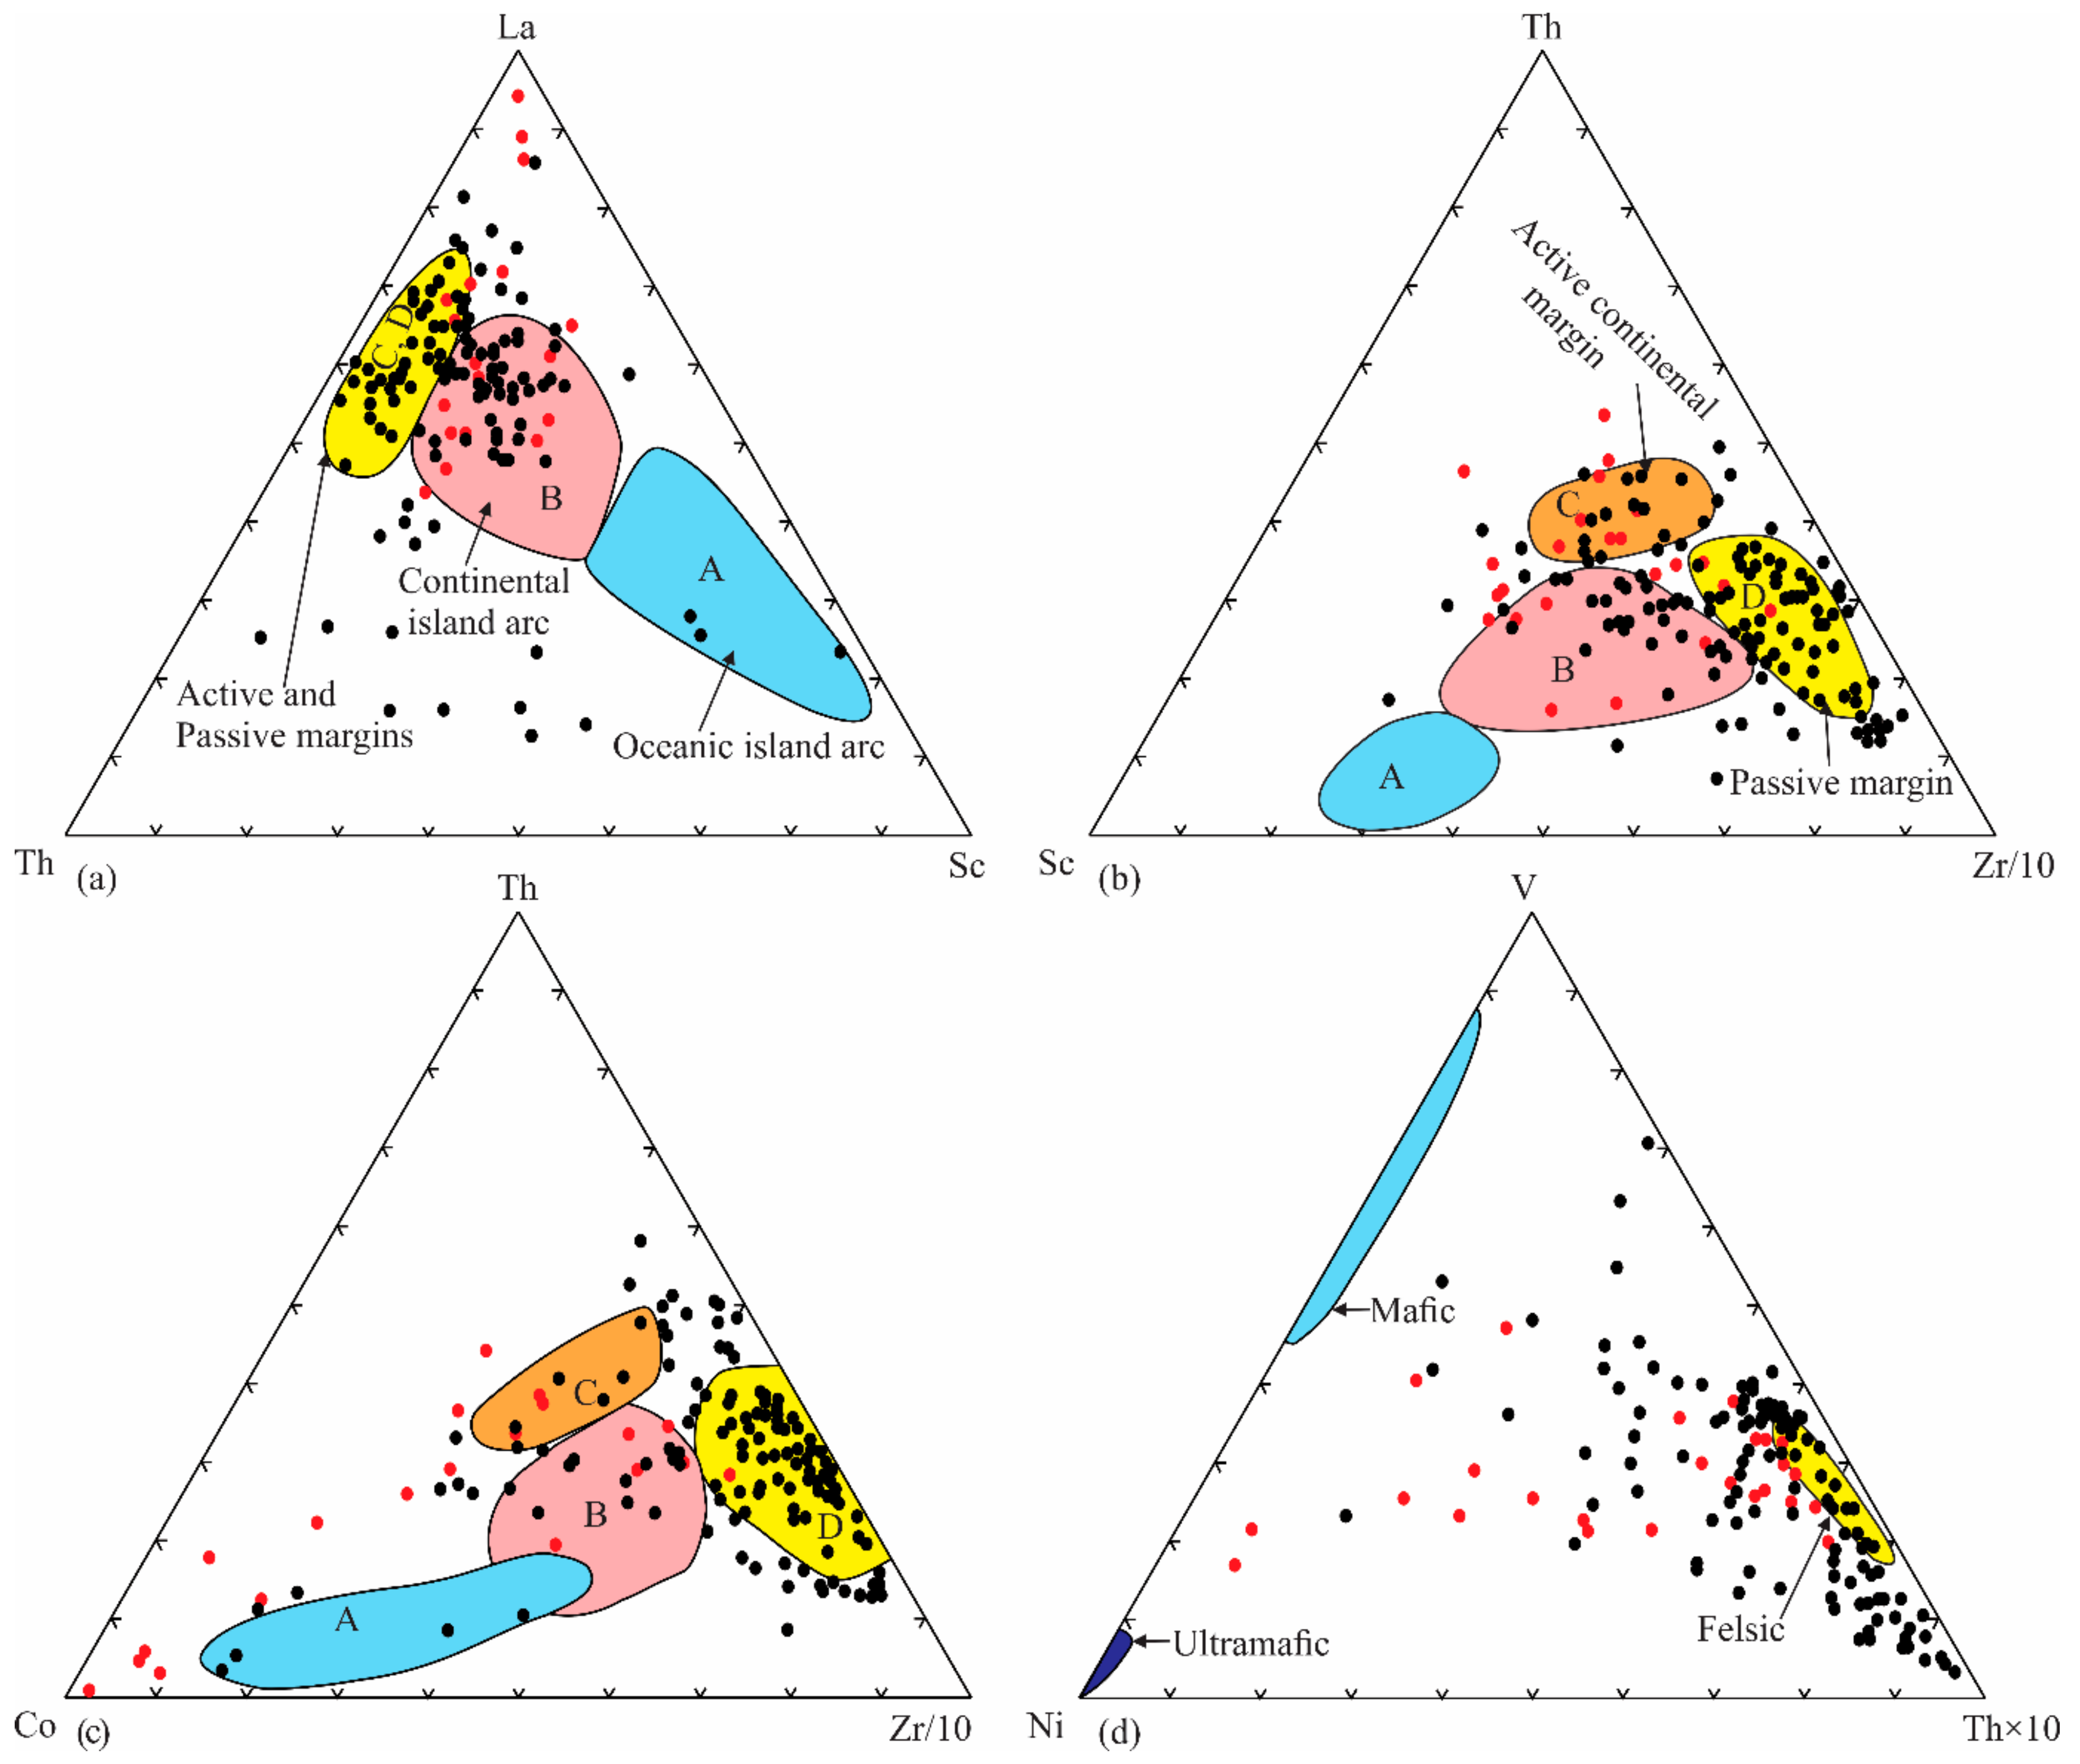
La–Th–Sc, Th–Sc–Zr/10, and Th–Co–Zr/10 Plots
4.4.2. Source Rock Composition Identification Plots
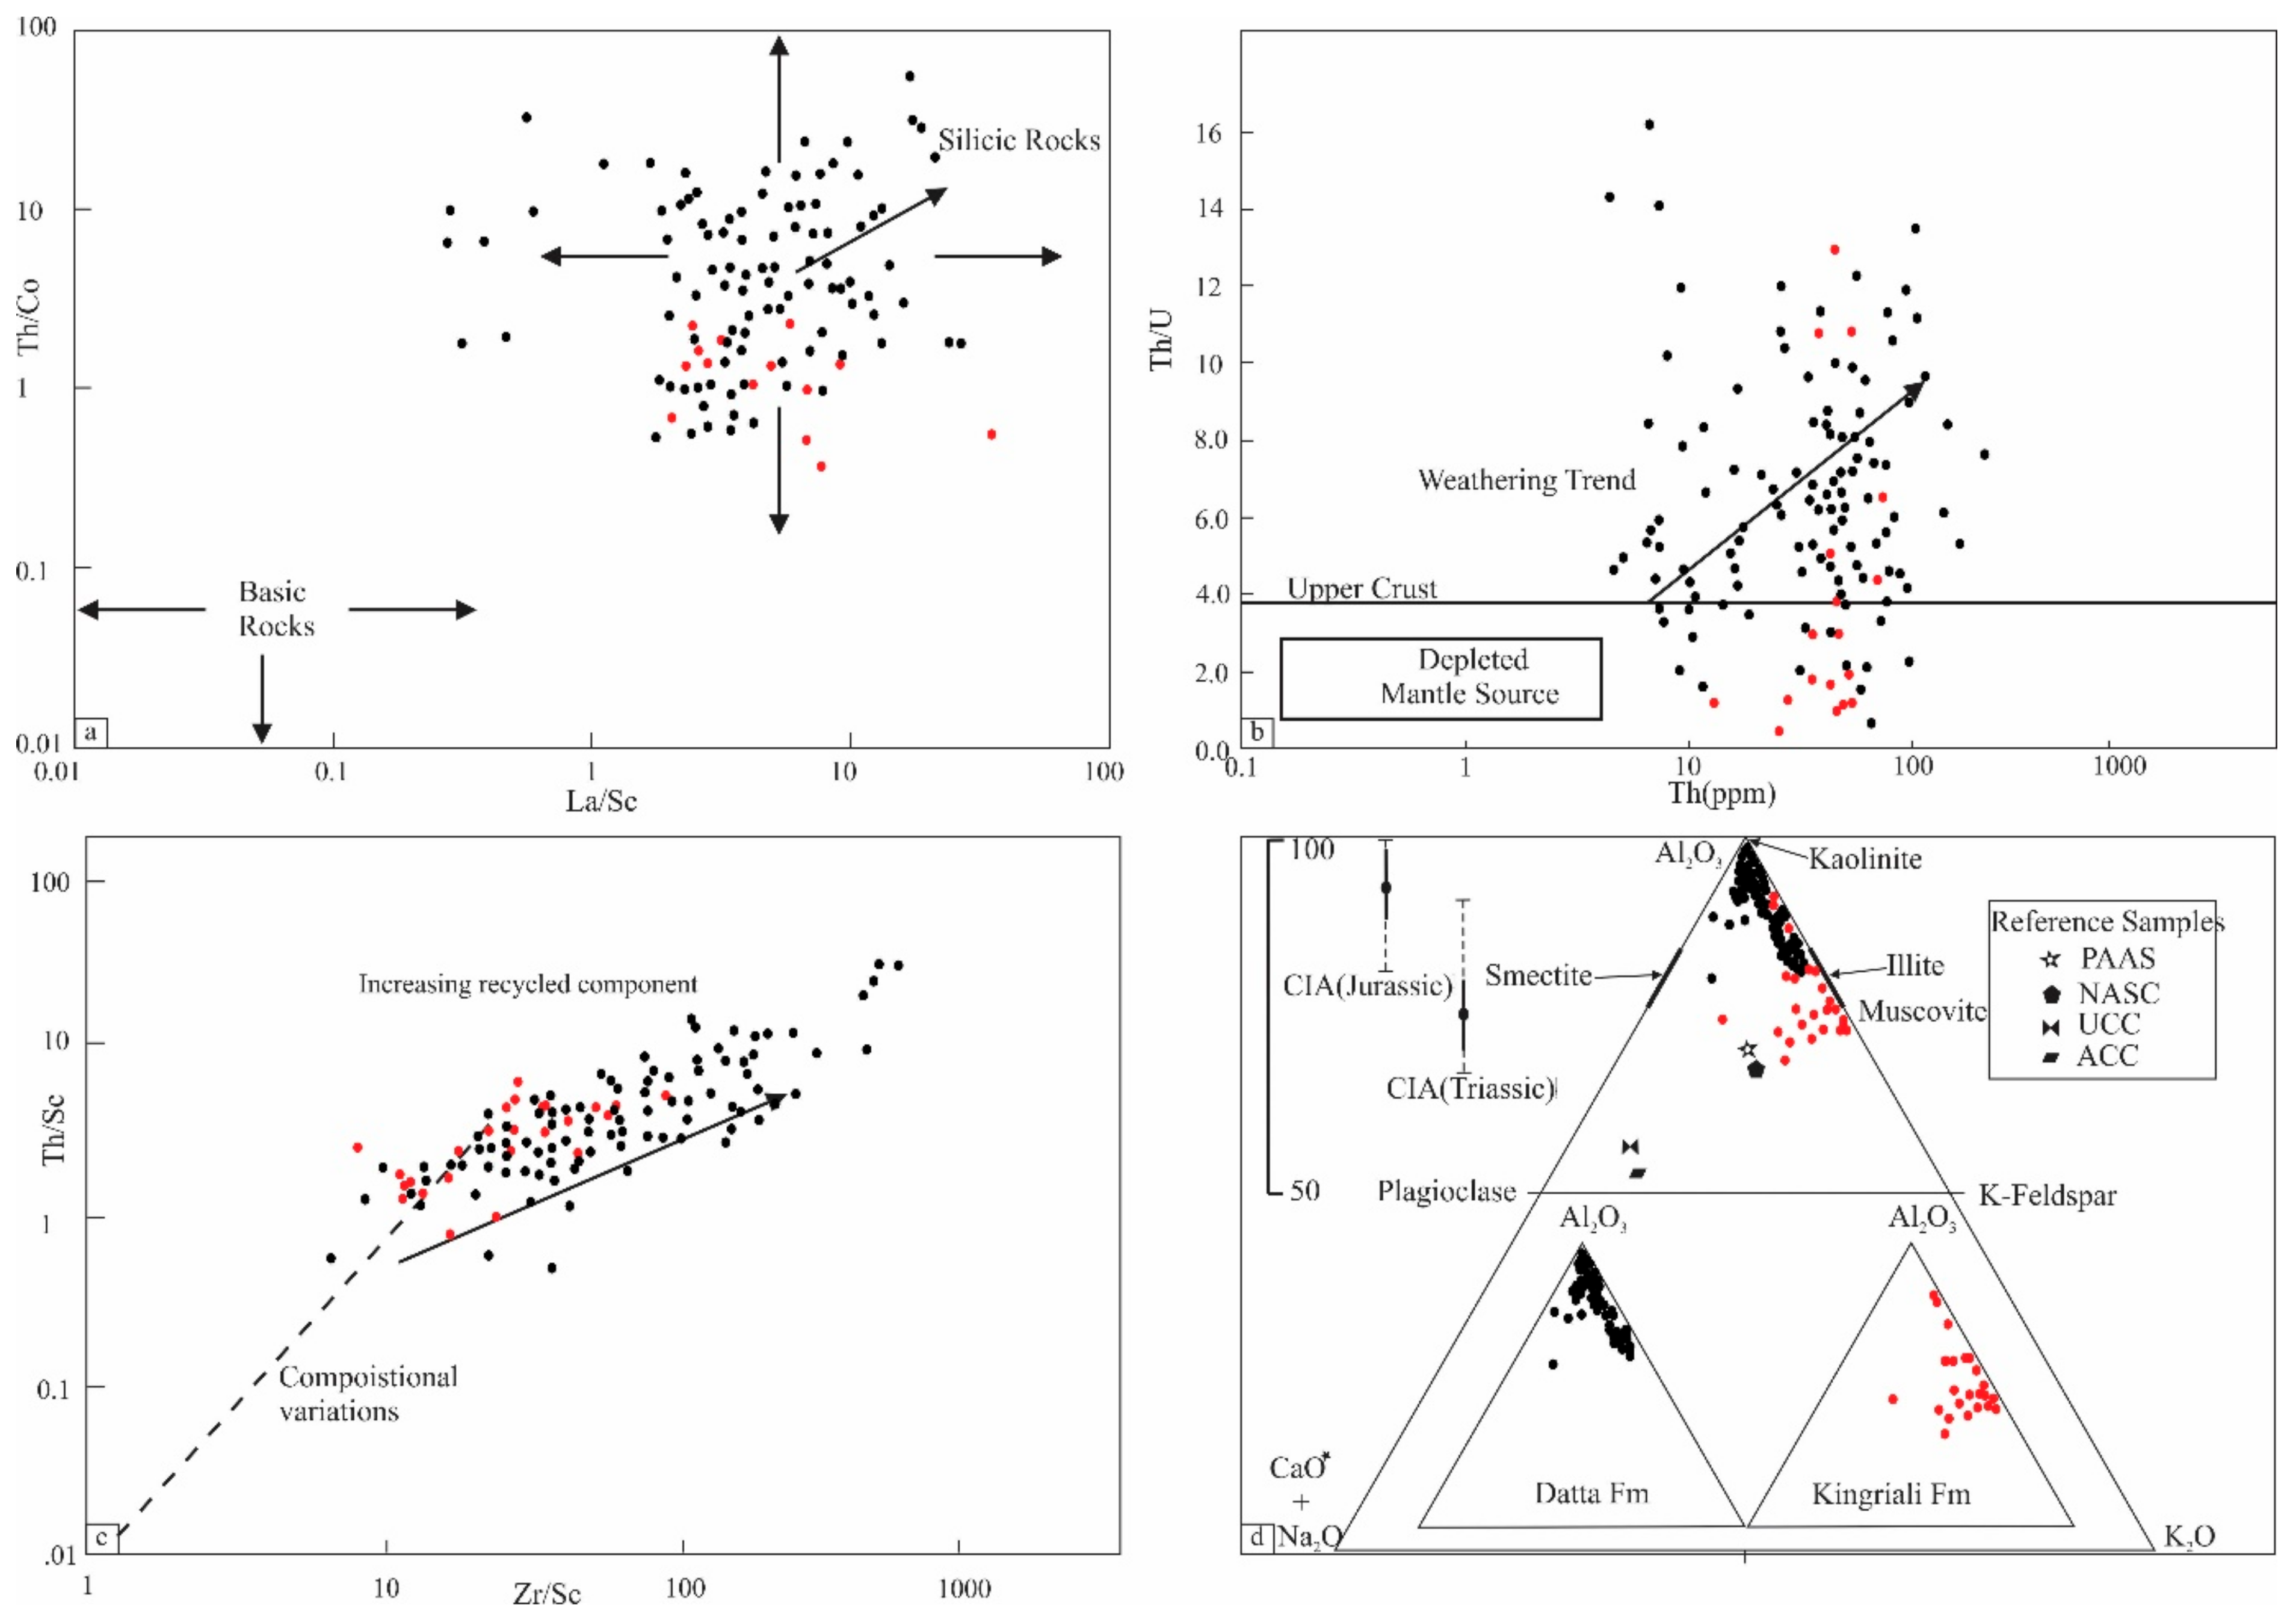
V–Ni–Th × 10 and Th/Co versus La/Sc Plots
4.4.3. Weathering and Recycling Trend
Chemical Index of Alteration (CIA) and A-CN-K Plot
Th/U versus Th(ppm) and Th/Sc versus Zr/Sc Plots
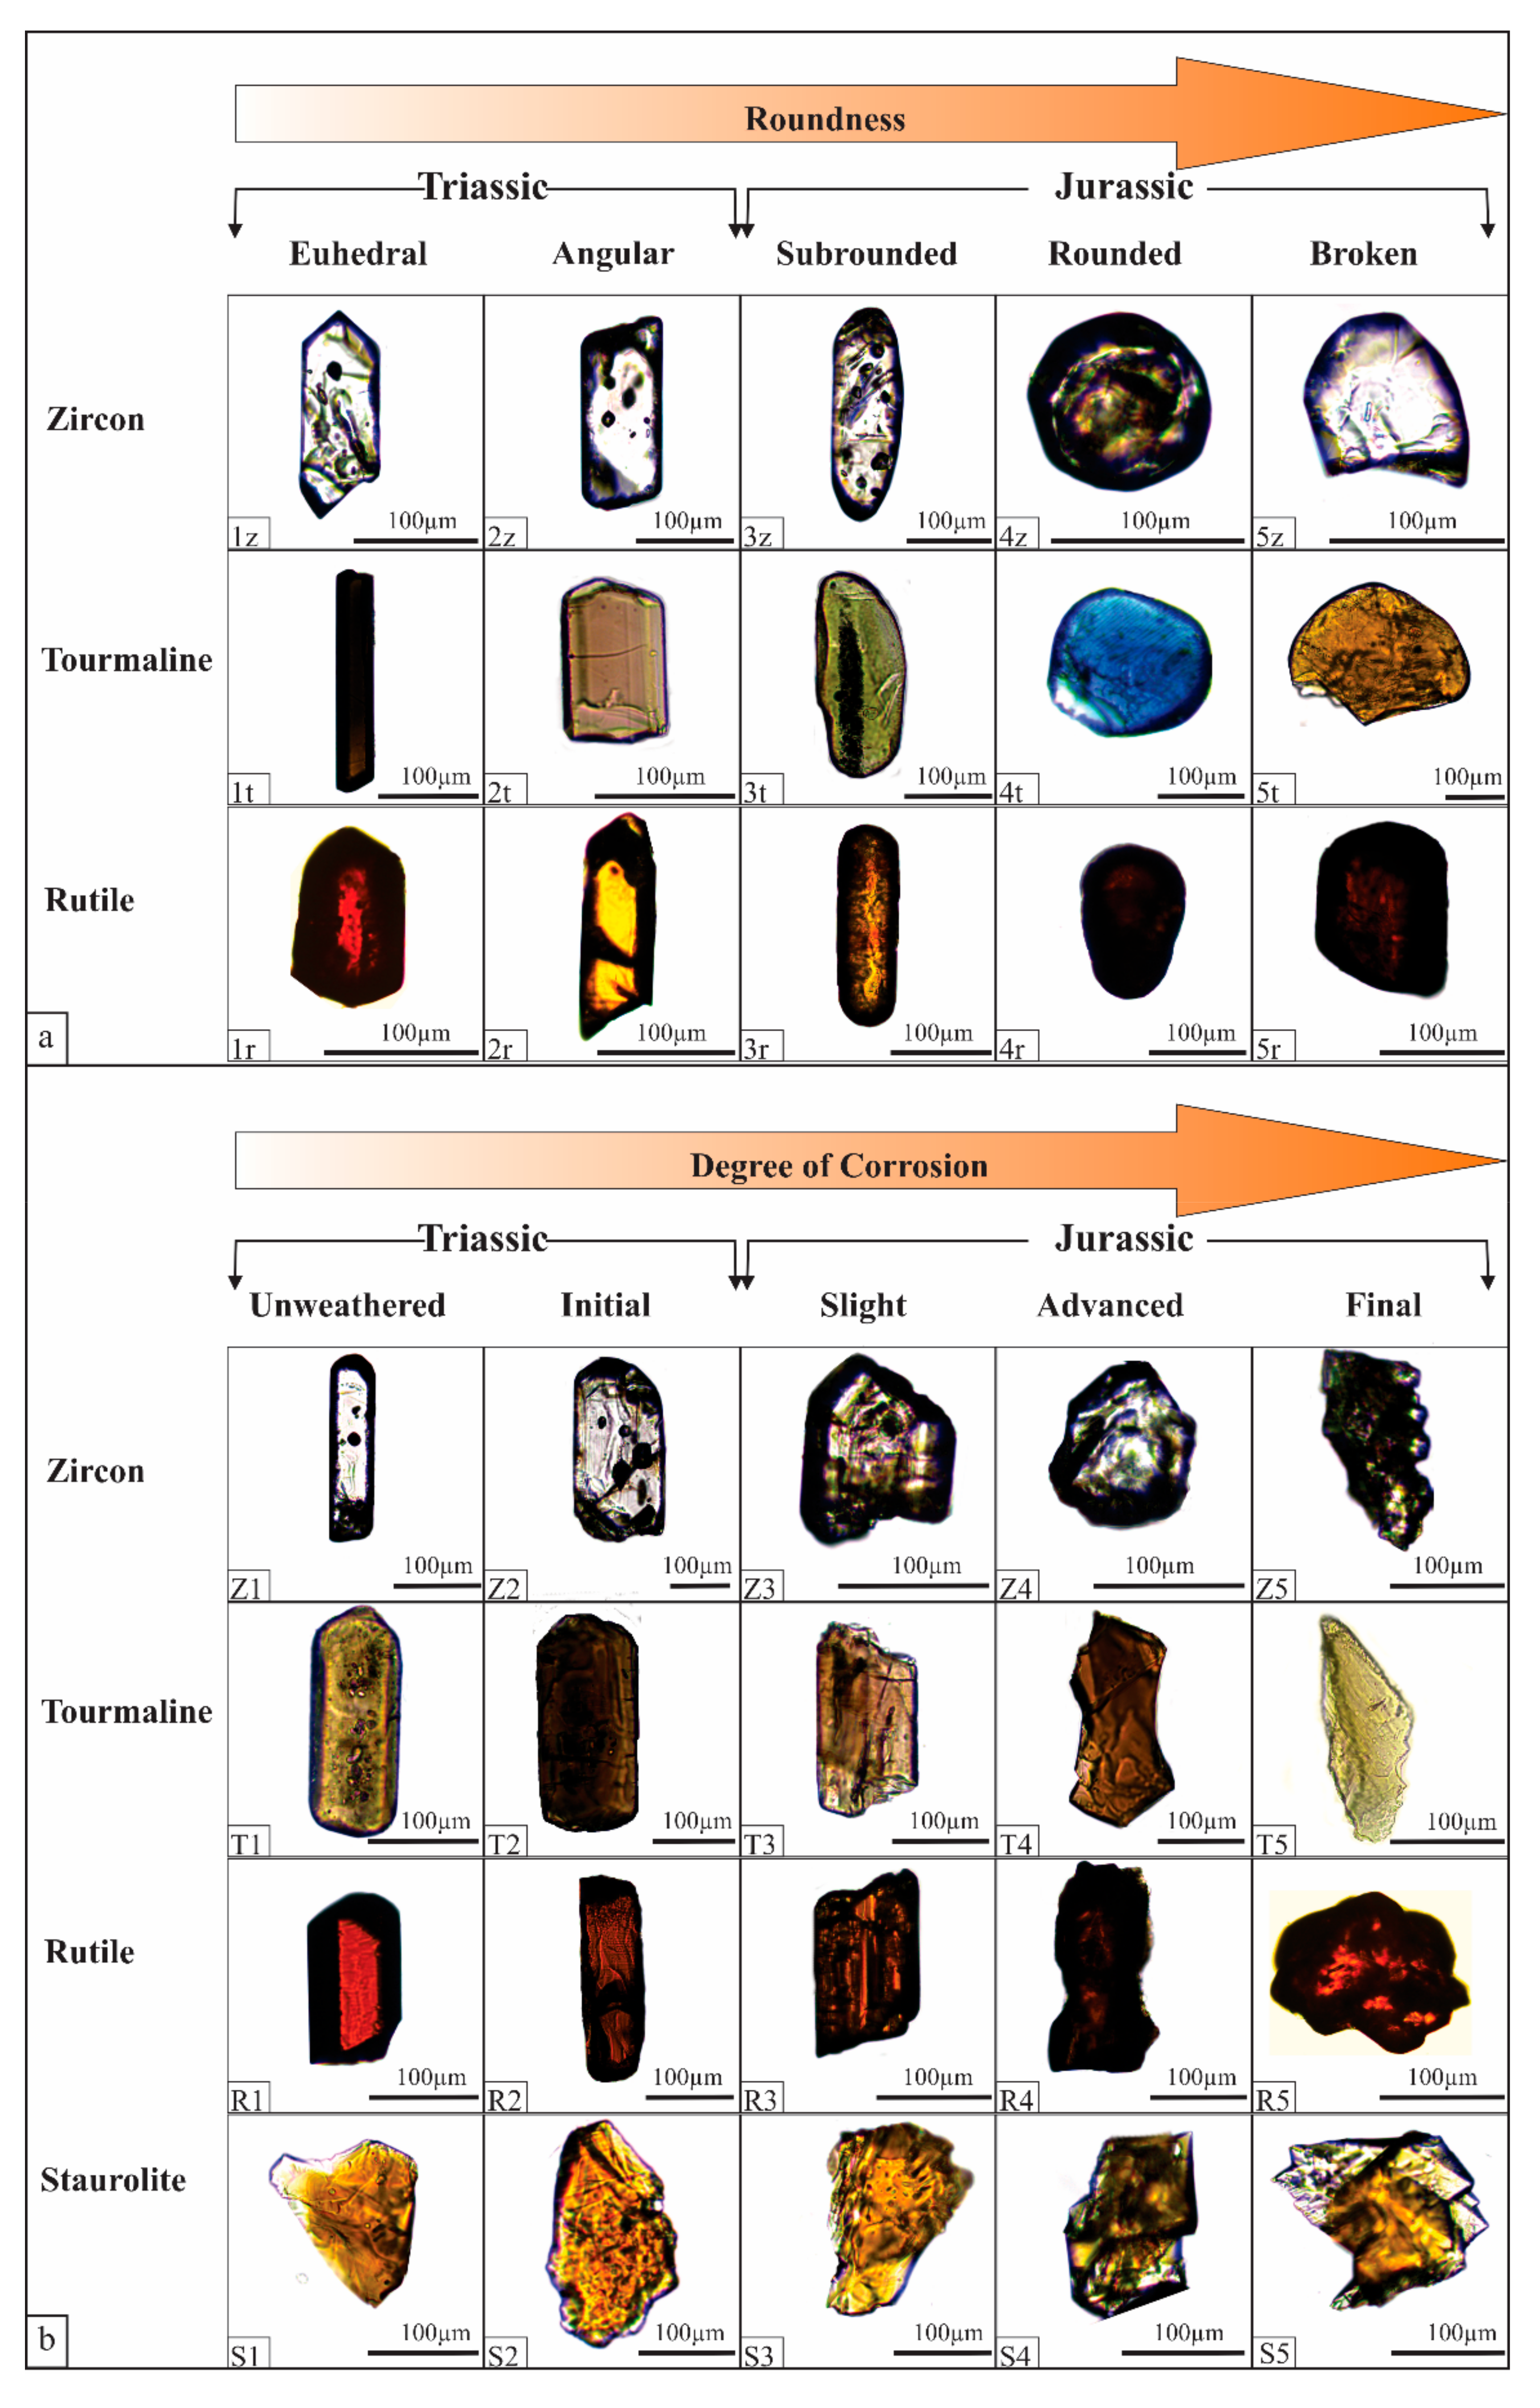
4.5. Heavy Minerals Analysis
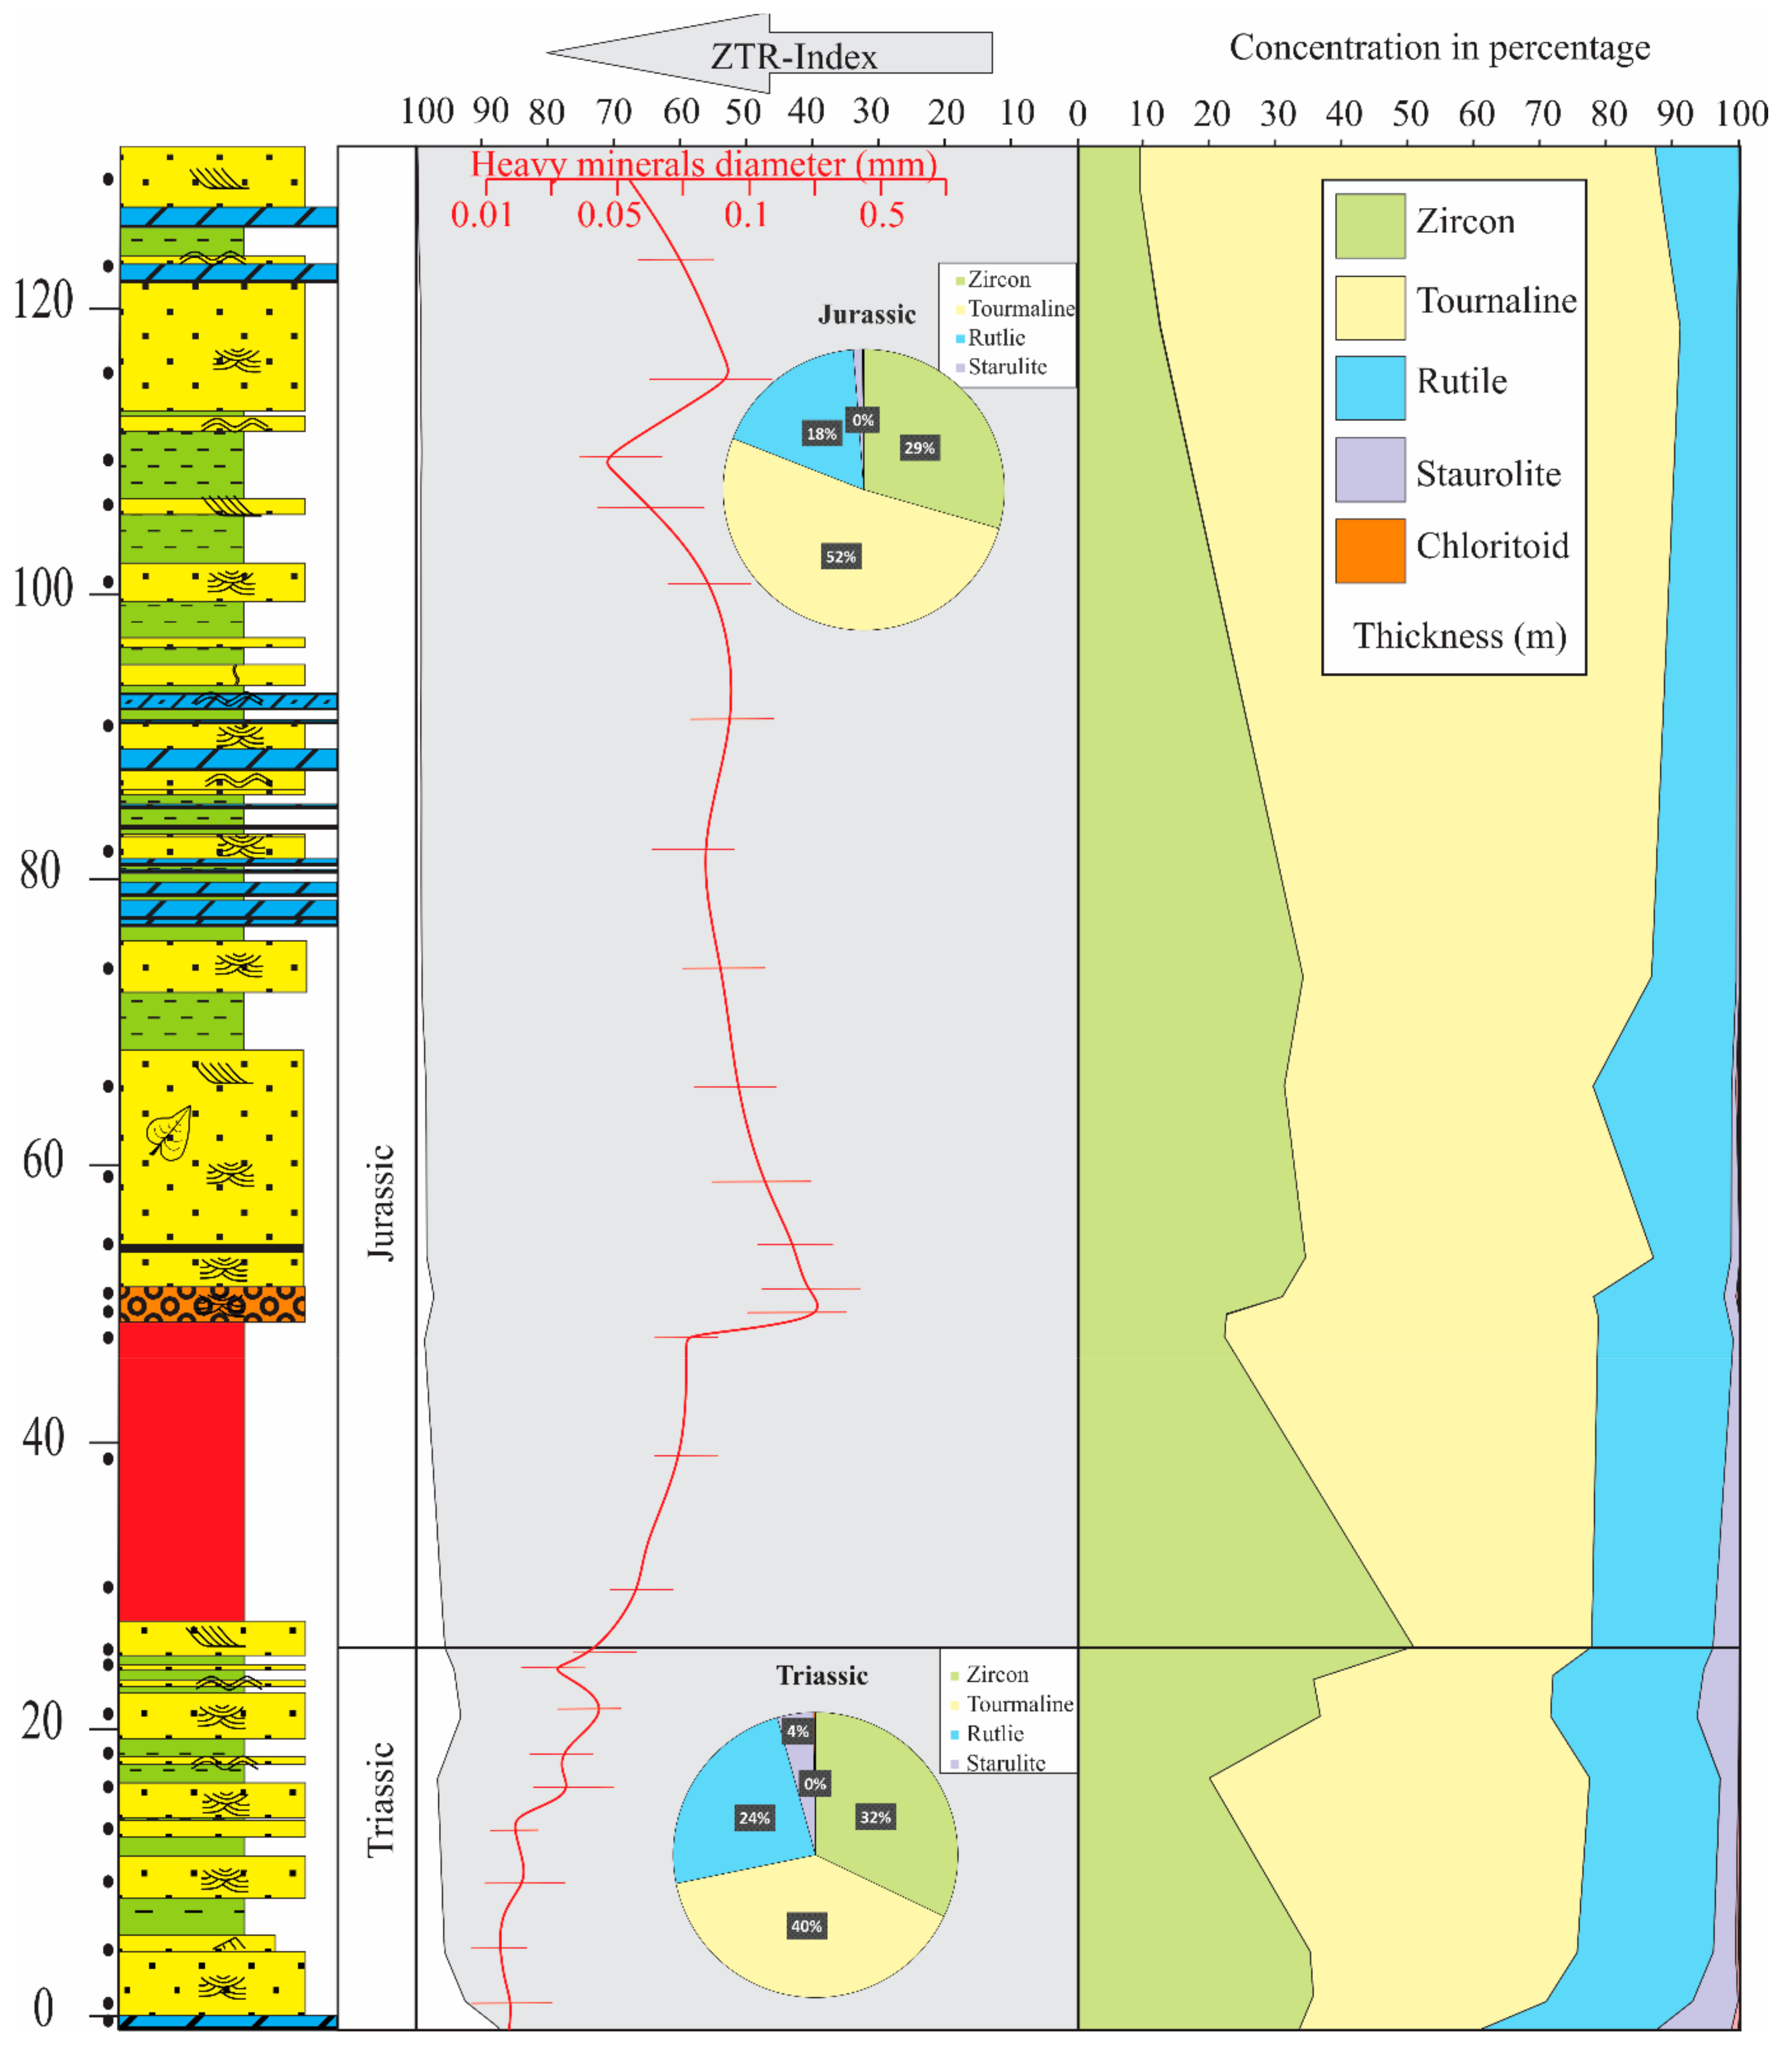
4.5.1. ZTR Index
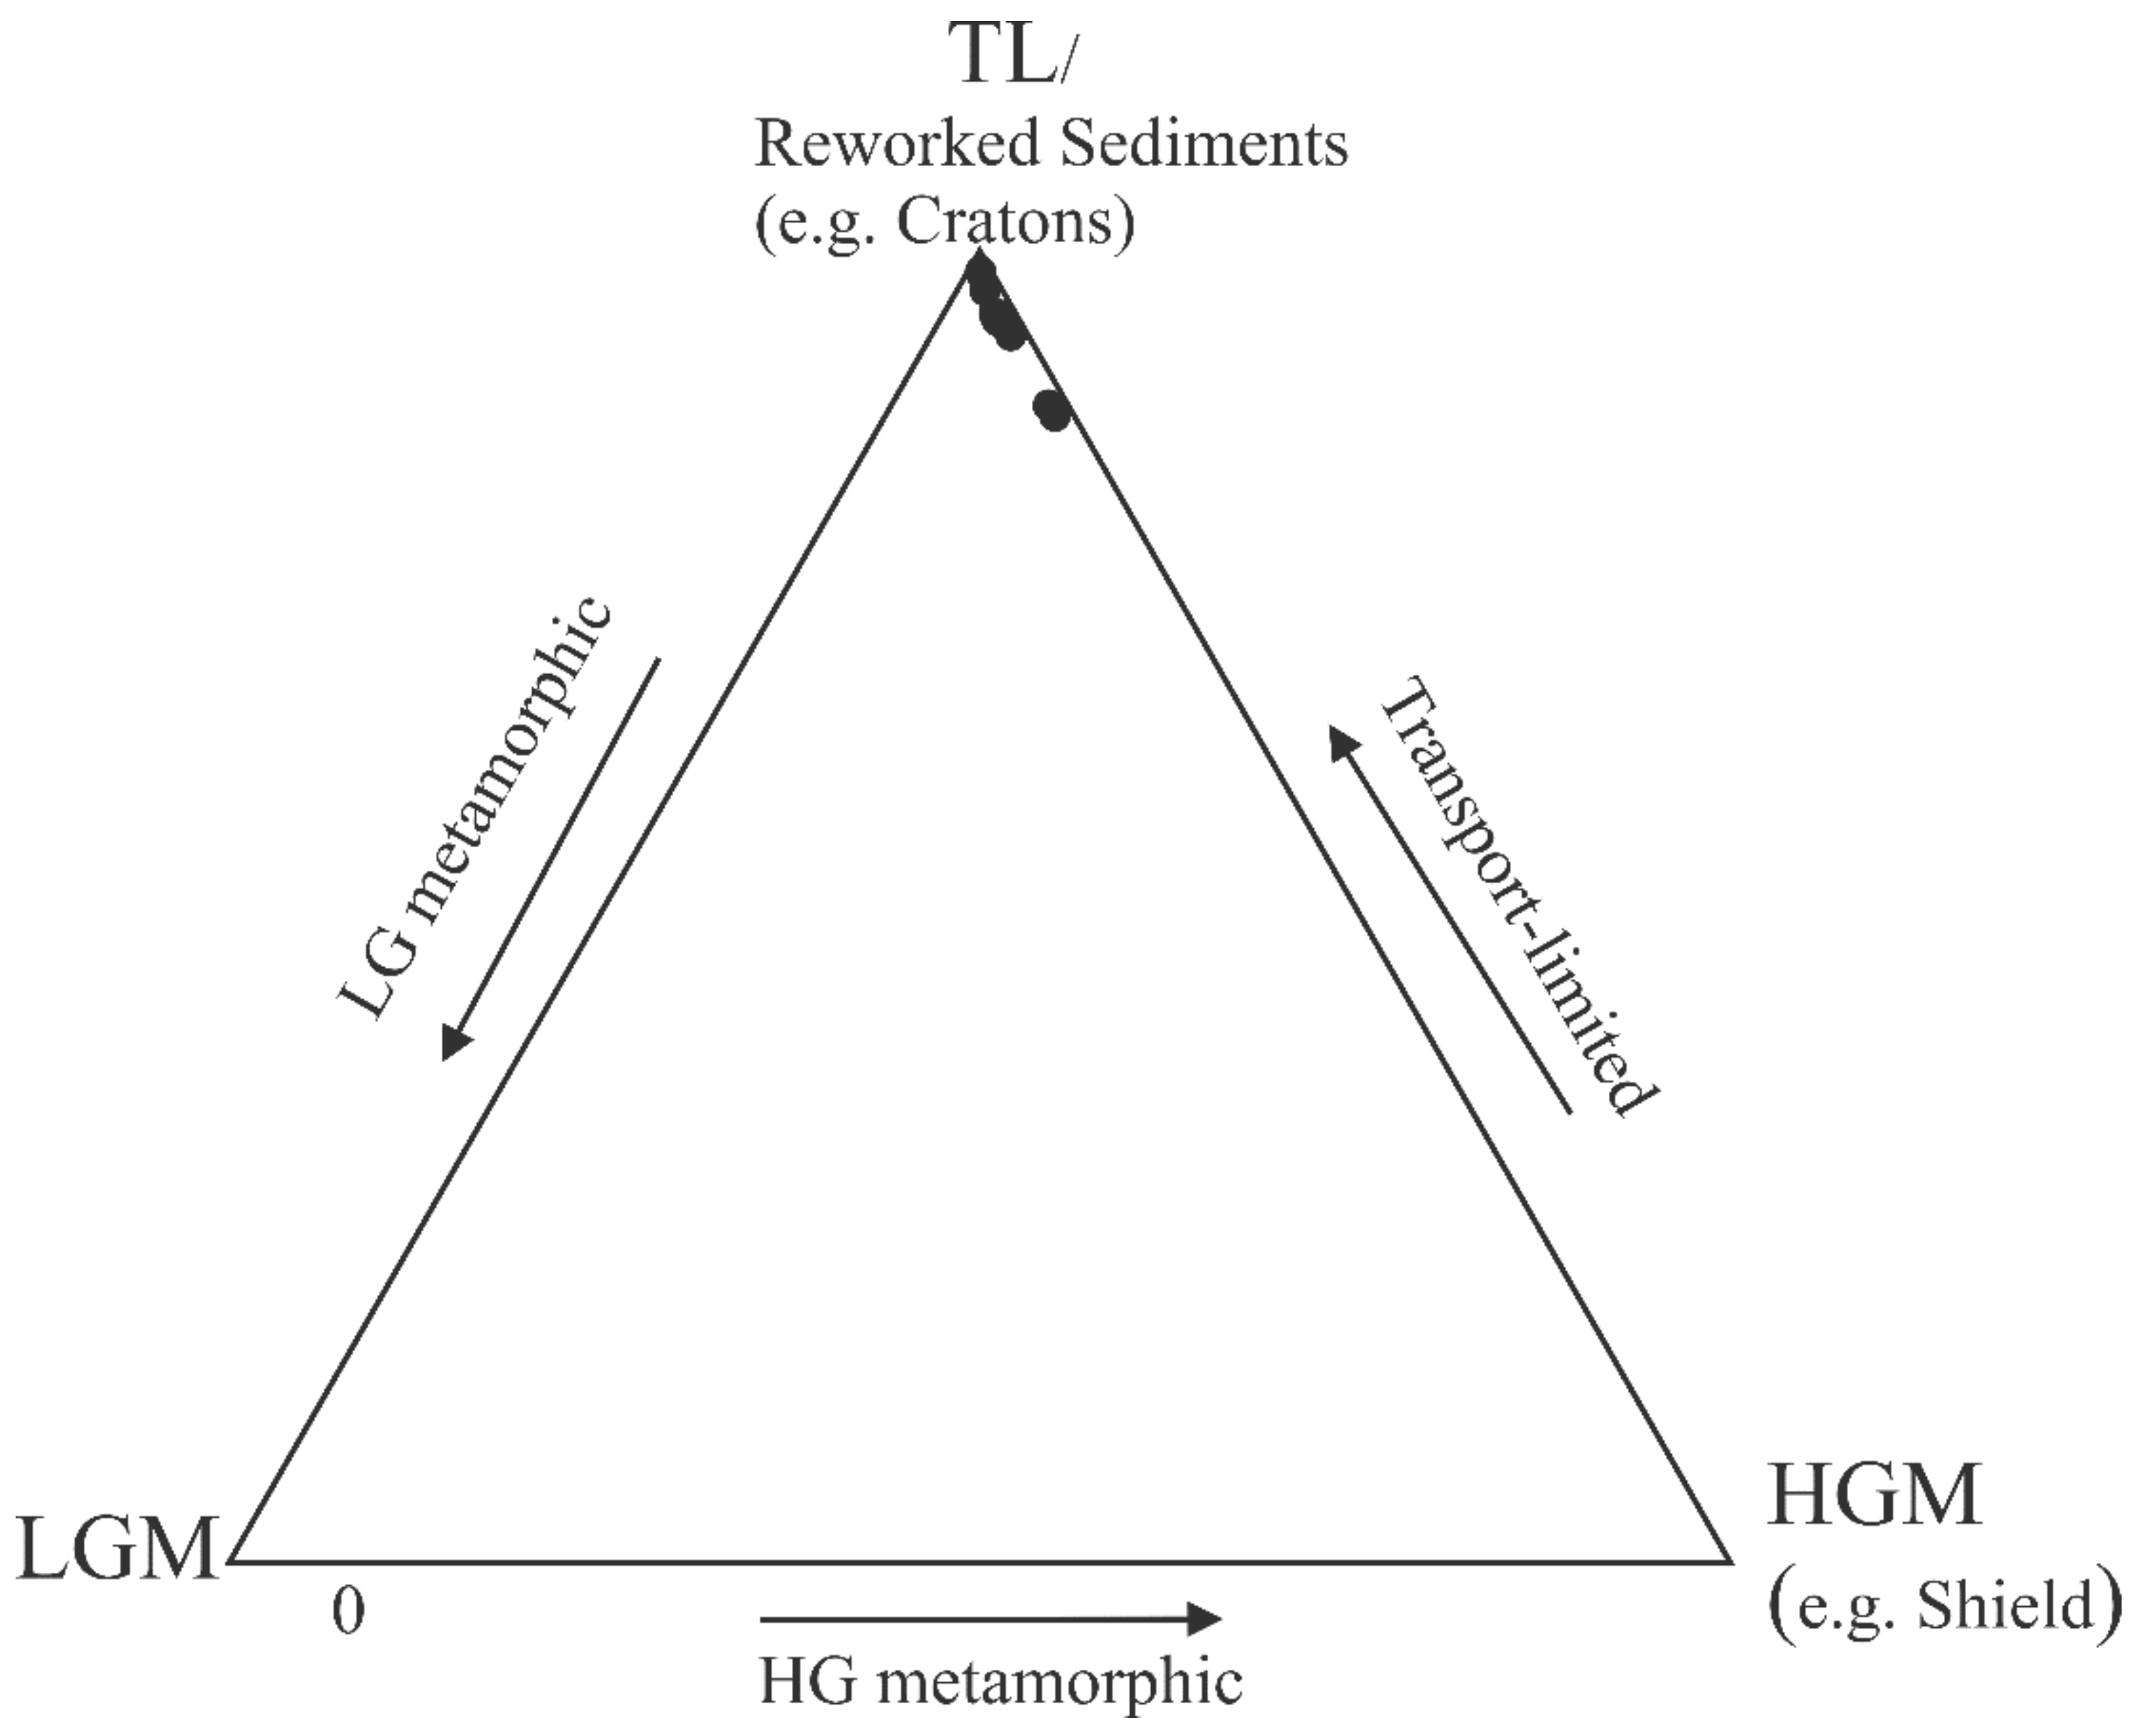
4.5.2. Tectonic Setting Using Heavy Minerals Plot
5. Interpretation and Discussion
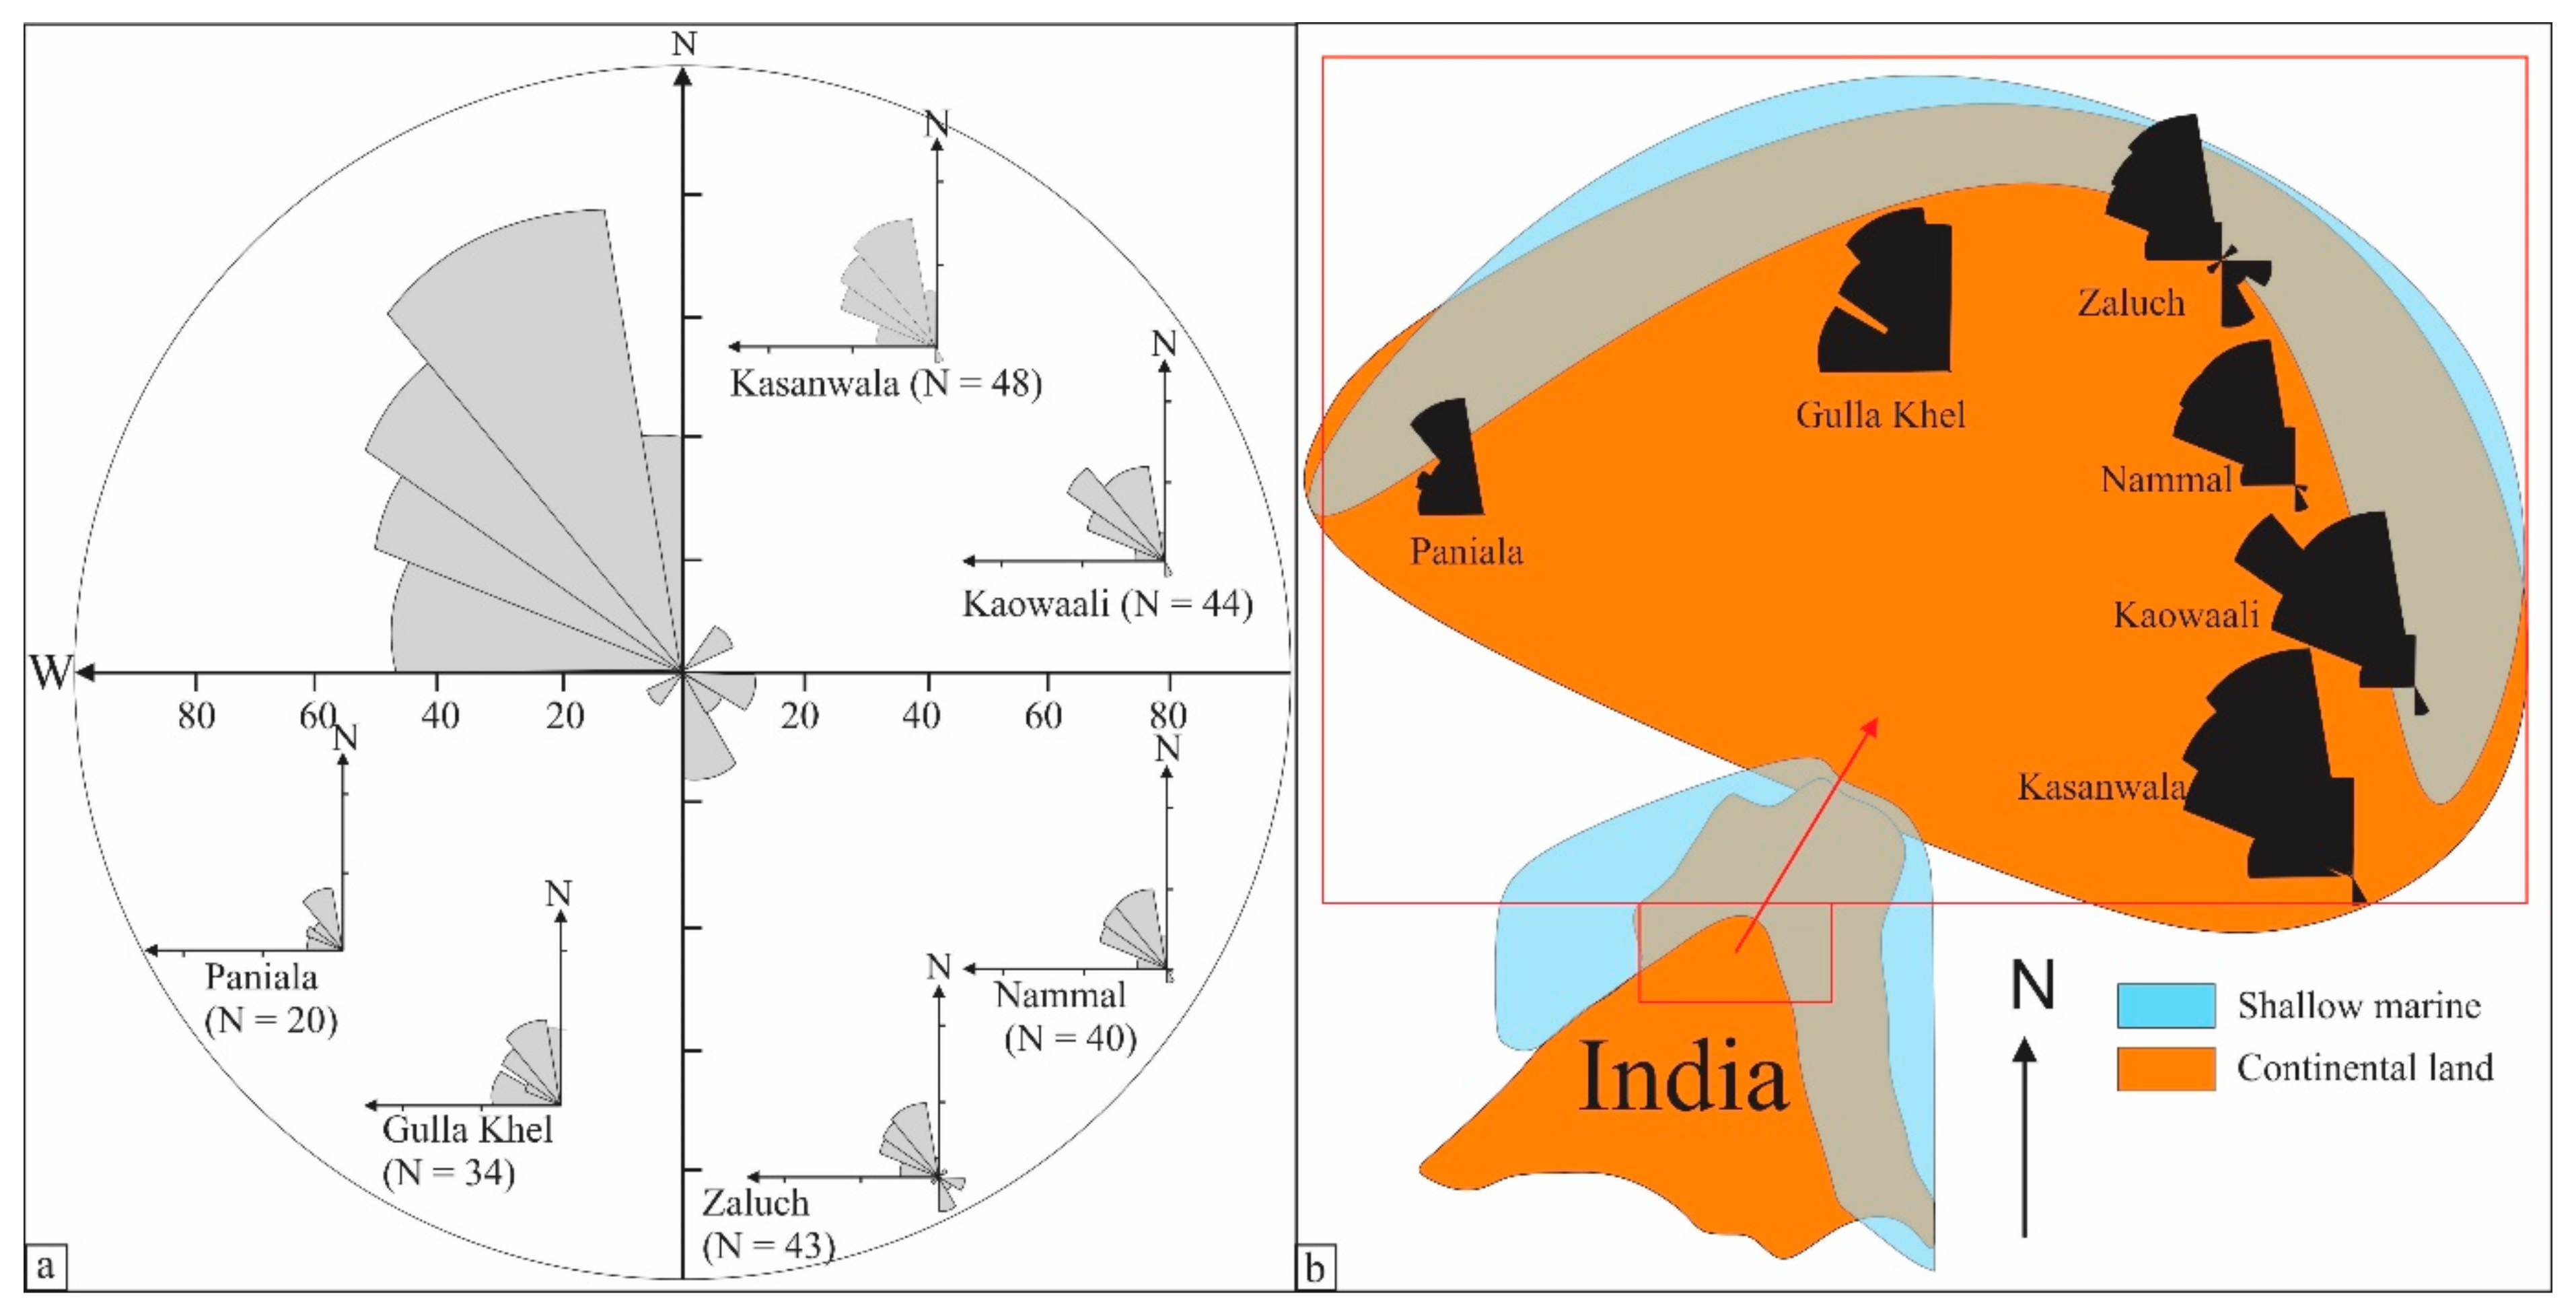
5.1. Sediments Transport Pathways
5.2. Tectonic Settings
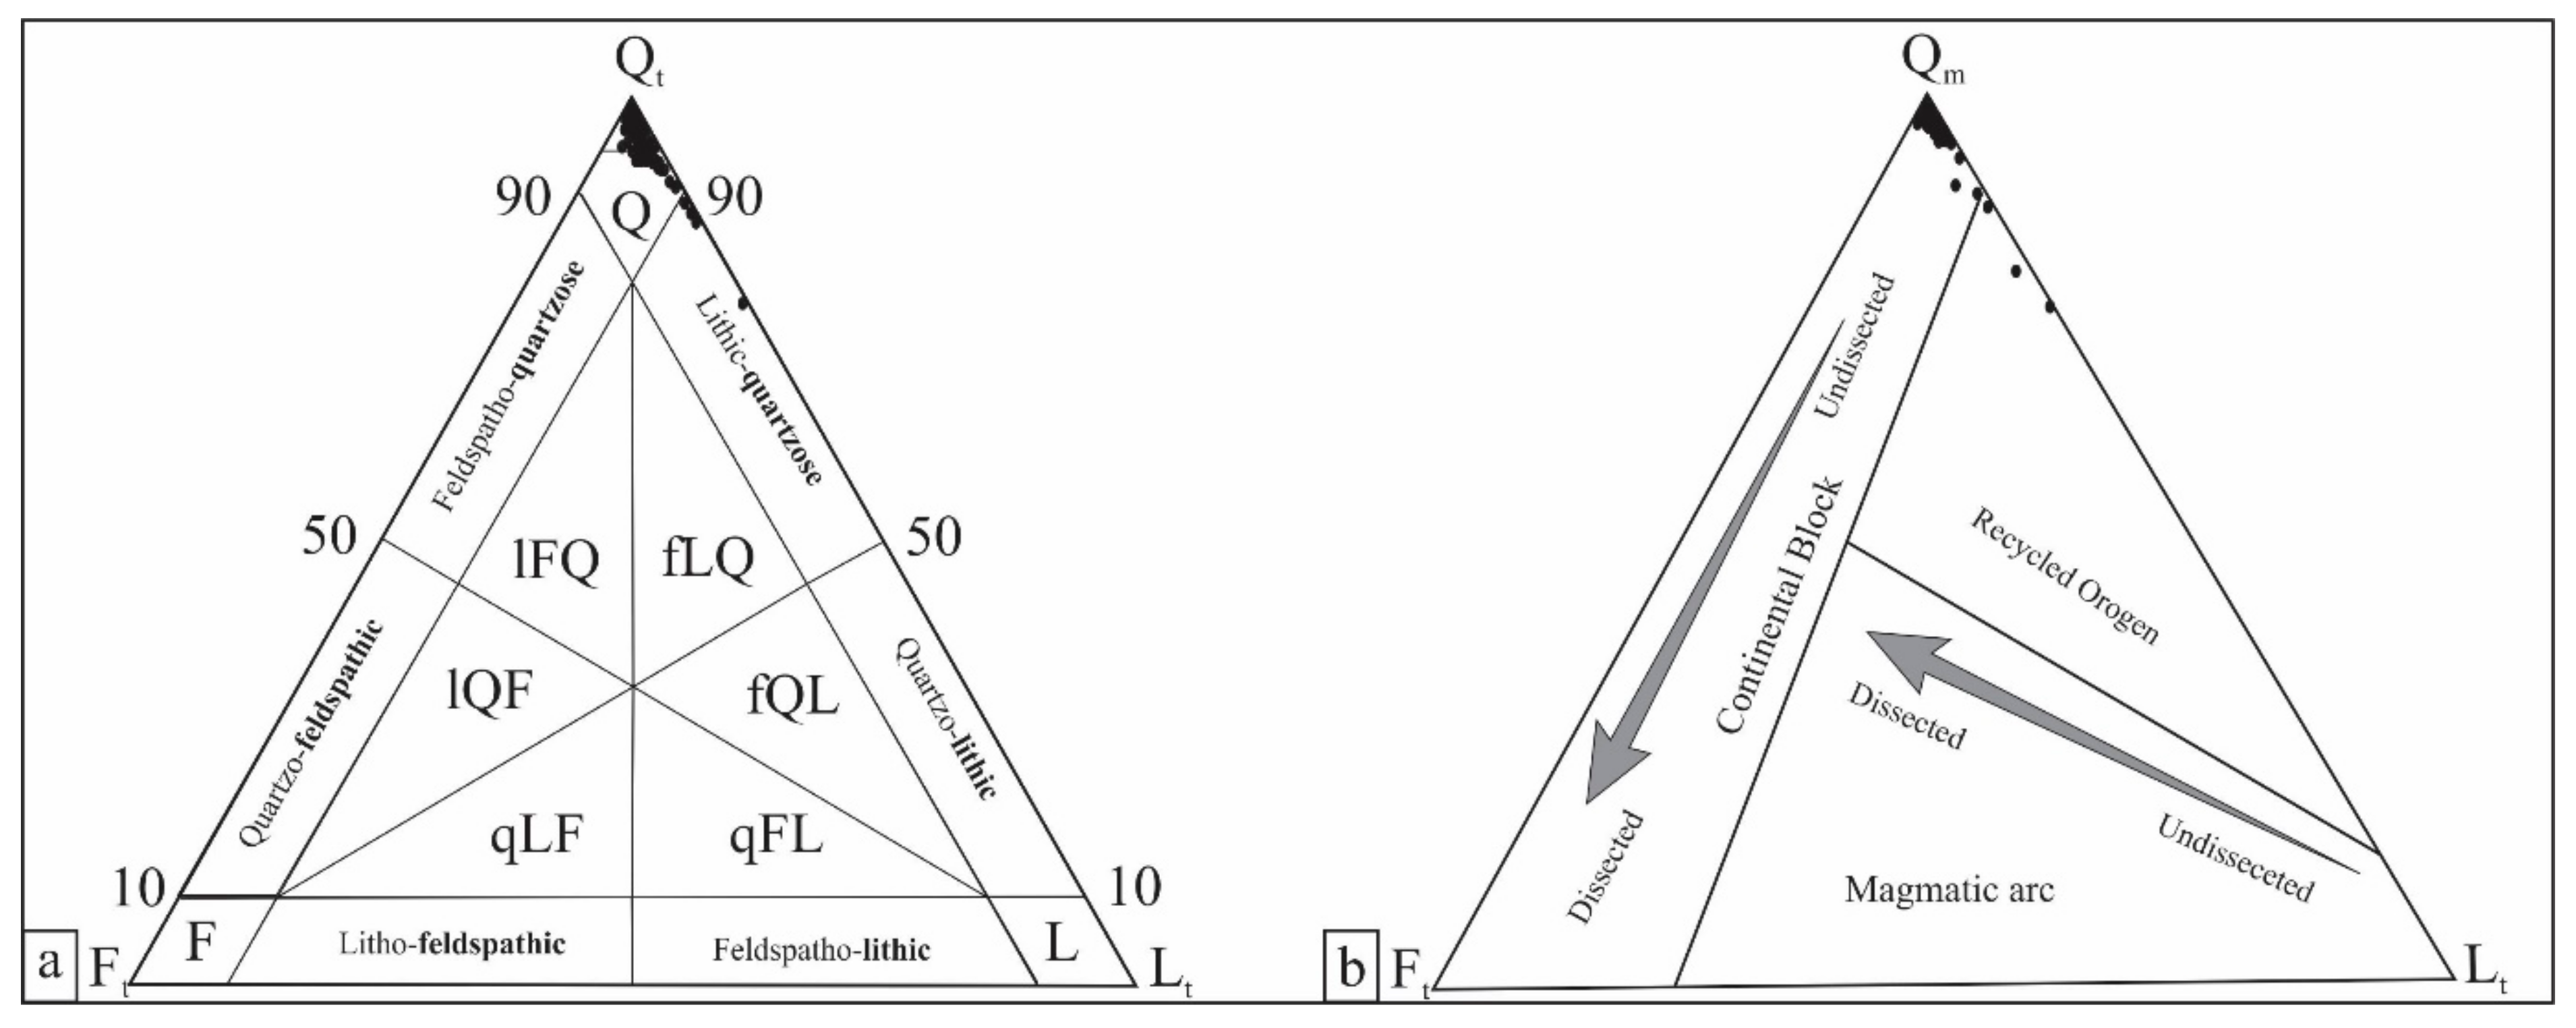
5.2.1. Quartz–Feldspars–Lithics (QFL) Plots
5.2.2. La/Th versus Hf(ppm) and Ti/Zr versus La/Sc and Nb/La versus (La/Sm)N Plots
5.2.3. La–Th–Sc, Th–Sc–Zr/10, and Th–Co–Zr/10 Plots
5.3. Source Compositions Identification
V–Ni–Th × 10 and Th/Co versus La/Sc Plots
5.4. Weathering and Recycling Trend
5.4.1. Clay Mineralogy
5.4.2. CIA and A-CN-K Plots
5.4.3. Th/U versus Th(ppm) and Th/Zr versus Zr/Sc Plots
5.5. Heavy Minerals and Weathering and Tectonics
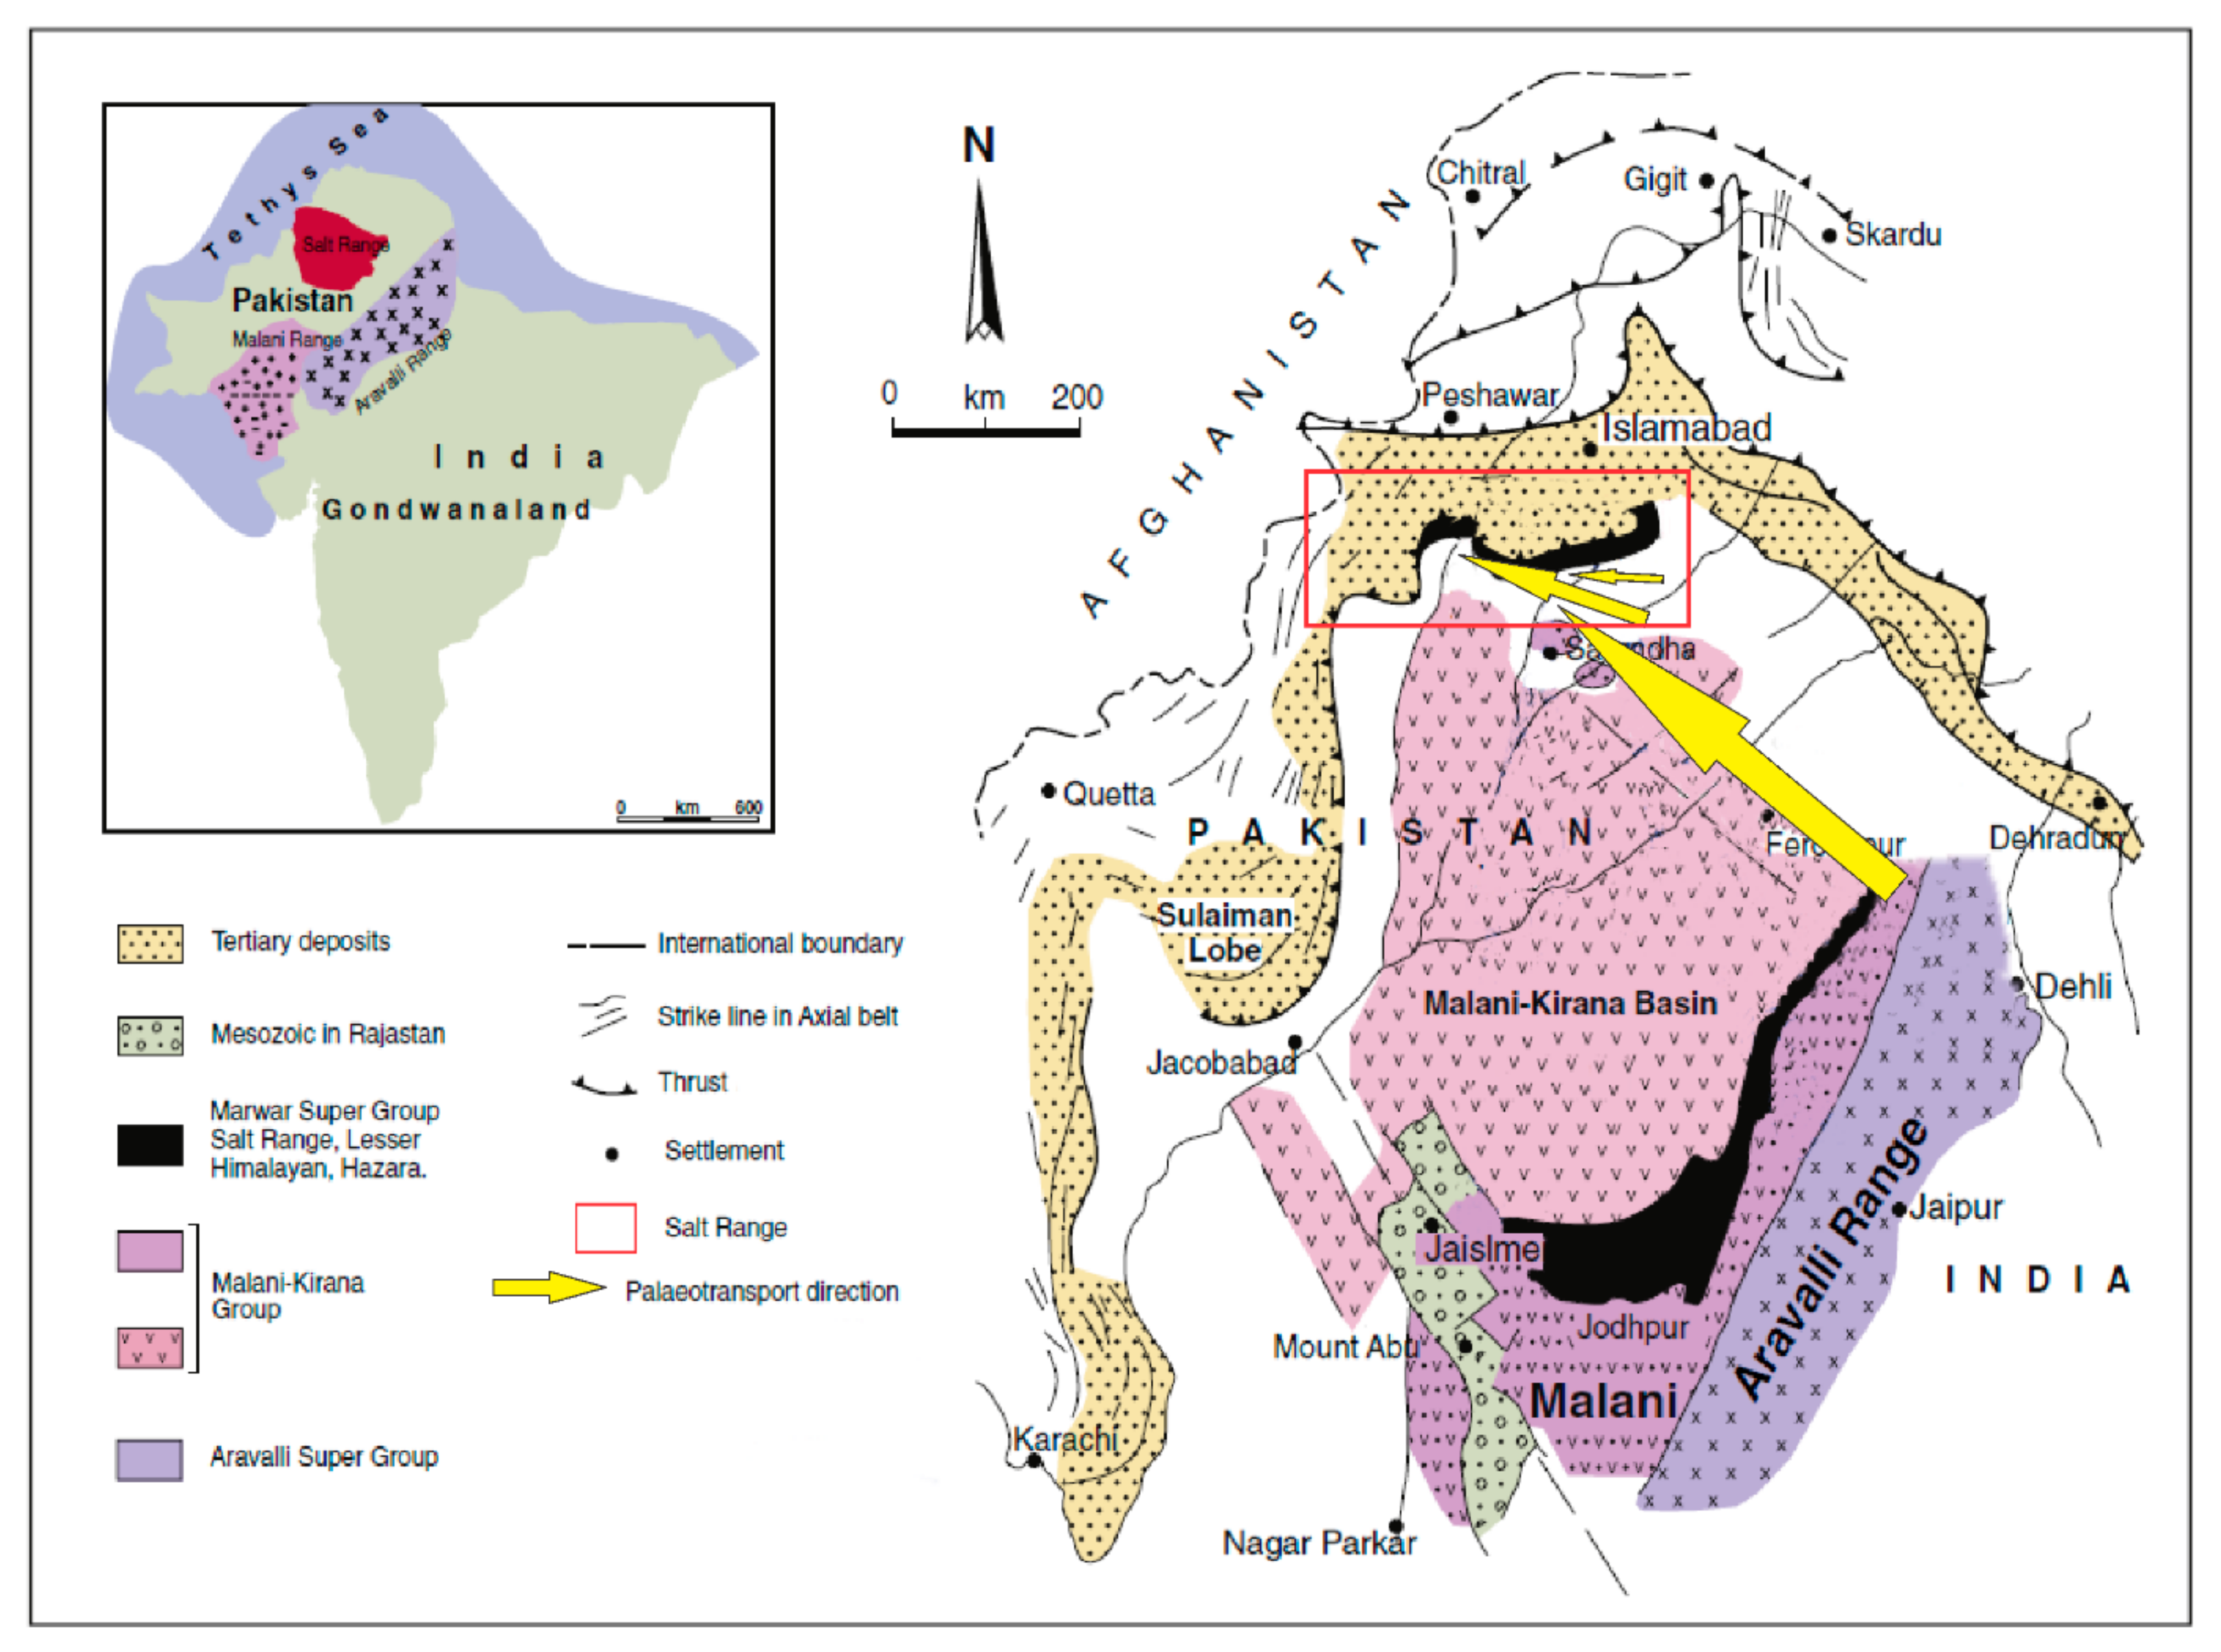
5.6. Palaeogeography and Possible Detritus Suppliers
5.7. Correlation with Northern Indian Passive Tethyan Margin
5.8. Possible Sediment Suppliers
6. Conclusions
Supplementary Materials
Author Contributions
Funding
Institutional Review Board Statement
Informed Consent Statement
Data Availability Statement
Acknowledgments
Conflicts of Interest
References
- Schlische, R.W.; Withjack, M.O.; Olsen, P.E. Relative timing of CAMP, rifting, continental breakup, and basin inversion: Tectonic significance. In The Central Atlantic Magmatic Province, Insights from Fragments of Pangea; Geophysical Monograph; Hames, W.E., McHone, J.G., Renne, P.R., Ruppel, C., Eds.; American Geophysical Union: Washington, DC, USA, 2003; Volume 136, pp. 33–59. [Google Scholar] [CrossRef]
- De Lamotte, D.F.; Fourdan, B.; Leleu, S.; Leparmentier, F.; De Clarens, P. Style of rifting and the stages of Pangea breakup. Tectonics 2015, 34, 1009–1029. [Google Scholar] [CrossRef]
- Peace, A.L.; Phethean, J.; Franke, D.; Foulger, G.; Schiffer, C.; Welford, J.; McHone, G.; Rocchi, S.; Schnabel, M.; Doré, A. A review of Pangaea dispersal and Large Igneous Provinces—In search of a causative mechanism. Earth Sci. Rev. 2020, 206, 102902. [Google Scholar] [CrossRef]
- Withjack, M.O.; Schlische, R.W.; Olsen, P.E. Diachronous rifting, drifting, and inversion on the passive margin of central eastern North America: An analog for other passive margins. AAPG Bull. 1998, 82, 817–835. [Google Scholar]
- Marzoli, A.; Renne, P.R.; Piccirillo, E.M.; Ernesto, M.; Bellieni, G.; De Min, A. Extensive 200-Million-Year-Old Continental Flood Basalts of the Central Atlantic Magmatic Province. Science 1999, 284, 616–618. [Google Scholar] [CrossRef] [PubMed]
- Olsen, P.E. Giant lava flows, mass extinctions, and mantle plumes. Science 1999, 284, 604–605. [Google Scholar] [CrossRef]
- Petersen, K.D.; Schiffer, C. Wilson cycle passive margins: Control of orogenic inheritance on continental breakup. Gondwana Res. 2016, 39, 131–144. [Google Scholar] [CrossRef]
- Sepkowski, J.J. Biodiversity: Past, present, and future. J. Paleontol. 1997, 71, 533–539. [Google Scholar] [CrossRef] [PubMed]
- Hallam, A. A review of the broad pattern of Jurassic sea-level changes and their possible causes in the light of current knowledge. Palaeogeogr. Palaeoclim. Palaeoecol. 2001, 167, 23–37. [Google Scholar] [CrossRef]
- Haq, B.U. Jurassic Sea-Level Variations: A Reappraisal. GSA Today 2017, 28, 4–10. [Google Scholar] [CrossRef]
- Hallam, A. Mass extinctions and sea-level changes. Earth Sci. Rev. 1999, 48, 217–250. [Google Scholar] [CrossRef]
- Ludwig, W.; Amiotte-Suchet, P.; Probst, J.-L. Enhanced chemical weathering of rocks during the last glacial maximum: A sink for atmospheric CO2? Chem. Geol. 1999, 159, 147–161. [Google Scholar] [CrossRef]
- Hallam, T.; Wignall, P.; Hesselbo, S.P.; Robinson, S.A.; Surlyk, F. Discussion on sea-level change and facies development across potential Triassic–Jurassic boundary horizons, SW Britain. J. Geol. Soc. 2004, 161, 1053–1056. [Google Scholar] [CrossRef]
- Zajzon, N.; Kristály, F.; Pálfy, J.; Németh, T. Detailed clay mineralogy of the Triassic-Jurassic boundary section at Kendlbachgraben (Northern Calcareous Alps, Austria). Clay Miner. 2012, 47, 177–189. [Google Scholar] [CrossRef]
- Iqbal, S.; Wagreich, M.; Irfan U, J.; Kuerschner, W.M.; Gier, S.; Bibi, M. Hot-house climate during the Triassic/Jurassic transition: The evidence of climate change from the southern hemisphere (Salt Range, Pakistan). Glob. Planet. Chang. 2019, 172, 15–32. [Google Scholar] [CrossRef]
- Sciunnach, D.; Garzanti, E. Subsidence history of the Tethys Himalaya. Earth Science Rev. 2012, 111, 179–198. [Google Scholar] [CrossRef]
- Yin, A.; Harrison, T.M. Geologic Evolution of the Himalayan-Tibetan Orogen. Annu. Rev. Earth Planet. Sci. 2000, 28, 211–280. [Google Scholar] [CrossRef]
- Yin, A. Cenozoic tectonic evolution of the Himalayan orogen as constrained by along-strike variation of structural geometry, exhumation history, and foreland sedimentation. Earth Sci. Rev. 2006, 76, 1–131. [Google Scholar] [CrossRef]
- Zhang, B.; Wei, Y.; Garzanti, E.; Wang, C.; Chen, X.; Pan, W.; Liu, Q. Sedimentologic and stratigraphic constraints on the orientation of the Late Triassic northern Indian passive continental margin. Palaeogeogr. Palaeoclim. Palaeoecol. 2019, 533, 109234. [Google Scholar] [CrossRef]
- Gaetani, M.; Garzanti, E. Multicyclic history of the Northern India continental margin (Northwestern Himalaya) (1). Am. Assoc. Pet. Geol. Bull. 1991, 75, 1427–1446. [Google Scholar]
- Garzanti, E.; Angiolini, L.; Sciunnach, D. The Permian Kuling Group (Spiti, Lahaul and Zanskar; NW Himalaya): Sedimentary evolution during rift/drift transition and initial opening of neo-tethys. Riv. Ital. Paieontologia Stratigr. 1996, 102, 175–200. [Google Scholar]
- Jadoul, F.; Berra, F.; Garzanti, E. The Tethys Himalayan passive margin from Late Triassic to Early Cretaceous (South Tibet). J. Asian Earth Sci. 1998, 16, 173–194. [Google Scholar] [CrossRef]
- Garzanti, E. Stratigraphy and sedimentary history of the Nepal Tethys Himalaya passive margin. J. Asian Earth Sci. 1999, 17, 805–827. [Google Scholar] [CrossRef]
- DeCelles, P.G. Tectonic Implications of U-Pb Zircon Ages of the Himalayan Orogenic Belt in Nepal. Science 2000, 288, 497–499. [Google Scholar] [CrossRef]
- McQuarrie, N.; Robinson, D.; Long, S.; Tobgay, T.; Grujic, D.; Gehrels, G.; Ducea, M. Preliminary stratigraphic and structural architecture of Bhutan: Implications for the along strike architecture of the Himalayan system. Earth Planet. Sci. Lett. 2008, 272, 105–117. [Google Scholar] [CrossRef]
- McQuarrie, N.; Long, S.; Tobgay, T.; Nesbit, J.; Gehrels, G.E.; Ducea, M.N. Documenting basin scale, geometry and provenance through detrital geochemical data: Lessons from the Neoproterozoic to Ordovician Lesser, Greater, and Tethyan Himalayan strata of Bhutan. Gondwana Res. 2013, 23, 1491–1510. [Google Scholar] [CrossRef]
- Myrow, P.M.; Hughes, N.C.; Goodge, J.; Fanning, C.M.; Williams, I.S.; Peng, S.; Bhargava, O.N.; Parcha, S.K.; Pogue, K.R. Extraordinary transport and mixing of sediment across Himalayan central Gondwana during the Cambrian-Ordovician. GSA Bull. 2010, 122, 1660–1670. [Google Scholar] [CrossRef]
- Gehrels, G.; Kapp, P.; DeCelles, P.; Pullen, A.; Blakey, R.; Weislogel, A.; Ding, L.; Guynn, J.; Martin, A.; McQuarrie, N.; et al. Detrital zircon geochronology of pre-Tertiary strata in the Tibetan-Himalayan orogen. Tectonics 2011, 30, 1–27. [Google Scholar] [CrossRef]
- Zhu, D.-C.; Zhao, Z.-D.; Niu, Y.; Dilek, Y.; Hou, Z.-Q.; Mo, X.-X. The origin and pre-Cenozoic evolution of the Tibetan Plateau. Gondwana Res. 2013, 23, 1429–1454. [Google Scholar] [CrossRef]
- Gaetani, M.; Casnedi, R.; Fois, E.; Garzanti, E.; Jadoul, F.; Nicora, A.; Tintori, A. Stratigraphy of the Tethys Himalaya in Zanskar, Ladakh. Riv. Ital. Paleontol. Stratigr. 1986, 91, 443–478. [Google Scholar]
- Jadoul, F.; Garzanti, E.; Fois, E. Upper Triassic-Lower Jurassic stratigraphy and palaeogeographic evolution of the Zanskar Tethys Himalaya (Zangla Unit). Riv. Ital. Paieontologia Stratigr. 1990, 95, 351–396. [Google Scholar] [CrossRef]
- Ali, J.R.; Aitchison, J.C. Greater India’s northern margin prior to its collision with Asia. Basin Res. 2014, 26, 73–84. [Google Scholar] [CrossRef]
- Bhargava, O.N. Evolution of the Tethyan and Karewa successions in Kashmir: A synthesis. J. Palaeontol. Soc. India 2015, 60, 51–71. [Google Scholar]
- Rees, P.M.; Ziegler, A.M.; Valdes, P.J. Jurassic phytogeography and climates: New data and model comparisons. In Warm Climates in Earth History; Huber, B.T., Macleod, K.G., Wing, S.L., Eds.; Cambridge University Press: Cambridge, UK, 2000; pp. 297–318. [Google Scholar]
- Faisal, S.; Dixon, J.M. Physical analog (centrifuge) model investigation of contrasting structural styles in the Salt Range and Potwar Plateau, northern Pakistan. J. Struct. Geol. 2015, 77, 277–292. [Google Scholar] [CrossRef]
- Iqbal, S.; Jan, I.U.; Akhter, M.G.; Bibi, M. Palaeoenvironmental and sequence stratigraphic analyses of the Jurassic Datta Formation, Salt Range, Pakistan. J. Earth Syst. Sci. 2015, 124, 747–766. [Google Scholar] [CrossRef]
- Kadri, I.B. Petroleum Geology of Pakistan; Pakistan Petroleum Limited: Karachi, Pakistan, 1995; p. 275. [Google Scholar]
- Kazmi, A.H.; Jan, M.Q. Geology and Tectonic of Pakistan; Graphic Publication: Karachi, Pakistan, 1997; p. 554. [Google Scholar]
- Kazmi, A.H.; Abbasi, I.A. Stratigraphy & Historical Geology of Pakistan; Department and National Centre of Excellence in Geology: Peshawar, Pakistan, 2008; p. 524. [Google Scholar]
- Shah, S.M.I. Stratigraphy of Pakistan; Gov Pak Ministry of Petroleum and Natural Resources Geological Survey of Pakistan: Islamabad, Pakistan, 2009; p. 381.
- Hassan, S.; Ishiga, H.; Roser, B.; Dozen, K.; Naka, T. Geochemistry of Permian–Triassic shales in the Salt Range, Pakistan: Implications for provenance and tectonism at the Gondwana margin. Chem. Geol. 1999, 158, 293–314. [Google Scholar] [CrossRef]
- Stampfli, G.M.; Mosar, J.; Favre, P.; Pillevuit, A.; Vannay, J.C. Permo-Mesozoic evolution of the western Tethys realm: The Neo-Tethys East Mediterranean Basin connection. In Peri-Tethys Memoir 6: Peri-Tethyan Rift/Wrench Basins and Passive Margins; Ziegler, P.A., Cavalza, W., Robertson, A.H.F., Crasquin-Soleau, S., Eds.; Mémoires du Muséum National D’histoire Naturelle: Paris, France, 2001; Volume 186, pp. 51–108. ISBN 2-85653-528-3. [Google Scholar]
- Ghazi, S.; Mountney, N.P. Petrography and provenance of the Early Permian Fluvial Warchha Sandstone, Salt Range, Pakistan. Sediment. Geol. 2011, 233, 88–110. [Google Scholar] [CrossRef]
- Jehangiri, M.; Hanif, M.; Arif, M.; Jan, I.U.; Ahmad, S. The Early Cambrian Khewra Sandstone, Salt Range, Pakistan: Endorsing southern Indian provenance. Arab. J. Geosci. 2014, 8, 6169–6187. [Google Scholar] [CrossRef]
- Jan, I.U.; Iqbal, S.; Davies, S.J.; Zalasiewicz, J.A.; Stephenson, M.H.; Wagreich, M.; Haneef, M.; Hanif, M.; Ahmad, S. A Periglacial Palaeoenvionment in the Upper Carboniferous-Lower Permian Tobra Formation of the Salt Range, Pakistan. Acta Geol. Sin. 2017, 91, 1063–1078. [Google Scholar] [CrossRef]
- Burbank, D.W.; Raynolds, R.G.H. Stratigraphic keys to the timing of thrusting in the terrestrial foreland basins: Applications to the northwest Himalaya. In Frontiers in Sedimentary Geology, New Perspective in Basin Analysis; Kleinspahn, K.L., Paol, C., Eds.; Springer: Berlin, Germany, 1988; pp. 331–351. [Google Scholar]
- Iqbal, S.; Jan, I.U.; Hanif, M. The Mianwali and Tredian Formations: An Example of the Triassic Progradational Deltaic System in the Low-Latitude Western Salt Range, Pakistan. Arab. J. Sci. Eng. 2013, 39, 5489–5507. [Google Scholar] [CrossRef]
- Iqbal, S.; Akhter, G.; Bibi, S. Structural model of the Balkassar area, Potwar Plateau, Pakistan. Acta Diabetol. 2015, 104, 2253–2272. [Google Scholar] [CrossRef]
- Wiesmayr, G.; Grasemann, B. Eohimalayan fold and thrust belt: Implications for the geodynamic evolution of the NW-Himalaya (India). Tectonics 2002, 21. [Google Scholar] [CrossRef]
- Bhargava, O.N.; Frank, W.; Bertle, R. Late Cambrian deformation in the Lesser Himalaya. J. Asian Earth Sci. 2011, 40, 201–212. [Google Scholar] [CrossRef]
- Klootwijk, C.T.; Gee, J.S.; Peirce, J.W.; Smith, G.M.; McFadden, P.L. An early India-Asia contact: Paleomagnetic constraints from Ninetyeast Ridge, ODP Leg 121. Geology 1992, 20, 395–398. [Google Scholar] [CrossRef]
- Dupont-Nivet, G.; Lippert, P.C.; Van Hinsbergen, D.J.; Meijers, M.J.; Kapp, P. Palaeolatitude and age of the Indo-Asia collision: Palaeomagnetic constraints. Geophys. J. Int. 2010, 182, 1189–1198. [Google Scholar] [CrossRef]
- Najman, Y.; Appel, E.; BouDagher-Fadel, M.; Bown, P.; Carter, A.; Garzanti, E.; Godin, L.; Han, J.; Liebke, U.; Oliver, G.; et al. Timing of India-Asia collision: Geological, biostratigraphic, and palaeomagnetic constraints. J. Geophys. Res. Space Phys. 2010, 115, 12416. [Google Scholar] [CrossRef]
- Damborenea, S.E. Jurassic evolution of Southern Hemisphere marine palaeobiogeographic units based on benthonic bivalves. Geobios 2002, 35, 51–71. [Google Scholar] [CrossRef]
- Scotese, C.R. Atlas of Jurassic Paleogeographic Maps, PALEOMAP Atlas for ArcGIS; The Jurassic, Maps 32–42, Mollweide Projection; PALEOMAP Project: Evanston, IL, USA, 2014; Volume 4. [Google Scholar]
- Ge, Y.; Al-Suwaidi, A.; Shi, M.; Li, Q.; Morad, S.; Steuber, T. Short-term variation of ooid mineralogy in the Triassic-Jurassic boundary interval and its environmental implications: Evidence from the equatorial Ghalilah Formation, United Arab Emirates. Glob. Planet. Chang. 2019, 182, 103006. [Google Scholar] [CrossRef]
- Hesselbo, S.P.; Korte, C.; Ullmann, C.V.; Ebbesen, A.L. Carbon and oxygen isotope records from the southern Eurasian Seaway following the Triassic-Jurassic boundary: Parallel long-term enhanced carbon burial and seawater warming. Earth Sci. Rev. 2020, 203, 103131. [Google Scholar] [CrossRef]
- Ruhl, M.; Hesselbo, S.; Al-Suwaidi, A.; Jenkyns, H.; Damborenea, S.; Manceñido, M.; Storm, M.; Mather, T.; Riccardi, A. On the onset of Central Atlantic Magmatic Province (CAMP) volcanism and environmental and carbon-cycle change at the Triassic–Jurassic transition (Neuquén Basin, Argentina). Earth Sci. Rev. 2020, 208, 103229. [Google Scholar] [CrossRef]
- Collinson, J.; Mountney, N.; Thompson, D. Sedimentary Structures; Terra Publishing: London, UK, 2006. [Google Scholar]
- Dickinson, W.R.; Beard, L.S.; Brakenridge, G.R.; Erjavec, J.L.; Ferguson, R.C.; Inman, K.F.; Knepp, R.A.; Lindberg, F.A.; Ryberg, P.T. Provenance of North American Phanerozoic Sandstones in Relation to Tectonic Setting. Geol. Soc. Am. Bull. 1983, 94, 222–235. [Google Scholar] [CrossRef]
- Ingersoll, R.V.; Bullard, T.F.; Ford, R.L.; Grimm, J.P.; Pickle, J.D.; Sares, S.W. The effect of grain size on detrital modes: A test of the Gazzi-Dickinson point-counting method. J. Sediment. Res. 1984, 54, 103–116. [Google Scholar] [CrossRef]
- Garzanti, E. Petrographic classification of sand and sandstone. Earth Sci. Rev. 2019, 192, 545–563. [Google Scholar] [CrossRef]
- Van Langeveld, A.D.; Van der Gaast, S.J.; Eisma, D. A comparison of the effectiveness of eight methods for the removal of organic matter from clay. Clays Clay Miner. 1978, 26, 361–364. [Google Scholar] [CrossRef]
- Moore, D.M.; Reynolds, R.C., Jr. X-ray Diffraction and the Identification and Analysis of Clay Minerals; Oxford University Press (OUP): Oxford, UK, 1989. [Google Scholar]
- Brindley, G.W.; Brown, G. Quantitative X-ray mineral analysis of clays. In Crystal Structures of Clay Minerals and Their X-ray Identification; Mineralogical Society of Great Britain and Ireland: Twickenham, UK, 1980; Volume 5, pp. 411–438. [Google Scholar]
- Schultz, L.G. Quantitative Interpretation of Mineralogical Composition X-ray and Chemical Data for the Pierre Shale; Professional Paper; U.S. Geological Survey: Washington, DC, USA, 1964; pp. 1–31. [Google Scholar]
- Nesbitt, H.W.; Young, G.M. Early Proterozoic climates and plate motions inferred from major element chemistry of lutites. Nature 1982, 299, 715–717. [Google Scholar] [CrossRef]
- Nesbitt, H.; Young, G. Prediction of some weathering trends of plutonic and volcanic rocks based on thermodynamic and kinetic considerations. Geochim. Cosmochim. Acta 1984, 48, 1523–1534. [Google Scholar] [CrossRef]
- McLennan, S. Weathering and Global Denudation. J. Geol. 1993, 101, 295–303. [Google Scholar] [CrossRef]
- Fedo, C.M.; Nesbitt, H.W.; Young, G.M. Unraveling the effects of potassium metasomatism in sedimentary rocks and paleosols, with implications for paleoweathering conditions and provenance. Geology 1995, 23, 921–924. [Google Scholar] [CrossRef]
- McLennan, S.M.; Hemming, S.; McDaniel, D.K.; Hanson, G.M. Geochemical approaches to sedimentation, provenance, and tectonics. In Processes Controlling the Composition of Clastic Sediments; Special Papers; Johnsson, M.J., Basu, A., Eds.; Geological Society of America: Boulder, CO, USA, 1993; Volume 284, pp. 21–40. [Google Scholar] [CrossRef]
- Cullers, R.L. Implications of elemental concentrations for provenance, redox conditions, and metamorphic studies of shales and limestones near Pueblo, CO, USA. Chem. Geol. 2002, 191, 305–327. [Google Scholar] [CrossRef]
- Bracciali, L.; Marroni, M.; Pandolfi, L.; Rocchi, S.; Arribas, J.; Critelli, S.; Johnsson, M. Geochemistry and petrography of Western Tethys Cretaceous sedimentary covers (Corsica and Northern Apennines): From source areas to configuration of margins. Spec. Pap. Geol. Soc. Am. 2007, 420, 73–93. [Google Scholar] [CrossRef]
- Floyd, P.A.; Leveridge, B.E. Tectonic environment of the Devonian Gramscatho basin, south Cornwall: Framework mode and geochemical evidence from turbiditic sandstones. J. Geol. Soc. 1987, 144, 531–542. [Google Scholar] [CrossRef]
- Bhatia, M.R.; Crook, K.A.W. Trace element characteristics of graywackes and tectonic setting discrimination of sedimentary basins. Contrib. Miner. Pet. 1986, 92, 181–193. [Google Scholar] [CrossRef]
- Bhatia, M.R. Plate Tectonics and Geochemical Composition of Sandstones. J. Geol. 1983, 91, 611–627. [Google Scholar] [CrossRef]
- Bhatia, M.R. Rare earth element geochemistry of Australian Paleozoic graywackes and mudrocks: Provenance and tectonic control. Sediment. Geol. 1985, 45, 97–113. [Google Scholar] [CrossRef]
- Taylor, S.R.; McLennan, S.M. The Continental Crust: Its Composition and Evolution; Blackwell: Oxford, UK, 1985; 321p, ISBN-13: 978-0632011483. [Google Scholar]
- Suttner, P.K.D.L.J. Alluvial Sandstone Composition and Paleoclimate, I. Framework Mineralogy. J. Sediment. Res. 1986, 56, 329–345. [Google Scholar] [CrossRef]
- Cingolani, C.A.; Manassero, M.; Abre, P. Composition, provenance, and tectonic setting of Ordovician siliciclastic rocks in the San Rafael block: Southern extension of the Precordillera crustal fragment, Argentina. J. S. Am. Earth Sci. 2003, 16, 91–106. [Google Scholar] [CrossRef]
- McLennan, S. Sedimentary silica on Mars. Geology 2003, 31, 315–318. [Google Scholar] [CrossRef]
- Hegde, V.; Chavadi, V. Geochemistry of late Archaean metagreywackes from the Western Dharwar Craton, South India: Implications for provenance and nature of the Late Archaean crust. Gondwana Res. 2009, 15, 178–187. [Google Scholar] [CrossRef]
- Abre, P.; Cingolani, C.; Zimmermann, U.; Cairncross, B.; Chemale, F. Provenance of Ordovician clastic sequences of the San Rafael Block (Central Argentina), with emphasis on the Ponón Trehué Formation. Gondwana Res. 2011, 19, 275–290. [Google Scholar] [CrossRef]
- Stern, G.; Wagreich, M. Provenance of the Upper Cretaceous to Eocene Gosau Group around and beneath the Vienna Basin (Austria and Slovakia). Swiss J. Geosci. 2013, 106, 505–527. [Google Scholar] [CrossRef]
- Hofmann, M.; Li, X.; Chen, J.; MacKenzie, L.; Hinman, N. Provenance and temporal constraints of the Early Cambrian Maotianshan Shale, Yunnan Province, China. Gondwana Res. 2016, 37, 348–361. [Google Scholar] [CrossRef]
- Bibi, M.; Wagreich, M.; Iqbal, S.; Jan, I.U. Regional sediment sources versus the Indus River system: The Plio-Pleistocene of the Peshawar Basin (NW-Pakistan). Sediment. Geol. 2019, 389, 26–41. [Google Scholar] [CrossRef]
- Bibi, M.; Wagreich, M.; Iqbal, S.; Gier, S.; Jan, I.U. Sedimentation and glaciations during the Pleistocene: Palaeoclimate reconstruction in the Peshawar Basin, Pakistan. Geol. J. 2020, 55, 671–693. [Google Scholar] [CrossRef]
- Mange, M.A.; Maurer, H.F.W. Heavy Minerals in Colour; Chapman and Hall: London, UK, 1992; pp. 11–25. [Google Scholar]
- Koroznikova, L.; Klutke, C.; McKnight, S.; Hall, S. The use of low-toxic heavy suspensions in mineral sands evaluation and zircon fractionation. J. Afr. Inst. Min. Metall. 2008, 108, 25–33. [Google Scholar]
- Sorkhabi, R. How Much Oil in the Middle East? GeoExPro 2014, 11, 1–2014. [Google Scholar]
- John, T.; Schenk, V.; Haase, K.; Scherer, E.; Tembo, F. Evidence for a Neoproterozoic ocean in south-central Africa from mid-oceanic-ridge–type geochemical signatures and pressure-temperature estimates of Zambian eclogites. Geology 2003, 31, 243–246. [Google Scholar] [CrossRef]
- Basu, A. Petrology of Holocene fluvial sand derived from plutonic source rocks; implications to paleoclimatic interpretation. J. Sediment. Res. 1976, 46, 694–709. [Google Scholar] [CrossRef]
- Gromet, L.; Haskin, L.A.; Korotev, R.L.; Dymek, R.F. The “North American shale composite”: Its compilation, major and trace element characteristics. Geochim. Cosmochim. Acta 1984, 48, 2469–2482. [Google Scholar] [CrossRef]
- Nesbitt, H.W.; Young, G.M.; McLennan, S.; Keays, R. Effects of Chemical Weathering and Sorting on the Petrogenesis of Siliciclastic Sediments, with Implications for Provenance Studies. J. Geol. 1996, 104, 525–542. [Google Scholar] [CrossRef]
- Rudnick, R.L.; Gao, S.; Holland, H.D.; Turekian, K.K. Composition of the continental crust. Crust 2003, 3, 1–64. [Google Scholar]
- Hubert, J.F. A zircon–tourmaline–rutile maturity index and the interdependence of the composition of heavy mineral assemblages with the gross composition and texture of sandstones. J. Sediment. Res. 1962, 32, 440–450. [Google Scholar]
- Garzanti, E.; Andò, S. Chapter 29 Plate Tectonics and Heavy Mineral Suites of Modern Sands. Dev. Sedimentol. 2007, 58, 741–763. [Google Scholar] [CrossRef]
- Tucker, M.E. (Ed.) Sedimentary Petrology: An Introduction to the Origin of Sedimentary Rocks; John Wiley & Sons: Oxford, UK, 2009; p. 278. [Google Scholar]
- Boggs, S., Jr.; Boggs, S. Petrology of Sedimentary Rocks; Cambridge University Press: Cambridge, UK, 2009; p. 600. [Google Scholar]
- Condie, K.C. Another look at rare earth elements in shales. Geochim. Cosmochim. Acta 1991, 55, 2527–2531. [Google Scholar] [CrossRef]
- Cox, R.; Lowe, D.R.; Cullers, R. The influence of sediment recycling and basement composition on evolution of mudrock chemistry in the southwestern United States. Geochim. Cosmochim. Acta 1995, 59, 2919–2940. [Google Scholar] [CrossRef]
- Garver, J.I.; Scott, T.J. Trace elements in shale as indicators of crustal provenance and terrane accretion in the southern Canadian Cordillera. GSA Bull. 1995, 107, 440–453. [Google Scholar] [CrossRef]
- Blake, J.M.; Peters, S.C.; Johannesson, K.H. Application of REE geochemical signatures for Mesozoic sediment provenance to the Gettysburg Basin, Pennsylvania. Sediment. Geol. 2017, 349, 103–111. [Google Scholar] [CrossRef]
- Mukherjee, I.; Large, R.R.; Bull, S.; Gregory, D.G.; Stepanov, A.S.; Ávila, J.; Ireland, T.R.; Corkrey, R. Pyrite trace-element and sulfur isotope geochemistry of paleo-mesoproterozoic McArthur Basin: Proxy for oxidative weathering. Am. Miner. 2019, 104, 1256–1272. [Google Scholar] [CrossRef]
- Little, S.H.; Vance, D.; Lyons, T.W.; McManus, J. Controls on trace metal authigenic enrichment in reducing sediments: Insights from modern oxygen-deficient settings. Am. J. Sci. 2015, 315, 77–119. [Google Scholar] [CrossRef]
- Sweere, T.; Boorn, S.V.D.; Dickson, A.J.; Reichart, G.-J. Definition of new trace-metal proxies for the controls on organic matter enrichment in marine sediments based on Mn, Co, Mo and Cd concentrations. Chem. Geol. 2016, 441, 235–245. [Google Scholar] [CrossRef]
- Kanhaiya, S.; Singh, B.P.; Singh, S. Mineralogical and Geochemical Behavior of Sediments Solely Derived from Bundelkhand Granitic Complex, Central India: Implications to Provenance and Source Rock Weathering. Geochem. Int. 2018, 56, 1245–1262. [Google Scholar] [CrossRef]
- McLennan, S.; Taylor, S.; McCulloch, M.; Maynard, J. Geochemical and Nd Sr isotopic composition of deep-sea turbidites: Crustal evolution and plate tectonic associations. Geochim. Cosmochim. Acta 1990, 54, 2015–2050. [Google Scholar] [CrossRef]
- Singer, A. The paleoclimatic interpretation of clay minerals in sediments—A review. Earth Sci. Rev. 1984, 21, 251–293. [Google Scholar] [CrossRef]
- Dill, H.G. Kaolin: Soil, rock and ore: From the mineral to the magmatic, sedimentary and metamorphic environments. Earth Sci. Rev. 2016, 161, 16–129. [Google Scholar] [CrossRef]
- Newman, S.; Macdougall, J.D.; Finkel, R.C. 230Th-238U disequilibrium in island arcs: Evidence from the Aleutians and the Marianas. Nature 1984, 308, 268–270. [Google Scholar] [CrossRef]
- Worden, R.H.; Burley, S.D. Sandstone Diagenesis: The Evolution of Sand to Stone. Sandstone Diagenesis 2009, 4, 1–44. [Google Scholar]
- Marfil, R.; La Iglesia, A.; Herrero, M.J.; Scherer, M.; Delgado, A. Clay mineral occurrence and burial transformations: Reservoir potential of the Permo-Triassic sediments of the Iberian Range. Basin Res. 2014, 27, 295–309. [Google Scholar] [CrossRef]
- Mindszenty, A. Bauxites: Feedbacks of System Earth at Greenhouse times. Geol. Croat. 2016, 69, 79–87. [Google Scholar] [CrossRef]
- Selvaraj, K.; Chen, C.A. Moderate Chemical Weathering of Subtropical Taiwan: Constraints from Solid-Phase Geochemistry of Sediments and Sedimentary Rocks. J. Geol. 2006, 114, 101–116. [Google Scholar] [CrossRef]
- Bahlburg, H.; Dobrzinski, N.; Arnaud, E.; Halverson, G.P.; Shields-Zhou, G. Chapter 6 A review of the Chemical Index of Alteration (CIA) and its application to the study of Neoproterozoic glacial deposits and climate transitions. Geol. Soc. Lond. Mem. 2011, 36, 81–92. [Google Scholar] [CrossRef]
- McLennan, S.M. Archean sedimentary rocks and the Archean mantle. In Workshop on the Archean Mantle; Technical Report; Aswal, L.D., Ed.; LPI: New York, NY, USA, 1989; Volume 89-05, pp. 57–59. [Google Scholar]
- McLennan, S.; Taylor, S.R. Th and U in sedimentary rocks: Crustal evolution and sedimentary recycling. Nat. Cell Biol. 1980, 285, 621–624. [Google Scholar] [CrossRef]
- McLennan, S.; Taylor, S.R. Sedimentary Rocks and Crustal Evolution: Tectonic Setting and Secular Trends. J. Geol. 1991, 99, 1–21. [Google Scholar] [CrossRef]
- McLennan, S.M. Rare earth elements in sedimentary rocks: Influence of provenance and sedimentary processes. Miner. Soc. Am. Rev. Mineral. 1989, 21, 169–200. [Google Scholar]
- Mange, M.A.; Wright, D.T. (Eds.) Heavy Minerals in Use: Developments in Sedimentology; Elsevier: Amsterdam, The Netherlands, 2007; p. 1283. [Google Scholar]
- Sevastjanova, I.; Hall, R.; Alderton, D. A detrital heavy mineral viewpoint on sediment provenance and tropical weathering in SE Asia. Sediment. Geol. 2012, 280, 179–194. [Google Scholar] [CrossRef]
- Rino, S.; Kon, Y.; Sato, W.; Maruyama, S.; Santosh, M.; Zhao, D. The Grenvillian and Pan-African orogens: World’s largest orogenies through geologic time, and their implications on the origin of superplume. Gondwana Res. 2008, 14, 51–72. [Google Scholar] [CrossRef]
- Stern, R.J.; Johnson, P. Continental lithosphere of the Arabian Plate: A geologic, petrologic, and geophysical synthesis. Earth Sci. Rev. 2010, 101, 29–67. [Google Scholar] [CrossRef]
- Heikal, M.T.S.; Al-Khirbash, S.A.; Hassan, A.M.; Al-Kotbah, A.M.; Al-Selwi, K.M. Lithostratigraphy, deformation history, and tectonic evolution of the basement rocks, Republic of Yemen: An overview. Arab. J. Geosci. 2013, 7, 2007–2018. [Google Scholar] [CrossRef]
- Whitehouse, M.J.; Windley, B.F.; Stoeser, D.B.; Al-Khirbash, S.; Ba-Bttat, M.A.; Haider, A. Precambrian basement character of Yemen and correlations with Saudi Arabia and Somalia. Precambrian Res. 2001, 105, 357–369. [Google Scholar] [CrossRef]
- Stampfli, G.; Marcoux, J.; Baud, A. Tethyan margins in space and time. Palaeogeogr. Palaeoclim. Palaeoecol. 1991, 87, 373–409. [Google Scholar] [CrossRef]
- Pillevuit, A. Les Blocs exotiques du Sultanat d’Oman, évolution paléogéographique d’une marge passive flexurale. Mémoires Géologie Lausanne 1993, 17, 1–249. [Google Scholar]
- Wopfner, H. Pangean depositional sequences between Karoo and Lut. In Geoscientific Research in Northeast Africa; Balkema, A.A., Thorweihe, U., Schandelmeier, H., Eds.; Brookfield: Rotterdam, The Netherlands, 1993; pp. 189–195. [Google Scholar]
- Jin, X. Permo-Carboniferous sequences of Gondwana affinity in Southwest China and their paleogeographic implications. J. Asian Earth Sci. 2002, 20, 633–646. [Google Scholar]
- Ghani, H.; Sobel, E.R.; Zeilinger, G.; Glodny, J.; Zapata, S.; Irum, I. Palaeozoic and Pliocene tectonic evolution of the Salt Range constrained by low-temperature thermochronology. Terra Nova 2021, 33, 293–305. [Google Scholar] [CrossRef]
- Sciunnach, D.; Garzanti, E. Sedimentary record of Late Paleozoic rift and break-up in Northern Gondwana: A case history from the Thini Chu Group and Tamba-Kurkur Formation (Dolpo Tethys Himalaya, Nepal). Geodin. Acta 1996, 9, 41–56. [Google Scholar] [CrossRef]
- Sciunnach, D.; Garzanti, E. Detrital chromian spinels record tectono-magmatic evolution from Carboniferous rifting to Permian spreading in Neotethys (India, Nepal and Tibet). In From Rifting to Drifting in Present-Day and Fossil Ocean Basins; Messiga, B., Tribuzio, R., Eds.; Ofioliti: Pisa, Italy, 1997; pp. 101–110. [Google Scholar]
- Jin, Y.; Shen, S.Z.; Zhu, Z.; Mei, S.; Wang, W. The Selong section, candidate of the global stratotype and section, and point of the Permian–Triassic boundary. In The Palaeozoic–Mesozoic Boundary Candidates of Global Stratotype Section and Point of the Permian–Triassic Boundary; Yin, H.F., Ed.; China University of Geosciences: Beijing, China, 1996; pp. 127–137. [Google Scholar]
- Wignall, P.B.; Newton, R. Contrasting Deep-water Records from the Upper Permian and Lower Triassic of South Tibet and British Columbia: Evidence for a Diachronous Mass Extinction. PALAIOS 2003, 18, 153–167. [Google Scholar] [CrossRef]
- von Rad, U.; Exon, N.F.; Boyd, R.; Haq, B.U. Mesozoic paleoenvironment of the rifted margin off NW Australia (ODP Legs 122/123). In American Geophysical Union Monograph; Duncan, R.A., Rea, D.K., Kidd, R.B., von Rad, U., Weissel, J.K., Eds.; American Geophysical Union: Washington, DC, USA, 1992; Volume 70, pp. 157–184. [Google Scholar] [CrossRef]
- Garzanti, E.; Le Fort, P.; Sciunnach, D. First report of Lower Permian basalts in South Tibet: Tholeiitic magmatism during break-up and incipient opening of Neotethys. J. Asian Earth Sci. 1999, 17, 533–546. [Google Scholar] [CrossRef]
- Biswas, S. Regional tectonic framework, structure and evolution of the western marginal basins of India. Tectonophysics 1987, 135, 307–327. [Google Scholar] [CrossRef]
- Mukhopadhyay, G.; Mukhopadhyay, S.K.; Roychowdhury, M.; Parui, P.K. Stratigraphic correlation between different Gondwana Basins of India. J. Geol. Soc. India 2010, 76, 251–266. [Google Scholar] [CrossRef]
- Brown, B.J.; Muller, R.D.; Gaina, C.; Struckmeyer, H.I.M.; Stagg, H.M.J.; Symonds, P.A. Formation and evolution of Australian passive margins: Implications for locating the boundary between continental and oceanic crust. Spec. Pap. Geol. Soc. Am. 2003, 372, 223–244. [Google Scholar]
- Green, P.F.; Japsen, P.; Chalmers, J.A.; Bonow, J.M.; Duddy, I.R. Post-breakup burial and exhumation of passive continental margins: Seven propositions to inform geodynamic models. Gondwana Res. 2018, 53, 58–81. [Google Scholar] [CrossRef]
- Martin, A.J. A review of Himalayan stratigraphy, magmatism, and structure. Gondwana Res. 2017, 49, 42–80. [Google Scholar] [CrossRef]
- Heron, A.M. The geology of central Rajputana. Mem. Geol. Soc. India 1953, 79, 389. [Google Scholar]
- Sisodia, M.S.; Chauhan, D.S. Indian Precambrian; Paliwal, B.S., Ed.; Scientific Publisher: Jodhpur, India, 1998; pp. 171–182. [Google Scholar]
- Bhushan, S.K. Classification of Malani Igneous Suite. Geol. Surv. India Spec. Public 1984, 12, 199–205. [Google Scholar]
- Di Giulio, A.; Amadori, C.; Mueller, P.; Langone, A. Role of the Down-Bending Plate as a Detrital Source in Convergent Systems Revealed by U–Pb Dating of Zircon Grains: Insights from the Southern Andes and Western Italian Alps. Minerals 2020, 10, 632. [Google Scholar] [CrossRef]
- Burley, S.; Worden, R. (Eds.) Sandstone Diagenesis: Recent and Ancient; Wiley-Blackwell: Hoboken, NJ, USA, 2009; Volume 24, p. 650. [Google Scholar]
- Walderhaug, O. Temperatures of Quartz Cementation in Jurassic Sandstones from the Norwegian Continental Shelf--Evidence from Fluid Inclusions. J. Sediment. Res. 1994, 64, 311–323. [Google Scholar] [CrossRef]
- Primmer, T.J.; Cade, C.A.; Evans, J.; Gluyas, J.G.; Hopkins, M.S.; Oxtoby, N.H.; Smalley, S.; Warren, E.A.; Worden, R.H. Global patterns in sandstone diagenesis: Their application to reservoir quality prediction for petroleum exploration. In Reservoir Quality Prediction in Sandstones and Carbonates; Kupecz, J.A., Gluyas, J., Bloch, S., Eds.; American Association of Petroleum Geologists: Tulsa, OK, USA, 1997; pp. 61–77, Memoir 69. [Google Scholar]
- Worden, R.; Morad, S. Quartz Cementation in Sandstones; Special Publication 29, International Association of Sedimentologists; Blackwell Science: Oxford, UK, 2000; p. 342. [Google Scholar]


| Episode | Tethyan Himalaya Succession (THS) | Salt Range Succession (SRS) |
|---|---|---|
| Syn-Collisional | Paleogene limestones followed by post Eocene fluvio-deltaic red beds derived from erosion of the Himalayas | Paleogene shallow marine limestones and shales followed by Post Eocene brown-red fluvio-deltaic siliciclastics derived from erosion of Himalayas |
| Drift | g) Cretaceous drowning and deposition of glauconitic and phosphatic ironstones. | g) Cretaceous iron rich glauconitic shales and sandstones (Chichali and Lumshiwal formations) |
| f) Middle Jurassic carbonate-platform sedimentation became widespread (“mature passive-margin stage”) | f) Middle Jurassic widespread platform carbonates deposition (Samana Suk Formation) | |
| e) Early Jurassic development of dysoxic bottom waters | e) Toarcian black shale deposition (Shinawari Formation) | |
| d) Late Triassic-Lower Jurassic quartzose sands deposition (locally until the middle Early Jurassic) | d) Late Triassic shale and sandstone (Kingriali Formation) and thick lower Jurassic quartzose sandstones Datta Formation) | |
| c) Norian sudden increase in siliciclastic detritus suddenly (Passive margin rejuvenation) | c) Middle Triassic thick sandstones with large scale slumps (Tredian Formation) pointing to passive margin rejuvenation | |
| b) Lower Triassic deep-water, ammonoid-bearing sediment deposition | b) Lower Triassic deep marine ammonoid rich deposition (Mianwali Formation) | |
| a) Upper Permian transgressive bioclastic sands and shales with deepening upward trend | a) Upper Permian sandstones and shales (Warchha and Sardhai formations) followed by thick, richly fossiliferous carbonates (Zaluch Group) | |
| Syn-Rift | Lowermost Permian glacigenic diamictites overlain by Sakmarian deglaciation mudrocks. | Lowermost Permian glacial diamictites (Tobra Formation) overlain by deglaciation shale (Dandot Formation) |
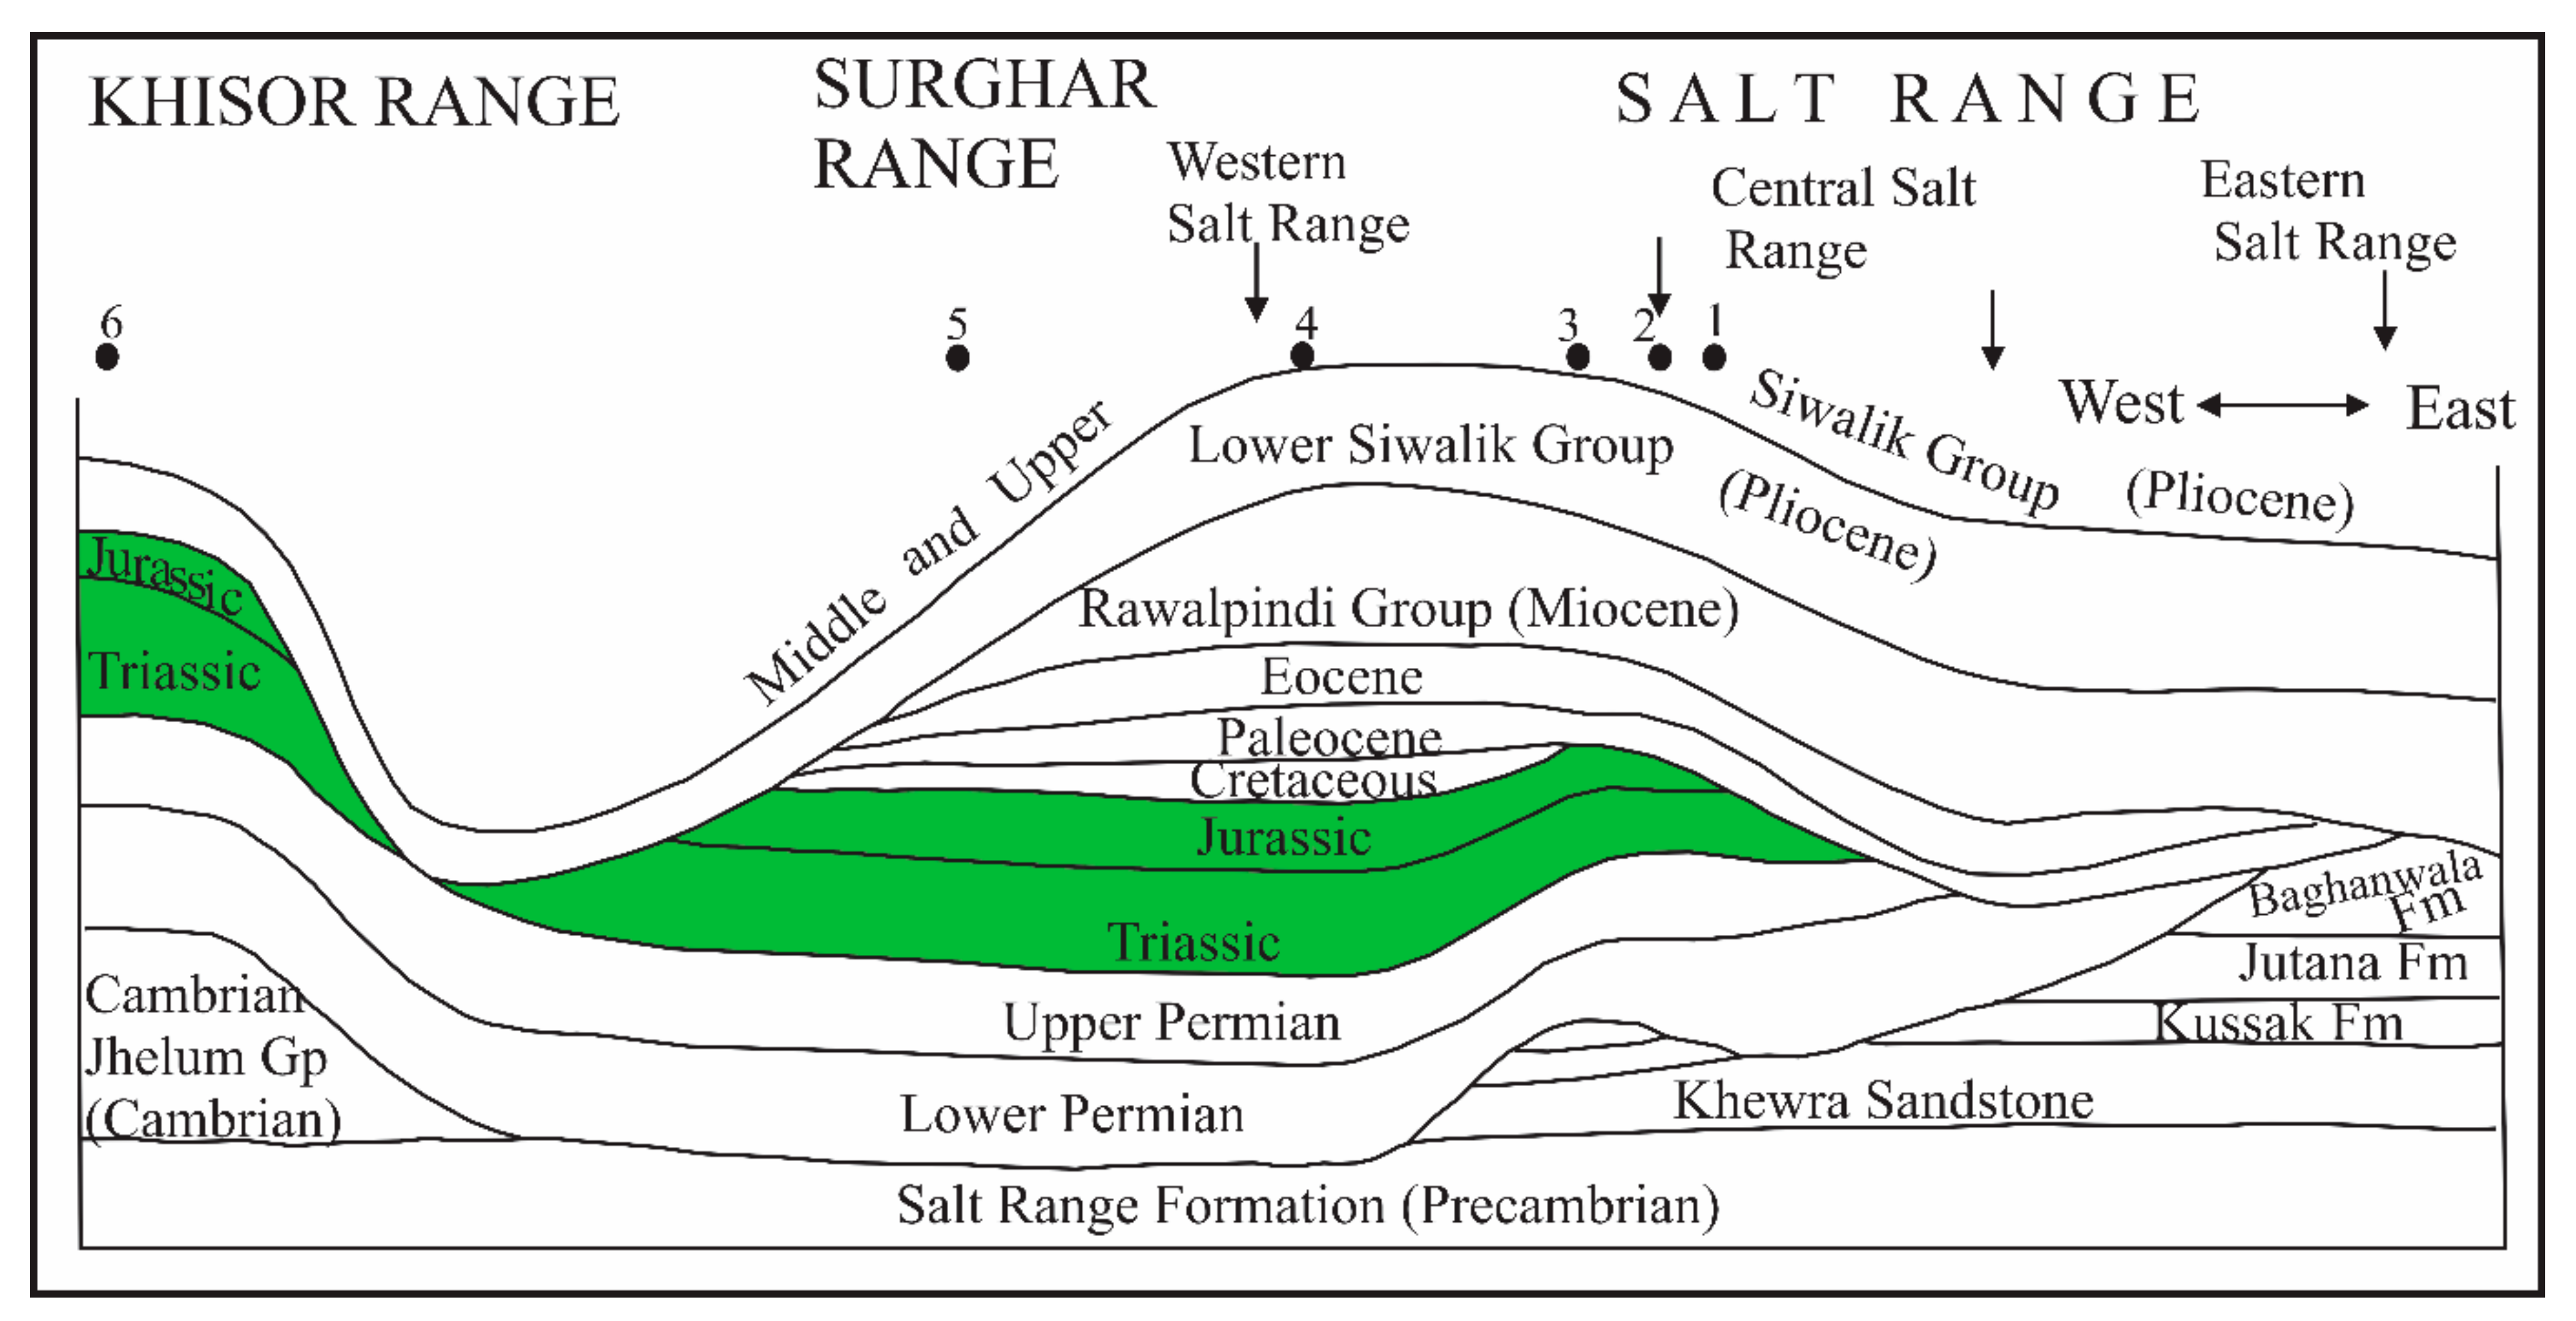
| Pre-Rift | Angular unconformity between the underlying Upper Devonian to Tournaisian limestones and the overlying syn-rift sequence Cambrian-Devonian succession | Ordovician-Carboniferous unconfirmity Gentle angular unconformity between Baghawala Formation (Cambrian) and Tobra Formation (Permo-Carboniferous) Salt Range Formation (Precambrian), Jhelum Group (Cambrian) |
| S. No | Locality Name | Area | Latitude | Longitude |
|---|---|---|---|---|
| 1 | Kasanwala Nala | Salt Range | 32°36/14.17//N | 71°49/45.63//E |
| 2 | Kaowaali | 32°37/1.28//N | 71°49/13.00//E | |
| 3 | Nammal Gorge | 32°39/43.83//N | 71°47/48.23//E | |
| 4 | Zaluch Nala | 32°46/1.45//N | 71°39/54.06//E | |
| 5 | Gulla Khel | Surghar Range | 32°58/28.80//N | 71°13/23.17//E |
| 6 | Paniala | Khisor Range | 32°13/25.19//N | 70°53/49.33//E |
| Formation /Age | Lithofacies/ Environments | Lithology/Features | Lithofacies Association | Distribution | ||
|---|---|---|---|---|---|---|
| Salt Range | Surghar Range | Khisor Range | ||||
| Datta Formation Jurassic (Hettangian) | Lagoonal carbonate | Yellowish orange to brown dolomites, ripple marks, | Lagoonal lithofacies Association | Present | Present only in eastern parts | Absent |
| Lagoonal shale | Gray, calcareous shales, with siltstone, fine sandstone interbeds having ripples | Present | Present only in eastern parts | Absent | ||
| Channel belt sandstone | Quartz rich sandstones, cross bedding, fining upward, coal patches and carbonaceous horizons, fining upward | Channel belt facies association | Present | Present | Present | |
| Channel belt conglomerate | Quartz rich conglomerates, cross bedding, flat pebbles imbrications, erosive bases, fining upward | Present | Absent | Absent | ||
| Laterite–bauxite | Red-purple laterite–bauxite with kaolinite | Channel margin and overbank floodplain lithofacies association | Present | Present | Present | |
| Overbank-floodplain shale | Red, gray shales with fire clay deposits | Present | Present | Present | ||
| Channel margin sandstone | Brown-red, fine–medium grained, quartzose sandstone interbedded with red, brown shale, ripples, graded bedding | Present | Present | Present | ||
| Kingriali Formation Triassic (Rhaetian) | Lagoonal shale and evaporites | Greenish gray shale with gypsum on top, illite rich | Lagoonal and shallow marine lithofacies association | Present | Present | Present |
| Shallow marine dolomite and shale | Thin–medium bedded dolomite and interbedded greenish gray shale (illite rich), shale thickness increases upward, lateritic oxidation on top of upper dolomite beds | Present | Present | Present | ||
| Dolomite | Thick bedded, massive dolomite, laminations, occasional cross bedding, oolitic | Platform carbonates lithofacies association | Present | Present | Present | |
Publisher’s Note: MDPI stays neutral with regard to jurisdictional claims in published maps and institutional affiliations. |
© 2021 by the authors. Licensee MDPI, Basel, Switzerland. This article is an open access article distributed under the terms and conditions of the Creative Commons Attribution (CC BY) license (https://creativecommons.org/licenses/by/4.0/).
Share and Cite
Iqbal, S.; Wagreich, M.; Bibi, M.; Jan, I.U.; Gier, S. Multi-Proxy Provenance Analyses of the Kingriali and Datta Formations (Triassic–Jurassic Transition): Evidence for Westward Extension of the Neo-Tethys Passive Margin from the Salt Range (Pakistan). Minerals 2021, 11, 573. https://doi.org/10.3390/min11060573
Iqbal S, Wagreich M, Bibi M, Jan IU, Gier S. Multi-Proxy Provenance Analyses of the Kingriali and Datta Formations (Triassic–Jurassic Transition): Evidence for Westward Extension of the Neo-Tethys Passive Margin from the Salt Range (Pakistan). Minerals. 2021; 11(6):573. https://doi.org/10.3390/min11060573
Chicago/Turabian StyleIqbal, Shahid, Michael Wagreich, Mehwish Bibi, Irfan U. Jan, and Susanne Gier. 2021. "Multi-Proxy Provenance Analyses of the Kingriali and Datta Formations (Triassic–Jurassic Transition): Evidence for Westward Extension of the Neo-Tethys Passive Margin from the Salt Range (Pakistan)" Minerals 11, no. 6: 573. https://doi.org/10.3390/min11060573
APA StyleIqbal, S., Wagreich, M., Bibi, M., Jan, I. U., & Gier, S. (2021). Multi-Proxy Provenance Analyses of the Kingriali and Datta Formations (Triassic–Jurassic Transition): Evidence for Westward Extension of the Neo-Tethys Passive Margin from the Salt Range (Pakistan). Minerals, 11(6), 573. https://doi.org/10.3390/min11060573