Abstract
Innovative recycling routes are needed to fulfill the increasing demand for battery raw materials to ensure sufficiency in the future. The integration of battery scrap recycling and nickel slag cleaning by reduction with methane was experimentally researched for the first time in this study. Industrial nickel slag from the direct Outotec nickel flash smelting (DON) process was mixed with both synthetic and industrial battery scrap. The end products of the slag-scrap mixtures after reduction at 1400 °C in a CH4 (5 vol %)-N2 atmosphere were an Ni–Co–Cu–Fe metal alloy and FeOx–SiO2 slag. It was noted that a higher initial amount of cobalt in the feed mixture increased the recovery of cobalt to the metal alloy. Increasing the reduction time decreased the fraction of sulfur in the metal alloy and magnetite in the slag. After reduction, manganese was deported in the slag and most of the zinc volatilized. This study confirmed the possibility of replacing coke with methane as a non-fossil reductant in nickel slag cleaning on a laboratory scale, and the recovery of battery metals cobalt and nickel in the slag cleaning process with good yields.
1. Introduction
Energy storage in batteries is regarded as one of the major near-term solutions for decarbonizing road transportation [1,2]. However, to ensure resource sufficiency for future generations, innovative developments for closing material loops in all material chains are required. In the battery value chain, the development of recycling concepts plays an important role in achieving these goals. The expected future demand for batteries worldwide is 2600–3600 GWh for 2030 [1]. In total, 60% of the demand for batteries is attributed to passenger electric vehicles (EVs), which mainly utilize lithium-ion batteries (LIBs) [1]. LIBs are also used in consumer electronics, such as laptops and cellular phones [3].
To meet 7% of the overall demand for battery raw materials, the recycling capacity would have to increase 25-fold by 2030 [1]. Obviously, the capacity of recycling processes is not the only concern, as safe collection is a major obstacle in most countries. LIBs contain a variety of elements, such as Li, Co, Ni, Mn, Cu, and Al [4]. Some of the metals, such as Co, are listed as critical raw materials (CRMs) by the European Commission. CRMs are particularly important for high tech products and emerging innovations, and are therefore relevant for combating climate change [5]. Even though not all battery metals are listed as CRMs, a rapid increase of EVs could also impact their availability in the near future [5,6].
Recycling becomes more important and attractive with an increase in the supply risk. For example, when the demand of cobalt outpaces the production as a side product from nickel and copper mines, the processing of cobalt from other sources, such as secondary raw materials or residues, becomes more attractive. However, the resources might not be adequate and the development of such extraction processes might not be responsive enough. This supply risk has resulted in the use of substitute materials, such as nickel, for batteries. On the other hand, such substitution might switch the supply risk from cobalt to nickel [7].
Both pyrometallurgical and hydrometallurgical routes have been proposed for LIB recycling [8]. Prior to the aforementioned processes, logistics, safe discharge, and mechanical pre-treatment play a significant role in the end-of-life battery processing chain [9,10]. Usually, secondary raw materials consist of a mixed feed with a varying chemical composition. One of the main challenges in recycling is the unpredictable composition of materials and the sequencing difficulties of characterizing inhomogeneous material. The most recent focus in the research field has been on hydrometallurgical processes [8]. Pyrometallurgical research on LIB recycling has mainly focused on the recovery of Co and Ni [11]. Industrial-scale pyrometallurgical processes that can use battery scrap fractions or have been developed for recycling batteries include the Inmetco process [11], the roasting-smelting process at Xstrata, the ValéasTM process by Umicore [8], and the Sony process [12].
This study emphasizes the possibility of integrating battery recycling into an existing industrial nickel slag cleaning process in an electric furnace. Introducing secondary raw materials along with the primary raw materials avoids the need to build and invest in new technologies or facilities. On the other hand, it is undeniably evident that the development of new recycling technologies is extremely important, due to the complex nature of secondary raw materials and their specific treatment needs. The chosen recycling process depends not only on the input feed, but also on the product properties, such as the purity requirements, refinement need, and end use. The origin and location of the end-of-life scrap affects both the location of the recycling facility and the chosen recycling process, as it is generally not economically feasible to transport the scrap long distances.
The direct Outotec (previously Outokumpu) nickel flash smelting (DON) technology is one of the prevailing processes for nickel smelting. In the DON process, dried nickel concentrate is fed to a flash smelting furnace (FSF), from which a matte and slag are obtained. The high-nickel, low-iron matte is further refined to recover valuables [13,14,15]. The Fe–Si–O slag, on the other hand, is mainly comprised of fayalite (Fe2SiO4), some ferric oxide (Fe2O3), and some magnesia (MgO), with minor concentrations of nickel and cobalt [16]. The valuable metals in the slag are recovered by cleaning the slag in an electric furnace (EF) [14], in which the chemically dissolved oxides are reduced and entrained metallic/sulfidic droplets are collected by relying on a gravity settling mechanism [17]. Conventionally, solid fossil fuels, such as coal and coke, are utilized as reducing agents in pyrometallurgical processes [18]. Typically, about 30 kg of metallurgical coke is used per 1 ton of slag [19]. To be able to recover Ni, Co, and Cu, and to liberate the metal matte inclusions in the slag, the reduction of ferric oxide to FeO is essential [20]. Typically, the tapped FSF slag contains about 5 wt % valuables [16] and 15 wt % magnetite [21] prior to cleaning. The target of the cleaning process is to reduce the solid magnetite content and recover most of the valuable metals [21].
The DON smelting slag contains a low amount of sulfur, which is why sulfidic concentrate is injected through lances in the electric furnace. Sulfur is added in order to enhance the dissolution of nickel, copper, and cobalt sulfides in the forming metal and lower the melting temperature of the EF matte or metal alloy [14]. In industrial DON smelting, approximately 77% of the cobalt from the nickel concentrate is deported to the slag. In the slag cleaning process, approximately half of the cobalt in the FSF slag is recovered in the EF matte [14]. Depending on the raw materials, the final EF matte can contain 50 wt % Ni and the EF slag can contain 0.1–0.6 wt % Ni [19].
However, for meeting the CO2 mitigation targets set out in the Paris Agreement [22], options for replacing liquid and solid fossil fuels in the metallurgical industry have recently gained attention [23,24,25,26]. Elements known to have good reducing properties in pyrometallurgical processes are carbon and hydrogen. Biomass, hydrogen, and synthetic bio-methane have been proposed for pyrometallurgical applications [24]. Attempts to replace fossil fuels with greener options are ongoing. An example is the Hydrogen Breakthrough Ironmaking Technology (HYBRIT) under development by SSAB, Vattenfall, and LKAB [25,26]. In HYBRIT, the coking coal in steelmaking is replaced with hydrogen in a direct reduction process, thus replacing the traditional blast furnace [25,26]. The recovery of valuables in copper slag cleaning by alternative reducing agents, such as hydrogen, biodiesel, and CO–CH4–Ar gas mixtures, has been studied by Nagasaka et al. [27], Li et al. [28], and Huaiwei et al. [29], respectively. It was recognized that these could be viable options for replacing coke. Replacing coke with a greener reductant in nickel slag cleaning is only one of many opportunities to decrease the environmental footprint of the non-ferrous metals industry.
Natural gas (NG), mainly comprised of methane (CH4) [24], can be considered as an option for a more environmentally friendly reducing agent [23]. However, NG is categorized as a fossil fuel and thus, synthetic natural gas from biomass would be a more viable option for replacing conventional reducing agents [24]. The use of such biomasses decreases the greenhouse gas emissions compared to fossil fuels and diversifies the utilized energy sources [30]. One of the main obstacles of using biomass-based reducing agents is that the price of coal has remained lower than the price of biomass-based reducing agents [23].
Hellstén et al. [31] studied the distribution of Ag, Au, Sb, and Pb between FeOx–K2O–MgO–SiO2 slag and a liquid Cu–Fe–Ni alloy and the tendency of the trace elements to volatilize in nickel slag cleaning conditions. According to the results, the trace elements are preferably recovered in the metal alloy in conditions close to the end-point of slag cleaning. Some studies exist regarding the equilibrium partition behavior of trace elements in nickel matte smelting. According to Strengell et al. [32], the presence of MgO in slag increases the deportment of Ni and Cu in matte. Trace elements such as Pb, Sn, and Ge are volatilized from the liquid phases, and deported to the flue dust [33]. A minor increase in the partition of Co to the matte was noticed when basic oxides MgO and K2O were added to the slag. Piskunen et al. [34] studied the distribution behavior of precious metals and platinum group metals between nickel matte and iron silicate slags in typical DON matte smelting conditions. The deportment of Pt, Au, and Pd to matte decreased with an increasing concentration of iron in matte, but increased with an increasing MgO concentration in slag. Ag was mainly volatilized during the experiments.
In addition, research on the reduction behavior of solid-state oxides with the use of methane as a reducing agent has been conducted. The reduction of solid-state chromite ore in CH4–H2 gas mixtures at 1100–1350 °C was proved to be highly efficient compared to the reduction behavior with ordinary carbothermic reduction [35]. A chromium-based and iron-based alloy formed on the surfaces of the ore grains and it was noticed that all chromium was reduced at the highest temperature. The reason for this efficient reduction was the high thermodynamic activity of carbon when provided by the cracking of methane. In experiments on the reduction of nickel oxide at 600–750 °C, a solid layer of nickel was formed on the surface of the oxide. Initially, the chemical reactions and diffusion rate control the overall reaction rate, but after the formation of the nickel layer, the overall reaction rate is controlled by diffusion through the product layer [36]. The conversion rate of cobalt oxide to cobalt increased with an increasing concentration of methane in experiments where porous oxide pellets were reduced in an atmosphere of Ar and CH4 at varying temperatures of 800–950 °C. At temperatures above 800 °C, the reduction rate might decrease due to carbon being deposited on the pellets and thus blocking the pellet pores [37]. One very recent study also investigated the possibility of using methane in the reduction of molten lead slag. Based on thermodynamic calculations and experimental work, they concluded that the use of methane in the reduction of lead oxide is possible, but high recoveries cannot be obtained without the simultaneous reduction of iron oxides to metallic Fe [38].
The aim of this study was to experimentally investigate the distribution behavior of Ni, Co, Mn, Zn, and Cu between slag obtained from a nickel flash smelting furnace and the forming metal phase in nickel slag cleaning conditions with methane reduction. A simplified flowchart of the process can be seen in Figure 1.
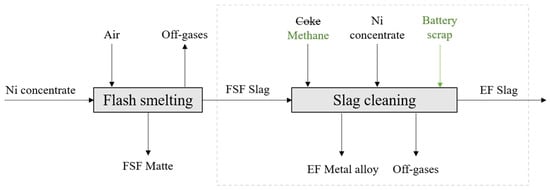
Figure 1.
A simplified flowchart of nickel flash smelting (DON) and slag cleaning. The box drawn with dashed lines indicates the focus area of this study. In this work, coke was replaced with methane and battery scrap was added as part of the feed material mixture.
2. Materials and Methods
Industrial slag from Boliden Harjavalta (Finland) was used in the experiments. The elemental composition of the slag, shown in Table 1, was analyzed with X-Ray Fluorescence (XRF) spectrometry.

Table 1.
Elemental composition of the nickel flash smelting slag mixture.
Industrial nickel concentrate from Boliden Harjavalta was added as a sulfur source in the slag mixture for lowering the liquidus temperature of the forming alloy. The nickel concentrate used in the experiments was dried at 100 °C for 24 h and then ground to fine powder. It contained 22–30 wt % S, 4.2 wt % Cu, 8.0 wt % Ni, and 0.4 wt % Co.
To study the integration of battery scrap recycling and nickel slag cleaning, both synthetic and industrial battery scrap materials were added to the slag-concentrate mixture. The additives used were LiCoO2 (Alfa Aesar, Kandel, Germany; purity: 97.0%); MnO (Alfa Aesar, Kandel, Germany; purity: 99.99%); and industrial, mechanically-treated battery scrap from Akkuser Oy (Nivala, Finland). The bulk chemical composition (Table 2) of the scrap used in the experiments was analyzed at Outotec Research Center by the Inductively Coupled Plasma (ICP) method. Before sample preparation, the battery scrap was ground in a mortar to make it more homogeneous.
Table 2.
Elemental composition of the mechanically-treated dry battery scrap fraction.
Three different mixtures were prepared and ground separately in a mortar to obtain fine and homogenous starting materials. Mixture 1 only contained slag and concentrate; mixture 2 contained slag, concentrate, and 7.5 wt % LiCoO2–MnO mixture; and mixture 3 contained slag, concentrate, and industrial battery scrap. Mixture 2 was prepared using a mass ratio of 2:1 LiCoO2 and MnO. The amount of battery scrap added in mixture 3 was selected so that the concentration of manganese was the same as in mixture 2. The mass of the concentrate was calculated based on the assumption that all Ni, Co, and Cu would be reduced and deported to the metal phase, and the final sulfur concentration of the formed metal would be 5 wt %. The compositions of the prepared mixtures are shown in Table 3. For each experiment, about 8 g of the mixture was placed in a magnesia crucible.
Table 3.
Feed mixture weights for mixtures 1–3.
The experiments were conducted in conditions simulating nickel slag cleaning in an electric furnace. A vertical 16/450 (maximum temperature: 1600 °C; heated length: 450 mm; Lenton, Parsons Lane, Hope, UK) laboratory furnace equipped with four silicon carbide heating elements, positioned near the alumina working tube (impervious pure alumina, 45/38 mm OD/ID), was used in the experiments. The temperature was monitored with a calibrated S-type Pt/Pt10Rh thermocouple (Johnson Matthey, London, UK, accuracy of ±3 °C) inside an alumina sheath, connected to multimeters (models 2000 and 2010, Keithley, Solon, OH, USA). The furnace temperature was controlled by a 3216 PID controller (Eurotherm, Worthing, UK). A schematic illustration of the furnace is shown in Figure 2.
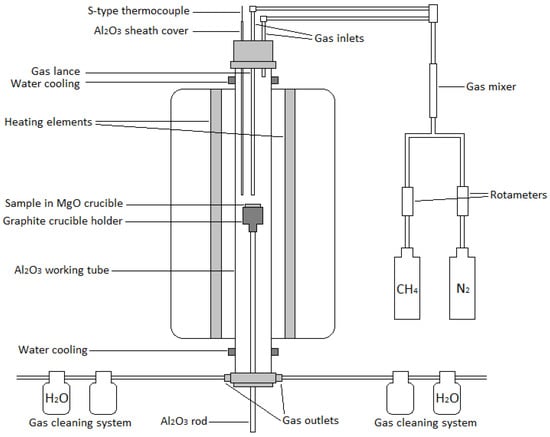
Figure 2.
Schematic of the furnace (not to scale).
Gases (N2, purity of 99.999% and CH4, purity of 99.5%, from AGA Linde, Finland) were injected from the top of the furnace either into the working tube or as top-blowing to the sample through an alumina tube acting as a lance (2 mm ID) (Figure 2). Rotameters (Kytola Instruments, Muurame, Finland) were used for regulating the gas flow rates. A multiple gas outlet piece was connected to the bottom part of the furnace and to two gas cleaning systems. The first bottles of the gas cleaning systems were empty, and the second bottles contained H2O. The samples were held in MgO crucibles (SC10012, 20/32 mm ID/H, Tateho Ozark Technical Ceramics, Webb City, MO, USA) during the experiments.
The magnesia crucible with the sample mixture was placed in a graphite crucible holder supported by an alumina rod. The bottom part of the furnace was sealed, and the work tube was flushed with nitrogen for 20 min to ensure the removal of air. After flushing, the sample was elevated from the bottom of the furnace by pushing the alumina rod upwards. The sample mixture was gradually raised higher towards the hot zone (at 1400 °C) for 15 min, in order to prevent excess thermal shock to the crucible and the work tube. After reaching the hot zone, the furnace was flushed for 10 min with nitrogen, in order to make sure that the slag melted completely. After the slag was molten, methane was injected into the furnace through the alumina lance. The methane content in the gas mixture was adjusted to approximately 5 vol%. The gas flow rate of the nitrogen-methane mixture was kept as constant as possible at 340 mL/min in every experiment.
The experiments were conducted at 1400 °C in CH4 (5 vol%)–N2 atmosphere with reduction times of 0, (1), 2.5, 5, 10, (15), and 20 min. After the set reduction time of the experiment was reached, the atmosphere was changed back to inert, and the sample was carefully lowered into the colder section of the furnace for slow cooling. The furnace was flushed with nitrogen for 10 min during cooling with the sample in the cold zone. After that, the sample was taken out of the furnace. The 20-min reduction experiment in Series 3 (with industrial battery scrap) had to be stopped after 15 min due to the formation of soot blocking the furnace gas lance. For Series 3, an additional experiment with a reduction time of 1 min was conducted.
The samples were crushed with a hammer after the cooling and drying. Selected pieces of the samples were mounted in epoxy resin for mineralogical analysis. After the epoxy was hardened, the surfaces of the samples were ground, polished, cleaned in ultrasonic washer in 99.5% ethanol, and coated with carbon.
The microstructures of the samples were analyzed using a Mira3 SEM (Scanning Electron Microscope, Tescan, Brno, Czech Republic) and the elemental compositions of the samples were determined with an UltraDry Silicon Drift Energy Dispersive Spectrometer (EDS, Thermo Fisher Scientific, USA). Thermo-Scientific NSS Spectral Imaging software was used for concentration quantifications. Point analyses were employed for the individual phases, and area analyses for the total elemental concentrations in slag and metal phases. For determining the total elemental concentrations, at least eight areas were analyzed from the metal and slag phases of each sample, and the size of each area was approximately 100 µm × 100 µm. The acceleration voltage was 15 kV and the beam current on the sample surface was approximately 11 nA. The standards used for concentration quantifications were copper (Cu Kα), cobalt (Co Kα), magnesium (Mg Kα), nickel (Ni Kα), manganese (Mn Kα), zinc (Zn Kα), hematite (Fe Kα), quartz (Si and O Kα), calcite (Ca Kα), and marcasite (S Kα). The Proza-ZAF matrix correction procedure was applied for processing the raw data [39].
Another option would have been to conduct manual phase separation, dissolution, and chemical analysis of the dissolved phases, hence the relatively large sample mass. However, this was not conducted due to the high risk of the inclusion of entrained metal droplets in the analyzed slag volume, which would have significantly distorted the concentration values obtained for minor/trace elements in the slag. The benefits of direct phase analysis methods over manual phase separation followed by chemical analyses for trace element quantifications have been discussed in the literature [40,41].
3. Results and Discussion
The distribution behaviors of Ni, Co, Mn, Zn, and Cu between the slag and metal in conditions simulating slag cleaning in an electric arc furnace were studied. Li was not analyzed, as it is too light an element for EDS detection. However, it is known that effectively all Li is deported in the slag [42]. The microstructures of the samples were studied visually from SEM images obtained using backscattered electrons, while the EDS results were utilized for studying the compositions of the formed phases. The elemental concentrations of slag and metal alloy are presented in Appendix A, Table A1 and Table A2, and their standard deviation is displayed in Table A3 and Table A4. In addition to slag and concentrate, Series 1 contained no additives, Series 2 contained synthetic LiCoO2 and MnO, and Series 3 contained industrial battery scrap. The Series ID corresponds to the Mixture ID in Table 3, Table A1, and Table A2.
The thermodynamic stability of pure metal oxides at 1000–1500 °C was calculated with HSC Chemistry software (version 6.12, Outotec, Finland). According to the Ellingham diagram in Figure 3, the reduction of metal oxides at 1400 °C occurs in the following order: Fe2O3/Fe3O4, Cu/Cu2O, Ni/NiO, Co/CoO, FeO/Fe3O4, Fe/Fe2O3, Fe/FeO, Mn/MnO, and Mg/MgO.
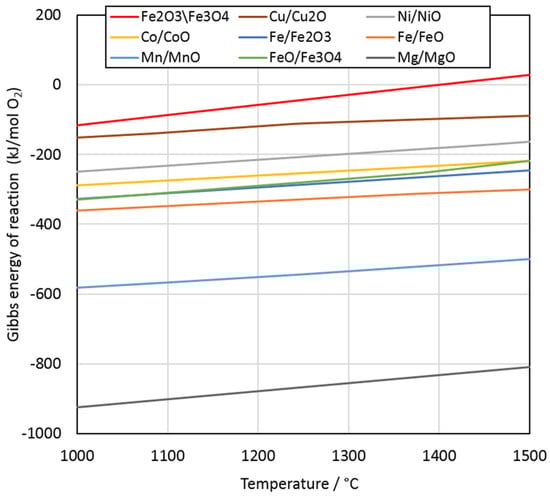
Figure 3.
Ellingham diagram of selected metal oxide reductions at 1000–1500 °C.
3.1. Microstructures of Slag and Metal Phase
At the reduction time of 0 min (only melting in an inert atmosphere), the samples were in a molten state, showing no signs of forming a larger metal phase. However, small metal/sulfide droplets were entrained inside the slag. The droplets were most likely entrained nickel matte in the slag during the nickel flash smelting, as no reduction of metals is expected to occur when flushing the furnace with inert gas flow. Some migration and coagulation of droplets may have occurred during the flushing and, thus, the droplets may appear larger than they were in the flash smelting furnace.
The general microstructures of the samples were similar, regardless of the composition of the starting mixture. Figure 4 shows micrographs of the slag in Series 2 with synthetic LiCoO2–MnO additives. Figure 4A shows the general microstructure of the sample after a reduction time of 5 min, which consisted of a metal alloy (Ni–Fe–Co–Cu) and slag. The slag phase appears as a mixed structure and is comprised of fayalite-olivine crystals and a glassy, intergranular phase. The crystalline structure of the slag is a consequence of slow cooling of the samples. Figure 4B shows the slag before reduction at time 0, Figure 4C presents the slag phase after 2.5 min, and Figure 4D displays the slag after 20 min.
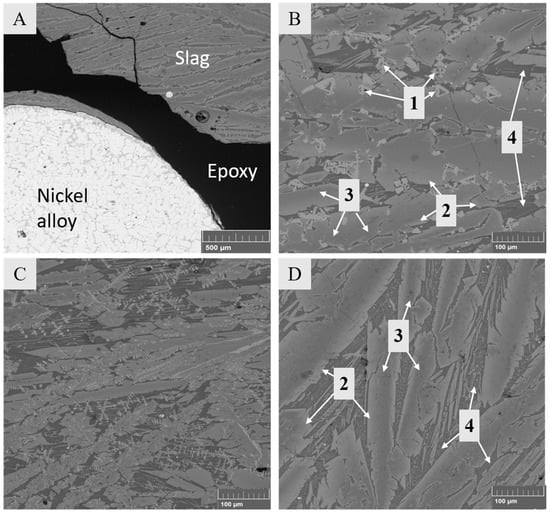
Figure 4.
Microstructures of solidified samples with LiCoO2–MnO additives. (A) General overview after 5 min of reduction; (B) slag before reducing conditions (0 min) with marked phases 1–4; (C) slag after 2.5 min; (D) slag after 20 min.
Figure 4B points out four different phases in the solidified slag before its reduction (time 0, with slow cooling). According to the analysis results in Table 4, the chemical composition of dendrite-shaped phase 1 corresponds to magnetite (Fe3O4), phase 2 to fayalite (Fe2SiO4), phase 3 to olivine (Mg2+, Fe2+)2SiO4, and phase 4 to amorphous glassy phase with a high SiO2 concentration. Our observations are in good agreement with the study of Waanders and Nell [43] focused on the chemical compositions of phases in slags from a direct nickel flash furnace and associated slag cleaning furnace.
Table 4.
Average concentrations (wt %) of elements in phases 1–4 seen in Figure 4B,D. Stable oxide formers have been converted into oxides.
When comparing the microstructures in Figure 4B–D, it is evident that the dendritic-shaped magnetite became smaller after 2.5 min and disappeared completely after 20 min. These observations are in good agreement with the Ellingham diagram (Figure 3), which shows that the reduction of magnetite to ferrous oxide occurs before the reduction of the other oxides.
Figure 5 shows an overview of the microstructure of the metal alloy phase for the system with the LiCoO2–MnO mixture, and the changes over time. Figure 5A shows the metal alloy after 2.5 min, 5B after 5 min (different magnification), 5C after 10 min, and 5D after 20 min reduction. Three phases were observed and are indicated in Figure 5B. In all experiments, the metal alloy already started to form after 2.5 min.
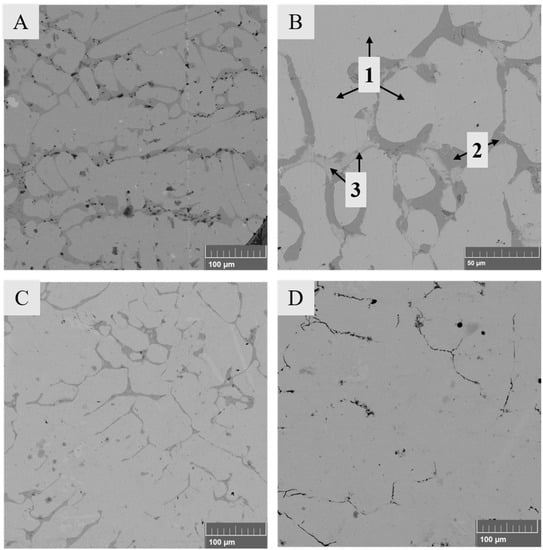
Figure 5.
Microstructure of the solidified metal alloy with added LiCoO2–MnO mixture after (A) 2.5 min, (B) 5 min, (C) 10 min, and (D) 20 min of reduction.
Table 5 shows the average compositions of phases 1–3 observed in the metal alloy after 5 min of reduction. The metal alloy is mainly comprised of phase 1 (bulk metal alloy) with 40.2 wt % Ni, 26.7 wt % Fe, 25.8 wt % Co, 6.3 wt % Cu, and effectively no sulfur. Phases 2 and 3 are different sulfides; the first one is essentially nickel matte with dissolved cobalt, and the latter one is copper sulfide (Cu2S) with low concentrations of dissolved Ni, Co, Fe, and Zn. The different phases most likely segregated during the slow cooling and based on the compositions, copper was preferentially deported to a phase other than iron, cobalt, and nickel. Visual inspection suggests that the amount of sulfide phase within the alloy decreases with an increasing time and mass of the forming metal alloy.
Table 5.
Average concentrations (wt %) of elements in phases 1–3 indicated in Figure 5B.
3.2. Compositions of Slag and Metal Alloy
3.2.1. Iron in the Slag and Metal Alloy
The iron to silica (Fe/SiO2) ratio in slag is a parameter commonly used to control the slag properties in the industry. The calculated Fe/SiO2 ratio in slag (w/w) is presented in Figure 6. The ratio varied between 1.2 and 0.8, with a decreasing trend as the reduction time increased. These values are in good agreement with the data provided by Waanders and Nell [43], who investigated the chemical composition of phases in slag from a nickel slag cleaning furnace. According to their study, the Fe/SiO2 ratio in industrial nickel EF slag varies between approximately 0.9 and 1.1. In our investigation, the Fe/SiO2 ratio decreased over time due to the decreasing iron concentration in the slag after 2.5 min of reduction with methane, as presented in Figure 7A.
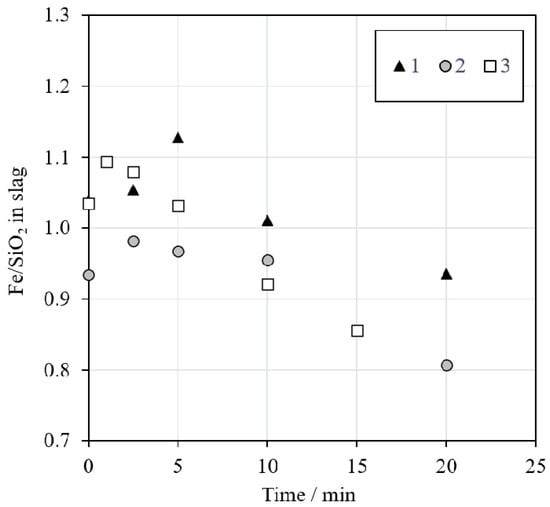
Figure 6.
Fe/SiO2 ratios in the slag as a function of time during reduction with an N2 + 5% CH4 mixture.
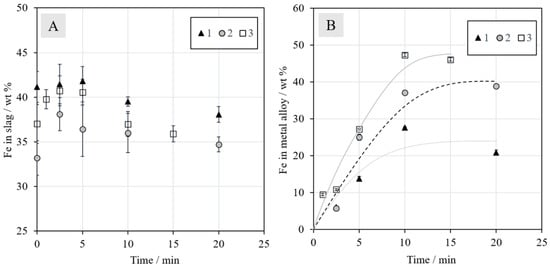
Figure 7.
Concentrations (wt %) of iron in (A) slag and (B) metal alloy during reduction with N2 + 5% CH4.
The concentrations of iron in the metal alloys, presented in Figure 7B, increased until 10 min, after which they began to stabilize. The trend lines were drawn to assist the reader and to emphasize the significant differences in the final iron concentrations between different series. In Series 1, without additives, the final iron concentration was slightly below 25 wt %. In Series 2 with synthetic battery oxides, the corresponding concentration increased to approximately 40 wt %. A final iron concentration of above 45 wt % was obtained with the addition of industrial battery scrap in Series 3. This increase can be at least partially attributed to the carbon present in the battery scrap: it enhances the reduction. The results should be interpreted whilst keeping in mind that they most likely exhibit relatively high deviations due to the experimental set-up: The sample size was quite large, the time taken for lowering the sample into the cold zone for cooling was not always exactly the same, slight heterogeneities may have been present in the industrial battery scrap, and the experiments were not repeated. EDS area analyses of heterogeneous samples also contain errors, as the matrix correction procedures used assume a homogeneous area of analysis. These errors are definitively larger than the relatively small standard deviations (±1σ), especially for the metal alloy, included in the concentration figures. However, the trends obtained in this study clearly show the differences as a function of time and with different battery scrap additions in different series.
As the metal alloy already started to form after the 1-min experiment (in Series 3), it is evident that the reduction of magnetite to ferrous oxide (Figure 3) begins very rapidly. It also progresses far enough for other metals, such as copper and nickel, to start reducing simultaneously, even before one min.
3.2.2. Nickel in the Slag and Metal Alloy
The concentrations of nickel in the slag and metal alloy as a function of reduction time are presented in Figure 8. The concentrations of nickel in the slag at time zero were approximately 2.8, 4.0, and 2.6 wt % in Series 1, 2, and 3, respectively. The deviation is attributed to the higher amount of concentrate in Series 2. When the reduction began, the concentration started to decrease rapidly in all series. From 10 min onwards, the concentrations were similar in all series and the final concentrations were negligible, i.e., below reliable detection limits with EDS (<0.1 wt %). The reduction of nickel was in line with industrial practices with 0.1–0.6 wt % nickel in the EF slag after slag cleaning [19], preferentially on the lower side of that range.
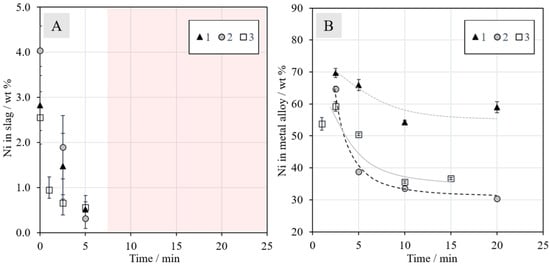
Figure 8.
Concentrations (wt %) of nickel in the (A) slag and (B) metal alloy as a function of reduction time in N2 + 5% CH4 mixtures. No experimental points are shown after 5 min of reduction for nickel, since its concentration in the slags was under the detection limit of EDS; this has been indicated with the shaded area in Figure 8A.
Figure 8B shows the nickel concentration in the metal phase as a function of time. In all series, the nickel concentration decreased until 10 min, after which it began to stabilize. The final concentration in Series 1 was slightly below 60 wt %, Series 2 approximately 30 wt % and Series 3 approximately 35 wt %. It should be noted that the concentration decrease with an increasing reduction time does not mean that the mass of nickel in the alloy decreased; only the fraction of nickel in the alloy phase decreased when the reduction of other metals progressed further. The final nickel concentration in the alloy is closest to industrial operation [19] in Series 1, which is logical considering that the experiments were conducted with raw materials corresponding to those employed in industrial practice. This observation shows that the efficiency of methane as a reductant is comparable to that of coke.
3.2.3. Cobalt in the Slag and Metal Alloy
The concentrations of cobalt in the slag and metal alloy can be seen in Figure 9A,B, respectively. The initial concentration of cobalt in the slag was around 1.0 wt % in Series 1 and 3, and in Series 2, it was 4.9 wt %, due to the addition of synthetic battery scrap. The final Co concentration in slag in Series 3 after 15 min was approximately 0.6 wt % and it was similar in Series 1, with a value of 0.4 wt %, after 20 min. The final Co concentration in slag in Series 2 was similar to the initial value in Series 1 and 3, but a longer reduction time could decrease the level even further, as it did not seem to level out during the 20 min. The relatively low concentration of Ni in the Ni–Co–Fe–Cu alloy after 20 min in Series 2 can be explained by the high concentration of Co not normally present in industrial nickel slag cleaning, and the Li oxides (not quantified in this work) in the slag may also have had an effect. Figure 9B clearly shows that the concentrations of cobalt in the metal alloys increase as a function of time, but no clear progress is observed after 10 min of reduction.
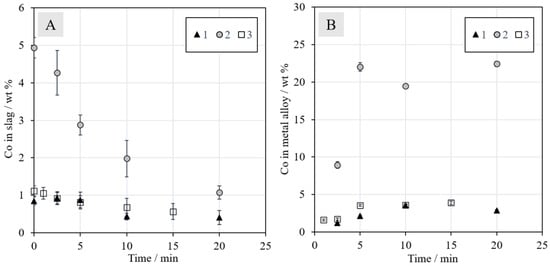
Figure 9.
Concentrations (wt %) of cobalt in the (A) slag and (B) metal alloy as a function of time in N2 + 5% CH4 mixtures.
3.2.4. Manganese and Zinc in Slag
The concentrations of manganese and zinc in the metal alloy were low and therefore, only the concentrations in slags are shown in Figure 10. The concentration of Mn increases slightly with an increasing reduction time due to the reduction of other oxides from the slag. It should be noted that Mn was only present in Series 2 and 3 when synthetic MnO and industrial battery scrap were added, respectively. In Series 1, the mixture did not contain Mn and the concentration was negligible.
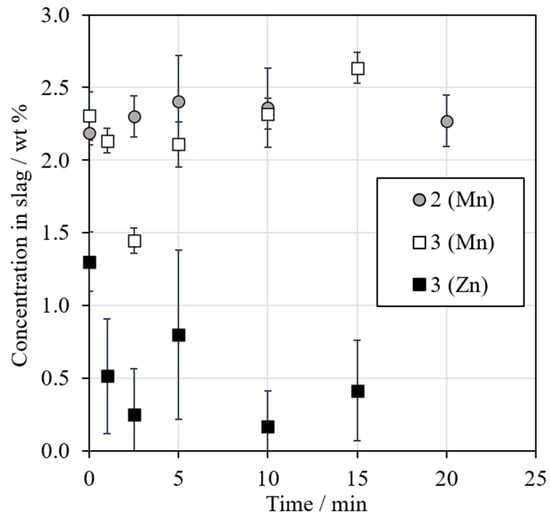
Figure 10.
Concentrations (wt %) of manganese and zinc in slag as a function of the reduction time.
MnO2 has been used as a flux in a recently proposed smelting reduction method for the recovery of Co, Ni, and Cu from LIBs [44]. The thermodynamic behavior of manganese favors its enrichment in the slag phase in both black copper smelting and converting due to the very high stability of manganese (II) oxide at high temperatures, as seen in Figure 3 and confirmed experimentally by Dańczak et al. [42].
The concentration of zinc in slag in Series 3 decreased when the reduction progressed, but the concentration in the metal phase still remained low. This indicates that Zn was reduced and then volatilized with an increasing reduction time. In the primary zinc industry, zinc is recovered from the sinter product and secondary materials by reducing ZnO with coke at 1400 °C, resulting in the rapid vaporization of metallic zinc [45,46]. In Series 1 and 2 with less zinc from the beginning, the concentrations were negligible (below 0.1 wt %) throughout the experiments.
3.2.5. Sulfur in the Metal Alloy
Figure 11 shows the concentration of sulfur in the metal alloy as a function of reduction time. The concentration decreased with an increasing time in all series, which is in line with the visual observations of the sample microstructures in Figure 5. The aim was to have approximately 5 wt % sulfur in the final alloy, but the concentration decreased below that. The sulfur in the metal alloy may have reacted with the surrounding methane-containing atmosphere and formed, e.g., CS2 or H2S [47]. The high concentration of iron in the formed metal alloy was also not included in the calculations regarding the amount of concentrate addition.
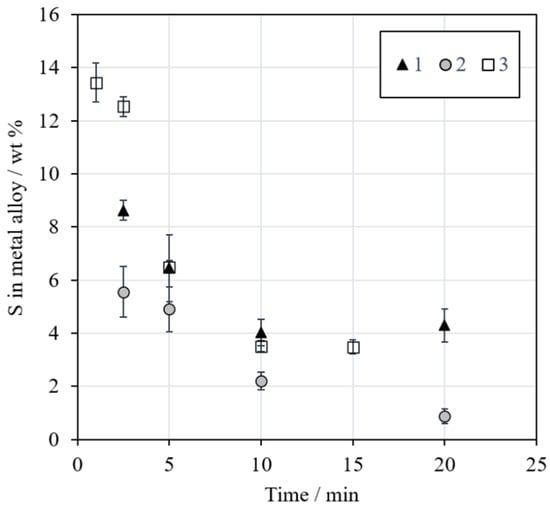
Figure 11.
Concentration (wt %) of sulfur in the metal alloy as a function of reduction time.
3.3. Distributions of Metals
In a system with two phases, the distribution equilibrium of elements between, e.g., a metal or metal sulfide phase (m) and a slag (s) can be described with distribution coefficients. The distribution coefficient of the element Me between two phases is expressed as the ratio of weight concentrations of Me dissolved in the phases (Equation (1)) [33].
Figure 12 shows the distribution coefficients obtained for nickel (12A) and cobalt (12B) as a function of reduction time in CH4–N2 atmosphere. The deportments of nickel and cobalt to the metal alloy start immediately when the molten sample is in contact with the reductant. However, the reduction rate of nickel oxide seems to be much faster than the reduction of cobalt oxide, which complies with the Gibbs energy data presented in the Ellingham diagram.
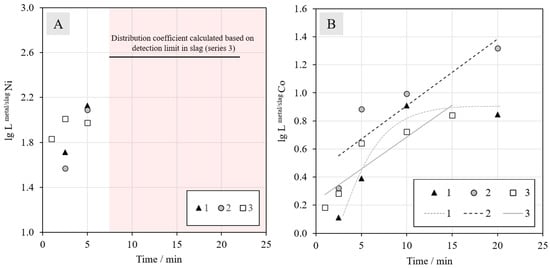
Figure 12.
Distribution coefficients of (A) nickel and (B) cobalt between the metal alloy and slag at different reduction times with an N2 + 5% CH4 gas mixture. For nickel, the values after 5 min are not shown, because the concentrations in slag were under the detection limits of EDS.
The value of the distribution coefficient of nickel between the metal alloy and slag is only shown for the two shortest reduction times, since the concentrations of nickel in the slag were below the detection limit with EDS after longer periods of time. Based on the values for 2.5 and 5 min, nothing can be said about the effect of synthetic or industrial battery scrap additions. The horizontal black line in Figure 12A indicates the minimum distribution coefficient for series 3, calculated based on the detection limit (0.1 wt %) in the slag; the actual distribution coefficients after 10 min are above this line.
For cobalt, the addition of synthetic battery scrap in Series 2 has a strongly increasing effect on its recovery from the beginning of the reduction. The higher concentration of cobalt in the mixture resulted in a higher amount of metal droplets in the slag, which increased the probability of their coalescence and finally settling into the metal alloy under the slag layer. Based on the results, the reduction of cobalt oxide does not seem to progress further after 10 min in Series 1, but for the other two series, the value of the distribution coefficient does not stabilize during the time series investigated in this work. As the number of experiments was limited, definitive conclusions should be drawn carefully in the absence of more experimental data.
According to the Ellingham diagram in Figure 3, the reduction of metal oxides at 1400 °C occurs in the following order: Fe2O3/Fe3O4, Cu/Cu2O, Ni/NiO, Co/CoO, FeO/Fe3O4, and Fe/Fe2O3. The reduction of MnO to Mn by carbon is not thermodynamically favorable at 1400 °C. The reduction of magnetite should occur first, until the magnetite concentration is low enough to enable the reduction of Cu and Ni, which was confirmed by visual observations of sample microstructures. The results indicated that a significant fraction of Ni oxides was reduced prior to Co and Fe oxides. Therefore, the order of reduction was in line with the Ellingham diagram.
3.4. Thermodynamic Calculations
MTDATA software and the MTOX database [48] were utilized for slag and alloy equilibrium calculations during reduction. Figure 13 presents the behavior of a DON slag composition similar to Series 3 on a triangular section of the SiO2–FeO–Fe2O3 ternary system at 1400 °C, with oxygen activity contours superimposed. With a decreasing oxygen partial pressure, i.e., increasing reduction time, the system is approaching iron saturation on the left. This figure does not perfectly depict the experimental system in this work, as it neglects the MgO, Al2O3, and CaO concentrations and the experiments most likely did not reach equilibrium after 20 min of reduction. However, it still gives an indication of the slag system and its behavior under the experimental conditions.
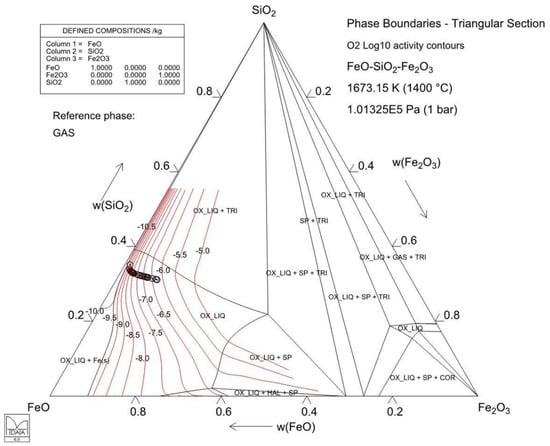
Figure 13.
Isothermal section of the SiO2–FeO–Fe2O3 slag equilibrium system at 1400 °C. The black circles refer to the calculated slag compositions based on the initial composition of Series 3. The red lines are oxygen isoactivity contours (and their labels are the log10 of oxygen partial pressure/atm) calculated with MTDATA software and the MTOX 8.2 database [48]. The phase labels are COR = Fe2O3, HAL = FeO, OX_LIQ = slag, SP = Fe3O4, and TRI = tridymite (SiO2).
Figure 14 shows the Co:Ni ratio calculated for the forming metal alloy as a function of the oxygen partial pressure and magnetite content in the same slag depicted in Figure 13. In this study, for Series 1, the ratio after 2.5 min of reduction was approximately 0.01 and after 20 min, it was approximately 0.04. For Series 2, the ratios were approximately 0.14 and 0.83, respectively. For Series 3, the corresponding ratios (after 2.5 and 15 min) were approximately 0.03 and 0.08. Based on these values, the oxygen partial pressure (Figure 14) is slightly lower in Series 3 compared to Series 1. In Series 2, the oxygen partial pressure is considerably lower, indicating that the reduction has progressed further. This is supported by the distribution coefficient values in Figure 12.
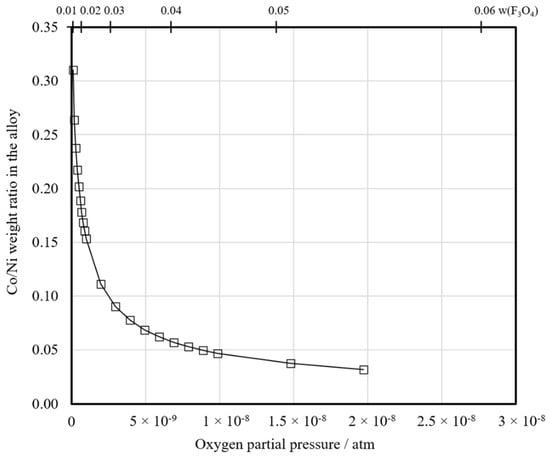
Figure 14.
The calculated equilibrium ratio of cobalt to nickel in the metal alloy and its development as a function of the oxygen partial pressure and magnetite content in the slag during the reduction of Series 3 slag.
4. Conclusions and Future Research
A study on the possibility of battery recycling with the existing industrial nickel slag cleaning process has not previously been reported. Therefore, these initial research findings lay a base for further research. Even with uncertainties in the actual concentration values obtained, the results clearly show that methane can be used as an effective reductant in the nickel slag cleaning process on a laboratory scale. Replacing conventional coke with an alternative reductant offers possibilities for smelters to reduce their environmental footprint and combat climate change. The use of methane in an electric arc furnace surely requires further development and modifications to the present furnace design; however, closed furnaces with capabilities for off-gas collection and reuse as fuel already exist in modern ferroalloy production [49]. Moreover, integrating battery recycling into an existing industrial process enhances the introduction of new circular economy concepts to companies and society.
The reduction experiments resulted in the formation of slag and an Ni–Co–Cu–Fe alloy with varying concentrations of valuables, depending on the starting mixture. The reduction of nickel oxide started almost immediately when the molten slag was in contact with the CH4–N2 jet. The reaction rate was high and after 5 min of reduction, the distribution coefficient of nickel between metal and slag was already approximately 102.
The results also indicated that it is beneficial to add a battery scrap fraction rich in Co to nickel-slag in order to increase the recovery of Co. This phenomenon should also apply to other metals, such as Ni, even though it was not experimentally confirmed in this study due to the relatively high detection limits of the EDS analysis technique. The final recoveries of valuables in the metal alloy depend on the coalescence of the metal droplets in the slag, i.e., the greater the number of droplets, the higher the probability of coalescence and settling to the metal alloy. Therefore, the optimal ratio between slag and added secondary material and the physical form of scrap must be determined. Based on the calculated reduction path and the developing Co:Ni ratio in the metal alloy as a function of the oxygen partial pressure and magnetite content, not all of the cobalt can be recovered from the slag prior to saturation with solid iron.
The rate controlling steps should also be determined to enhance the process efficiency. The reaction rate can be affected by, e.g., soot formation that may be blocking reaction sites or gas flow. On an industrial scale, the formation of soot may be problematic; the amount of free carbon should be minimized to decrease the soot formation and methane consumption. Therefore, further research needs to be conducted with varying fractions of methane in an inert carrier gas. Additionally, other alternative reducing agents should be considered. In addition, the decreasing concentration of sulfur in the metal alloy suggested the possible formation of sulfur-carrying gases (i.e., CS2 and/or H2S) in the reduction process. It would be beneficial to use a suitable gas analyzer in the next step of this study, in order to identify the gaseous products formed in the process and to investigate, in detail, the role of hydrogen in the reduction.
Author Contributions
Conceptualization, P.T. and A.J.; methodology, R.R., A.D., L.K., and A.J.; software, R.R., A.D., and L.K.; validation, R.R., A.D., L.K., P.T., and A.J.; formal analysis, R.R., A.D., and L.K.; investigation, R.R., A.D., and L.K.; resources, A.J. and D.L.; data curation, R.R., A.D., and A.J.; writing—original draft preparation, R.R., A.D., and L.K.; writing—review and editing, P.T., D.L., and A.J.; visualization, R.R. and A.D.; supervision, L.K., D.L., and A.J.; project administration, A.J. and D.L.; funding acquisition, D.L. and A.J. All authors have read and agreed to the published version of the manuscript.
Funding
This research was funded by the BATCircle project, grant number 4853/31/2018, and the SYMMET project, grant number 3891/31/2018.
Acknowledgments
Special thanks to Boliden Harjavalta (Finland) for providing industrial nickel slag and concentrate, and Akkuser Oy (Finland) for providing battery scrap. This study utilized the RawMatTERS Finland infrastructure (RAMI, Academy of Finland) at Aalto University, GTK, and VTT. L.K. is grateful for the doctoral study grant provided by the Finnish Steel and Metal Producers’ Fund. The help of Otso Matikainen in performing some of the experiments is also acknowledged.
Conflicts of Interest
The authors declare no conflicts of interest. The funders had no role in the design of the study; in the collection, analyses, or interpretation of data; in the writing of the manuscript; or in the decision to publish the results.
Appendix A
Table A1.
Average elemental concentrations (wt %) in slag as a function of time in different series, presented with a one decimal accuracy. <MDL = below the minimum detection limit of EDS.
Table A1.
Average elemental concentrations (wt %) in slag as a function of time in different series, presented with a one decimal accuracy. <MDL = below the minimum detection limit of EDS.
| Slag Phase | |||||||||||
|---|---|---|---|---|---|---|---|---|---|---|---|
| Mixture ID | Reduction Time/min | Concentration/wt % | |||||||||
| Al | Ca | Mg | Si | Co | Cu | Fe | Ni | Mn | Zn | ||
| 1 | 0 | 1.5 | 1.4 | 5.0 | 18.5 | 0.8 | 0.4 | 41.2 | 2.8 | - | <MDL |
| 2.5 | 1.6 | 1.5 | 6.0 | 18.4 | 0.9 | 0.1 | 41.5 | 1.5 | - | <MDL | |
| 5 | 1.1 | 1.1 | 6.4 | 17.3 | 0.9 | 0.1 | 41.8 | 0.5 | - | <MDL | |
| 10 | 1.8 | 1.7 | 5.9 | 18.3 | 0.4 | 0.1 | 39.5 | <MDL | - | <MDL | |
| 20 | 2.0 | 2.1 | 5.4 | 19.0 | 0.4 | <MDL | 38.1 | <MDL | - | <MDL | |
| 2 | 0 | 0.8 | 0.6 | 7.9 | 16.6 | 4.9 | 1.2 | 33.2 | 4.0 | 2.2 | <MDL |
| 2.5 | 1.8 | 1.4 | 5.5 | 18.1 | 4.3 | 0.4 | 38.1 | 1.9 | 2.3 | <MDL | |
| 5 | 1.9 | 1.6 | 4.2 | 17.6 | 2.9 | 0.1 | 36.4 | 0.3 | 2.4 | <MDL | |
| 10 | 2.0 | 1.6 | 4.7 | 17.6 | 2.0 | 0.1 | 36.0 | <MDL | 2.4 | <MDL | |
| 20 | 3.5 | 2.9 | 1.4 | 20.1 | 1.1 | <MDL | 34.7 | <MDL | 2.3 | <MDL | |
| 3 | 0 | 0.5 | 0.5 | 8.0 | 16.7 | 1.1 | 0.5 | 37.0 | 2.6 | 2.3 | 1.3 |
| 1 | 1.5 | 1.3 | 5.3 | 17.0 | 1.1 | 0.1 | 39.8 | 0.9 | 2.1 | 0.5 | |
| 2.5 | 0.9 | 0.8 | 7.9 | 17.7 | 0.9 | 0.1 | 40.7 | 0.7 | 1.4 | 0.3 | |
| 5 | 1.9 | 1.8 | 4.7 | 18.4 | 0.8 | 0.1 | 40.6 | 0.6 | 2.1 | 0.8 | |
| 10 | 1.1 | 0.9 | 8.6 | 18.8 | 0.7 | <MDL | 37.0 | <MDL | 2.3 | 0.2 | |
| 15 | 2.3 | 2.0 | 4.0 | 19.6 | 0.6 | <MDL | 35.9 | <MDL | 2.6 | 0.4 | |
Table A2.
Average elemental concentrations (wt %) in the metal alloy as a function of time in different series.
Table A2.
Average elemental concentrations (wt %) in the metal alloy as a function of time in different series.
| Metal Alloy | |||||||
|---|---|---|---|---|---|---|---|
| Mixture ID | Reduction Time/min | Concentration/wt % | |||||
| Co | Cu | Fe | Ni | S | Zn | ||
| 1 | 2.5 | 1.2 | 12.1 | 6.1 | 69.7 | 8.6 | 0.7 |
| 5 | 2.1 | 10.5 | 13.8 | 65.9 | 6.5 | 0.2 | |
| 10 | 3.5 | 9.5 | 27.6 | 54.3 | 4.0 | 0.2 | |
| 20 | 2.8 | 12.2 | 20.9 | 59.0 | 4.3 | 0.2 | |
| 2 | 2.5 | 8.9 | 12.6 | 5.7 | 64.7 | 5.6 | 0.8 |
| 5 | 22.0 | 8.3 | 25.0 | 38.8 | 4.9 | 0.2 | |
| 10 | 19.5 | 6.5 | 37.1 | 33.5 | 2.2 | 0.2 | |
| 20 | 22.4 | 6.6 | 38.9 | 30.3 | 0.9 | 0.1 | |
| 3 | 1 | 1.6 | 19.9 | 9.5 | 53.7 | 13.4 | 0.8 |
| 2.5 | 1.7 | 14.0 | 10.8 | 59.2 | 12.5 | 0.8 | |
| 5 | 3.6 | 10.9 | 27.2 | 50.4 | 6.5 | 0.6 | |
| 10 | 3.6 | 8.6 | 47.3 | 35.6 | 3.5 | 0.4 | |
| 15 | 3.9 | 8.8 | 46.1 | 36.7 | 3.5 | 0.4 | |
Table A3.
Standard deviations (1σ) of elemental concentrations in slag.
Table A3.
Standard deviations (1σ) of elemental concentrations in slag.
| Slag Phase | |||||||||||
|---|---|---|---|---|---|---|---|---|---|---|---|
| Mixture ID | Reduction Time/min | Standard Deviation/wt % | |||||||||
| Al | Ca | Mg | Si | Co | Cu | Fe | Ni | Mn | Zn | ||
| 1 | 0 | 0.3 | 0.3 | 1.2 | 0.5 | 0.1 | 0.3 | 1.7 | 0.9 | - | - |
| 2.5 | 0.6 | 0.5 | 2.2 | 0.3 | 0.2 | 0.1 | 2.2 | 0.7 | - | - | |
| 5 | 0.3 | 0.3 | 1.2 | 0.3 | 0.2 | 0.1 | 1.6 | 0.2 | - | - | |
| 10 | 0.6 | 0.5 | 1.7 | 0.5 | 0.1 | 0.1 | 0.5 | - | - | - | |
| 20 | 0.7 | 0.9 | 2.4 | 0.8 | 0.2 | - | 0.9 | - | - | - | |
| 2 | 0 | 0.3 | 0.3 | 1.0 | 0.5 | 0.3 | 0.2 | 1.9 | 0.6 | 0.1 | - |
| 2.5 | 0.8 | 0.6 | 2.0 | 0.6 | 0.6 | 0.3 | 1.9 | 0.7 | 0.1 | - | |
| 5 | 0.7 | 0.6 | 1.5 | 0.8 | 0.3 | 0.1 | 3.1 | 0.2 | 0.3 | - | |
| 10 | 0.9 | 0.9 | 3.0 | 0.5 | 0.5 | 0.0 | 2.2 | - | 0.3 | - | |
| 20 | 0.3 | 0.4 | 0.5 | 0.4 | 0.2 | - | 0.8 | - | 0.2 | - | |
| 3 | 0 | 0.4 | 0.3 | 1.4 | 0.4 | 0.1 | 0.3 | 2.2 | 0.6 | 0.2 | 0.2 |
| 1 | 0.3 | 0.3 | 1.2 | 0.2 | 0.2 | 0.2 | 1.1 | 0.3 | 0.1 | 0.4 | |
| 2.5 | 0.4 | 0.3 | 1.7 | 0.4 | 0.2 | 0.1 | 1.7 | 0.2 | 0.1 | 0.3 | |
| 5 | 0.6 | 0.7 | 1.9 | 0.4 | 0.2 | 0.1 | 1.5 | 0.3 | 0.2 | 0.6 | |
| 10 | 0.5 | 0.3 | 1.8 | 0.4 | 0.2 | - | 1.4 | - | 0.1 | 0.2 | |
| 15 | 0.5 | 0.4 | 1.5 | 0.6 | 0.2 | - | 0.9 | - | 0.1 | 0.3 | |
Table A4.
Standard deviations (1σ) of elemental concentrations in the metal alloy.
Table A4.
Standard deviations (1σ) of elemental concentrations in the metal alloy.
| Metal Alloy | |||||||
|---|---|---|---|---|---|---|---|
| Mixture ID | Reduction Time/min | Standard Deviation/wt % | |||||
| Co | Cu | Fe | Ni | S | Zn | ||
| 1 | 2.5 | 0.0 | 1.9 | 0.3 | 1.4 | 0.4 | 0.4 |
| 5 | 0.1 | 1.7 | 0.6 | 1.7 | 1.3 | 0.2 | |
| 10 | 0.1 | 0.9 | 0.2 | 0.7 | 0.5 | 0.1 | |
| 20 | 0.1 | 2.2 | 0.7 | 1.7 | 0.6 | 0.1 | |
| 2 | 2.5 | 0.4 | 0.9 | 0.3 | 0.9 | 0.9 | 0.2 |
| 5 | 0.6 | 1.3 | 0.8 | 0.6 | 0.8 | 0.1 | |
| 10 | 0.3 | 0.6 | 0.6 | 0.2 | 0.3 | 0.1 | |
| 20 | 0.4 | 0.6 | 0.6 | 0.3 | 0.3 | 0.1 | |
| 3 | 1 | 0.1 | 2.5 | 0.3 | 2.0 | 0.7 | 0.2 |
| 2.5 | 0.2 | 1.9 | 0.3 | 1.4 | 0.4 | 0.4 | |
| 5 | 0.1 | 0.8 | 0.2 | 0.4 | 0.2 | 0.2 | |
| 10 | 0.2 | 0.7 | 0.5 | 0.3 | 0.2 | 0.1 | |
| 15 | 0.2 | 0.4 | 0.4 | 0.4 | 0.3 | 0.1 | |
References
- A Vision for a Sustainable Battery Value Chain in 2030. Insight Report, September 2019. Unlocking the Full Potential to Power Sustainable Development and Climate Change Mitigation. Available online: http://www3.weforum.org/docs/WEF_A_Vision_for_a_Sustainable_Battery_Value_Chain_in_2030_Report.pdf (accessed on 4 March 2020).
- Nitta, N.; Wu, F.; Lee, J.T.; Yushin, G. Li-ion battery materials: Present and future. Mater. Today 2015, 18, 252–264. [Google Scholar] [CrossRef]
- Wang, X.; Gaustad, G.; Babbitt, C.W.; Richa, K. Economies of scale for future lithium-ion battery recycling infrastructure. Resour. Conserv. Recycl. 2014, 83, 53–62. [Google Scholar] [CrossRef]
- Zheng, X.; Zhu, Z.; Lin, X.; Zhang, Y.; He, Y.; Cao, H.; Sun, Z. A Mini-Review on Metal Recycling from Spent Lithium Ion Batteries. Engineering 2018, 4, 361–370. [Google Scholar] [CrossRef]
- European Commission. Report on Critical Raw Materials and the Circular Economy; European Commission: Brussel, Belgium, 2018. [Google Scholar] [CrossRef]
- Manberger, A.; Stenqvist, B. Global metal flows in the renewable energy transition: Exploring the effects of substitutes, technological mix, and development. Energy Policy 2018, 119, 226–241. [Google Scholar] [CrossRef]
- Campbell, G. The cobalt market revisited. Miner. Econ. 2019, 1–8. [Google Scholar] [CrossRef]
- Ren, G.-X.; Xiao, S.-W.; Xie, M.-Q.; Pan, B.; Chen, J.; Wang, F.-G.; Xia, X. Recovery of valuable metals from spent lithium ion batteries by smelting reduction process based on FeO–SiO 2 –Al 2 O 3 slag system. Trans. Nonferrous Met. Soc. China 2017, 27, 450–456. [Google Scholar] [CrossRef]
- Hu, J.; Zhang, J.; Li, H.; Chen, Y.; Wanh, C. A promising approach for the recovery of high value-added metals from spent lithium-ion batteries. J. Power Sources 2017, 351, 192–199. [Google Scholar] [CrossRef]
- Steward, D.; Mayyas, A.; Mann, M. Economics and Challenges of Li-Ion Battery Recycling from End-of-Life Vehicles. Procedia Manuf. 2019, 33, 272–279. [Google Scholar] [CrossRef]
- Georgi-Maschler, T.; Friedrich, B.; Weyhe, R.; Heegn, H.; Rutz, M. Development of a recycling process for Li-ion batteries. J. Power Sources 2012, 207, 173–182. [Google Scholar] [CrossRef]
- Velázquez-Martinez, O.; Valio, J.; Santasalo-Aarnio, A.; Reuter, M.; Serna-Guerrero, R. A critical review of lithium-ion battery recycling processes from a circular economy perspective. Batteries 2019, 5, 68. [Google Scholar] [CrossRef]
- Martínez, V.; Valio, J.; Aarnio, S.; Reuter, M.; Guerrero, S.; Velázquez-Martínez, O.; Santasalo-Aarnio, A.; Serna-Guerrero, R. A Critical Review of Lithium-Ion Battery Recycling Processes from a Circular Economy Perspective. Batteries 2019, 5, 68. [Google Scholar] [CrossRef]
- Mäkinen, T.; Taskinen, P. State of the art in nickel smelting: Direct Outokumpu nickel technology. Min. Proc. Ext. Met. Rev. 2013, 117, 86–94. [Google Scholar] [CrossRef]
- Johto, H.; Latostenmaa, P.; Peuraniemi, E.; Osara, K. Review of Boliden Harjavalta Nickel Smelter. In Proceedings of the Extraction 2018; Ottawa, ON, Canada, 26–29 August 2018, Springer: Cham, Switzerland, 2018; pp. 81–87. [Google Scholar] [CrossRef]
- Crundwell, F.K.; Moats, M.S.; Ramachandran, V.; Robinson, T.G.; Davenport, W.G. Chapter 18: Flash Smelting of nickel sulfide concentrates. In Extractive Metallurgy of Nickel, Cobalt, and Platinum-Group Metals; Elsevier: Kidlington, Oxford, UK, 2011; pp. 215–232. [Google Scholar] [CrossRef]
- Jones, R.T.; Denton, G.M.; Reynolds, Q.G.; Parker, J.A.L.; van Tonder, G.J.J. Recovery of cobalt, nickel, and copper from slags, using DC-arc furnace technology. Proceedings of International Symposium on Challenges of Process Intensification 35th Annual Conference of Metallurgists 1996, Montreal, QC, Canada, 25–29 August 1996; Available online: http://www.mintek.co.za/Pyromet/Cobalt/Cobalt.htm (accessed on 30 March 2020).
- Wolf, A.; Mitrašinović, A.M. Nickel, copper, and cobalt coalescence in copper cliff converter slag. J. Min. Metall. B 2016, 52, 143–150. [Google Scholar] [CrossRef]
- Crundwell, F.K.; Moats, M.S.; Ramachandran, V.; Robinson, T.G.; Davenport, W.G. Extractive Metallurgy of Nickel, Cobalt and Platinum Group Metals. Appendix E-Recovering Nickel, Copper, Cobalt, and Platinum-Group Elements from Slag. Elsevier: Oxford, UK, 2011; pp. 567–574. [Google Scholar]
- Warczok, A.; Riveros, G. Slag cleaning in crossed electric and magnetic fields. Miner. Eng. 2007, 20, 34–43. [Google Scholar] [CrossRef]
- Yu, D.; Chattopadhyay, K. Enhancement of the nickel converter slag-cleaning operation with the addition of spent potlining. Int. J. Miner. Met. Mater. 2018, 25, 881–891. [Google Scholar] [CrossRef]
- United Nations. Paris Agreement. 2015. Available online: https://unfccc.int/files/essential_background/convention/application/pdf/english_paris_agreement.pdf (accessed on 19 March 2020).
- Suopajärvi, H.; Kemppainen, A.; Haapakangas, J.; Fabritius, T. Extensive review of the opportunities to use biomass-based fuels in iron and steelmaking processes. J. Clean. Prod. 2017, 148, 709–734. [Google Scholar] [CrossRef]
- Bataille, C.; Ahman, M.; Neuhoff, K.; Nilsson, L.J.; Fischedick, M.; Lechtenbömer, S.; Solano-Rodriguez, B.; Denis-Ryan, A.; Stiebert, S.; Waisman, H.; et al. A review of technology and policy deep decarbonization pathway options for making energy-intensive industry production consistent with the Paris Agreement. J. Clean. Prod. 2018, 187, 960–973. [Google Scholar] [CrossRef]
- Vogl, V.; Ahman, M.; Nilsson, L.J. Assessment of hydrogen direct reduction for fossil-free steelmaking. J. Clean. Prod. 2018, 203, 736–745. [Google Scholar] [CrossRef]
- Ahman, M.; Olsson, O.; Vogl, V.; Nyqvist, B.; Maltais, A.; Nilsson, L.J.; Hallding, K.; Skanberg, K.; Nilsson, M. Hydrogen Steelmaking for Low-Carbon Economy: A join LU-SEI Working Paper for the HYBRIT Project, EESS Report no 109, SEI Working Paper WP 2018-07, September 2018; SEI, Lund University. Available online: https://www.sei.org/wp-content/uploads/2018/09/hydrogen-steelmaking-for-a-low-carbon-economy.pdf (accessed on 4 March 2020).
- Nagasaka, T.; Hino, M.; Ban-ya, S. Interfacial Kinetics of Hydrogen with Liquid Slag Containing Iron Oxide. Metall. Mater. Trans. B 2000, 31, 945–955. [Google Scholar] [CrossRef]
- Li, B.; Wei, Y.; Yang, Y. Reduction of Magnetite from Copper Smelting Slag using Petrodiesel and Biodiesel. ISIJ Int. 2018, 58, 1168–1174. [Google Scholar] [CrossRef]
- Huaiwei, Z.; Xiaoyan, S.; Bo, Z.; Xin, H. Reduction of Molten Copper Slags with Mixed CO-CH4-Ar Gas. Metall. Mater. Trans. B 2013, 45, 582–589. [Google Scholar] [CrossRef]
- Molino, A.; Braccio, G. Synthetic natural gas SNG production from biomass gasification–Thermodynamics and processing aspects. Fuel 2015, 139, 425–429. [Google Scholar] [CrossRef]
- Hellstén, N.; Taskinen, P.; Johto, H.; Jokilaakso, A. Trace Metal Distributions in Nickel Slag Cleaning. In Proceedings of the Proceedings of the 11th International Conference on Porous Metals and Metallic Foams (MetFoam 2019); Springer Science and Business Media LLC: Berlin, Deutchland, 2018; pp. 379–389. [Google Scholar]
- Strengell, D.; Avarmaa, K.; Johto, H.; Taskinen, P. Precious Metal Distributions in Direct Nickel Matte Smelting with Low-Cu Mattes. Metall. Mater. Trans. B 2016, 49, 98–112. [Google Scholar] [CrossRef]
- Sukhomlinov, D.; Klemettinen, L.; Avarmaa, K.; O’Brien, H.; Taskinen, P.; Jokilaakso, A. Distribution of Ni, Co, precious and platinum group metals in copper making process. Metall. Mater. Trans. B 2019, 50, 1752–1765. [Google Scholar] [CrossRef]
- Piskunen, P.; Avarmaa, K.; O’Brien, H.; Klemettinen, L.; Johto, H.; Taskinen, P. Precious Metal Distributions in Direct Nickel Matte Smelting with Low-Cu Mattes. Metall. Mater. Trans. B 2017, 49, 98–112. [Google Scholar] [CrossRef]
- Leikola, M.; Taskinen, P.; Eric, R.H. Reduction of Kemi chromite with methane. J. S. Afr. I. Min. Metall. 2018, 118, 575–580. [Google Scholar] [CrossRef]
- Rashidi, H.; Ale Ebrahim, H.; Dabir, B. Reduction kinetics of nickel oxide by methane as reducing agent based on thermogravimetry. Thermochim. Acta 2013, 561, 41–48. [Google Scholar] [CrossRef]
- Khoshandam, B.; Jamshidi, E.; Kumar, R.V. Reduction of Cobalt Oxide with Methane. Metall. Mater. Trans. B 2004, 35, 825–828. [Google Scholar] [CrossRef]
- Nicol, S.; Grogan, J.; Davis, B.; Lebel, T. Slag Reduction Kinetics of a Lead Slag from a Secondary Lead Smelter. In Proceedings of PbZn 2020: 9th International Symposium on Lead and Zinc Processing; Siegmund, A., Alam, S., Grogan, J., Kerney, U., Shibata, E., Eds.; Springer The Minerals, Metals & Materials Series: Cham, Switzerland, 2020; pp. 41–50. [Google Scholar]
- Bastin, G.F.; Heijligers, H.J.M. Quantitative Electron Probe Microanalysis of Ultralight Elements (Boron-Oxygen). Scanning 1990, 12, 225–236. [Google Scholar] [CrossRef]
- Brenan, J.M.; McDonough, W.F.; Ash, R. An experimental study of the solubility and partitioning of iridium, osmium and gold between olivine and silicate melt. Earth Planet. Sci. Lett. 2005, 237, 855–872. [Google Scholar] [CrossRef]
- Klemettinen, L.; Avarmaa, K.; O’Brien, H.; Taskinen, P.; Jokilaakso, A. Control of platinum loss in WEEE smelting. JOM 2019, 1–8. [Google Scholar] [CrossRef]
- Dańczak, A.; Klemettinen, L.; Kurhila, M.; Taskinen, P.; Lindberg, D.; Jokilaakso, A. Behavior of Battery Metals Lithium, Cobalt, Manganese and Lanthanum in Black Copper Smelting. Batteries 2020, 6, 16. [Google Scholar] [CrossRef]
- Waanders, F.B.; Nell, J. Phase chemical composition of slag from a direct nickel flash furnace and associated slag cleaning furnace. Hyperfine Interact. 2013, 218, 101–105. [Google Scholar] [CrossRef]
- Guoxing, R.; Songwen, X.; Meiqiu, X.; Bing, P.; Youqi, F.; Fenggang, W.; Xing, X. Recovery of valuable metals from spent lithium-ion batteries by smelting reduction process based on MnO-SiO2-Al2O3 slag system. In Advances in Molten Slags, Fluxes, and Salts: Proceedings of The 10th International Conference on Molten Slags, Fluxes and Salts (MOLTEN16), Society; Reddy, R.G., Chaubal, P., Pistorius, P.C., Pal, U., Eds.; TMS (The Minerals, Metals & Materials Society): Pittsburgh, PA, USA, 2016. [Google Scholar]
- U.S: Environmental Protection Agency. Chapter 12: Metallurgical Industry 12.7. Zinc Smelting. In Compilation of Air Pollutant Emissions Factors, 5th ed.; Environmental Protection Agency: Washington, DC, USA; pp. 12.7-1–12.7-8. Available online: https://www3.epa.gov/ttn/chief/ap42/ch12/ (accessed on 4 March 2020).
- Rämä, M.; Nurmi, S.; Jokilaakso, A.; Klemettinen, L.; Taskinen, P.; Salminen, J. Thermal Processing of Jarosite Leach Residue for a Safe Disposable Slag and Valuable Metals Recovery. Metals 2018, 8, 744. [Google Scholar] [CrossRef]
- Karan, K.; Behie, L.A. CS2 Formation in the Claus Reaction Furnace: A Kinetic Study of Methane-Sulfur and Methane-Hydrogen Sulfide Reactions. Ind. Eng. Chem. Res. 2004, 43, 3304–3313. [Google Scholar] [CrossRef]
- Gisby, J.; Taskinen, P.; Pihlasalo, J.; Li, Z.; Tyrer, M.; Pearce, J.; Avarmaa, K.; Björklund, P.; Davies, H.; Korpi, M.; et al. MTDATA and the prediction of phase equilibria in oxide systems: 30 years of industrial collaboration. Metall. Mater. Trans. B 2017, 48, 91–98. [Google Scholar] [CrossRef]
- Holappa, L. Towards sustainability in ferroalloy production. J. South. Afr. Inst. Min. Metall. 2010, 110, 703–710. [Google Scholar]
© 2020 by the authors. Licensee MDPI, Basel, Switzerland. This article is an open access article distributed under the terms and conditions of the Creative Commons Attribution (CC BY) license (http://creativecommons.org/licenses/by/4.0/).