Abstract
The Lyhamyar deposit is a large Sb deposit in the Southern Shan Plateau, Eastern Myanmar. The deposit is located in the Early Silurian Linwe Formation, occurring as syntectonic quartz-stibnite veins. The ore body forms an irregular staircase shape, probably related to steep faulting. Based on the mineral assemblages and cross-cutting relationships, the deposit shows two mineralization stages: (1) the pre-ore sedimentary and diagenetic stage, and (2) the main-ore hydrothermal ore-forming stage (including stages I, II, and III), i.e., (i) early-ore stage (stage I) Quartz-Stibnite, (ii) late-ore stage (stage II) Quartz-calcite-Stibnite ± Pyrite, and (iii) post-ore stage (stage III) carbonate. The ore-forming fluid homogenization temperatures from the study of primary fluid inclusions in quartz and calcite indicate that the ore-forming fluid was of a low temperature (143.8–260.4 °C) and moderate to high-salinity (2.9–20.9 wt. % NaCl equivalent). Hydrogen and oxygen isotopes suggest that the ore-forming fluids of the Lyhamyar deposit were derived from circulating meteoric water mixed with magmatic fluids that underwent isotopic exchange with the surrounding rocks. Sulfur in Lyhamyar was dominated by thermochemical sulfate reduction (TSR) with dominant magmatic source sulfur. The lead isotope compositions of the stibnite indicate that the lead from the ore-forming metals was from the upper crustal lead reservoir and orogenic lead reservoir. On the basis of the integrated geological setting, ore geology, fluid inclusions, (H-O-S-Pb) isotope data, and previous literature, we propose a new ore-deposit model for the Lyhamyar Sb deposit: It was involved in an early deposition of pyrite in sedimentary and diagenetic stages and later Sb mineralization by mixing of circulating meteoric water with ascending magmatic fluids during the hydrothermal mineralization stage.
1. Introduction
In the world market, antimony is a critical metal and one of the important metals in short supply [1,2]. In 2014, Myanmar mined 9000 metric tons of antimony ores [1,3], establishing Myanmar as a significant global source of antimony ore, and most of the ore was exported to China. A current estimate of the total resource of antimony in Myanmar is about 1,016,047 metric tons [1,4]. Antimony deposits are broadly located in Myanmar, forming an important metallogenic province in South East Asia. Myanmar is located in a geologically complex region within the Naga Hill at the northeastern part of the Indian Ocean (Figure 1; [5,6]) and extends south to the northern end of the Sunda-Andaman arc. This arc system collided with the Indian continent along the eastern end of the India-Asia collision zone and the Himalayas to the east [6,7]. Myanmar has excellent metallic and non-metallic mineral deposits, and the variety of these deposits have generated world-class mines during the last few decades [6,7,8,9,10,11,12,13,14,15,16,17,18,19,20,21,22,23,24], reflecting the country’s varied geology and metallogeny.

Figure 1.
Global tectonic context of Myanmar, with the location of the study area. EHS, Eastern Himalayan Syntaxis: MBT, Main Boundary Thrust; RRF, Red River Fault: TPFZ, Three Pagoda Pass Fault (modified after [5,6]).
The numerous Sb deposits in Myanmar define the largest Sb provinces in SE Asia (Figure 2; [1]), and Myanmar has more Sb occurrences than Thailand, although Thailand also has many antimony ore localities. Antimony deposits in Myanmar occur mostly within the eastern part of the Shan Plateau and Mogok–Mandalay–Mergui Metallogenic Province in the east of Myanmar. The authors of [2] classified Myanmar antimony deposits into two types based on the nature of the antimony deposits, lithological setting, form of the ore body, ore minerals, ore elements, and resources: Type I shear zone-hosted; Type II stockworks (IIa sulphide type and IIb low sulphidation type). The Lyhamyar antimony deposit has been explored by the Pa-O National Organization and Myanmar Government since 1991. Previous geological research of the deposit was mainly confined to describing the geology of the Lyhamyar Sb orefield and the surrounding area [4,25]. Although Myanmar is currently the second largest Sb-producing country in the world, no systematic exploration activities have been undertaken using modern technology. In this study, we (1) present an overview of the geological setting and paragenesis of the mineral-forming stages, and (2) describe the composition, source, and evolution of the ore-forming fluids using geology, fluid inclusions, and H-O-S-Pb isotopes of the Lyhamyar ore deposit.
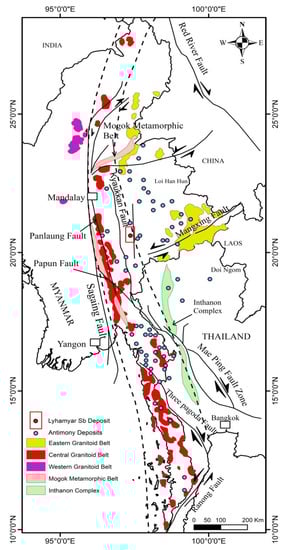
Figure 2.
Relationship of antimony deposits in Myanmar and Thailand to Cenozoic faults (modified after [1]). Granitoid Belts are taken from Khin Zaw [55].
2. Regional Geologic Setting
The regional geologic setting of the Lyhamyar Sb deposit is shown in (Figure 2; [1]). The accretion of several continental microplates and island arc terranes is dominated by the Mesozoic-recent geology of SE Asia that rifted from Gondwana, migrated, and eventually sutured onto the South China Craton and Eurasia (e.g., [15,16,22,23,26,27,28,29,30,31,32,33,34,35,36,37,38]). The closing stage of the Tethys Ocean is represented by a history of rifting and suturing, and these suture zones separately rendered much of SE Asia as a collage of continental blocks [22]. The subduction of the Indian oceanic crust beneath western Sundaland resulted from NE movement of the Indian plate during the Mesozoic to the Early Cenozoic; the convergence became increasingly oblique because the Indian plate rotated clockwise during the Cenozoic (e.g., [26,38,39]). When the Indian continental crust became attached to the western part of Myanmar (e.g., [38,39]), subduction beneath Sundaland largely terminated during the Miocene [31,39,40] and Sundaland was detached from stable Sibumasu [22,38,41,42], which is the continental microplate interpreted to underlie much of eastern and central Myanmar.
Then, western Myanmar moved progressively north relative to Sundaland during the latest Paleogene, along the Sagaing Fault and other structures [34,38,43]. In Thailand and Myanmar, the Three Pagodas Fault Zone and Mae Ping Fault Zone represent Paleogene transpression, resulting in the development of a broad NW-SE trending strike-slip fault network [38,42,44,45,46,47,48,49]. There is also clear evidence that E-W trending strike-slip fault systems changed from right-lateral to left-lateral on the Shan Plateau in eastern Myanmar (e.g., [38,50,51,52,53,54]).
The authors of [1] documented that most occurrences of antimony are hosted by/or are in the vicinity of major fault systems (Kyaukkan, Panlaung, Pupan, Mae Ping, Three Pagodas, and Ranong), which appear to have reactivated the earlier tectonic structures and/or, in his view, were developed in response to the collision of the Indian continental plate with Eurasia. The Shan Plateau in Myanmar has over 46 antimony occurrences and most of them are associated with Ordovician to Silurian sequences of argillaceous and phacoidal limestone and Permian dolomitic limestone. The Lyhamyar Sb deposit lies in the southern Shan Plateau and is located in the eastern part of the Sagaing Fault, eastern Myanmar.
The research area is situated in the southern part of the Shan Plateau, Shan State. The Shan-Thai or Sibumasu [22,38,41,42] is a continental block extends from Malaysia and Thailand through eastern Myanmar into China, and the Shan Plateau is a component of the Shan-Thai or Sibumasu block. The Shan Plateau is underlain by Late Proterozoic metasediments and lower Paleozoic rocks of dominantly siliciclastic sequence overlain by Paleozoic carbonates [8,23,38,56]; above this succession, there are Permo-Triassic carbonates [24,38,57]. Restricted, marine clastics, carbonates, and continental red beds occur above the Permo-Triassic limestone. The western margin of the plateau is established by Late Carboniferous to Early Permian slates [38,58,59]. The Shan Plateau extends into the Myanmar Central Basin to the west, and this transition is established by outcrops of the Mogok Metamorphic Belt (e.g., [38,59,60,61]). Many of those units were deformed during the Late Triassic Indosinian Orogeny, followed by events associated with the Late Cretaceous-Paleogene Andean-style margin of Sundaland, and Neogene indentation and gravitational collapse tectonics (e.g., [33,38,42,61,62]), and thus include a complex of pre-existing tectonic fabrics.
3. Ore Deposit Geology
The Lyhamyar Sb ore deposit lies in the north of the Hti Chaw Range, 20 km south of Hopong Township. The deposit was found in 2004 by local people. The present license of the area is held by the Ruby Dragon Co. Ltd. (Yangon, Myanmar). The Lyhamyar potential ore resource has been estimated at 108,450 metric tons of antimony ore with a grading 10.86–25.66% Sb [1,3,4].
In the study area, the rock sequences are mainly composed of Late Proterozoic Chaung Magyi Group (slate, phyllite, gneiss, and metagreywacke) and Paleozoic rocks such as sandstone, quartzose sandstone, shale, and limestone. These rocks form a large anticline, plunging to the north under Cambrian Molohein Group (Figure 3; [25,63,64]). The small bodies and dykes of granite are intruded into the biotite schist of Late Proterozoic Chaung Magyi Group, which is located in the east of the Nawng Son village.
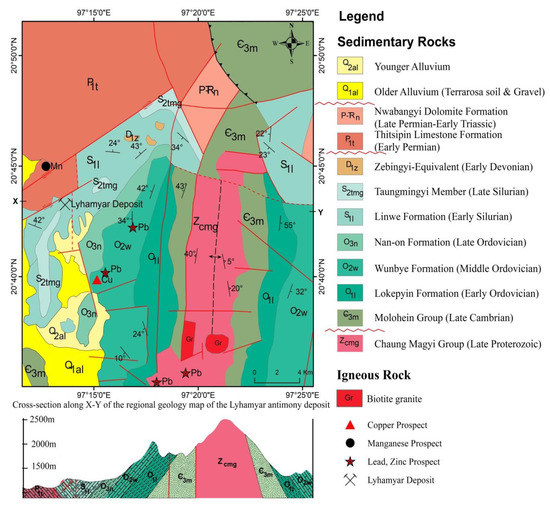
Figure 3.
Regional geology map and cross-section of the Lyhamyar antimony deposit (modified after [25,63,64]).
This granite is medium- to coarse-grained, porphyritic, and hypidiomorphic-granular in texture. It is essentially composed of the phenocrysts of the potash feldspars, quartz, biotite, plagioclase, and minor accessories such as rectangular opaque minerals are also observed. The SiO2 concentration ranges between 70.4 wt. % and 75.02 wt. % indicating a felsic composition. The contents of Al2O3 varied between 10.99 wt. % and 11.88 wt. %., K2O ranged from 4.4 wt. % to 5.71 wt. %, Na2O from 1.84 wt. % to 2.21 wt. %, and total alkali composition (Na2O + K2O) from 6.24 wt. % to 7.92 wt. %. P2O5 contents were less than 0.5 wt. %. According to the mineral composition and textural characteristics, the granitic rocks of the study area exhibit calc-alkaline plutonic affinity and contain strong peraluminous, S-type granitoid rocks [64]. Although the age of the intrusion is not known, their textural and chemical composition appears to be similar to those Eocene to Miocene intrusions along the Mogok Metamorphic Belt [55].
The Lyhamyar Sb deposit is located in the Linwe Formation of Early Silurian age. This Formation is composed of medium- to thick-bedded, light grey, pink and purple colored, phacoidal limestone and sometimes, interbedded with whitish-grey to ashy grey colored, well-jointed, thin- to medium-bedded shale. The lower part of this formation is characterized by medium- to thick-bedded, grey to bluish-grey colored, sub-phacoidal limestone intercalated with yellowish-grey to brown thin-bedded shale. The upper part of the Linwe Formation consists of purplish to pink colored, thin- to medium-bedded, fine-grained, wavy discontinuous, unfossiliferous argillaceous limestone showing phacoidal structure. These structures are well exposed around the Lyhamyar deposit area. In some places, minor open folds occur in this limestone.
The Lyhamyar antinomy orefield is considered to belong to the syntectonic quartz stibnite veins and breccias [1], located in argillaceous and phacoidal limestone of the Mibayataung Group (Silurian). The ore body occurs as an irregular shaped form, probably related to steep faulting. The host rock unit to the mineralization includes bluish grey color, medium-thick bedded limestone, intercalated with thin-bedded shale.
These rocks strike in the NNE-SSW direction (200° Azimuth) with a rather steep dip of 30° to 50° to SE, and are locally silicified in the fault zone of the folded limestone of the Linwe Formation (Early Silurian). In the Lyhamyar deposit, stibnite occurs as a major ore mineral and the gangues are generally composed of quartz and calcite.
Seven zones of stibnite veining are found in the Lyhamyar deposit, and they are fault-bounded and fracture-controlled mineralization as they form as irregular rosettes and narrow discontinuous vugs in the veins and druses of the host sedimentary rocks. The vein thickness is about 0.5 to 1 m thick and 30.6 to137.2 m in length. In some parts of the larger ore bodies, stibnite occurs in clusters of radiating crystals and in massive aggregates. Small angular veins of quartz occur in the antimony minerals, filling in fractures of the host rock, and they are roughly parallel to the strike of the main breccia zone. The deposit-scale geological map of the Lyhamyar Sb deposit is shown in (Figure 4; [65]).
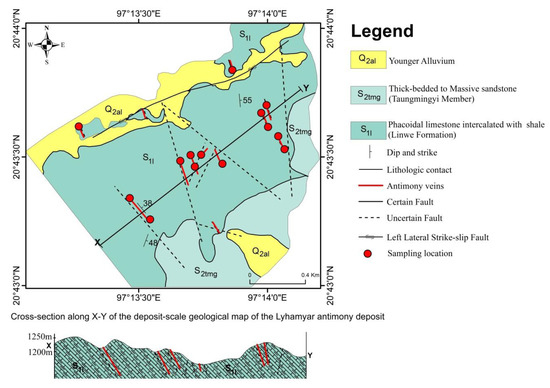
Figure 4.
Deposit-scale geological map and cross-section of the Lyhamyar antimony deposit (modified after [65]).
The wall rock alteration in the Lyhamyar deposit is developed close to the mineralized quartz veins. These ore-related hydrothermal alterations include silicification, calcitization, and oxidation (Figure 5). Silicification consists of disseminated quartz, veinlet quartz, and vuggy quartz. The silicification zone is accumulated spatially to the ore body within the fracture zone (Figure 5a,b). Vugs typically form through dissolution of fragments or phenocrysts in the host rocks. Calcitization is shown chiefly within the wall rocks outside the ore body (Figure 5b). Oxidation is an obvious surface indication of mineralization in the Lyhamyar deposit. It is also commonly found that the oxidized zone overlies the antimony-bearing sulphide zone. The reddish iron oxide in this zone is the major product of oxidation from the sulphide mineral of the ore body from pyrite. The oxidized ore zone commonly served as capping of the sulphide. The setting and nature of the oxidation of the Lyhamyar deposit are shown in (Figure 5c).
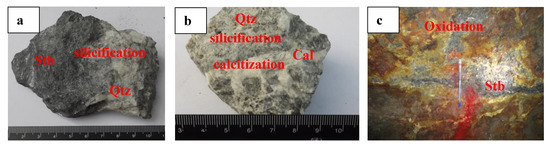
Figure 5.
Typical alteration samples of the Lyhamyar antimony deposit. (a) Silicification with stibnite mineral; (b) silicification and calcitization with the limestone host rock; (c) oxidation on the stibnite ore. Abbreviations are as follows: Stb, stibnite; Qtz, quartz; Cal, calcite.
4. Sampling and Analytical Techniques
For this study, fresh ore and altered country rock samples were collected for systematic petrography, mineralogy, and testing for hydrogen-oxygen, sulfur, and lead isotopes. The samples are from field outcrops and underground tunnels of the Lyhamyar deposit.
4.1. Mineralogical Study
The mineralogical study contains transmitted and reflected light microscopy and scanning electron microscopy (SEM). Twenty polished thin sections and twenty-three thin sections were first studied by reflected and transmitted light microscopy to recognize mineral assemblages, to explain the textural relationships, and to determine the relative timing of ore and gangue minerals. Once the sections of interest for our study were identified, they were marked and photographed before further analysis. Petrographic studies of the various minerals were also conducted on a Leica DM4500P at the Faculty of Earth Resources, China University of Geosciences (Wuhan). The mineral structural identification by the SEM method was carried out using a JEOL JCM 6000 SEM at the Department of Physics, West Yangon University, Myanmar.
4.2. Fluid Inclusion Studies
Microthermometric measurements of the fluid inclusions were carried out using a Linkam GP600 heating-freezing stage, which was attached to an Olympus-BX51 infrared microscope connected to a high-resolution Hamamatsu infrared digital camera with a tube that has a maximal detection capability of about λ ≤ 2.2 µm.
The conventional microthermometric measurement method was used to record heating and freezing temperatures for the fluid inclusions in the quartz and calcite. The measurement accuracy of the estimated temperatures was found to be ±0.1 °C. The reproducibility of Th values was often within 1 °C using the cycling technique. However, the reproducibility of the measurements could be as much as 3 °C due to the small size of the inclusions and the poor transparency of the crystals. In general, the rate of heating-freezing was about 0.2 to 5.0 °C /min, but it was less than 0.2 °C/min near the phase transformation. Final ice melting temperatures were converted to weight percent NaCl equivalent using the equation of [66,67]. Salinity can be also estimated from melting temperature, using the equation of [68]. Salinity can be calculated with the following Wilkinson’s formula (Salinity wt. % NaCl equivalent) = −69.7 − 2.617 Tmf − 0.02603 Tmf2 − 0.0000994 Tmf3, where Tmf is the metastable freezing temperature in degrees Celsius.
4.3. Stable and Radiogenic Isotopes
The hydrogen and oxygen isotopic compositions of six quartz samples from the Lyhamyar deposit were analyzed at the Analytical Laboratory of the Beijing Research Institute of Uranium Geology. For H isotopic analyses, fluid inclusion water was released by decrepitation and heating quartz to temperatures above 500 °C using an induction furnace; this water was then reacted with zinc powder at 800 °C [69,70]. Oxygen was extracted from quartz by reaction with BrF5; it was then converted to CO2 on a platinum-coated carbon rod for oxygen isotope analyses [69,70]. Measurements were determined by using a Finnigan MAT-253 mass spectrometer, and values of δ18O quartz and δDH2O were reported relative to Vienna standard mean ocean water (V-SMOW); the analytical precision of those measurements was errors of ±2‰ for δDH2O and ±0.2‰ for δ18Oquartz.
Sulfur isotope analysis was carried out on stibnite and pyrite at the Analytical Laboratory of the Beijing Research Institute of Uranium Geology using a MAT-251 EM mass spectrometer with analytical procedures almost like those described by [71,72]. As for the S isotope analyses, handpicked stibnite and pyrite samples were crushed into powders of 200-mesh size and placed into a tin capsule. Pure stibnite and pyrite samples (200-mesh) were combusted under vacuum with CuO at 1000 °C. Liberated SO2 was frozen in a liquid nitrogen trap after cryogenic separation from other gases. The S isotopic values were reported relative to the Canyon Diablo troilite (V-CDT) standard, and the analytical errors were better than ±0.2‰.
Lead isotope analyses of stibnite were carried out at the Analytical Laboratory of the Beijing Research Institute of Uranium Geology using a MAT-261 EM mass spectrometer, using the method similarly described in [72,73,74]. Sulfide samples were dissolved completely in ultrapure acids of HNO3 + HCl at 180 °C. The Pb in the samples was separated and purified using a two-column AG 1-X8 anion resin method. Pb isotopic ratios were corrected to reference values of Pb standard NBS-981 [73,75], with analytical reproducibility of ~0.1% (2σ) for 206Pb/204Pb and 207Pb/204Pb and ~0.2 % (2σ) for 208Pb/204Pb.
5. Results
5.1. Mineralogy
There are two types of mineralization in the Lyhamyar deposits: (1) Qtz-Stb vein types, the majority of these are influenced by bedding-parallel fractures (Figure 6b,c). Sb minerals usually fill the fractures of limestone (Figure 6d); (2) High-grade massive ores (Figure 6e–g) consisting of Qtz-Stb-Cal±Py.
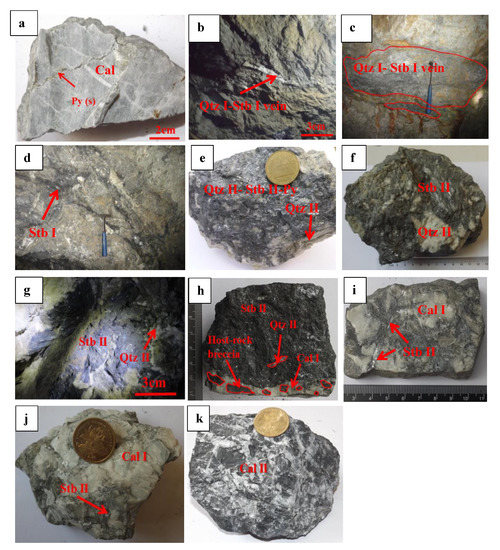
Figure 6.
Field occurrences of mineralization, showing representative minerals in the sedimentary/diagenetic stage and hydrothermal stages I, II, and III at the Lyhamyar deposit. (a) Pyrite(s) showing the limestone host rock in the sedimentary/diagenetic stage; (b,c) quartz (I)-stibnite (I) vein from the limestone host rock during the stage I; (d) stibnite (I) bearing silicified zone of stage I; (e) an assemblage of quartz (II)-stibnite and (II)-pyrite (I) of stage II; (f) quartz (II)-stibnite (II) ore showing massive structure, with fine-grained, subhedral–anhedral stibnite (II) intergrown with quartz; (g) stibnite (II) mineral occurs in acicular form in stage II; (h) development of hydro-fractured host rock breccia with massive stibnite (II)-quartz (II)-calcite (I) mineralized matrix of stage II; (i) radiating and elongated form of stibnite (II) in limestone host rock of stage II; (j) stibnite (II)-calcite (I) assemblage in the host rock of stage II; (k) calcite (II) in a hydraulic fracturing of late crackle breccia assemblage in the host rock of stage III.
Based on the mineral assemblages and cross-cutting relationships, the deposit shows two mineralization stages: (1) the pre-ore sedimentary and diagenetic stage, and (2) the main-ore hydrothermal ore-forming stage in the Lyhamyar Sb orefield. Minor fine-grained euhedral pyrite and calcite (Figure 6a) occur in diagenetic stage. Three sub-stages can be recognized in the hydrothermal ore-forming stage, including the early-ore stage (stage I) with the minerals of quartz (Qtz-I) and stibnite (Stb-I) (Figure 6b,c). The Qtz-Stb-type ore bodies are formed during this this stage.
The late-ore stage (stage II) is the major Sb mineralization stage, comprising the Qtz-calcite-Stb ±Py-type stratiform/vein ore bodies. Major minerals include quartz (Qtz-II; Figure 6e-h), fine-grained stibnite (Stb-II; Figure 6e,h,j), radiating and elongated forms of stibnite (Stb II; Figure 6 f,g,i), pyrite (Py-I; Figure 6e), and calcite (Figure 6h–j). The post-ore stage (stage III) recognizes the end of mineralization and is distinguished by the local development of a calcite at the edges of ore bodies and in the host rock (Figure 6k).
In the Lyhamyar deposit, all the mineral assemblages of the various antimony ore zones are generally related. Optical microscopy and SEM studies have shown that ore minerals are dominated by stibnite (Figure 7b–f) and pyrite (Figure 7a,d–f) with some sphalerite (Figure 7d); the gangue minerals include quartz (Figure 7b,c,e,f) and calcite (Figure 7e,f). Common ore textures include vein filling or fissure filling (Figure 7b) and open-space filling of pore spaces (Figure 7f). In the Lyhamyar deposit, a paragenetic sequence for minerals deposit is shown in Figure 8.
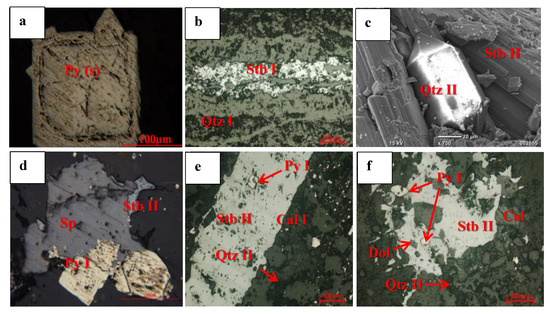
Figure 7.
Photomicrographs showing the occurrence and texture of ore and gangue minerals in massive sulfide ore. (a) Zoned euhedral pyrite(s) crystal of the sedimentary/diagenetic period; (b) hydrothermal stage (I) stibnite (I) showing fissure filling of the quartz vein; (c) euhedral quartz (II) crystal in the pore space of stibnite (II) of the hydrothermal stage (II); (d) pyrite (I) micro crack developed in the sphalerite of the hydrothermal stage (II); (e) a matrix of calcite (I) associated with quartz (II), both overprinted by a stibnite (II) vein; the included Py (I) may be a late pyrite (I) of the hydrothermal stage (II); (f) pyrite filled in the quartz-calcite-stibnite ore of stage (II). Photo (c) is a scanning electron microscope (SEM) image, and (a,b,d–f) are under a reflected microscope. Abbreviations are as follows: Stb, stibnite; Qtz, quartz; Cal, calcite; Py, pyrite; Sp, sphalerite.
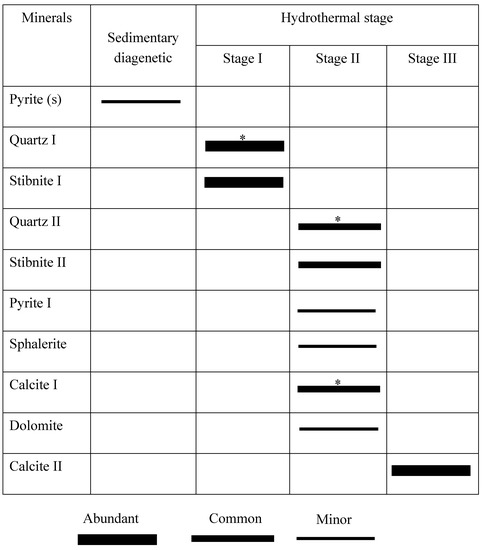
Figure 8.
Paragenetic sequence for major minerals of the Lyhamyar antimony deposit. Minerals investigated for fluid inclusions are indicated with an asterisk (*).
5.2. Fluid Inclusions
5.2.1. Fluid Inclusions Petrography
Ten doubly polished thin sections from different samples were carefully checked for suitable fluid inclusions for microthermometric analysis. In the Lyhamyar deposit, fluid inclusions (FIs), including primary, randomly distributed in the growth zones in crystal in the form of the isolated inclusions, and secondary fluid inclusions, usually smaller than primary inclusions and are cross-cutting the grain boundaries, occur in quartz and calcite from two mineralization stages. All Fls data collected in this study were from primary inclusions. Fluid inclusions more than 3 μm in size are used for the microthermometric studies. No workable fluid inclusions were found in the stibnite but a total of 74 fluid inclusions in 40 fluid inclusions assemblages (FIAs) hosted by quartz I (stage 1), quartz II (stage 2), and calcite (stage II) were analyzed in this study. Based on their vapor-to-liquid ratios at room temperature (RT) and their microthermometric behaviors, only one type of FI was recognized: liquid-rich NaCl-aqueous inclusions. These inclusions containing liquid phase from 65–85 vol. % at RT (Figure 9a–d), commonly occur in stage I and stage II at the Lyhamyar deposit.
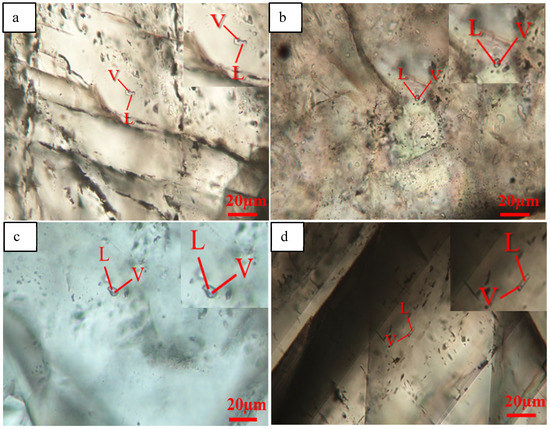
Figure 9.
Petrography of fluid inclusions in the Lyhamyar antimony deposit. (a) Liquid-rich aqueous fluid inclusion (L + V) in quartz of stage I; (b) liquid-rich fluid inclusion (L + V) in quartz of stage I; (c) liquid-rich aqueous fluid inclusion (L + V) in quartz of stage II; (d) liquid rich aqueous fluid inclusion (L + V) in calcite of stage II. Abbreviations: V, aqueous vapor phase; L, aqueous liquid phase.
5.2.2. Microthermometric Results
The results of microthermometric data from the primary fluid inclusions trapped in quartz and calcite from the ore-stage of the Lyhamyar deposit are summarized in Table 1.

Table 1.
Summary of the microthermometric data from primary fluid inclusions trapped in quartz and calcite from the ore-stage of the Lyhamyar antimony deposit.
Stage I (FIAs in quartz I) yields Th (homogenization temperature) values of 260.4–193.4 °C (mean: 224.1 °C, n = 42) (Figure 10a). They have Tm-ice (final melting temperature of ice) ranging from −17.9 to −2.3 °C (n = 42), with corresponding salinities varying from 3.9 to 20. 9 wt. % NaCl equivalent (mean: 15 wt. % NaCl equivalent, n = 42) (Figure 10b). The fluid density ranges from 0.817 to 1.022 g/cm3.
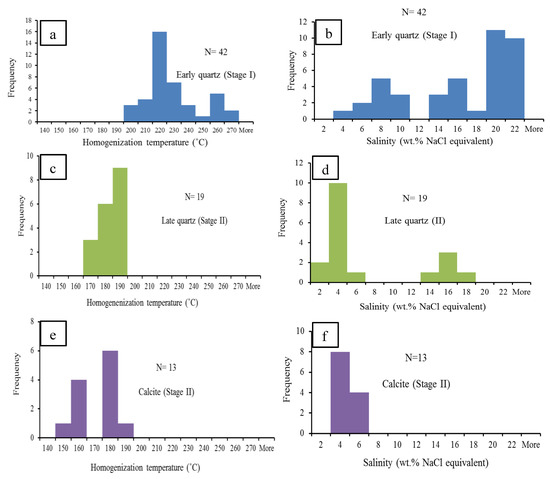
Figure 10.
Histogram of homogenization temperature (Th) and salinity (wt. % NaCl equivalent) of fluid inclusions in minerals of different assemblages from the Lyhamyar deposit: (a,b) Early quartz (stage I); (c,d) late quartz (stage II); and (e,f) late calcite stage (II).
Stage II (FIAs in quartz II) yields Th (homogenization temperature) values of 189.4–165.4 °C (mean: 181 °C, n = 19) (Figure 10c). They have Tm-ice (final melting temperature of ice) ranging from −13.4 to −0.9 °C (n = 19), with corresponding salinities varying from 1.6 to 17.3 wt. % NaCl equivalent (mean: 6.1 wt. % NaCl equivalent, n = 19) (Figure 10d).The fluid densities range from 1.026 to 1.019 g/cm3.
Stage II (FIAs in calcite I) yields Th (homogenization temperature) values of 143.8–180.6 °C (mean: 165.5 °C, n = 13) (Figure 10e). They have Tm-ice (final melting temperature of ice) ranging from −2.7 to −1.7 °C (n = 13), with corresponding salinities varying from 2.9 to 4.5 wt. % NaCl equivalent (mean: 3.6 wt. % NaCl equivalent n = 13) (Figure 10f). The fluid densities range from 0.911 to 0.954 g/cm3.
5.3. H-O Isotopes
The source of ore fluid was identified and characterized by oxygen and hydrogen isotopes. The H-O isotopic values of quartz of the Lyhamyar deposit are listed in Table 2 and plotted in Figure 11; [75]. The oxygen isotopic values of the fluid (δ18O fluid) were calculated using the oxygen isotopic fractionation equation of the quartz-water system: 1000lnαQtz-H2O = 3.38 × 10⁶/T2 − 3.40 [69]. The temperatures used for calculation were the mean ranges of the homogenization temperatures of the fluid inclusions in the quartz. Then, the values of δ18O fluid were calculated using the δ18O quartz values (14.7 to 17‰) and the average homogenization temperature (stage I, 224.1 °C; stage II, 179.1 °C) of the quartz-stibnite veins. The δ18O fluid compositions ranged from + 3.1 to + 4.8 ‰, and the δD fluid composition ranged from −107.0 to −98.6‰.
Table 2.
Oxygen and hydrogen isotope data of quartz from the Lyhamyar antimony deposit.

Figure 11.
δDV-SMOW–δ18Ofluid (‰) plot of the isotopic compositions of the ore-forming fluids from the Lyhamyar antimony deposit [75].
5.4. Sulfur Isotopic Composition
Sulfur isotope analyses for the sulfide minerals are shown in Table 3 and Figure 12. Sulfur isotopic composition of 10 measurements were analyzed in this study (1 in Py1 from the sulfide sample of wall rock limestone, 5 in stibnite I, and 4 in stibnite II) for samples of all mineralization stages. The δ34S values vary significantly between different minerals: 10.7‰ for pyrite and 4.9‰ to 8.7‰ for stibnite. Moreover, δ34S values in the stibnite decrease from stage I (7.3–8.7‰, n = 5, average7.74‰) to Stage II (4.9–5.6 ‰, n = 4 average 5.23‰).
Table 3.
Sulfur isotope compositions of the sulfides from the Lyhamyar antimony deposit.
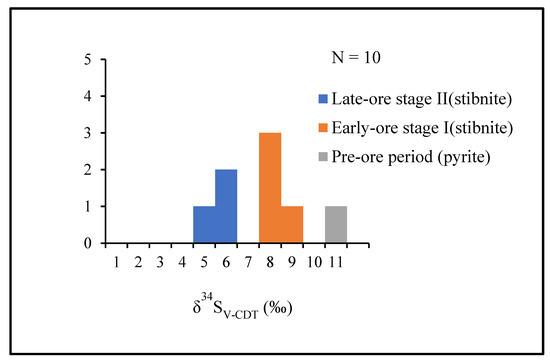
Figure 12.
Histogram of δ34SV-CDT (‰) data for stibnite and pyrite from the Lyhamyar antimony deposit. Note that δ34SV-CDT (‰) values decrease from early to late stage in ore formation.
5.5. Pb Isotopes
The Pb isotopic values of stibnite divides of the Lyhamyar deposit are listed in Table 4 and plotted in Figure 13 [72,76]. The Pb isotopic ratio clusters into two groups (A and B). Group A shows relatively high radiogenic lead, its 206Pb/204Pb ratios ranged from 18.546 to 18.894, 207Pb/204Pb ratios from 15.707 to 15.790, and 208Pb/204Pb ratios from 38.782 to 39.421. Group B exhibits slightly less radiogenic lead than that of Group A; its 206Pb/204Pb ratios ranged from 17.649 to 18.509, 207Pb/204Pb ratios from 15.533 to 15.658, and 208Pb/204Pb ratios from 38.147 to 38.716. While the Pb isotopic ratios of all stibnite samples vary over a wide range for the Lyhamyar deposit, the difference is fairly consistent within each group.
Table 4.
Lead isotope compositions of the stibnite from the Lyhamyar antimony deposit.
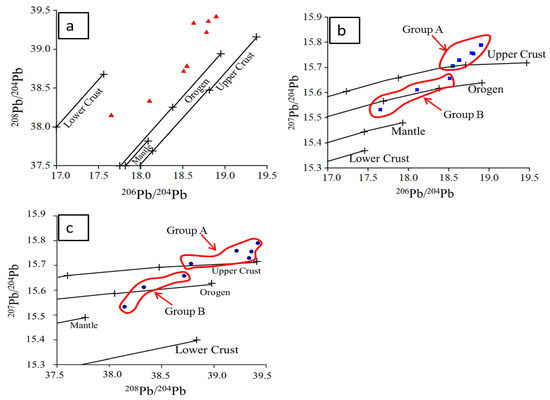
Figure 13.
Plots of (a) 208Pb/204Pb vs. 206Pb/204Pb; (b) 207Pb/204Pb vs.206Pb/204Pb; and (c) 207Pb/204Pb vs. 208Pb/204Pb for stibnite from the Lyhamyar antimony deposit. Framework trends are plotted for reference (after [72,76]). These isotopic data suggest a mixing source of Pb.
6. Discussion
6.1. Evolution of the Ore-Forming Fluid System
In the stage I, the ore-forming fluid had a low homogenization temperature (193.4–260.4 °C) and moderate to high-salinity (3.9 wt. % to 20.9 wt. % NaCl equivalent) and stage II has different FI types suggesting the ore-forming fluid of stage II was a low-temperature (143.8–189.4 °C), moderate to low- to high-salinity (17.3 wt. % to 1.6 wt. % NaCl equivalent). As the Sb was mainly precipitated during stage I to stage II, the oxygen and hydrogen isotopic compositions of quartz from stage I to stage II are considered to represent the Sb bearing ore-forming fluid. The existence of two end-members, a rather saline fluid one and a low-salinity fluid one, in the stage I and their similar homogenization temperatures suggest that the ore fluid underwent a (near) isothermal mixing process (Figure 14). The ore-forming fluid of the Lyhamyar deposit appeared to have been derived from depth and emplaced into an open space that was caused by faulting and resulted in isothermal mixing processes of magmatic fluids and near surface meteoric fluid. This ore-depositing process is also consistent with the oxygen and hydrogen isotopic data.
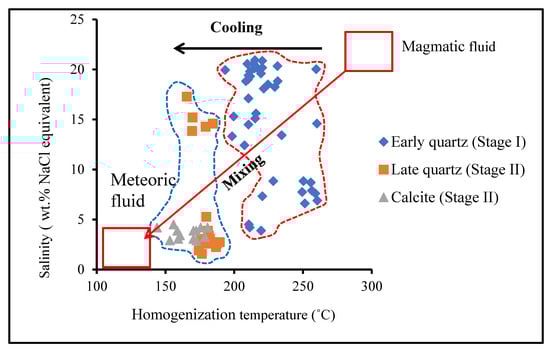
Figure 14.
Plot of salinity versus homogenization temperatures (Th) of fluid inclusions showing the evolution of the ore-forming fluids in the Lyhamyar antimony deposit.
6.2. Origins of Ore-Forming Fluids
The δD values of the Lyhamyar deposit range from −98.6 to −107 ‰ and the δ18Owater values vary from +3.1 to +5‰. All of the data for the Lyhamyar deposit lie with a horizontal trend, to the right of the meteoric water line (Figure 11). In the quartz, only LV-type FIs were observed, and the fluid temperature and salinity were 165.4–260.4 °C and 1.6–20.9 wt. % NaCl equivalent. This suggests that the ore-forming fluid was most likely originated from circulating meteoric fluids with minor magmatic water derived from hidden magma chambers at depth. Ore fluids reacted with wall rocks and ore metals extracted from the ore-forming fluids. On this basis, circulating meteoric water dominated in the initial ore-forming fluid in the Lyhamyar deposit. In general, meteoric water has low δD and δ18O values [31,49,77]. At high temperatures, it was driven by a hot magma source and the meteoric water constantly exchanged oxygen isotopes with the surrounding silicate- and carbonate-containing rocks. The extent of the oxygen isotopic composition reflected the degree of isotopic exchange. Hence, the ore-forming fluids in the Lyhamyar deposit were circulating meteoric water mixed with magmatic fluid and underwent isotopic exchange with the surrounding rocks.
6.3. Sources of Ore-Forming Materials
6.3.1. Source of Sulfur
A useful tool to constrain the origin of sulfur is offered by the stable isotopes of sulfur [77,78,79,80,81,82,83,84,85,86,87,88], although temperature, pH value, oxygen fugacity, and ion activity often influence the total sulfur isotopic composition. The average δ34S of minerals would correspond to that of the total sulfur in the hydrothermal fluid when the sulfides from different sources have all reached sulfur isotopic equilibrium [80,81,82,83,84].
Table 4 shows the Sulfur isotopic results of the sulfides from different sources of sulfur isotopic equilibrium in the Lyhamyar deposit. The bulk sulfur isotopic composition of the fluids can be interpreted to represent the δ34S values of sulfides. There are three major sulfur reservoirs on earth, with different sulfur isotopic compositions: (a) mantle or magmatic (0% ± 3%, [80,84]); (b) marine-seawater (+20%, present as SO42−, [80]), and (c) reduced sulfur or biogenic sulfur in sedimentary rocks, characterized by δ34S < 0 [77,80,85].
Our δ34S values of the Lyhamyar stibnite are distinctly different from sulfur originating from biogenic sulfur in sedimentary rocks and falls in between the sulfur isotope compositions of the magmatic and metamorphic sources. It is suggested that a possible mechanism for formation of reduced sulfur is thermochemical sulfate reduction (TSR) or bacterial sulfate reduction (BSR) [77,87] by the sulfur isotopic composition from the hydrothermal stage. The high temperatures can have TSR while BSR can only occur at low temperatures of <100 °C [77,88]. The mineralization temperatures of the Lyhamyar deposit (typically 143.8–260.4 °C) (Figure 14) lend support to the mechanism for formation of reduced sulfur and thus it is the most likely from thermochemical sulfate reduction (TSR). We concluded that thermochemical sulfate reduction (TSR) with a major involvement of a magmatic source of sulfur (Figure 15) dominated in the Lyhamyar deposit.
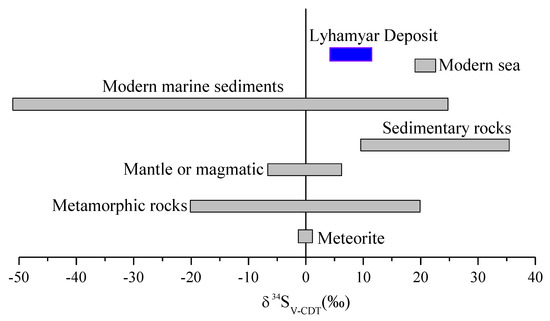
Figure 15.
Sulfur isotopic compositions of the Lyhamyar antimony deposit compared with meteorite and other geological settings (after [80,83,84,85].
6.3.2. Source of Lead
On the sources of lead and other related metals, the lead isotopic compositions of ore-related sulfides are very important constraints [76]. The lead isotopic values of stibnite of the Lyhamyar deposit are plotted as 207Pb/204Pb values versus 206Pb/204Pb values and as 208Pb/204Pb values versus 206Pb/204Pb values (Figure 13; [72,76]). Most of the data points fall within the fields of the upper crust, and orogenic belts are shown in the Pb isotope composition, while one point lies in the area between orogenic belts and mantle, which indicates that the source of the upper crustal lead and orogenic lead reservoirs mixed with the ore-forming metals. These reservoirs are divided into two groups (A and B) of the Pb isotopic compositions of stibnite (Figure 13b,c; [72,76]): Group A is characterized by a higher radiogenic lead, suggesting that the lead source probably originated from the Silurian host rock. Group B indicates the lower Pb isotopic ratios and suggests their Pb origin is the Late Proterozoic metasedimentary basement rock. For this reason, the ore-forming materials were either derived from the Silurian host rocks or derived from the underlying Late Proterozoic metsedimentary basement during the emplacement of antimony mineralization.
In addition, lead isotopic compositions of stibnite show that the Pb in the Lyhamyar deposit was taken out over a long period of time. Different periods of Pb extraction are suggested by the clusters of lead isotopic data. The two sources of leads were mixed to some degree, and show the linear trend of Pb isotopic compositions for the Lyhamyar deposit, which remained relatively independent in terms of their Pb isotopic compositions. On this basis, the lead isotope compositions of the stibnite suggest that the ore-forming metals were a mixed source of the Late Proterozoic metasedimentary basement and the sedimentary host rocks.
7. Genetic Model for the Sb Mineralization
Deposit modeling for the Lyhamyar Sb deposit is established on the basis of combining the fluid inclusion and (H-O-S-Pb) isotope data and previous literature. We propose a new metallogenic model for the Lyhamyar Sb deposit, shown diagrammatically in Figure 16. The following geological and metallogenic conditions are considered: (1) The Lyhamyar Sb deposit is structurally controlled. (2) Ore-forming fluid in terms of homogenization temperatures ranged from 143.8 to 260.4 °C (low to moderate temperature) and moderate to high salinity (≤20.9 wt. % NaCl equivalents). (3) The hydrogen and oxygen isotopes suggest that the ore-forming fluids were sourced from mixed meteoric and magmatic waters. (4) Sulfur in Lyhamyar was dominated by thermochemical sulfate reduction (TSR), with dominant magmatic source sulfur. (5) The lead isotope compositions of the stibnite indicate that the ore-forming metals were a mixed source of the Late Proterozoic metasedimentary basement and the Silurian sedimentary host rocks.
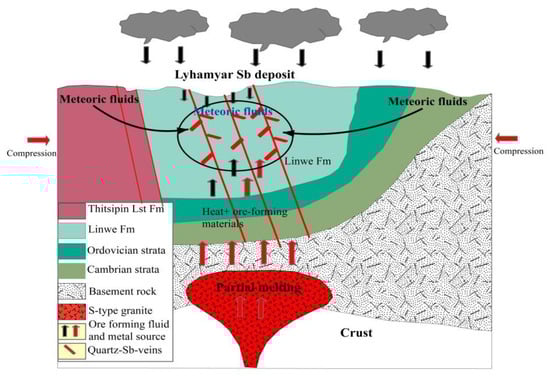
Figure 16.
Schematic diagram illustrating the proposed genetic model for the Lyhamyar antimony deposit.
The Cenozoic geology of Myanmar is controlled by the Himalayan Orogeny, throughout which right-lateral strike-slip faults with large displacements and a nappe-thrust system formed. It resulted in indentation, rotation, and reorganization of the component blocks and tectonothermal deformations in Myanmar by the collision of Indian and Asian plates during the Cenozoic [7,89,90,91,92]. The Indo-Myanmar Ranges were uplifted at the beginning of the Oligocene and Miocene, while the first phase of Himalayan Orogeny and the subduction zone was completed with the Indian Oceanic sediments. During this period, the Shan Plateau was uplifted; Sb lodes formed in fault zones associated with a transpressional stress regime [7].
The Lyhamyar Sb deposits were most likely formed during the Oligocene-Miocene tectonic activity related to the India-Asia collision. The supracrustal fluid accountable for the formation of the Lyhamyar Sb deposit could have been produced by the intrusion of the Oligocene-Miocene magmatism, which offered the thermal energy for large-scale Sb mineralization. The fracture zones in the host rock of the deposit could have acted as major controls for metalliferous fluid migration and localization [72].
This hydrothermal process may have involved the mineralizing fluid consisting of deep, basement-derived water, circulated and heated due to the geothermal anomaly related to the deep magmatic activity [72]. The Lyhamyar deposit was probably formed by mixing of basement-derived fluid with circulating dominant meteoric water in the upper crust, aided by the magmatism in the Shan Plateau, forming the sediment-hosted quartz-stibnite vein deposit type ore bodies. The significant faulting and folding have been successively reactivated due to the effect of the India-Eurasia collision, providing the channels for the migration of the hydrothermal fluids. Combined with the geological setting, ore geology, fluid inclusions, (H-O-S-Pb) isotope data, and previous literature, we propose a new ore-genetic model that the formation of the Lyhamyar Sb deposit was caysed by an early deposition of pyrite by sedimentary and diagenetic stages and later, Sb mineralization by circulating meteoric water heated and mixed with ascending magmatic fluids during the hydrothermal mineralization stage.
8. Conclusions
The Lyhamyar Sb ore deposit is an important Sb producer in the Shan Plateau region and belongs to an antimony province of eastern Myanmar. Based on the detailed systematic study of fluid inclusions and (H-O-S-Pb) isotopes from the different ore stages, the main conclusions are drawn as follows:
(1) The mineral assemblages and cross-cutting relationships of the deposit show two mineralization stages: (1) the pre-ore sedimentary and diagenetic stage and (2) the main-ore hydrothermal ore-forming stage (stages I,II, and III), i.e., (i) early-ore stage (stage I) Qtz-Stb, (ii) late-ore stage (stage II) Qtz-calcite-Stb ± Py, and (iii) post-ore stage (stage III) carbonate.
(2) The ore-forming fluid temperatures from the study of FIs in quartz and calcite indicate that the ore-forming fluid was a low to moderate temperature (143.8–260.4 °C) and moderately low to high salinity (2.9 wt. % 20.9 wt. % NaCl equivalent).
(3) Hydrogen and oxygen isotopes suggest that the ore-forming fluids in the Lyhamyar deposit were derived from circulating meteoric water that was mixed with magmatic water and underwent isotopic exchange with the surrounding rocks. The δ34S values indicate +10.7‰ for pyrite from the sedimentary diagenetic stage and +4.9‰ to +8.7‰ for stibnite of the hydrothermal ore stage. Sulfur in Lyhamyar was dominated by thermochemical sulfate reduction (TSR), with input of magmatic source sulfur.
(4) The lead isotope compositions of the eight hydrothermal stibnite samples show 206Pb/204Pb ratios ranging from 17.649 to 18.894, 207Pb/204Pb ratios from 15.330 to 15.790, and 208Pb/204Pb ratios from 38.147 to 39.421, suggesting the ore-forming metals were a mixed source of the upper crustal lead and orogenic lead reservoirs. The lead isotopic compositions are divided into two groups (A and B) of the Pb isotopic compositions of stibnite: Group A is characterized by a higher radiogenic lead, suggesting that the lead source probably originated from the Silurian host rock. Group B indicates the lower Pb isotopic ratios and suggests their Pb origin is the Late Proterozoic metasedimentary basement rock. For this reason, the ore-forming materials were either derived from the Silurian host rocks or derived from the underlying Late Proterozoic metasedimentary basement or ore metals were originated from mixed sources.
(5) Integration of the geological setting, ore geology, fluid inclusions, (H-O-S-Pb) isotope data, and previous literature implied that the Lyhamyar Sb deposit was formed by an early deposition of pyrite by sedimentary and diagenetic stages and later, Sb mineralization by circulating meteoric water heated and mixed with ascending magmatic fluids during the hydrothermal mineralization stage.
Author Contributions
A.M.O., L.X., K.Z., S.B., and M.M.A.A. conceived and designed the ideas; A.M.O. collected and analyzed the data and wrote the manuscript; L.X., K.Z., and T.H. revised and edited the manuscript. All authors contributed in reading, commenting, and giving annotations on this manuscript. All authors have read and agreed to the published version of the manuscript.
Acknowledgments
Sincere thanks are extended to the China Scholarship Council (CSC) for the Ph.D. Scholarship for AUNG MIN OO and Ph.D. program of China University of Geosciences (Wuhan) for support for this research. We also tender our special thanks to managers and staff of the Ruby Dragon Co. Ltd. for sampling around the Hopone Township, southern Shan State Myanmar. We also would like to thank the staff from the Analytical Laboratory of the Beijing Research Institute of Uranium Geology, China, for their valuable assistance during stable isotopic experiments. Thanks also to Fan Xiejun, Wei Wei, and Yang Junshen for helping with sample preparation and to Sun Bingke for helping with fluid inclusion studies. We also would like to thank the editor and three anonymous reviewers from this journal for their critical reading of the manuscript and providing valuable comments and suggestions. This research received no external funding.
Conflicts of Interest
The authors declare no conflict of interest.
References
- Kyaw, T.A. Chapter 29 Antimony deposits of Myanmar. In Myanmar: Geology, Resources and Tectonics; Barber, A.J., Zaw, K., Crow, M.J., Eds.; Geological Society, London, Memoirs: London, UK, 2017; Volume 48, pp. 649–668. [Google Scholar]
- Gunn, G. Critical Metals Handbook; John Wiley & Sons, Ltd.: Chichester, UK, 2014. [Google Scholar]
- Seal, R.R., II; Schulz, K.J.; De Young, J.H., Jr.; Sutphin, D.M.; Drew, L.J.; James, F.; Carlin, J.F., Jr.; Berger, B.R. Chapter C Antimony. In Critical Mineral Resources of the United States-Economic and Environmental Geology and Prospects for Future Supply; Schulz, K.J., DeYoung, J.H., Jr., Seal, R.R., II, Bradley, D.C., Eds.; U.S. Geological Survey Professional Paper: Reston, VA, USA, 2017; Volume 1802, pp. 1–17. ISBN 2330-7102. [Google Scholar]
- Department of Geological Survey and Mineral Exploration. The Database on Mineral Occurrences of Myanmar; Unpublished Departmental Report; Department of Geological Survey and Mineral Exploration: Naypyidaw, Myanmar, 2013. [Google Scholar]
- Fareeduddin, A.; Dilek, Y. Structure and petrology of the Nagaland-Manipur Hill ophiolitic melange zone, NE India: A fossil Tethyan subduction channel at the India-Burma plate boundary. Episodes 2015, 38, 298–314. [Google Scholar] [CrossRef]
- Mitchel, A.H.G. (Ed.) Chapter 1 Introduction. In Geological Belts, Plate Boundaries, and Mineral Deposits in Myanmar; Myanmar Precious Resources Group: Yangon, Myanmar; Oxford, UK, 2018; pp. 3–15. [Google Scholar]
- Zaw, K. Chapter 24 Overview of mineralization styles and tectonic-metallogenic setting in Myanmar. In Myanmar: Geology, Resources and Tectonics; Barber, A.J., Zaw, K., Crow, M.J., Eds.; Geological Society, London, Memoirs: London, UK, 2017; Volume 48, pp. 573–588. [Google Scholar]
- Chhibber, H.L. The Mineral Resources of Burma; Macmillan and Co.: London, UK, 1934. [Google Scholar]
- Coggin Brown, J. India’s Mineral Wealth: A Guide to the Occurrences and Economics of the Useful Minerals of the Indian Empire; Oxford University Press: Oxford, UK, 1936. [Google Scholar]
- Griffith, S. The mineral resources of Burma. Miner. Mag. 1956, 95, 9–18. [Google Scholar]
- Win, S.; Myint, M.M. Mineral potential of Myanmar. Resour. Geol. 1998, 48, 209–218. [Google Scholar] [CrossRef]
- Zaw, K. An overview of mineral deposits in Myanmar (Burma) with special reference to precious and base metal potential. In Proceedings of the Asia Update-Geology, Metallogenesis, Exploration and Recent Development in Asia, Sydney, Australia, 23 April 1992. [Google Scholar]
- Zaw, K. Mineral deposits projects in Myanmar: Exploration potentials and sustainable development. In Proceedings of the 3rd Myanmar Mining Summit, Yangon, Myanmar, 18–20 October 2016. [Google Scholar]
- Zaw, K.; Burrett, C.F.; Berry, R.F.; Bruce, E. Geologicaland Metallogenic Relations of Mineral Deposits in SE Asia. Geochronological Studies; Unpublished Final Report and CD-ROM, for Australian Mineral Industry Research Association (AMIRA); University of Tasmania: Hobart, Australia, 1999. [Google Scholar]
- Zaw, K.; Meffre, S.; Meffre, S.; Lai, C.-K.; Burrett, C.; Santosh, M.; Graham, I.; Takayuki Manaka, T.; Salam, A.; Kamvong, T.; et al. Tectonics and metallogeny of mainland SE Asia-a review and contribution. Special Issue on Tectonics and Metallogeny of Mainland SE Asia. Gondwana Res. 2014, 26, 5–30. [Google Scholar]
- Zaw, K. Higher Degree Students. ‘Ore Deposits of SE Asia’ Project (2010–2014); CODES ARC Centre of Excellence in Ore Deposits, Final Report No. 9 and CD-ROM; University of Tasmania: Hobart, Australia, 2014; Unpublished. [Google Scholar]
- Zaw, K.; Swe, W.; Barber, A.J.; Crow, M.J.; New, Y.Y. Chapter 1 Introduction to the geology of Myanmar. In Myanmar: Geology, Resources and Tectonics; Barber, A.J., Zaw, K., Crow, M.J., Eds.; Geological Society, London, Memoirs: London, UK, 2017; Volume 48, pp. 1–17. [Google Scholar]
- Zaw, K.; Swe, Y.M.; Myint, T.A.; Knight, J. Chapter 26 Copper deposits of Myanmar. In Myanmar: Geology, Resources and Tectonics; Barber, A.J., Zaw, K., Crow, M.J., Eds.; Geological Society, London, Memoirs: London, UK, 2017; Volume 48, pp. 573–588. [Google Scholar]
- Gardiner, N.J.; Robb, L.J.; Searle, M.P. Metallogenic provinces of Myanmar. Appl. Earth Sci. 2014, 123, 25–38. [Google Scholar] [CrossRef]
- Gardiner, N.J.; Searle, M.P.; Morley, C.K.; Whitehouse, M.P.; Spencer, C.J.; Robb, L.J. The closure of Palaeo-Tethys in Eastern Myanmar and Northern Thailand: New insights from zircon U–Pb and Hf isotope data. Gondwana Res. 2015, 39, 401–422. [Google Scholar] [CrossRef]
- Gardiner, N.J.; Searle, M.P.; Robb, L.J.; Morley, C.K. Neo-Tethyan magmatism and metallogeny in Myanmar-an Andean analogue? J. Asian Earth Sci. 2015, 106, 197–215. [Google Scholar] [CrossRef]
- Gardiner, N.J.; Searle, M.P.; Robb, L.J.; Morley, C.K. The tectonic and metallogenic framework of Myanmar: A Tethyan mineral system. Ore Geol. Rev. 2016, 70, 26–45. [Google Scholar] [CrossRef]
- Barber, A.J.; Zaw, K.; Crow, M.J. (Eds.) Chapter 31: The pre-Cenozoic tectonic evolution of Myanmar. In Myanmar: Geology, Resources and Tectonics; Geological Society, London, Memoirs: London, UK, 2017; Volume 48, pp. 687–712. [Google Scholar]
- Swe, W. Chapter I Introduction. Outline Geology and Economic Mineral Occurrences of the Union of Myanmar, Myanmar Geosciences Society, Special Publications: Yangon, Myanmar, 2012; Volume 1, 1–2. [Google Scholar]
- Kyi, A. Regional Geological Mapping and Preliminary Mineral Exploration at Lyharmyar Mine, Hopone Township; Unpublished Departmental Report; Department of Geological Survey and Mineral Exploration: Naypyidaw, Myanmar, 2011. [Google Scholar]
- Lee, T.-Y.; Lawver, L.A. Cenozoic plate reconstruction of Southeast Asia. Tectonophysics 1995, 251, 85–138. [Google Scholar] [CrossRef]
- Metcalfe, I. Origin and assembly of south-east Asian continental terranes. In Gondwana and Tethys; Audley-Charles, M.G., Hallam, A., Eds.; Geology Society of London, Special Publications: London, UK, 1988; Volume 37, pp. 101–118. [Google Scholar]
- Metcalfe, I. Pre-Cretaceous evolution of SE Asian terranes. In Tectonic Evolution of Southeast Asia; Hall, R., Blundell, D., Eds.; Geology Society of London, Special Publications: London, UK, 1996; Volume 106, pp. 97–122. [Google Scholar]
- Metcalfe, I. Palaeozoic—Mesozoic history of SE Asia. In The SE Asian Gateway: History and Tectonics of the Australia-Asia Collision; Hall, R., Cottam, M.A., Wilson, M.E.J., Eds.; Geology Society of London, Special Publications: London, UK, 2011; pp. 7–35. [Google Scholar]
- Metcalfe, I. Gondwana dispersion and Asian accretion: Tectonic and palaeogeographic evolution of eastern Tethys. J. Asian Earth Sci. 2013, 66, 1–33. [Google Scholar] [CrossRef]
- Hall, R. Cenozoic geological and plate tectonic evolution of SE Asia and the SW Pacific: Computer-based reconstructions, model and animations. J. Asian Earth Sci. 2002, 20, 353–434. [Google Scholar] [CrossRef]
- Hall, R. Late Jurassic-Cenozoic reconstructions of the Indonesian region and the Indian Ocean. Tectonophysics 2012, 570–571, 1–41. [Google Scholar] [CrossRef]
- Bertrand, G.; Rangin, C. Tectonics of the western margin of the Shan plateau (central Myanmar): Implication for the India-Indochin oblique convergence since the Oligocene. J. Asian Earth Sci. 2003, 21, 1139–1157. [Google Scholar] [CrossRef]
- Barber, A.J.; Ridd, M.F.; Crow, M.J. (Eds.) The origin, movement and assembly of the pre-Tertiary tectonic units of Thailand. In The Geology of Thailand; Geology Society of London: London, UK, 2011; pp. 507–537. [Google Scholar]
- Searle, M.P.; Morley, C.K. Tectonics and thermal evolution of Thailand in the regional context of Southeast Asia. In The Geology of Thailand; Ridd, M.F., Barber, A.J., Crow, M.J., Eds.; Geology Society of London: London, UK, 2011; pp. 539–572. [Google Scholar]
- Morley, C.K. Discussion of tectonic models for Cenozoic strike-slip fault-affected continental margins of mainland SE Asia. J. Asian Earth Sci. 2013, 76, 137–151. [Google Scholar] [CrossRef]
- Ridd, M.F.; Watkinson, I. The Phuket-Slate Belt terrane: Tectonic evolution and strike-slip emplacement of a major terrane on the Sundaland margin of Thailand and Myanmar. Proc. Geol. Assoc. 2013, 124, 994–1010. [Google Scholar] [CrossRef]
- Crosettoa, S.; Watkinson, I.M.; Min, S.; Gori, S.; Falcucci, E.; Ngal, N.L. Evidence of Quaternary and recent activity along the Kyaukkyan Fault, Myanmar. J. Asian Earth Sci. 2018, 156, 207–225. [Google Scholar] [CrossRef]
- Curray, J.R. Tectonics and history of the Andaman Sea region. J. Asian Earth Sci. 2005, 25, 187–232. [Google Scholar] [CrossRef]
- Mitchell, A.H.G. Cretaceous-Cenozoic tectonic events in the western Myanmar (Burma)-Assam region. J. Geol. Soc. 1993, 150, 1089–1102. [Google Scholar] [CrossRef]
- Metcalfe, I. Stratigraphy, palaeontology and palaeogeography of the carboniferous of Southeast Asia. Soc. Géogr. Fr. Mém. 1984, 147, 107–118. [Google Scholar]
- Morley, C.K. Evolution from an Oblique Subduction Back-Arc Mobile Belt to a Highly Oblique Collisional Margin: The Cenozoic Tectonic Development of Thailand and Eastern Myanmar; Geology Society of London, Special Publications: London, UK, 2009; Volume 318, pp. 373–403. [Google Scholar]
- Tun, S.T.; Watkinson, I.M. Chapter 19: The Sagaing Fault, Myanmar. In Myanmar: Geology, Resources and Tectonics; Barber, A.J., Zaw, K., Crow, M.J., Eds.; Geological Society, London, Memoirs: London, UK, 2017; Volume 48, pp. 413–441. [Google Scholar]
- Lacassin, R.; Leloup, P.H.; Tapponnier, P. Bounds on strain in large Tertiary shear zones of SE Asia from boudinage restoration. J. Struct. Geol. 1993, 15, 677–692. [Google Scholar] [CrossRef]
- Lacassin, R.; Maluski, H.; Leloup, P.H.; Tapponnier, P.; Hinthong, C.; Siiribhakdi, K.; Chuaviroj, S.; Charoenravat, A. Tertiary diachronic extrusion and deformation of western Indochina: Structural and 40Ar/39Ar evidence from NW Thailand. J. Geophys. Res. 1997, 102, 10013–10037. [Google Scholar] [CrossRef]
- Morley, C.K.; Smith, M.; Carter, A.; Charusiri, P.; Chantraprasert, S. Evolution of deformation styles at a major restraining bend, constraints from cooling histories, Mae Ping Fault Zone, Western Thailand. In Tectonics of Strike-Slip Restraining and Releasing Bends; Cunningham, W.D., Mann, P., Eds.; Geology Society of London, Special Publications: London, UK, 2007; Volume 290, pp. 325–349. [Google Scholar]
- Bertrand, G.; Rangin, C.; Maluski, H.; Han, H.; Thein, T.A.; Myint, M.; Maw, O.; Lwin, S. Cenozoic metamorphism along the Shan scarp (Myanmar): Evidences for ductile shear along the Sagaing Fault or the northward migration of the eastern Himalayan Syntaxis. Geophys. Res. Lett. 1999, 26, 915–918. [Google Scholar] [CrossRef]
- Min, S. Structural Study along the Kyaukkyan Fault, Shan State. Ph.D. Thesis, University of Yangon, Yangon, Myanmar, 2010. [Google Scholar]
- Wang, Y.; Sieh, K.; Tun, S.T.; Lai, K.Y.; Myint, T. Active tectonics and earthquake potential of the Myanmar region. J. Geophys. Res. Solid Earth 2014, 119, 3767–3822. [Google Scholar] [CrossRef]
- Holt, W.E.; Ni, J.F.; Wallace, T.C.; Haines, A.J. The active tectonics of the Eastern Himalayan Syntaxis and surrounding regions. J. Geophys. Res. 1991, 96, 14595–14632. [Google Scholar] [CrossRef]
- Lacassin, R.; Replumaz, A.; Leloup, P.H. Hairpin river loops and slip-sense inversion’on Southeast Asian strike-slip faults. Geology 1998, 26, 703–706. [Google Scholar] [CrossRef]
- Wang, E.; Burchfiel, B.C.; Royden, L.H.; Chen, L.; Chen, J.; Li, W.; Chen, Z. Late Cenozoic Xianshuihe-Xiaojiang, Red River, and Dali Fault Systems of Southwestern Sichuan and Central Yunnan, China. In Late Cenozoic Xianshuihe-Xiaojiang, Red River, and Dali Fault Systems of Southwestern Sichuan and Central Yunnan, China; Special Paper 327; Geological Society of America: Boulder, CO, USA, 1998; pp. 1–108. [Google Scholar]
- Shen, Z.K.; Lü, J.; Wang, M.; Bürgmann, R. Contemporary crustal deformation around the southeast borderland of the Tibetan Plateau. J. Geophys. Res. Solid Earth 2005, 110, 1–17. [Google Scholar] [CrossRef]
- Socquet, A.; Pubellier, M. Cenozoic deformation in western Yunnan (China-Myanmar border). J. Asian Earth Sci. 2005, 24, 495–515. [Google Scholar] [CrossRef]
- Zaw, K. Geological, petrological and geochemical characteristics of granitoid rocks in Burma; with special reference of the associated W-Sn mineralization and their tectonic setting. J. Asian Earth Sci. 1990, 4, 293–335. [Google Scholar] [CrossRef]
- Thein, M. A preliminary synthesis of the geological evolution of Burma with reference to the tectonic development of Southeast Asia. Geol. Soc. Malaysia Bull. 1973, 6, 87–116. [Google Scholar] [CrossRef]
- Mitchell, A.H.G.; Chung, S.-L.; Oo, T.; Lin, T.-H.; Hung, C.-H. Zircon U-Pb ages in Myanmar: Magmatic-metamorphic events and the closure of a neo- Tethys ocean? J. Asian Earth Sci. 2012, 56, 1–23. [Google Scholar] [CrossRef]
- Mitchell, A.H.G.; Hlaing, T.; Htay, N. Mesozoic orogenies along the Mandalay-Yangon margin of the Shan Plateau. In Proceedings of the Symposium on the Geology of Thailand, Bangkok, Thailand, 26–31 August 2002; pp. 136–149. [Google Scholar]
- Mitchell, A.H.G.; Htay, M.T.; Htun, K.M.; Win, M.N.; Oo, T.; Hlaing, T. Rock relationships in the Mogok metamorphic belt, Tatkon to Mandalay, central Myanmar. J. Asian Earth Sci. 2007, 29, 891–910. [Google Scholar] [CrossRef]
- Searle, D.L.; Haq, B.T. The Mogok Belt of Burma and its relationship to the Himalayan Orogeny. In Proceedings of the 22nd International Geological Congress, New Delhi, India, 14–22 December 1964; pp. 132–161. [Google Scholar]
- Searle, M.P.; Noble, S.R.; Cottle, J.M.; Waters, D.J.; Mitchell, A.H.G.; Hlaing, T.; Horstwood, M.S.A. Tectonic evolution of the Mogok metamorphic belt, Burma (Myanmar) constrained by U-Th-Pb dating of metamorphic and magmatic rocks. Tectonics 2007, 26, TC3014. [Google Scholar] [CrossRef]
- Sone, M.; Metcalfe, I. Parallel Tethyan sutures in mainland Southeast Asia: New insights for Palaeo-Tethys closure and implications for the Indosinian orogeny. Compt. Rendus Geosci. 2008, 340, 166–179. [Google Scholar] [CrossRef]
- Myint, P. Geology of Hopone-Loilem Township, Southern Shan State, Myanmar; Unpublished Departmental Report; Department of Geological Survey and Mineral Exploration: Naypyidaw, Myanmar, 2004. [Google Scholar]
- Aung, H. Geology of the Menetaung Area, Hopone Township, Southern Shan State. Ph.D. Thesis, University of Mandalay, Mandalay, Myanmar, 2010. [Google Scholar]
- Bway, K.H. Geology of the Lyharmyar Prospect, Hopone Township, Southern Shan State, Myanmar; Unpublished Report; Ruby Dragon Co. Ltd.: Yangon, Myanmar, 2010. [Google Scholar]
- Bodnar, R.J. Revised equation and table for determining the freezing-point depression of H2O-NaCl solutions. Geochim. Cosmochim. Acta 1993, 57, 683–684. [Google Scholar] [CrossRef]
- Wang, X.; Gao, J.; He, S.; He, Z.; Zhou, Y.; Tao, Z.; Zhang, J.; Wang, Y. Fluid Inclusion and geochemistry studies of calcite veins in Shizhu Synclinorium, Central China: Record of origin of fluids and diagenetic conditions. J. Earth Sci. 2017, 28, 315–332. [Google Scholar] [CrossRef]
- Wilkinson, J.J. Metastable Freezing: A new method for the estimation of salinity in aqueous fluid inclusions. Econ. Geol. 2017, 122, 185–193. [Google Scholar] [CrossRef]
- Clayton, R.N.; O’Neil, J.R.; Mayeda, T.K. Oxygen isotope exchange between quartz and water. J. Geophys. Res. 1972, 77, 3057–3067. [Google Scholar] [CrossRef]
- Xiong, Y.Q.; Shao, Y.J.; Mao, J.W.; Wu, S.C.; Zhou, H.D.; Zheng, M.H. The polymetallic magmatic-hydrothermal Xiangdong and Dalong systems in the W-Sn-Cu-Pb-Zn-Ag Dengfuxian orefield, SE China: Constraints from geology, fluid inclusions, H-O-S-Pb isotopes, and sphalerite Rb-Sr geochronology. Miner. Depos. 2019, 54, 1101–1124. [Google Scholar] [CrossRef]
- Zhu, L.M.; Zhang, G.W.; Guo, B.; Ben, L.; Gong, H.J.; Wang, F. Geochemistry of the Jinduicheng Mo-bearing porphyry and deposit, and its implications for the geodynamic setting in East Qinling, PR China. Chemie der Erde-Geochemistry 2010, 70, 159–174. [Google Scholar] [CrossRef]
- Li, H.; Wu, Q.H.; Evans, N.J.; Zhou, Z.K.; Kong, H.; Xi, X.S.; Lin, Z.W. Geochemistry and geochronology of the Banxi Sb deposit: Implications for fluid origin and the evolution of Sb mineralization in central-western Hunan, South China. Gondwana Res. 2018, 55, 112–134. [Google Scholar] [CrossRef]
- Xu, B.; Jiang, S.Y.; Luo, L.; Zhao, K.D.; Ma, L. Origin of the Granites and Related Sn and Pb-Zn Polymetallic Ore Deposits in the Pengshan District, Jiangxi Province, South China: Constraints from Geochronology, Geochemistry, Mineral Chemistry, and Sr-Nd-Hf-Pb-S Isotopes. Miner. Depos. 2017, 52, 337–360. [Google Scholar] [CrossRef]
- Huang, C.W.; Li, H.; Lai, C.K. Genesis of the Binh Do Pb-Zn Deposit in Northern Vietnam: Evidence from H-O-S-Pb Isotope Geochemistry. J. Earth Sci. 2019, 30, 679–688. [Google Scholar] [CrossRef]
- Taylor, H.P. Oxygen and hydrogen isotope relationships in hydrothermal mineral deposits. In Geochemistry of Hydrothermal Ore Deposits; Barnes, H.L., Ed.; Wiley: New York, NY, USA, 1997; Volume 3, pp. 229–302. [Google Scholar]
- Zartman, R.E.; Doe, B.R. Plumbotectonics the model. Tectonophysics 1981, 75, 135–162. [Google Scholar] [CrossRef]
- Yu, G.-Y.; Li, S.-D.; Wang, Y.-C.; Wang, K.-Y. Fluid evolution and ore genesis of the Qibaoshan polymetallic orefield, Shandong Province, China: Constraints from fluid inclusions and H–O–S isotopic compositions. Minerals 2019, 9, 394. [Google Scholar] [CrossRef]
- Taylor, H.P. The application of oxygen and hydrogen isotope studies to problems of hydrothermal alteration and ore deposition. Econ. Geol. 1974, 69, 843–883. [Google Scholar] [CrossRef]
- Chen, J.; Wang, H.N. Geochemistry; Science Press: Beijing, China, 2004. [Google Scholar]
- Zhu, Y.; An, F.; Tan, J. Geochemistry of hydrothermal gold deposits. A review. Geosci. Front. 2011, 2, 367–374. [Google Scholar] [CrossRef]
- Seal, R.R. Sulfur Isotope Geochemistry of Sulfide Minerals. Rev. Miner. Geochem. 2006, 61, 633–677. [Google Scholar] [CrossRef]
- Yuan, M.-W.; Li, L.; Li, S.-R.; Li, C.-L.; Santosh, M.; Alam, M.; Bao, X.-B. Mineralogy, fluid inclusions and S-Pb-H-O isotopes of the Erdaokan Ag-Pb-Zn deposit, Duobaoshan metallogenic belt, NE China: Implications for ore genesis. Ore Geol. Rev. 2019, 113, 103074. [Google Scholar] [CrossRef]
- Sakai, H. Isotopic properties of sulfur compounds in hydrothermal processes. Geochem. J. 2008, 2, 29–49. [Google Scholar] [CrossRef]
- Ohmoto, H. Isotopes of sulfur and carbon. In Geochemistry of Hydrothermal Ore Deposits; Wiley: New York, NY, USA, 1979; pp. 509–567. [Google Scholar]
- Hoefs, D.J. Geochemistry of Stable Isotopes. Angew. Chem. Int. Ed. 1975, 14, 75–79. [Google Scholar] [CrossRef]
- Ohmoto, H.; Goldhaber, M.B. Sulfur and carbon isotopes. In Geochemistry of Hydrothermal Ore Deposits; Barnes, H.L., Ed.; Wiley: New York, NY, USA, 1997; pp. 517–611. [Google Scholar]
- Jørgensen, B.B.; Isaksen, M.F.; Jannasch, H.W. Bacterial sulfate reduction above 100 °C in deep-sea hydrothermal vent sediments. Science 1992, 258, 1756–1757. [Google Scholar] [CrossRef] [PubMed]
- Lei, X.F.; Duan, D.F.; Jiang, S.Y.; Xiong, S.F. Ore-forming fluids and isotopic (H-O-C-S-Pb) characteristics of the Fujiashan-Longjiaoshan skarn W-Cu-(Mo) deposit in the Edong District of Hubei Province, China. Ore Geol. Rev. 2018, 102, 386–405. [Google Scholar] [CrossRef]
- Tapponnier, P.; Peltzer, G.; Ledain, A.; Armijo, R.; Cobbold, P. Propagating extrusion tectonics in Asia: New insights from simple experiments with plasticine. Geology 1982, 10, 611–616. [Google Scholar] [CrossRef]
- Tapponnier, P.; Peltzer, G.; Armijo, R. On the mechanics of the collision between India and Asia. In Collision Tectonics; Coward, M.P., Ries, S.C., Eds.; Geology Society of London, Special Publications: London, UK, 1986; Volume 19, pp. 113–157. [Google Scholar]
- Tapponnier, P.; Lacassin, R.; Leloup, P.H.; Schärer, U.; Dalai, Z.; Haiwei, W.; Xiaoxan, L.; Shaocheng, J.; Lianshang, Z.; Jiayou, Z. The Ailao Shan/Red River metamorphic belt: Tertiary left-lateral shear between Indochina and South China. Nature 1990, 343, 431–437. [Google Scholar] [CrossRef]
- Aitchison, J.C.; Xia, X.; Baxter, A.T.; Ali, J.R. Detrital zircon U–Pb ages along the Yarlung-Tsangpo suture zone, Tibet: Implications for oblique convergence and collision between India and Asia. Gondwana Res. 2011, 20, 691–709. [Google Scholar] [CrossRef]
© 2020 by the authors. Licensee MDPI, Basel, Switzerland. This article is an open access article distributed under the terms and conditions of the Creative Commons Attribution (CC BY) license (http://creativecommons.org/licenses/by/4.0/).