Article

The Elastic Properties of β-Mg2SiO4 Containing 0.73 wt.% of H2O to 10 GPa and 600 K by Ultrasonic Interferometry with Synchrotron X-Radiation

1
Division of Physics, Engineering, Mathematics & Computer Science, Delaware State University, Dover, DE 19901, USA
2
Mineral Physics Institute, Stony Brook University, Stony Brook, NY 11794, USA
3
Department of Geosciences, Stony Brook University, Stony Brook, NY 11794, USA
4
Key Laboratory for High Temperature and High-Pressure Study of the Earth’s Interior, Institute of Geochemistry, Chinese Academy of Sciences, Guiyang 550002, China
5
Department of Chemistry, Stony Brook University, Stony Brook, NY 11794, USA
*
Author to whom correspondence should be addressed.
Minerals 2020, 10(3), 209; https://doi.org/10.3390/min10030209
Submission received: 21 January 2020 / Revised: 16 February 2020 / Accepted: 21 February 2020 / Published: 26 February 2020
(This article belongs to the Special Issue Mineral Physics—In Memory of Orson Anderson)

Abstract

:
We measured the elastic velocities of a synthetic polycrystalline β-Mg2SiO4 containing 0.73 wt.% H2O to 10 GPa and 600 K using ultrasonic interferometry combined with synchrotron X-radiation. Third-order Eulerian finite strain analysis of the high P and T data set yielded Kso = 161.5(2) GPa, Go = 101.6(1) GPa, and (∂Ks/∂P)T = 4.84(4), (∂G/∂P)T = 1.68(2) indistinguishable from Kso = 161.1(3) GPa, Go = 101.4(1) GPa, and (∂Ks/∂P)T = 4.93(4), (∂G/∂P)T = 1.73(2) from the linear fit. The hydration of the wadsleyite by 0.73 wt.% decreases Ks and G moduli by 5.3% and 8.6%, respectively, but no measurable effect was noted for (∂Ks/∂P)T and (∂G/∂P)T. The temperature derivatives of the Ks and G moduli from the finite strain analysis (∂KS/∂T)P = −0.013(2) GPaK−1, (∂G/∂T)P = −0.015(0.4) GPaK−1, and the linear fit (∂KS/∂T)P = −0.015(1) GPaK−1, (∂G/∂T)P = −0.016(1) GPaK−1 are in agreement, and both data sets indicating the |(∂G/∂T)P| to be greater than |(∂KS/∂T)P|. Calculations yield ∆Vp(α-β) = 9.88% and ∆VS(α-β) = 8.70% for the hydrous β-Mg2SiO4 and hydrous α-Mg2SiO4, implying 46–52% olivine volume content in the Earth’s mantle to satisfy the seismic velocity contrast ∆Vs = ∆VP = 4.6% at the 410 km depth.

1. Introduction

Wadsleyite [β-(Mg, Fe)2SiO4] is a high-pressure polymorph of olivine [α-(Mg, Fe)2SiO4] stable from 410 to 525 km in the Earth’s transition zone. Wadsleyite can incorporate varying amounts of water up to 3.3% as hydroxyl (OH) groups in the structure depending on the pressure and temperature and phase conditions [1,2,3,4]. The hydration of wadsleyite takes place by two H atoms substituting for one octahedral Mg in the structure [1,4,5,6,7,8,9,10,11] that affects the elasticity when compared to the anhydrous phase, and most notably at high pressure (P) and temperature (T) due to the variability of the H atomic radius.
Previous studies [9,12,13,14] have suggested that the Earth’s transition zone could be a potential water reservoir, given the abundance of wadsleyite and ringwoodite in the region. The seismic velocity jumps at the 410-km depth have been associated with changes in the elastic wave speeds resulting from the transformation of olivine to wadsleyite. Still, the depth of the phase transition is reduced by OH incorporation into the olivine and wadsleyite structures.
The elastic properties of hydrous wadsleyite, and particularly the pressure (P) and temperature (T) derivatives of the elastic moduli, are essential for providing tighter constraints on the olivine content of the Earth’s mantle by comparing laboratory elasticity data with the seismic velocity jumps at the 410-km depth. The data are also essential for constraining the water content in the wadsleyite phase that constitutes about 60% of the mineral assemblage in the transition zone region.
Data are already available for anhydrous Mg, and Mg-Fe wadsleyite at high pressure and room temperature [15,16,17], high pressure and high temperature [18,19,20], and, high temperature and room pressure [21,22,23,24], but the elasticity data for the hydrous wadsleyite are sparse compared to the anhydrous wadsleyite. A few static compression studies [6,25] have yielded information on the isothermal bulk modulus (KT) and its derivative (KT’) for OH-bearing wadsleyite. However, the static compression studies do not provide information on the shear modulus. Secondly, fitting such P-V-T data to an equation of state requires a significant trade-off between the bulk modulus and its derivative [26].
Brillouin scattering measurements [27] on single-crystal wadsleyite containing 0.37, 0.84, and 1.66 wt.% water at room pressure (P) and room temperature (T) show that both the bulk (Kso) and shear (Go) moduli decrease linearly with water content in the wadsleyite. Measurements of the elasticity of wadsleyite containing 0.84 wt.% H2O to 12 GPa at room T [28] yielded the P-wave and S-wave velocities that are 2.7% and 3.6%, respectively, lower than the corresponding data for the anhydrous wadsleyite [17]. The study also concluded that the effect of OH substitution in wadsleyite on the pressure derivatives of the bulk and shear moduli is immeasurable. There is no consistent effect on the pressure derivatives of K and G due to the hydration of wadsleyite from comparing the Brillouin scattering data on single-crystal hydrous Fe-bearing wadsleyite containing 0.24 wt.% H2O (Fe = 0.112) measured at high P and room T [29], with similar measurements carried out for wadsleyite containing 1.93 wt.% H2O (Fe = 0.112) [30], and combining the Fe-bearing wadsleyite data with the static compression studies and the Brillouin scattering data on end-member wadsleyite with 0.84 wt.% H2O [28] still does not reveal a clear trend regarding the variation of K and G with OH content in wadsleyite.
Temperature is an important variable, in addition to the pressure that affects geophysical properties, including the elastic wave velocities in the Earth’s mantle. However, compared to the limited data currently available for the anhydrous wadsleyite [18,20,21,22,23,24], there is as yet no study to investigate the effect of temperature on the elasticity of hydrous wadsleyite. Ultrasonic and Brillouin scattering techniques are well-established for investigating the elasticity of materials. The Brillouin scattering measures the elasticity of the single-crystal as a function of the crystallographic direction within the sample. However, the utilization of the technique to study the hydrous material at high T is challenging compared to the pressure study. The ultrasonic technique employs either dense synthetic polycrystalline or relatively large single-crystal specimens. However, the main difficulty is to make suitable high-acoustic polycrystalline specimens or relatively large single-crystals of the hydrous high-pressure phase containing structurally-bound water. In addition to the sample difficulty, the OH retention in the hydrous sample during the high P and T ultrasonic studies is an essential factor to consider in the studies.
We report the synthesis of a dense isotropic polycrystalline specimen of hydrous wadsleyite (β-Mg2SiO4) containing 0.73 wt.% H2O, and the ultrasonic elasticity data for the sample measured to 10 GPa and temperatures to 600 K using ultrasonic interferometry techniques combined with synchrotron X-ray diffraction. We compare our data with those of previous studies of Mg and Mg-Fe bearing hydrous wadsleyite, evaluate the effect on the elasticity due to OH incorporation in the wadsleyite, and discuss the impact of the temperature derivatives of the elasticity of wadsleyite on the olivine content of the Earth’s transition zone.

2. Materials and Methods

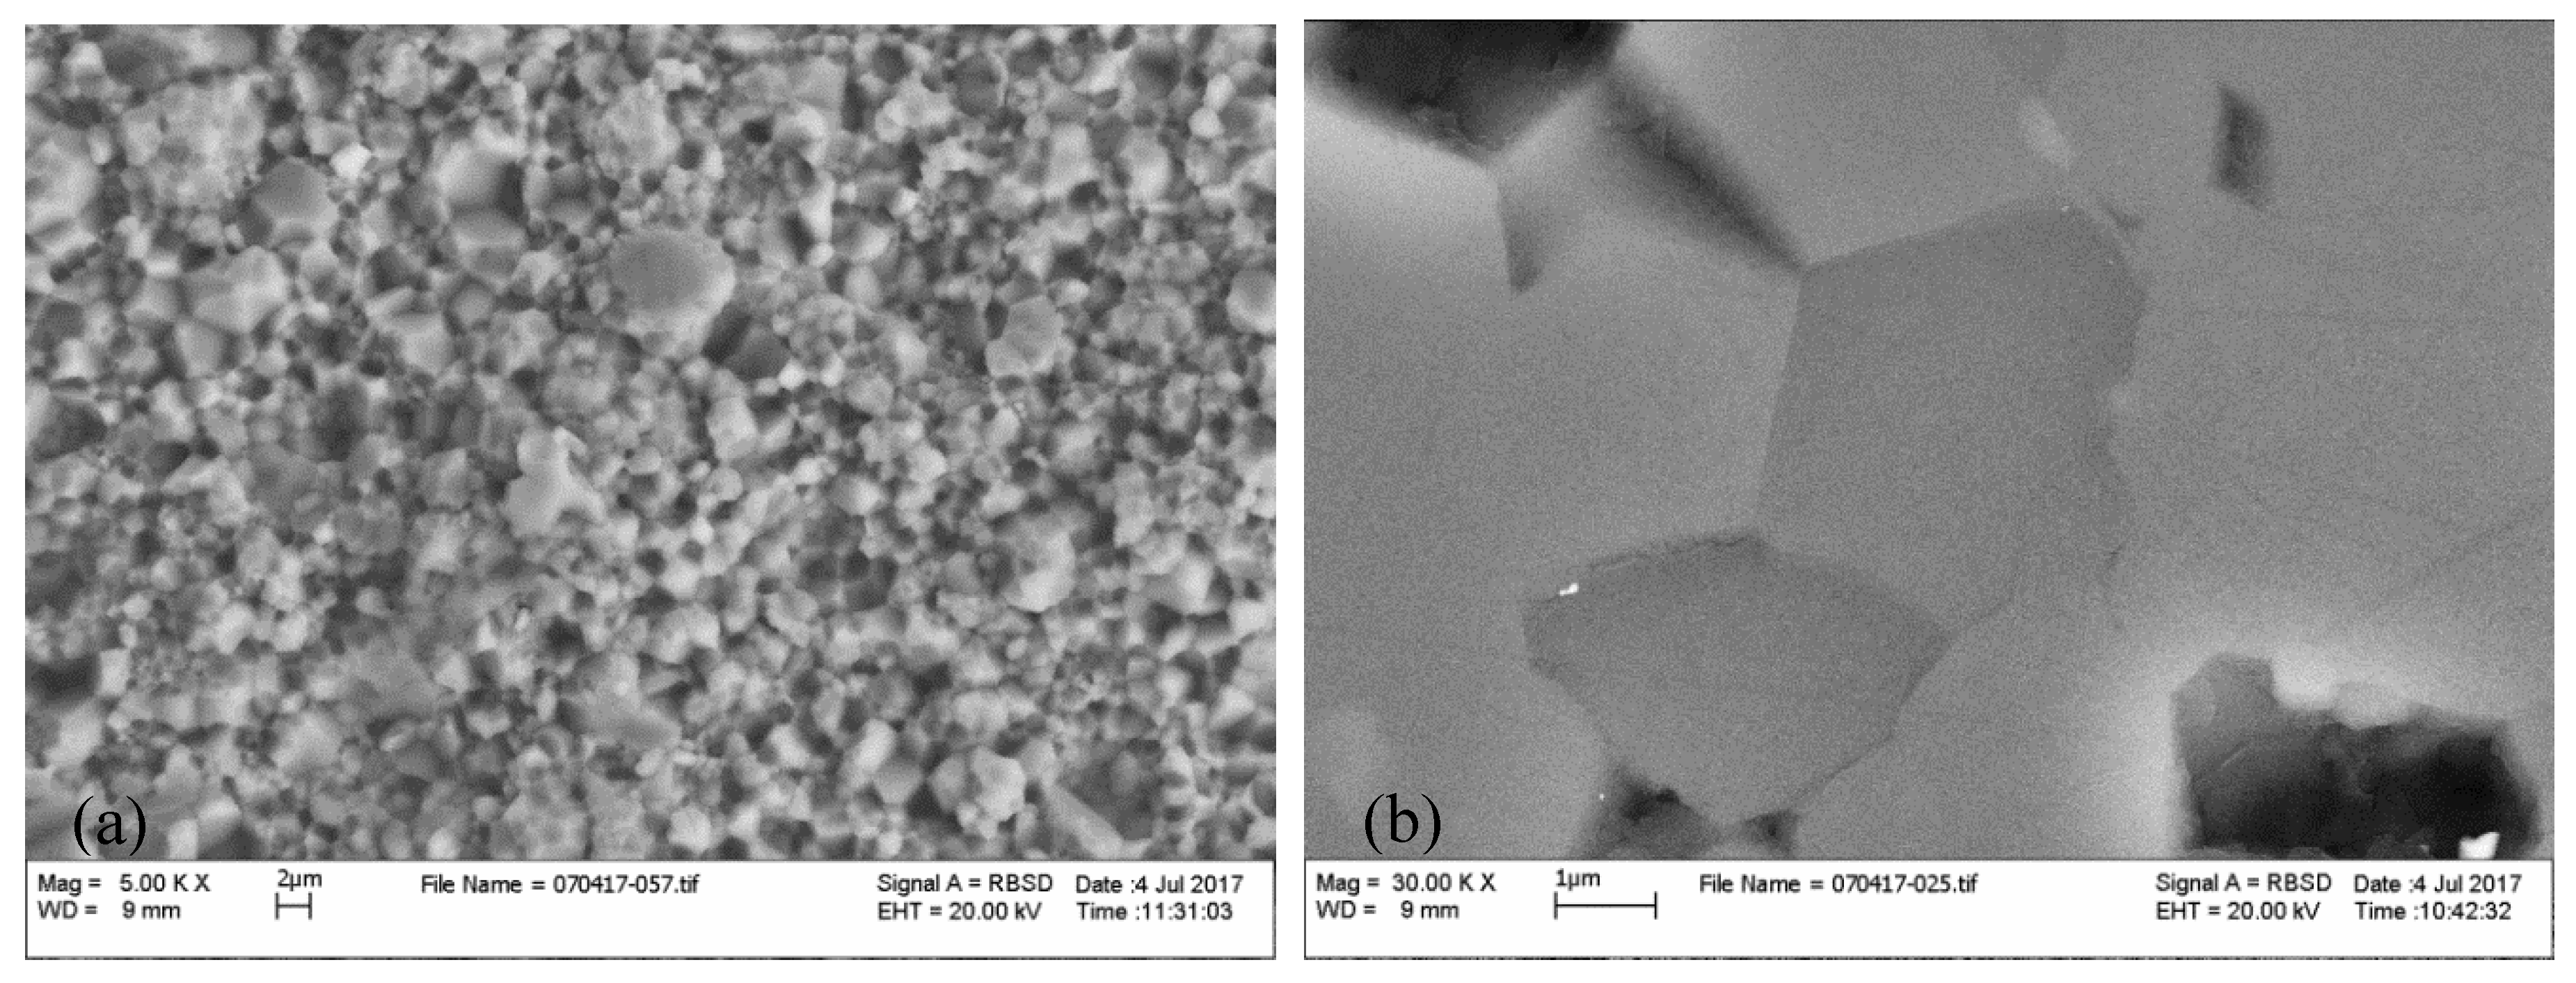
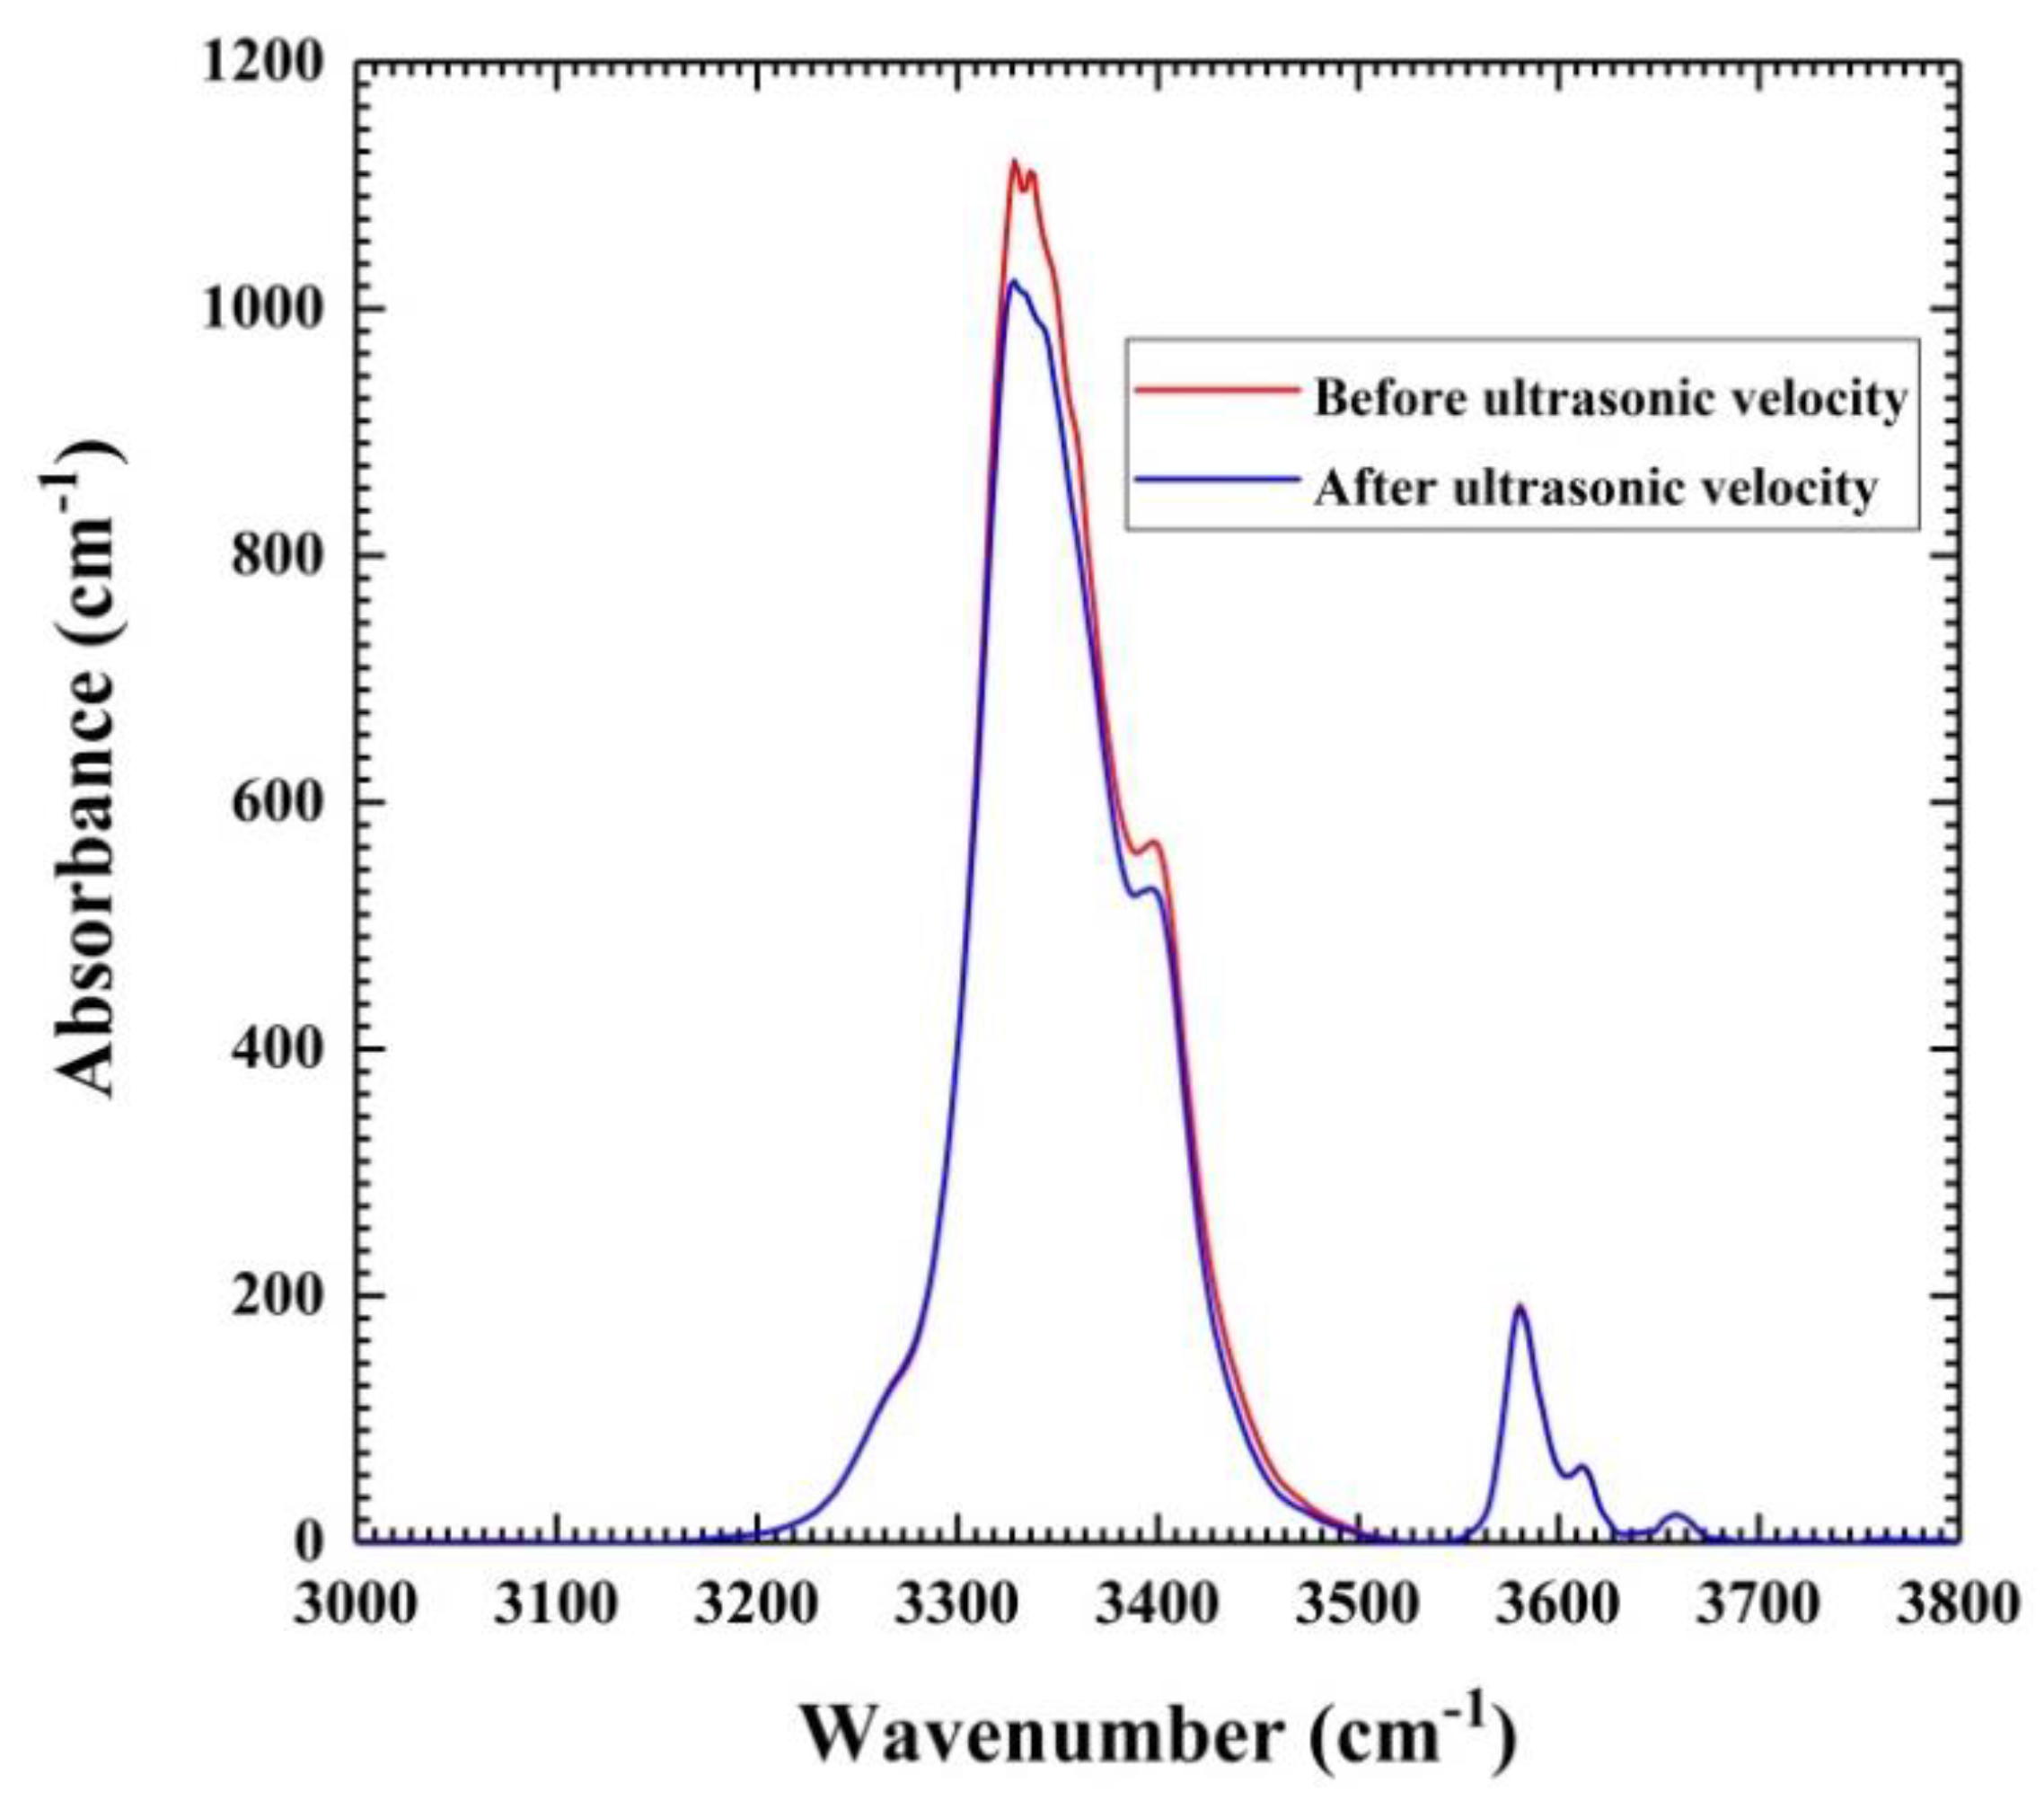
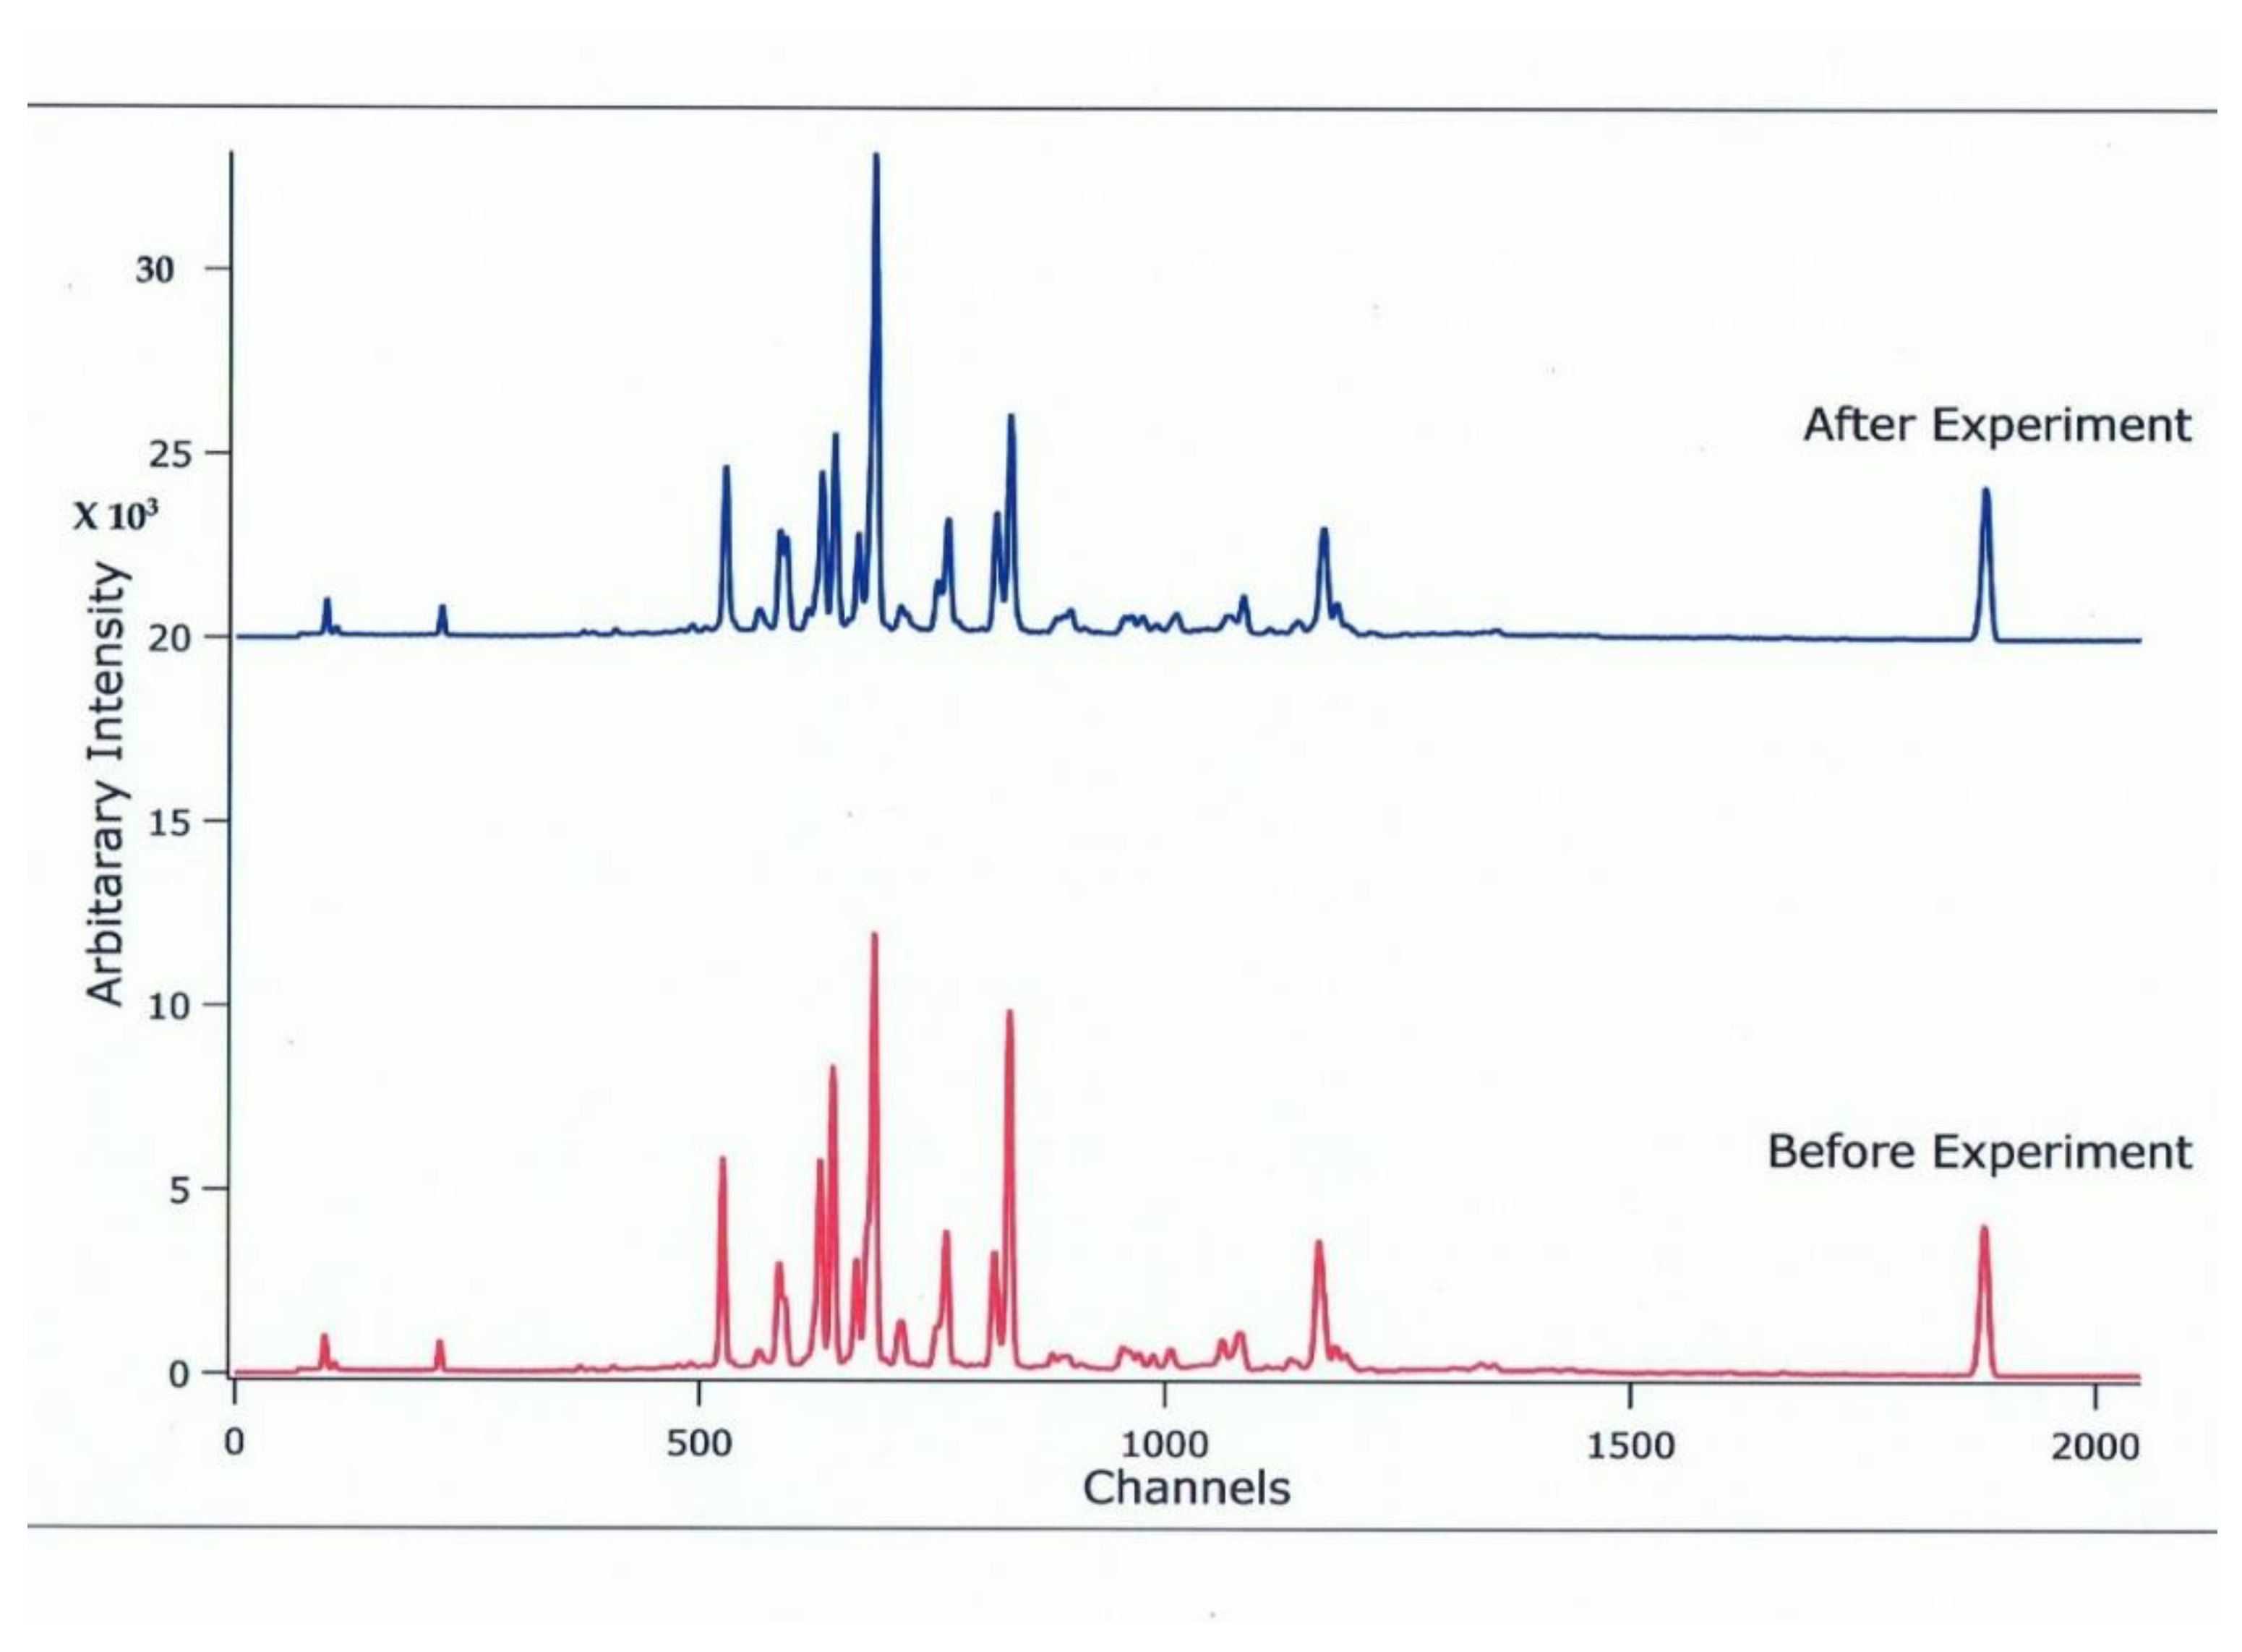
2.1. Sample Synthesis and Characterization

The synthetic polycrystalline specimen of hydrous wadsleyite (β-Mg2SiO4) used in this study was hot-pressed in the 2000-ton uniaxial split-cylinder apparatus (USSA-2000) of the Kawai-type [31,32] at the Stony Brook High-Pressure laboratory, under conditions of 15.5 GPa and 1000 °C for 3 h within a 14/8 mm cell assembly.
The starting mixture consisted of pure forsterite (α-Mg2SiO4) and brucite [Mg(OH2)] calculated to yield 0.778 wt.% H2O, with additional silica (SiO2) to maintain chemical charge balance due to the breakdown of brucite. Before weighing, we dried the α-Mg2SiO4 and the SiO2 powders at 1000 °C for 24 h and the Mg(OH)2 at 350 °C for 24 h. The mixture was ground several times to a fine-grained homogenous powder in an agate mortar under alcohol. The powder mixture was dried in an oven at 150 °C for 24 h and then densely packed in an Au75Pd25 capsule previously annealed at 900 °C. The capsule was crimped, cold-sealed in the air, and placed inside a NaCl sleeve inside a graphite resistance furnace. The NaCl insulates the capsule from the graphite furnace and also provides a pseudo-hydrostatic environment for the sample during heating at high pressure. A previous study [33] has demonstrated that NaCl loses most of its shear strength at about 300 °C, thus minimizing non-hydrostatic stress around the sample.
The hot-pressing procedure used in the study is similar to those described in detail by previous investigators [34,35,36]. We first increased the pressure to 1 GPa, and then the sample was preheated to 200 °C to relax the NaCl around the sample. Subsequently, we increased the pressure slowly to 15.5 GPa in 13 h, and then the temperature was increased to 1000 °C in 15 min. After maintaining the sample at the P and T conditions for 3 h, the temperature was rapidly decreased to 200 °C in 10 min and then maintained at the T condition throughout the depressurization that took 15 h.
The recovered sample was cylindrical, about 2.7 mm in diameter and 2.2 mm long. Before further characterization, we ground both ends of the sample roughly flat and collected X-ray diffraction spectra of the surfaces on a Rigaku Ultima IV diffractometer (Tube voltage—40 kV, Tube current—30 mA, Cu Kα λ = 1.54059 Å, 10–70° 2θ, 0.02° step size, 0.4 min/step) in Bragg-Brentano geometry with a D-tex Ultra solid-state detector. The spectra confirmed the specimen to be single-phase wadsleyite (β-Mg2SiO4).
The bulk density of the sample was determined by Archimedes’ method using distilled water in which we add a few drops of an organic solvent to reduce surface tension on the sample and immersed parts. We corrected the measured bulk density for the effect of air buoyancy on the sample weight in air and also the change in the density of the fluid with temperature. We obtained ρ = 3.435 (5) g/cc, which is in excellent agreement with the theoretical X-ray density (ρ = 3.436 g/cc) based on the single-crystal X-ray systematics developed [6] that report the variation of the density of wadsleyite with H2O content.
We carried out a scanning electron microscopy (SEM) examination of both a fractured and a polished surface of the wadsleyite specimen using an LEO-1550 FEG SEM with electron dispersive X-ray spectroscopy (EDAX) operating at the high tension of 20 kV. The samples were sputter-coated with gold for the analysis. We observed, as evident in the photomicrograph of the fractured surface of the sample in Figure 1a, that the synthetic polycrystalline wadsleyite sample is homogeneous and fine-grained. The average grain size of the sample is about 3–5 µm. Examination of the polished surface of the sample (Figure 1b) reveals the grains to be well-equilibrated and well-developed with sharp straight edges meeting at high angles.
The water content of the polycrystalline hydrous wadsleyite (β-Mg2SiO4) sample was measured using the Fourier transform infrared spectroscopy (FTIR) technique at the Key Laboratory of High-Temperature and High-Pressure Study of the Earth’s Interior, Institute of Geochemistry, Chinese Academy of Sciences, Guiyang, China. Previous studies [37,38] have described in detail the set-up and experimental procedure of the FTIR technique.
We carried out the spectra measurements using a Fourier transform vacuum infrared spectroscopy (FTIR) spectrometer (Vertex-70V and Hyperion-1000 infrared microscope). We collected infrared spectra of the original polycrystalline sample from 350 to 8000 cm−1 wavenumbers, as well as the recovered specimen from the high pressure and high-temperature ultrasonic studies.
The specimens were doubly polished to a thickness of about 60 µm for the IR analysis. The IR absorption of the sample was measured using unpolarized radiation with a Mid-IR light source, a CaF2 beam splitter, and an MCT detector with a 100 µm × 100 µm aperture. We collected 512 scans for each spectrum in the analysis. In Figure 2, we have overlapped the infrared spectra acquired for a sliced piece of the original sample and the remaining sample recovered from the ultrasonic velocity measurements to demonstrate that there was no change in the water content during the high P and T ultrasonic studies; the data agree within the uncertainties (10%) of the FTIR measurements. The Paterson calibration [39] was adopted to precisely determine the water content from FT-IR absorption data using,
C OH = B i 150 ξ K ( v ) ( 3780 v ) d v
where COH is the molar concentration of hydroxyl (ppm wt. of H2O or H/106 Si), Bi is the density factor (4.08 cm × 104 cm H/106 Si), ξ is the orientation factor (1/3), and K(v) is the absorption coefficient at wavenumber v in cm−1. The integration was from 3000 to 3750 cm−1. The analysis yielded identical water contents of 0.73 (7) wt.% for both specimens. The listed uncertainty of 10% is mainly due to errors in the sample thickness measurement, in addition to the current unavailability of a standard water content calibration for hydrous wadsleyite.
For ultrasonic studies, both ends of a sliced cylindrical piece of the sample were ground and polished flat and parallel to within 1/4λ of visible light, using 9, 6, 3, 1, and ¼ µm diamond compounds in succession. The polished sample, having a length of 1.017 mm, was cored to a 2 mm diameter for the ultrasonic studies. For internal consistency and data comparison, we also prepared a sample of anhydrous β-Mg2SiO4 that we have measured using the same the high P and T technique described subsequently for the hydrous sample.
The synchrotron X-ray diffraction pattern for the hydrous wadsleyite (β-Mg2SiO4) containing 0.73 (7) wt.% of H2O used in this study is shown in Figure 3 and compared with one taken with the press open (ambient condition) at the end of the high P and T ultrasonic experiments.
The spectra are sharp and show no uncharacteristic peaks, indicating that there is no significant residual stress in both the original and the recovered specimens, and also that the wadsleyite phase did not change during the high P and T experiments. We conducted the ultrasonic measurements below 600 K to avoid the dehydration of the hydrous β-Mg2SiO4 and also to avoid a possible back-transformation of the sample to the low P and T olivine phase.

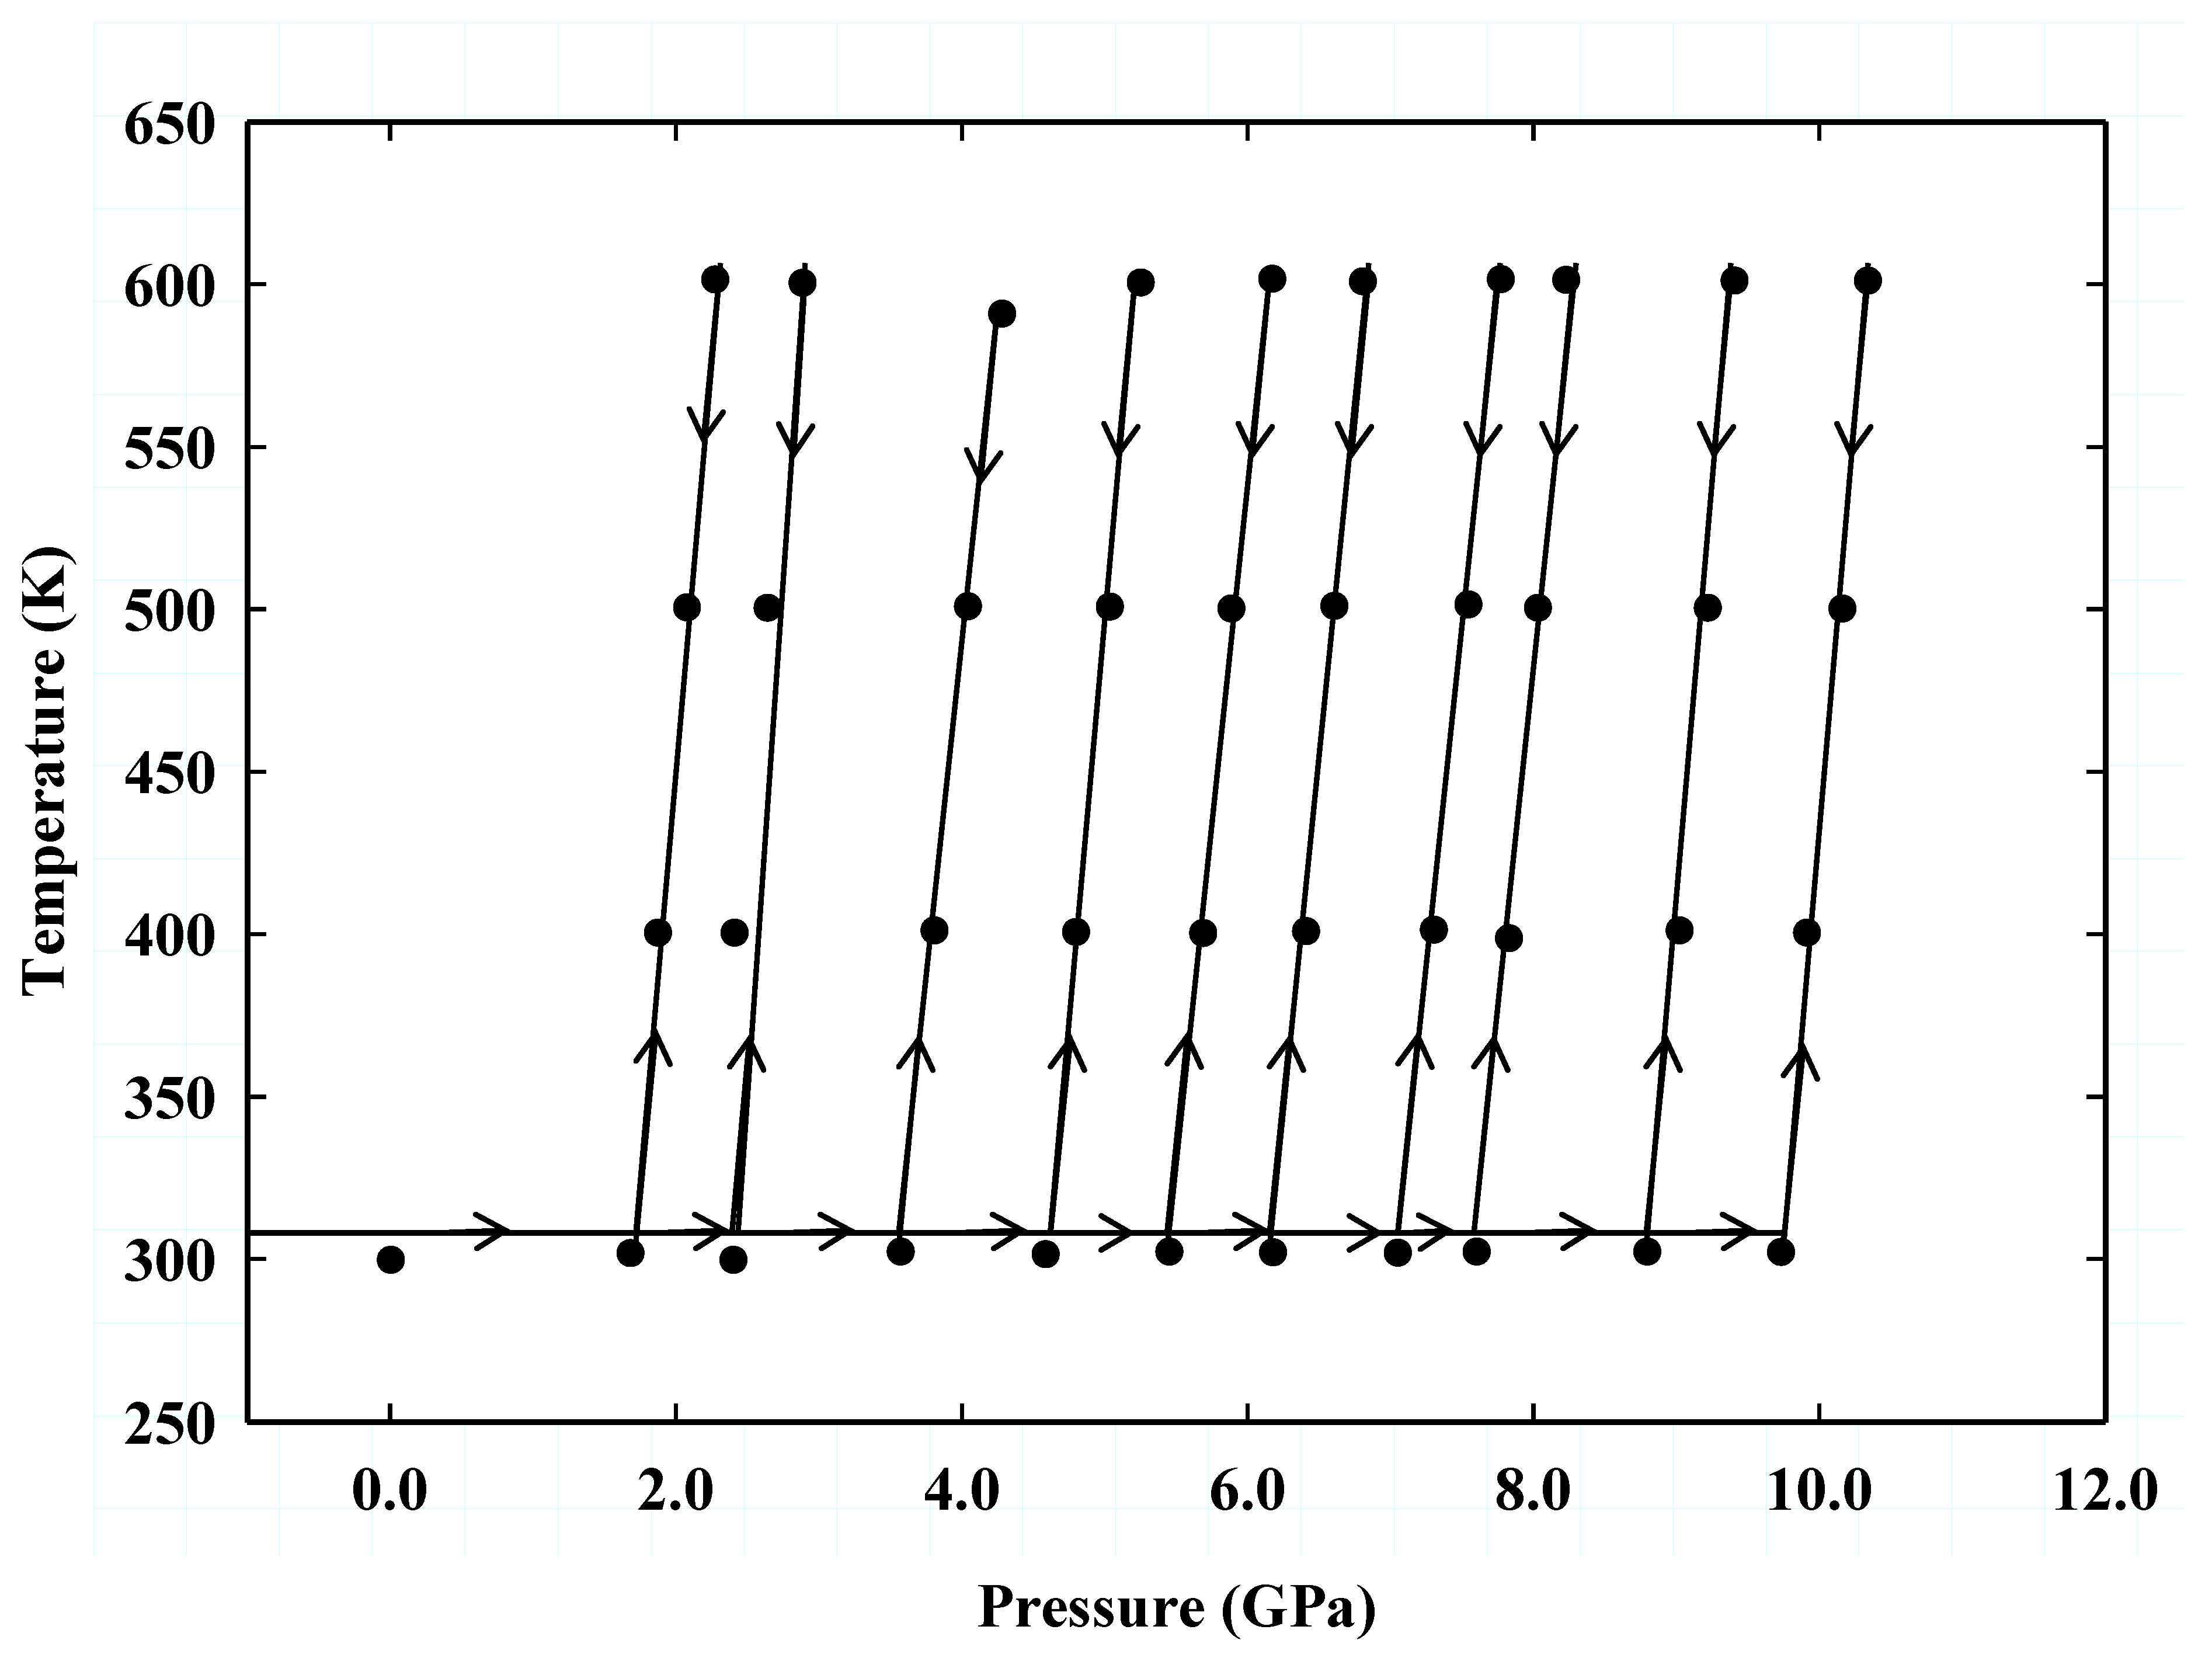
2.2. Elasticity Measurements at High Pressure and High Temperature

The high P and T ultrasonic velocity measurements of the hydrous wadsleyite sample were carried out by ultrasonic interferometry techniques. The pressure generating device was a 250-ton hydraulic DIA-type multi-anvil apparatus equipped with a DDIA module installed at the 6-BM-B beamline at the advanced photon light source (APS) of the Argonne National Laboratory and inter-phased with in-situ X-ray diffraction and X-radiographic techniques. The experimental setup and the directly integrated acoustic system combined with pressure experiments (DIASCOPE) for data acquisition are described in detail in a previous study [40]. The DIASCOPE is an adapted ultrasonic interferometry technique for fast acoustic travel time measurements. A previous study [41] provides a detailed description of the main features and pressure-generating mechanism of the DIA-type high-pressure apparatus. The cell assembly and the acoustic piezoelectric transducer/cubic carbide anvil arrangement used in this study are the same as illustrated in Figure 1 of a previous study [42], and as described in other previous studies [43]. We utilized a dual-mode 10° Y-cut LiNbO3 transducer capable of generating and receiving P and S waves simultaneously. An alumina buffer rod of length 2.0 mm and 2.0 mm in diameter ground and polished flat on both ends is inserted between the specimen and the tungsten carbide (WC) anvil, allowing high-frequency acoustic signals (20–70 MHz) to propagate to and from the sample. A BN sleeve houses the sample supported at the far end by a NaCl disc; the NaCl also serves as an in-situ pressure marker. A 2 µm gold Au foil was inserted at the top and bottom of the specimen to improve the mechanical coupling at the interfaces between the specimen and cell components as the sample was pressurized and to enhance the transmission and reception of the acoustic signal. The two Au foils delineate the specimen in the X-radiographic images acquired for determining the specimen length at each P-T condition [44,45]. A W/Re 3%–W/Re 25% thermocouple located at the interface between the sample and the NaCl in-situ pressure standard monitors the sample temperature.
We have designed the pressure-temperature (P-T) path of the ultrasonic experiments used in this study and shown in Figure 4 to minimize deviatoric stress in the sample. We initially compressed the sample to about 2 GPa. We then heated it to 600 K, where we collected travel times of acoustic compressional (P) and shear (S) waves, X-ray diffraction of the sample, the NaCl in-situ pressure standard, and a sample image. Data were subsequently collected at 100 K intervals as we decreased the temperature down to ambient temperature along the isobar. We then increased the pressure moderately and repeated the procedure until six cycles of data collection were completed up to the peak pressure of 9.8 GPa, followed by four data collecting sequences on decompression. At each P and T point, we waited for about 3 min to equilibrate the pressure and temperature within the sample before acquiring the data.
The P and T path in the current study differs from that of previous standard studies [16,19,20,46,47] in which the sample is first compressed to the maximum pressure, followed by heating and subsequent data collection during cooling along an isobaric path. Temperatures in the traditional studies were relatively high to relax stress accumulated in the sample during compression to high pressure. However, given the limited temperature of 600 K in the current study, we minimized the stress in the sample throughout the experiment by heating the sample to the peak temperature at each pressure step of the operation before the data acquisition.

3. Results and Discussions

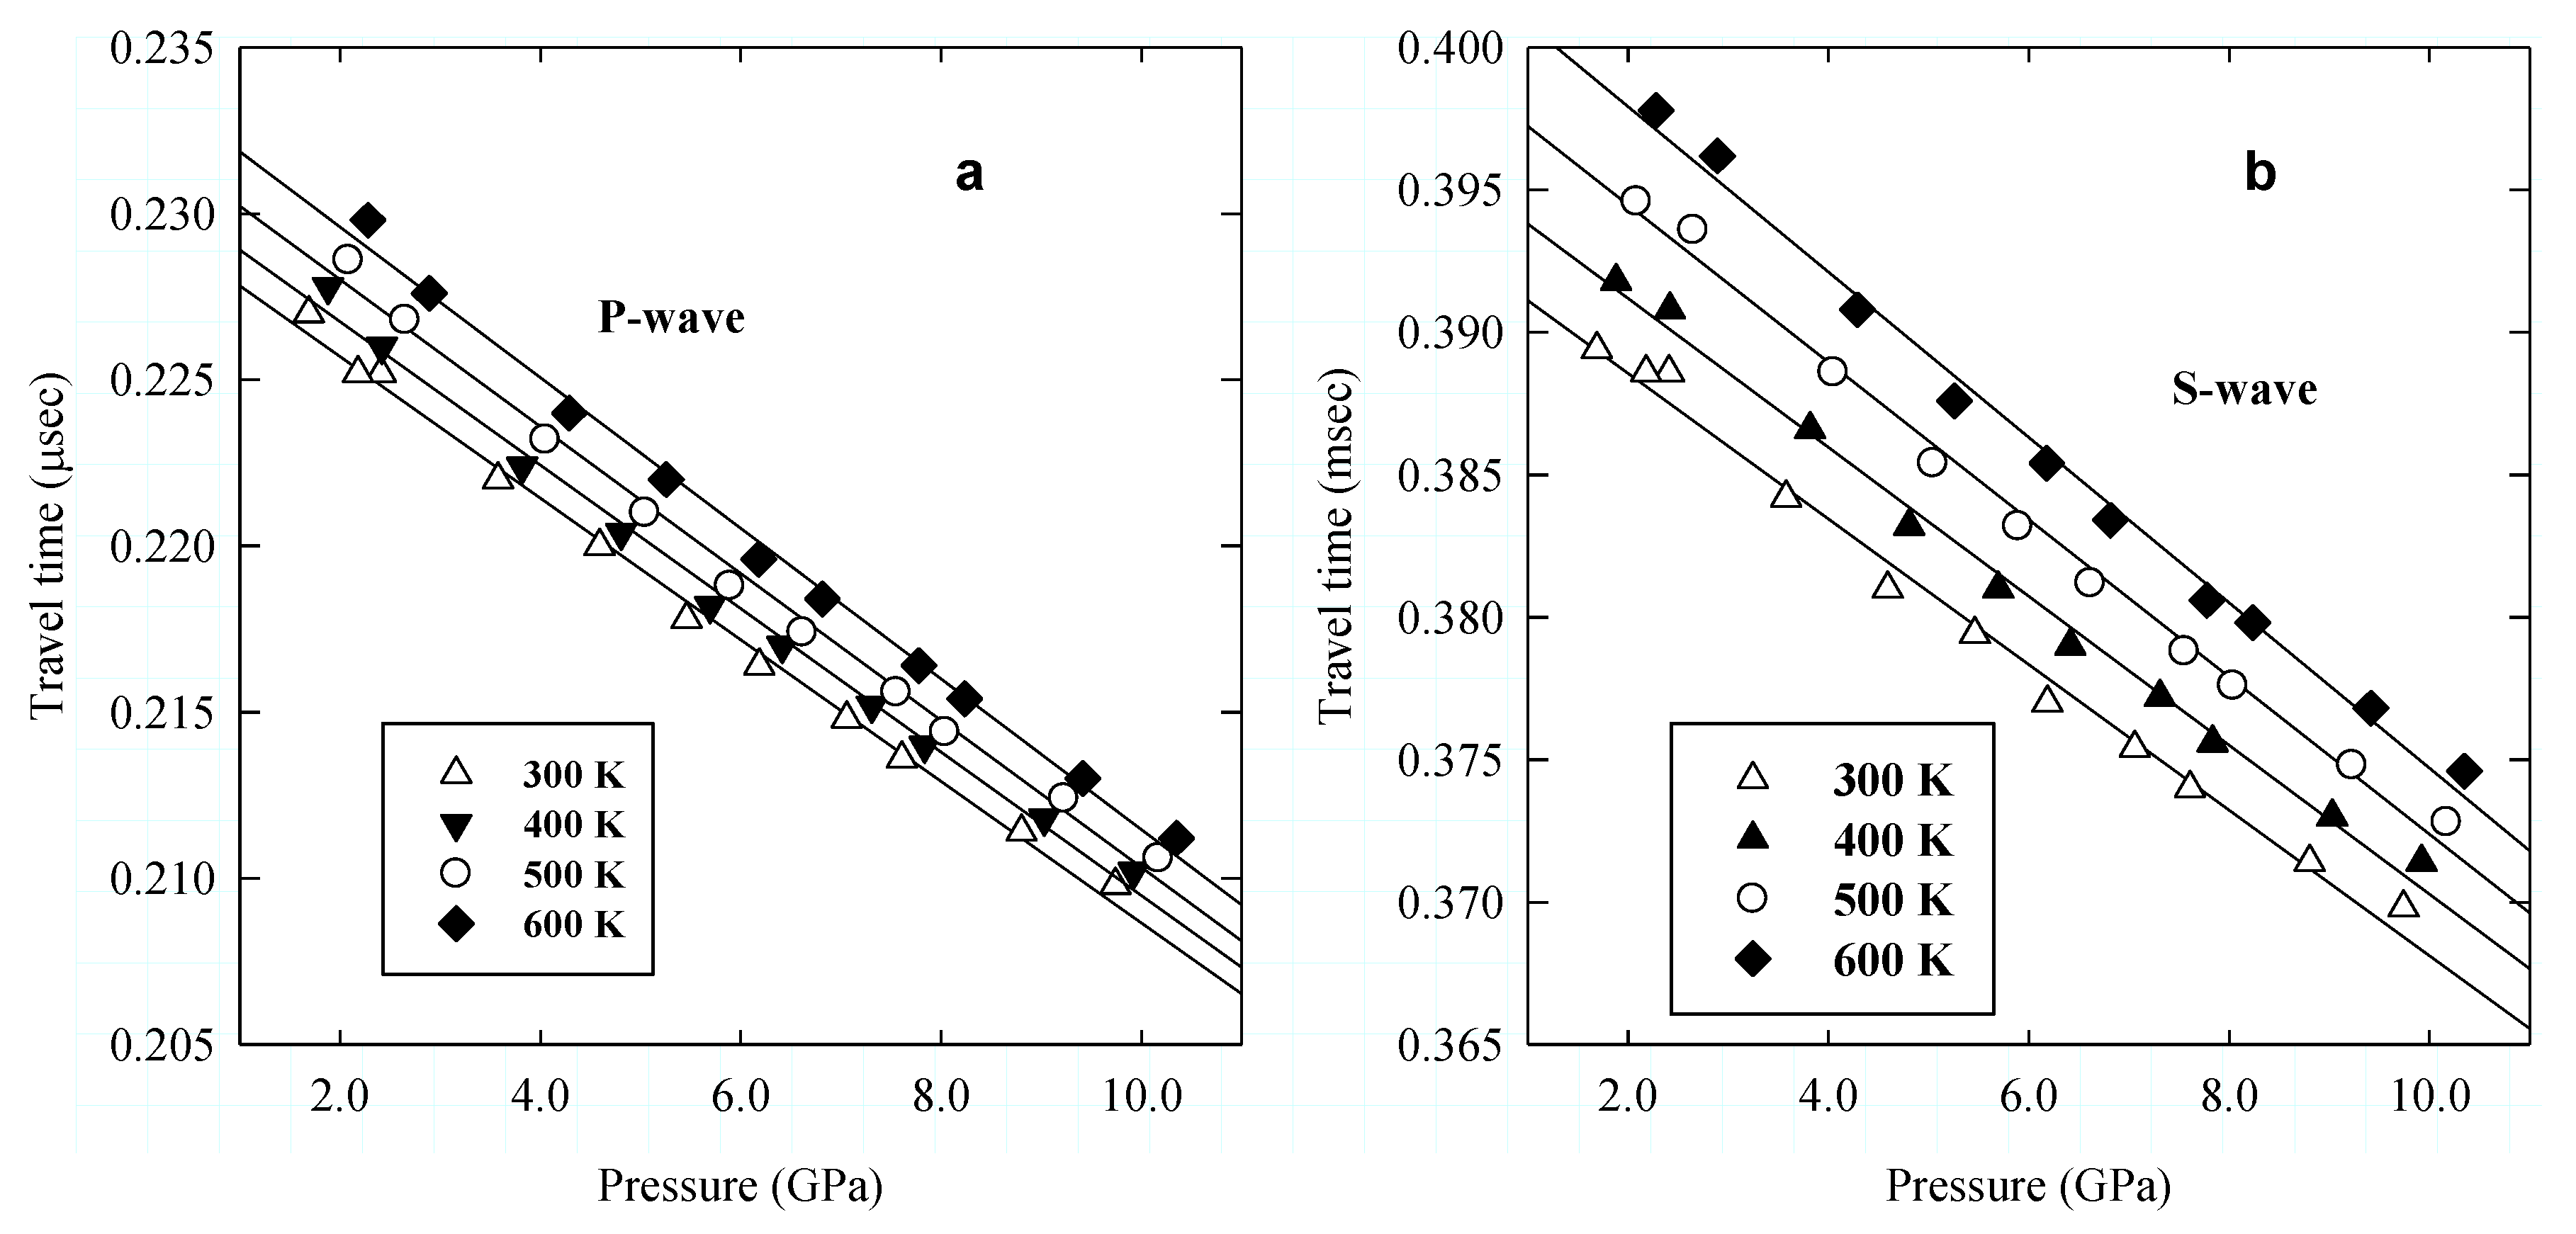
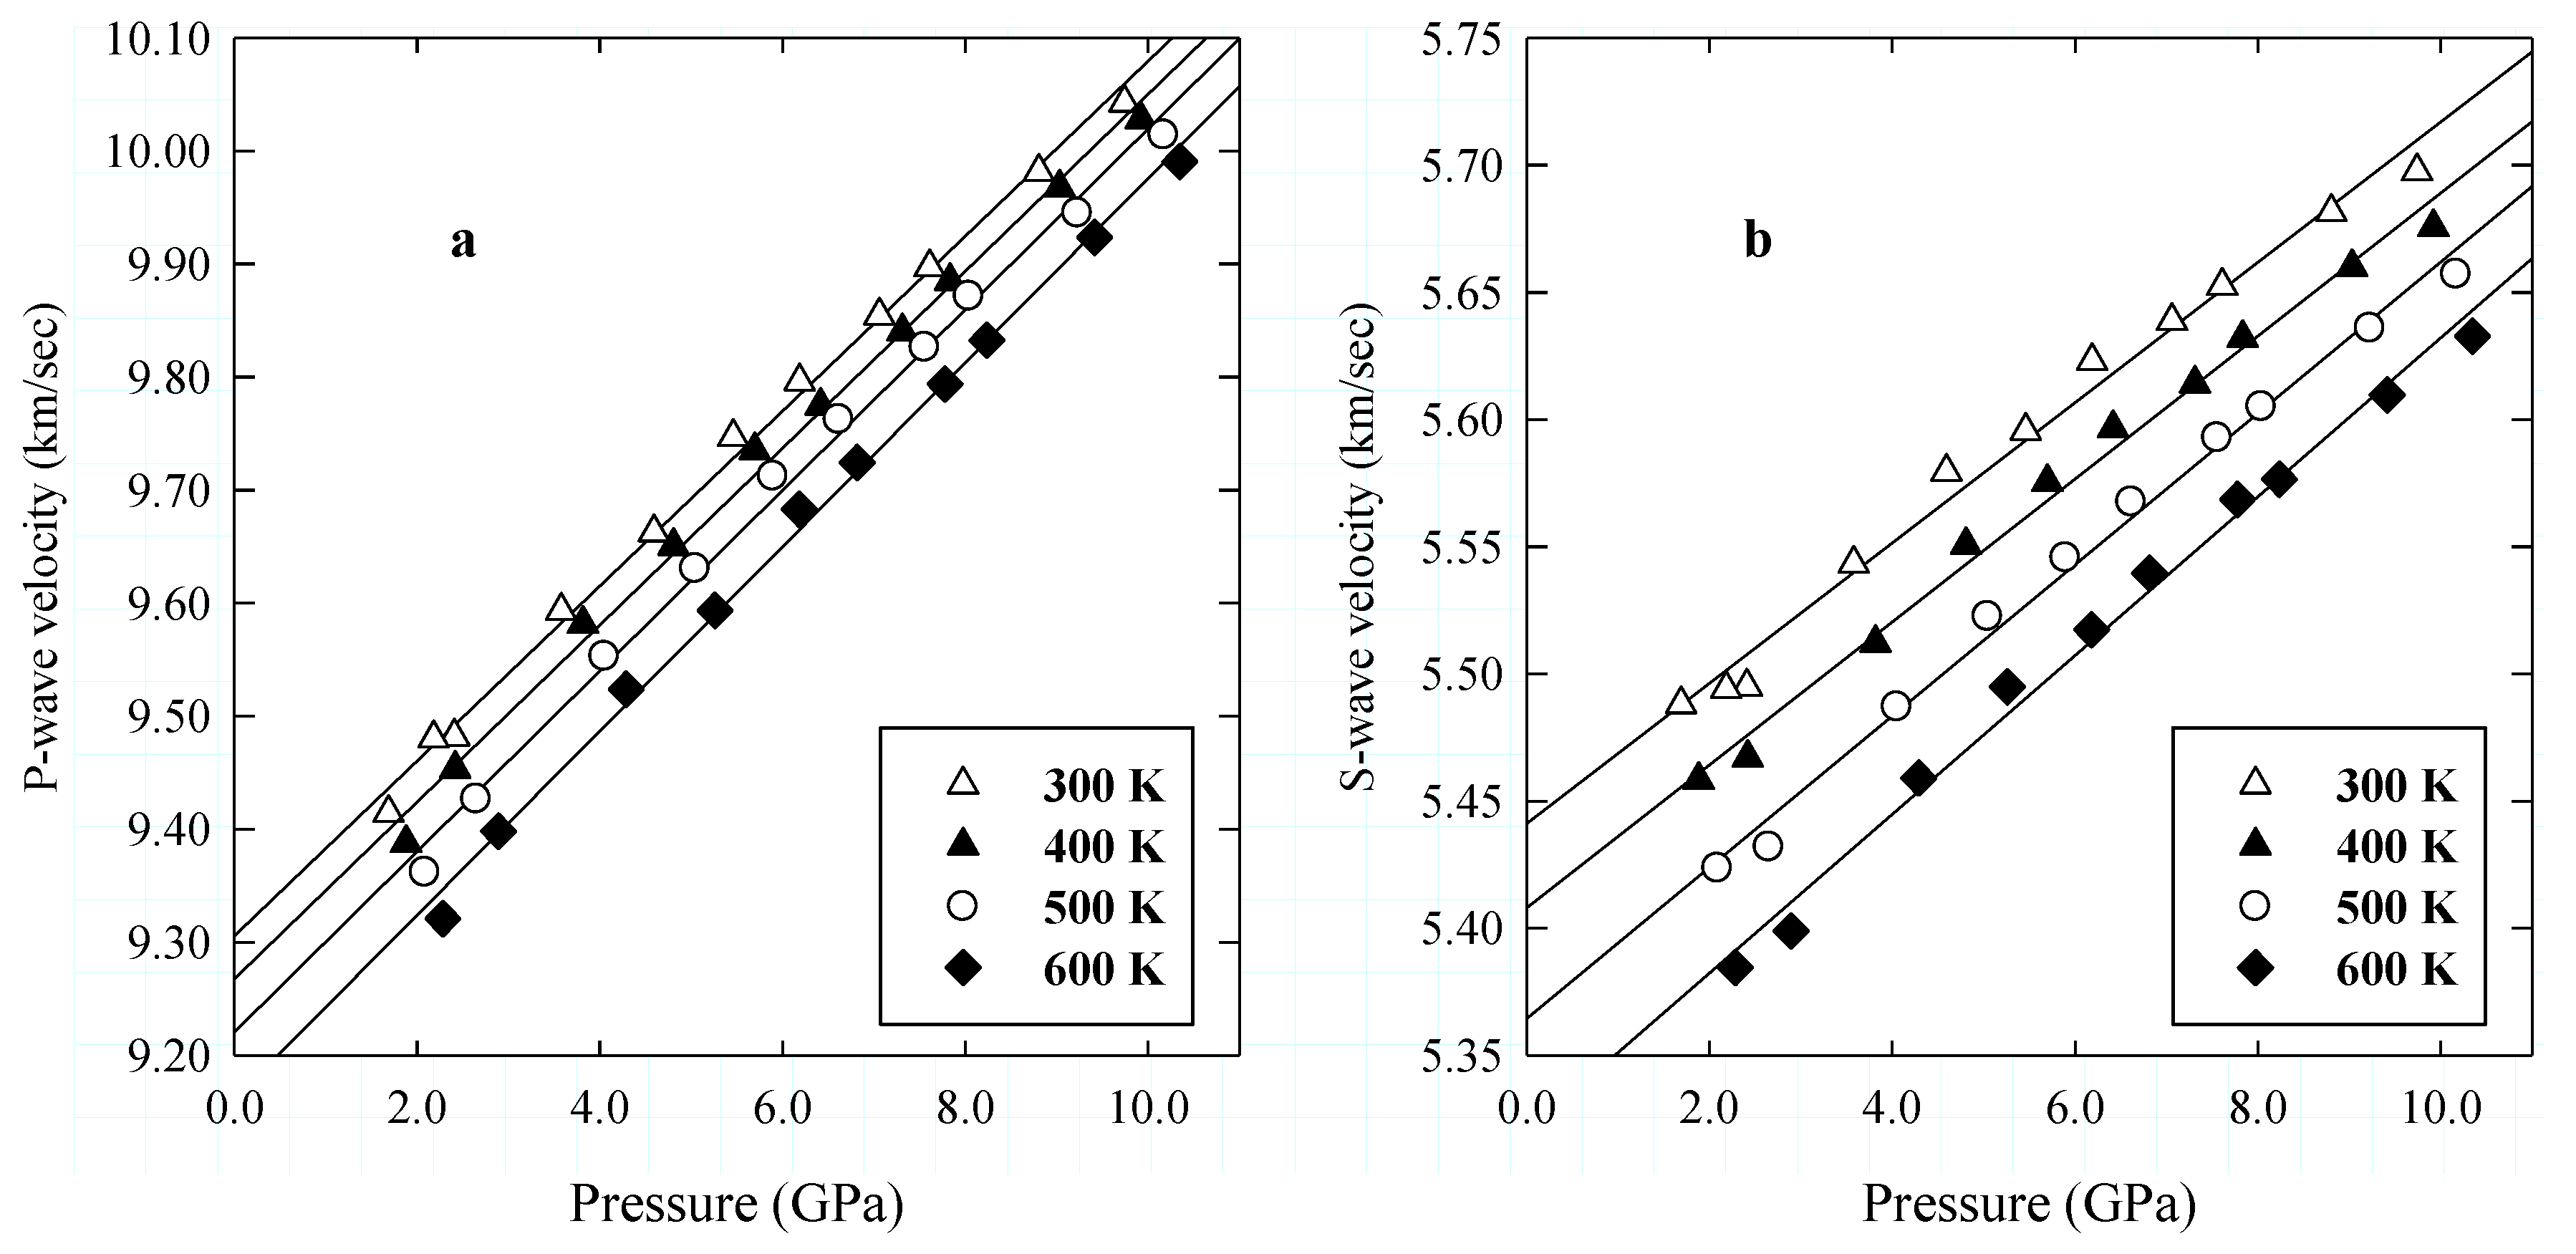
3.1. Data Acquisition and Analysis

We determine the P and S wave travel times by the pulse-echo-overlap (PEO) method [40] with a standard deviation of 0.2 ns (0.2%) and 0.5 ns (0.1%) for the P and S waves, respectively. A correction 1.437 ns and 0.272 ns was applied to all the P and S wave travel times, respectively, for the effect of the 2 µm Au bond between the sample and the buffer rod, using a previously established procedure [48].
The two-way corrected P and S wave travel times are tabulated in Table 1 and plotted as a function of pressure in Figure 5a,b, showing the travel times of both the P and S waves to decrease linearly and steadily with pressure along the isotherms.
The sample chamber for ultrasonic measurements in the cubic anvil DIA-type apparatus is composed of an alumina buffer rod and other cylindrical parts. These components impose axial deviatoric stress in the cell assembly that could cause vertical stress, σ1 to be different from the lateral stress σ2 = σ3, as observed in previous studies [33,41]. Previous ultrasonic experiments in the multi-anvil press with synchrotron radiation [18,19,20,46,47] only measured vertical stress σ1. However, recent replacement of the lateral WC anvil with a sintered diamond has afforded measurement of the lateral stress σ2 = σ3, in addition to the vertical stress. The pressure listed in Table 1 is the weighted average of the three components given by P = (2σ1 + σ3)/3, yielding a more precise pressure than previously possible. The axial stress was generally higher than the lateral stress by up to 0.4 GPa by heating the sample to 600 K. However, the difference diminished linearly with decreasing temperature, and ultimately reversed signs around ambient temperature where the vertical stress became moderately higher than the lateral stress. The analysis shows that while the temperature derivatives of the elastic moduli are sensitive to the stress differences between σ1 and σ2 = σ3, the pressure derivatives of the elastic moduli are only moderately affected by the difference.
The sample volume in Table 1 is also a weighted average of data from the two detectors given by V = (2V1 + V3)/3, where V1 and V2 = V3 is the sample volumes measured by the axial and lateral detectors, respectively.
The sample length was determined from the unit cell volume data using the relation l = lo (V/Vo)1/3, where l and V are the length and weighted unit cell volume, respectively; subscript zero represents ambient values. We observed considerable scatter in the lengths determined from the X-radiographic method, which we ascribed to the relatively small temperature interval (100 K) between measurements. We found changes in successive specimen lengths to be close to the precision (0.2–0.4%) of the ranges determined from the pixels data. In Table 1, we tabulated the specimen pressures calculated using the equation of state of NaCl [49] with a precision of 0.8%. We compute the listed sample densities in Table 1 from the unit-cell parameters from the X-ray data using the relationship ρ = ρo(Vo/V), where ρ and V are density and weighted unit cell volume, respectively; subscript zero represents ambient values.
The travel time data were combined with the lengths to calculate the P and S velocities at high P and T. Uncertainty in the travel time, when combined with uncertainty in specimen length (0.1%), yields uncertainty in the velocity of about 1%. The P and S wave velocities are given in Table 1 and used to calculate the longitudinal L = ρVP = (Ks + 4G/3), shear (G = ρVS2), and bulk (Ks = L − 4G/3) moduli, also listed in Table 1.
We have plotted the P and S wave velocities from this study as a function of pressure (Figure 6a,b), and the elastic moduli Ks and G are also plotted as a function of pressure in Figure 7a,b, respectively. The acoustic velocities, as well as the moduli data, are observed to increase systematically and linearly over the entire pressure range for each isotherm.
For consistency in extrapolating to the high pressures of the transition zone, we fit the shear (G) and compressional (Mp = K + 4G/3) moduli, where K is the bulk modulus to functions of Eulerian strain {ε (ε = [1 − (ρ/ρo)2/3]/2} of the third order:
G = (1 − 2ε)5/2(M1 + M2ε)
Mp = (1 − 2ε)5/2(L1 + L2ε)
The coefficients of the polynomials are related to the bulk (Ks) and shear (Go) moduli and their pressure derivatives at zero pressure as follows:
M1 = Go
M2 = 5Go − 3KsGo
L1 = Ks + (4/3)Go
L2 = 5(Ks + 4Go’/3) − 3Ks(Ks’ + 4Go’/3)
where Ks, and Go, are the elastic moduli and Ks’, and Go’ and their pressure derivatives, respectively. Previous ultrasonic studies have shown that the data collected at the end of the cooling cycles at 300 K (cooled data) are generally under pseudo-hydrostatic conditions due to cell relaxation resulting from heating. By fitting the 300 K data from the cooling cycles to Equations (2) and (3), we obtain Ks = 161.1(4) GPa, Go = 101.6(2) GPa, Ks’ = 4.89(7), Go’ = 1.69(4) and from linear regression of the cooled data, we obtain Ks = 161.6(9) GPa, Go = 101.7(2) GPa, Ks’ = 5.03(1), Go’ = 1.79(4), where numbers in parenthesis represent the fitting uncertainty.
Following the previous procedure [46], we have treated each modulus as a linear function of pressure and temperature by fitting the P-T-KS and P-T-G data sets separately to the linear Equation of the form:
M (P,T) = Mo + (∂M/∂P)T(PPo) + (∂M/∂T)P(TTo)
Where Mo is the ambient pressure and temperature Ks or Go, and (∂M/∂T)P and (∂M/∂P)T are the temperature and pressure derivatives, respectively, of the elastic modulus M. In fitting, we exclude all data acquired before the sample was heated after each pressure increase because the data are likely to have residual stress caused by the cold compression. Fitting the entire P-T-Ks and P-T-G data sets separately to Equation (3) yielded: Ks = 161.1(3) GPa, Go = 101.4(1) GPa, Ks’ = 4.93(4), Go’ = 1.73(2), (∂Ks/∂T)P = −1.5(1) GPaK−1, and (∂G/∂T)P = −1.6(1) GPaK−1. The numbers in parenthesis represent the fitting uncertainty.

3.2. Ambient Elastic Bulk (Ks) and Shear (Go) Moduli

In Table 2, we present the adiabatic bulk (Ks) and shear (Go) moduli and their pressure derivatives (∂Ks/∂P)T, and (∂G/∂P)T, respectively, for the hydrous wadsleyite (β-Mg2SiO4) containing 0.73(7) wt.% H2O and compare the data with those from previous studies of a hydrous β-Mg2SiO4, as well as Mg- and Fe-bearing anhydrous wadsleyite. Data for the anhydrous β-Mg2SiO4 polycrystalline sample measured in this study by the identical procedure are also listed in the table to validate the interferometry method in the DIA-type apparatus used for the measurements and to serve as an internally consistent data set for direct comparison with the hydrous wadsleyite data.
Our Ks and Go data from the four analytical techniques are consistent and in excellent agreement with the mutual uncertainty of the data. We have selected our finite strain results for comparison with previous studies. Our finite strain Ks = 161(5) GPa and Go = 101.6(2) GPa for the hydrated sample are 5.2% and 8.7%, respectively, lower than the corresponding values for anhydrous β-Mg2SiO4 (Table 2) from this study. We observe a comparable reduction in the Ks and Go by comparing the values for the hydrous β-Mg2SiO4 from this study with results from other previous studies for anhydrous wadsleyite [16,18,21,50]. An earlier investigation of the elasticity of a single crystal of wadsleyite (β-Mg2SiO4) containing 0.37–1.66 wt.% H2O by Brillouin spectroscopy [27] observed both Ks and Go to decrease linearly with increasing water content in wadsleyite. The linear relationships given by Equations (4) and (5) of the study [27], correlating the bulk and shear moduli respectively, with water content in wadsleyite predict Ks and Go of 161.4 GPa and 106.0 GPa, respectively, for hydrous β-Mg2SiO4 containing 0.73 wt.% H2O as measured in this study. Whereas our Ks = 161.4 GPa is identical with the predicted value, the Go = 101.4 GPa from this study is 4% smaller than predicted by Equation (5) of the Brillouin scattering study [27]. Our data show a stronger elasticity effect on G compared to Ks caused by the hydration in contrast to Brillouin scattering measurements on single-crystal wadsleyite [27,28] that report a comparable decrease in Ks and G of 7.6% and 7.0%, respectively, by dissolving one weight percent water in wadsleyite.
First principle calculations [51] report that one weight percent of water dissolved in wadsleyite reduces the Ks and G by ~5.6% and ~6%, respectively, which though also comparable, are out of the range of the Brillouin scattering data. The variability in the current data on the effect of wadsleyite hydration on the elasticity is mainly due to uncertainty in the water content measurements, generally around 10% [27,28]. Currently, standard water-content calibrations are available only for the olivine and ringwoodite phases, but not the wadsleyite phase. Resolving the magnitude and the relative contributions of the water effect on Ks and G requires the establishment of a conventional water content calibration for wadsleyite, as wells as systematic measurements of OH-bearing wadsleyite samples.

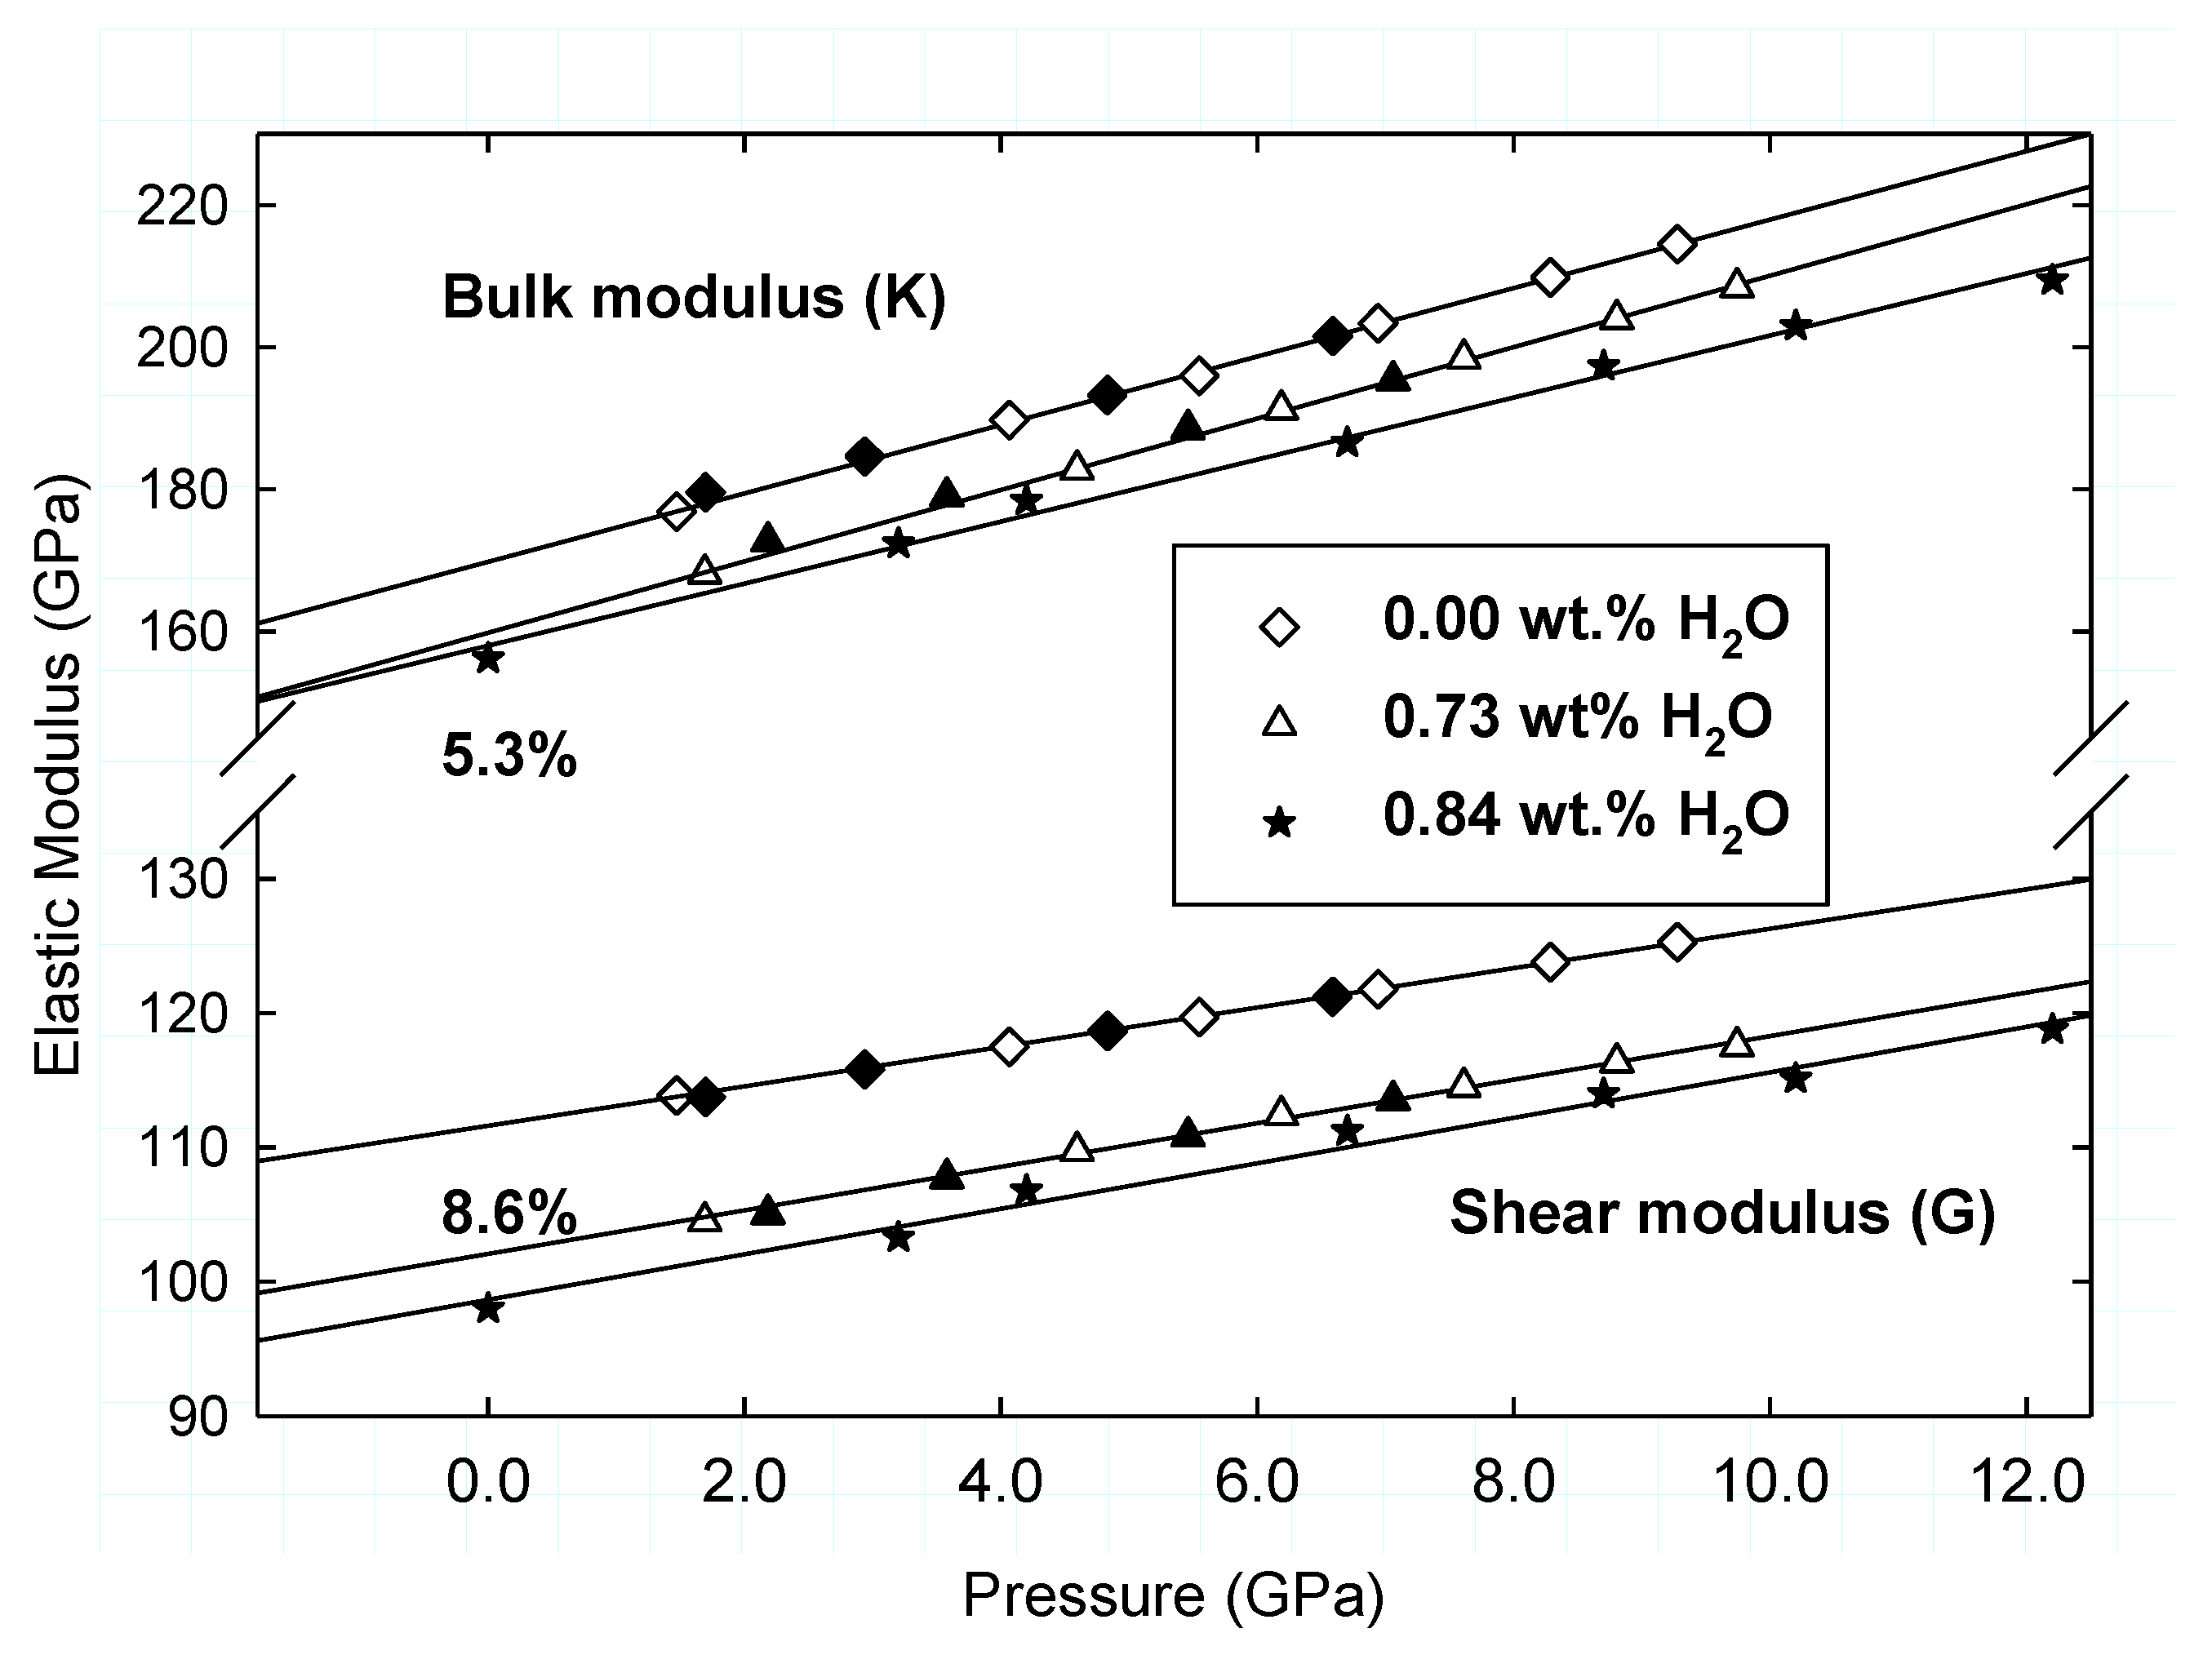
3.3. Pressure Derivatives of Elastic Moduli

As shown in Table 2, the pressure derivative of the adiabatic bulk modulus, Ks’ = 4.84(2) for hydrous β-Mg2SiO4 with 0.73 wt.% H20 is identical to Ks’ = 4.81(2) for our anhydrous β-Mg2SiO4 and also in agreement with previously reported Ks’ = 4.56(23) [19], within the mutual data uncertainties. The wadsleyite specimens used in this study have been hot-pressed by similar techniques and measured at high pressure using similar P and T paths and ultrasonic procedures.
The Ks’ value for the hydrous wadsleyite is moderately higher than previous ultrasonic data for β-Mg2SiO4 (Ks’ = 4.5(1) [16]). The Brillouin Scattering data (Ks’ = 4.3(2)) for single-crystal β-Mg2SiO4 [17] measured to 15 GPa at room T. Our Ks’ is also higher than the aggregate modulus Ks’ = 4.5 from the first principle calculations [51] for β-(Mg0.875Fe0.125)2SiO4) wadsleyite. The Ks’ = 4.1(1) for single-crystal wadsleyite containing 0.84 wt.% H2O measured to 12 GPa at room T by Brillouin spectroscopy [28], and Ks’ = 4.13(8) reported for Fe-bearing single-crystal wadsleyite from Brillouin scattering studies [29] are in excellent agreement, but both are lower than the other published data.
Figure 8 is a plot of the elastic K and G moduli collected at the end of each cooling cycle (300 K) for the hydrous and anhydrous β-Mg2SiO4 as a function pressure. The line is the linear regression of the compression data. The overlap among the compression and decompression data yields a robust pressure dependence of the elastic K and G moduli for each composition. The similarity of the Ks’ and Go’ for the hydrous and the anhydrous β-Mg2SiO4 phases shown in Figure 8 suggests that the pressure derivatives of the elastic moduli are insensitive to the OH content of the wadsleyite, at least up to 0.73 wt.% of the study. For comparison, we also plotted the Brillouin scattering single-crystal measurements carried out to 12 GPa and room T for containing 0.84 wt.% H2O [28]. We note that whereas the Brillouin scattering shear modulus data further validates the insensitivity to the OH content in wadsleyite, the slope of the bulk modulus with pressure (Ks’) is slightly lower than from the current study, as shown in Table 2.
The Go’= 1.55(1) from the current study of anhydrous β-Mg2SiO4 is in excellent agreement within the mutual data uncertainties with previous anhydrous studies Go’ = 1.4(2) [17], Go’ = 1.5(1) by [18] and in reasonable agreement with Go’= 1.4(1) for hydrous wadsleyite containing 0.84 wt.% H2O [28]. Our Go’ is also in close agreement with Go’ = 1.6 for β-(Mg0.875Fe0.125)2SiO4) from first-principle calculations [51]. However, as shown in Table 2, the Go’= 1.68(4) for the hydrous β-Mg2SiO4 containing 0.73 wt.% H2O from this study is marginally higher than the ultrasonic data for anhydrous wadsleyite [16,18,19] and the Brillouin scattering data for anhydrous wadsleyite [17] but in excellent agreement only with Go’ = 1.64(4) from the single-crystal Brillouin scattering measurement of Fe/(Mg + Fe) = 0.112(2) wadsleyite containing 0.2492 wt.% H2O [29].
The investigators of the single-crystal wadsleyite elasticity containing 0.84 wt.% H2O at 12 GPa and room T [28] concluded that Ks’ and Go’ for the hydrous wadsleyite phase is indistinguishable from those of the anhydrous phase, citing the overlap of the Ks’ and Go’ from their study with the anhydrous data [17]. The Ks’ values for the hydrous (0.73 wt.% H2O) and the anhydrous wadsleyite samples (Table 2; also see Figure 8) are identical, and there is also a close agreement between the Go’ for the two compositions. We, therefore, conclude that the pressure derivatives of K and G are independent of the H2O content of wadsleyite (at least up to the 0.73 wt.% of this study). The agreement of the Ks’ and Go’ from this study with Mg and Mg-Fe wadsleyite data from previous studies further strengthens our assumption.

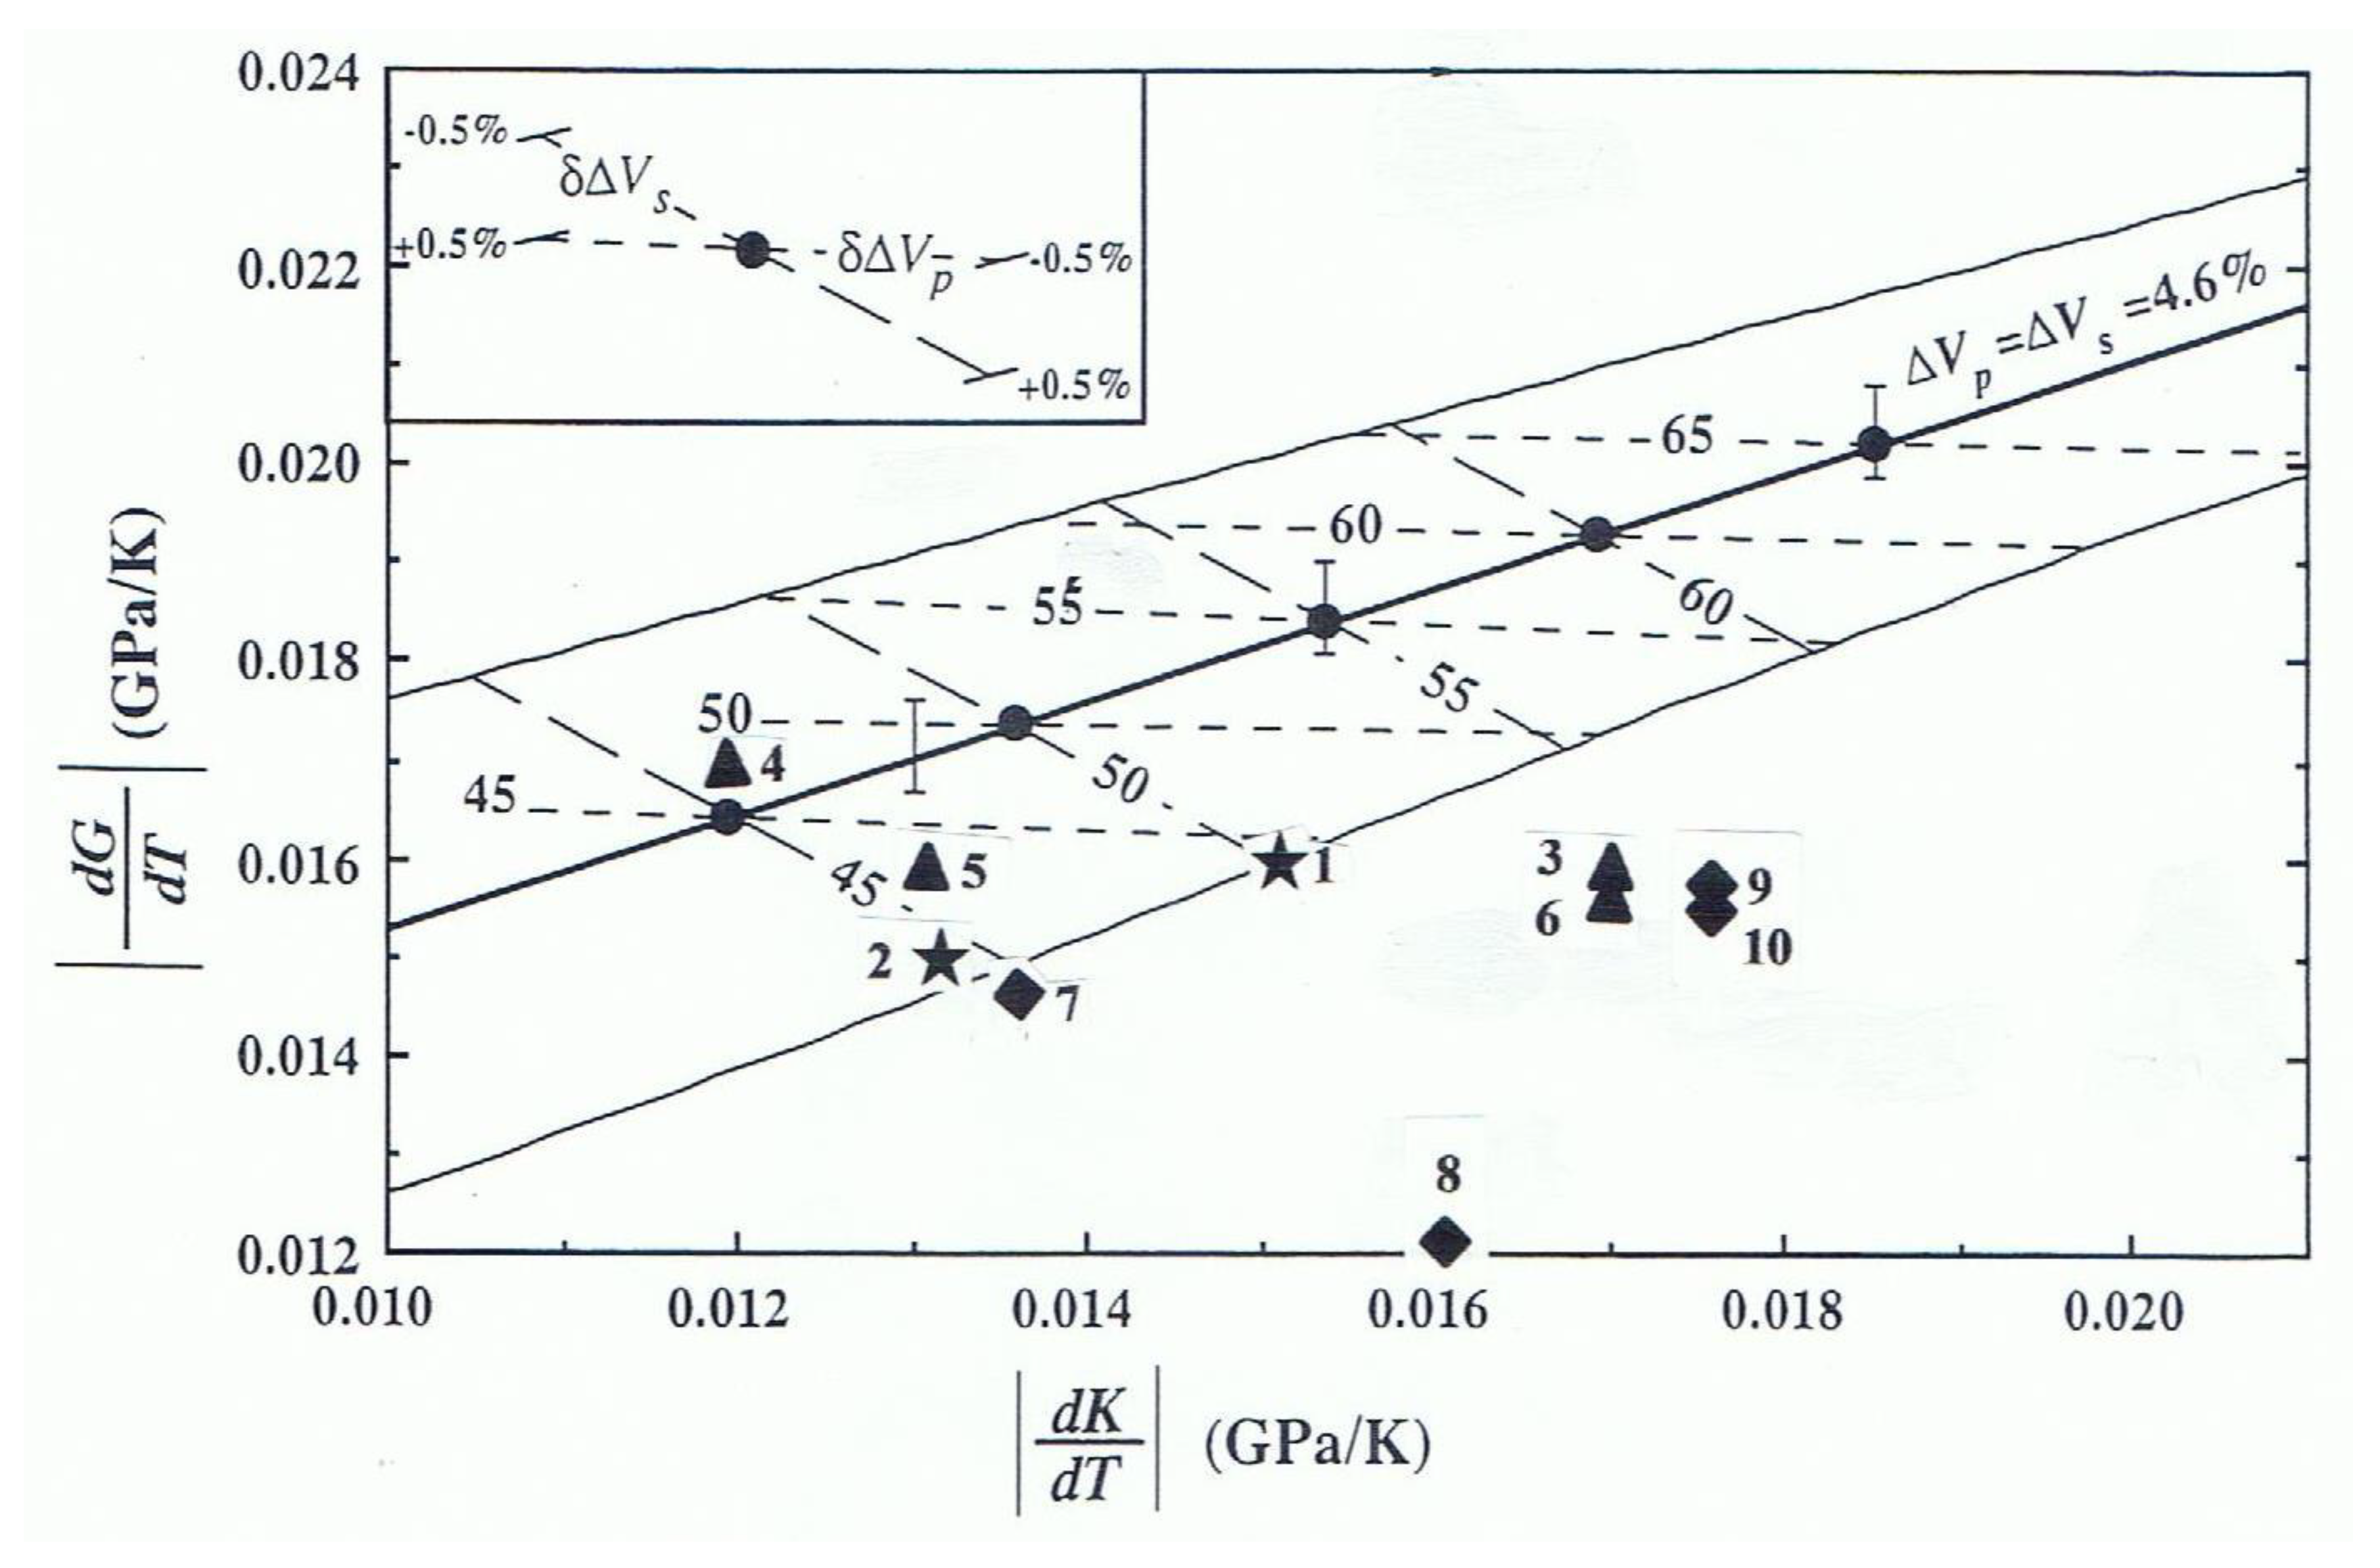
3.4. Temperature Derivatives of Elastic Moduli

We have tabulated values for (∂Ks/∂T)P and (∂G/∂T)P for the hydrous wadsleyite with 0.73(7) wt.% water and the anhydrous β-Mg2SiO4 from this study in Table 2 and compared the results with data from previous studies on the anhydrous Mg and Mg-Fe wadsleyite. As observed in the table, the (∂Ks/∂T)P and (∂G/∂T)P results for the hydrous β-Mg2SiO4 obtained from fitting the entire data set linearly (see Equation (3)) and the third-order finite strain method to all the data is consistent and in good agreement within the mutual uncertainties of the analysis techniques. For consistency, we select the finite strain results for extrapolation to mantle conditions and comparison with previous data.
Our (∂Ks/∂T)P= −1.8(1) × 10−2 GPaK−1 for the anhydrous β-Mg2SiO4 from this study is in excellent agreement with (∂Ks/∂T)P= −1.71(5) × 10−2 GPaK−1 obtained on measurements of anhydrous polycrystalline β-Mg2SiO4 using resonance ultrasound spectroscopy techniques [21]. The data is also in excellent agreement with anhydrous Fe-bearing wadsleyite data [22,23,24]. The current (∂Ks/∂T)P values for anhydrous Mg- and Mg-Fe wadsleyites, including the data for the anhydrous β-Mg2SiO4 from this study, are higher in magnitude than the (∂Ks/∂T)P = −1.3(1) × 10−2 GPaK−1 for our hydrated wadsleyite. The magnitude of the temperature derivative of the adiabatic bulk modulus |(∂Ks/∂T)P| for the anhydrous β-Mg2SiO4 from the current study is 28% greater than for the hydrous β-Mg2SiO4 containing 0.73 wt.% H2O. However, our (∂Ks/∂T)P = −1.3(1) × 10−2 GPaK−1 for the hydrated wadsleyite is in excellent agreement with the ultrasonic (∂Ks/∂T)P = −1.2 × 10⁻² GPaK−1 and (∂Ks/∂T)P = −1.29(7) × 10−2 GPaK−1 for anhydrous β-Mg2SiO4 [18,19], the (∂Ks/∂T)P = −1.35(10) × 10−2 GPaK−1 from ultrasonic measurement of anhydrous Mg(0.83)Fe(0.13) wadsleyite [20].
The (∂G/∂T)P = −1.5(2) × 10−2 GPaK−1 for the hydrous wadsleyite (0.73 wt.% H2O) from the third-order finite strain analysis overlaps within the mutual data uncertainty with the (∂G/∂T)P = −1.7(1) × 10−2 GPaK−1 for the anhydrous β-Mg2SiO4 in this study. Moreover, the current data set is in agreement with the published ultrasonic and resonance ultrasound spectroscopy (∂G/∂T)P measurements for anhydrous β-Mg2SiO4 [18,19,21], and the Fe-bearing wadsleyite [20,22,24] measurements, within the mutual data uncertainties. The resonance spectroscopy results of (∂G/∂T)P = −1.2(1) × 10−2 GPaK−1 for anhydrous Mg(0.91)Fe(0.09) wadsleyite [23] is the only data that falls outside the tight band of all current (∂G/∂T)P measurements. Thus, whereas the effect on ∂Ks/∂T)P due to Fe or OH substitution in wadsleyite is still variable, the effect on (∂G/∂T)P is only minimal.
As observed in Table 2, our (∂Ks/∂T)P and (∂G/∂T)P data sets from the linear fitting and third-order finite strain analysis are consistent, and each shows |(∂G/∂T)P| to be moderately higher than |(∂KS/∂T)P|. We are currently analyzing elasticity data for wadsleyite containing 0.26 wt.%, 0.53 wt.%, and 1.00 wt.% H2O, respectively, and the preliminary results seem to corroborate the current observation of the |(∂G/∂T)P| being higher than |(∂Ks/∂T)P| for the 0.26 wt.% and 0.53 wt.% wadsleyite samples. Only the (∂Ks/∂T)P and (∂G/∂T)P for the 1.00 wt.% H2O wadsleyite shows |(∂Ks/∂T)P| > |(∂G/∂T)P|, as also observed for the anhydrous β-Mg2SiO4 in this study, as well as many previous studies of Mg- and Mg-Fe wadsleyite [21,22,23,24]. The (∂Ks/∂T)P and (∂G/∂T)P of −0.164(5) GPa/K and −0.130(3) GPa/K, respectively, from the ultrasonic measurements of San Carlos olivine to 8 GPa and 1073 K [19] exhibit similar patterns to those of most mantle phases where |(∂Ks/∂T)P| is greater than |(∂G/∂T)P|. Apart from our current data for the hydrous wadsleyite, only two previous ultrasonic high P and T studies on anhydrous β-Mg2SiO4 [18,19] and Mg(0.87)Fe(0.13) wadsleyite [20] also observe |(∂G/∂T)P| to be greater |(∂KS/∂T)P|. It is noteworthy that the anhydrous β-Mg2SiO4 data [18,19] are not two separate studies. Whereas the earlier study [18] used the linear function to fit the data, the latter [19] reanalyzed the data using the finite strain method. A previous study [27] has remarked on the difficulty of synthesizing a nominally anhydrous wadsleyite without a hydroxyl; despite the care taken, the sample still contained at least 50 ppm wt.% H20. The temperature derivative results for the β-Mg2SiO4 [18,19] and the Mg(0.87)Fe(0.13) wadsleyite [20] could reflect minor H2O in the samples if the starting materials were completely dry before the hot-pressing. A detailed examination of the β-Mg2SiO4 and [18,19] and Mg(0.87)Fe(0.13) wadsleyite [20] samples would have been useful in explaining the (∂Ks/∂T)P and (∂G/∂T)P observations of the studies. Nonetheless, based on the current (∂Ks/∂T)P and (∂G/∂T)P data for the hydrous wadsleyite (0.73 wt.% H2O) and the preliminary data for wadsleyite containing 0.26 wt.% and 0.53 wt.%, we infer that the observation showing the bulk modulus ((∂Ks/∂T)P) being affected more than shear modulus ((∂G/∂T)P) by temperature could be an intrinsic structural property of the wadsleyite hydration for relatively small OH content up to 0.73 wt.% H2O and if so, could have important implications for evaluating the orthosilicate content of the Earth’s mantle.
We assumed orthorhombic symmetry in the X-ray analysis of all the wadsleyite specimens of this study. However, some previous studies [52,53] observed a monoclinic distortion of hydrous wadsleyite. The monoclinic distortion is associated with cation vacancy stacking disorder of distinct modules [52] or poly-synthetic twinning [3]. Another study [7] has found only samples with water content greater than 0.5 wt.% to display the monoclinic symmetry. Further studies of the hydrous wadsleyite symmetry and cause would enhance understanding of the temperature derivatives elastic moduli phenomena of wadsleyite observed in this study.
Examination of all current T-derivatives data shows that the effect of Fe substitution or OH incorporation in wadsleyite on (∂G/∂T)P is immeasurable. Previous resonance ultrasound spectroscopy measurements of anhydrous β-Mg2SiO4 [21] concluded that there is no measurable difference in (∂KS/∂T)P and (∂G/∂T)P due to Fe substitution in the anhydrous wadsleyite up to XFe = 0.09 from observation of agreement of reported (∂KS/∂T)P and (∂G/∂T)P for Mg and Mg-Fe wadsleyite [18,19,20,21]. By including our hydrous wadsleyite data, we find the conclusion for (∂G/∂T)P to be strengthened, but less robust for the current (∂KS/∂T)P measurements.
The worldwide 410-km seismic velocity discontinuities in the Earth’s upper mantle are generally attributed to the phase transition of the olivine (α) to the wadsleyite (β) phase. Previous studies have estimated the olivine volume of the mantle by comparing the seismic P and S wave velocity contrasts (∆Vp; ∆Vs) across the 410-km discontinuity caused by the phase change, with the corresponding laboratory velocity contrast between the olivine (α) and wadsleyite (β) phases [15,18,19,20,53].
We have applied our new elasticity data for the hydrous wadsleyite (0.73 wt.% H2O) and adapted the analytical approach of previous studies [18,19,20], to determine the P and S wave velocity contrasts between the α and β phases at the 410-km P and T conditions. We use the third-order finite strain approach of previous studies [18,19,20] to calculate the P and S wave velocities of the hydrous wadsleyite from this study, the anhydrous α-Mg(0.9Fe0.1)2SiO4 [19] and other mantle phases at the 410-km discontinuity. We applied the iron-partitioning data between the α- and the β-phases [54] and performed the calculations to 14 GPa along 1673 K-foot adiabat. We calculated the elasticity of the pyrolite lithology using the Voight-Reuss-Hill (VRH) averaging scheme. In addition to the anhydrous α-Mg(0.9Fe0.1)2SiO4, we also calculate the P and S wave velocities at 14 GPa using the Brillouin scattering elasticity data for hydrous olivine containing 0.8–0.9 wt.% H2O measured at room P and T [55] and room T and 14 GPa [56]. For the calculations, we follow the same approach to correct for the effect of Fe on the elastic bulk (K) and shear (G) moduli and densities of the α and β phases, as reported in the previous ultrasonic analysis [18,19,20] used to evaluate the olivine content of the mantle.
The velocity contrasts from finite strain analysis of the hydrous β-Mg2SiO4 data from this study, and the hydrous α-Mg2SiO4 [55,56] data are ∆Vp(α-β) = 9.88% and ∆VS(α-β) = 8.70%, implying 46–52% olivine volume content for the isochemical Earth’s mantle when compared with the average regional body wave seismic velocity contrasts ∆VP = ∆VS = 4.6% [57,58,59,60]. In contrast, comparing the P and S wave velocity contrasts between our new hydrous wadsleyite and the anhydrous α-Mg(0.9Fe0.1)2SiO4 [19] yields ∆Vp(α-β) = 13.0% and ∆VS(α-β) = 14.70%, corresponding to a significantly lower olivine volume content (39.4–36%) for the mantle. The velocity contrasts for the α-β phase transition investigated using the thermoelasticity data β-Mg(0.885Fe0.13)2SiO4 and α-Mg(0.9Fe0.1)2SiO4 [19] yielded ∆Vp(α-β) = 10.9% and ∆VS(α-β) = 12.2%, indicating that 38–56% olivine to satisfy the seismic discontinuity of 4.9% for the P wave and 4.6% for the S wave. A previous study [55] observes that water incorporation in the olivine decreases the velocity contrast between the olivine and wadsleyite phases at the 410-km depth, causing an increase in the predicted olivine volume content for the mantle.
The range of the velocity contracts across the 410-km discontinuity from body wave studies is 3.8% to 4.9% for P waves and 4% to 5% for S waves [61]. We obtain a higher olivine volume content (50%) for the P wave that is close to the S-wave value (52%) by adopting the seismic velocity contrasts (∆VP = 4.9%; ∆VS = 4.6%) used by Liu and co-workers [20]. A comparison of the derived olivine volume content from the anhydrous α-Mg(0.9Fe0.1)2SiO4 [19] and the hydrous olivine [55,56] underscores the significance of our new data on the T-derivatives of the elastic moduli for the hydrous wadsleyite, as well as the importance of extending the measurements to the hydrous olivine and hydrous ringwoodite phases of (Mg, Fe)2SiO4.
Figure 9 is an adaptation of Figure 3 from the previous ultrasonic measurements of the elastic moduli of β-(Mg)2SiO4 carried in a liquid pressure piston-cylinder apparatus to 3 GPa at room temperature [15]. The figure displays the trade-off of |(∂G/∂T)P| and |(∂KS/∂T)P| for the wadsleyite phase compatible with the orthosilicate content of an iso-chemical mantle model, calculated along a 1575 K-foot adiabat; the pressure dependence of the elastic moduli K’s = 4.8(2) and Go’ = 1.7(1) used in the calculations are identical, within the mutual uncertainties of the data with values for the hydrous β-(Mg)2SiO4, with 0.73 wt.% H2O and the anhydrous β-(Mg)2SiO4 measured in this study. The study assumes that the seismic velocity contrasts ∆Vp = ∆Vs = 4.6% at 410-km in the Earth’s mantle, as reported for regional seismic Earth model studies [57,58,59,60]. The calculations predicted that the values of (∂KS/∂T)P and (∂G/∂T)P of the orthosilicate content for an iso-chemical model mantle would be those with |(∂G/∂T)P| being greater than |(∂KS/∂T)P|. We note that the predicted orthosilicate content is much less sensitive to temperature change than to uncertainties in the seismic velocity contrasts, as shown in Figure 9.
In Figure 9, we plot the data for |(∂G/∂T)P| and |(∂KS/∂T)P| obtained from the finite strain analysis (1) and the linear fit to the entire data set (2) from this study (star). For comparison, we also plot our new data for the anhydrous β-(Mg)2SiO4, (3) as well as high T data for anhydrous Mg- and Mg-Fe-bearing wadsleyite from previous studies [18,19,20,21,22,23,24]. The triangle and the diamonds are the Mg end-member and the Fe-bearing wadsleyite data, respectively. Our two new data sets predict about 45–50% orthosilicate content for the mantle, in excellent agreement with 46–52% from comparing the seismic velocity contrasts (∆Vp = ∆Vs = 4.6%) with the corresponding contrasts between the α and the β phases (∆Vp(α-β) = 9.88%; ∆VS(α-β) = 8.70%) for hydrated α-(Mg)2SiO4 and hydrated β-(Mg)2SiO4 at the 410-km depth obtained from the finite strain analysis. All current high-temperature data on anhydrous Mg and Mg-Fe wadsleyite, including our new β-(Mg)2SiO4, data (3) lead to velocity contrasts with ratio ∆Vp/∆Vs significantly different from unity for which there is no compelling seismological evidence [15].
The two ultrasonic data for anhydrous β-(Mg)2SiO4 [18,19], and anhydrous Mg(0.87)Fe(0.13) wadsleyite [20] also fall within the predicted range of preferred orthosilicate content of the Earth’s mantle. However, as noted above, given that there is no information on the sample characterization used in the study, and given that our anhydrous β-(Mg)2SiO4 data from this study also lie out of the range, we presume that the wadsleyite sample used in the study might have contained some structural water.
Figure 9 shows that the inferred |(∂G/∂T)P| and |(∂KS/∂T)P| values for the wadsleyite phase consistent with the isochemical model mantle are those for which |(∂G/∂T)P| is higher than |(∂KS/∂T)P|. It also indicates that as the temperature derivatives increase along the curve, the inferred olivine volume content of the model mantle also increases from ~40% to 70%. The inferred olivine content is only minimally affected by changing the temperature at the zero-pressure of the appropriate adiabat but strongly influenced by perturbating the seismic relative velocity contrast (∆VP/VP ≠ ∆VS/VS). For a given K and G of the olivine phase, the decrease in K and G of the wadsleyite caused by hydration, as observed in this study, leads to increases in the inferred olivine content of the mantle, while temperature derivatives decrease the content. As noted above, preliminary data for wadsleyite containing 0.26 wt.% and 0.53 wt.% H2O, show |(∂G/∂T)P| to be higher than |(∂Ks/∂T)P|. Additionally, we also observe that the (∂G/∂T)P and (∂KS/∂T)P values move towards higher olivine content with decreasing water OH content in the wadsleyite for constant pressure derivatives of the elastic moduli. Completion of the data analysis on the current OH-wadsleyite samples and any necessary additional elasticity measurements of hydrous wadsleyite could reveal the trend of the mantle olivine content variation with the elastic properties of wadsleyite.

4. Conclusions

We measured the compressional (P) and shear (S) wave velocities for a synthetic polycrystalline wadsleyite containing 0.73 wt.% H2O to 10 GPa and 600 K by ultrasonic interferometry techniques combined with synchrotron X-radiation. The adiabatic bulk (Ks) and shear (G) moduli and their pressure and temperature derivatives are determined using the third-order finite strain Equation of state and also by fitting (Ks) and (G) to linear combinations of pressure and temperature. The results for the elastic bulk (Ks) and shear (G) moduli and their pressure derivatives (Kso = 161.5(2) GPa, Go = 101.6(1) GPa, and (∂Ks/∂P)T = 4.84(4), (∂G/∂P)T = 1.68(2)), from the finite strain analysis are indistinguishable from (Kso = 161.1(3) GPa, Go = 101.4(1) GPa, and (∂Ks/∂P)T = 4.93(4), (∂G/∂P)T = 1.73(2)) from the linear fit. Hydration of wadsleyites by 0.73 wt.% H2O leads to a decrease in the (Ks) and (G) moduli of 5.3% and 8.6%, respectively, but does not significantly affect (∂Ks/∂P)T and (∂G/∂P)T. Previous Brillouin scattering measurements of wadsleyite containing 0.84 wt.% H2O also concluded that (∂Ks/∂P)T and (∂G/∂P)T are independent of the wadsleyite hydration. The temperature derivatives of the (Ks) and (G) moduli from the finite strain and the linear analysis yielded (∂KS/∂T)P = −0.013(2) GPaK−1, (∂G/∂T)P = −0.015(0.4) GPaK−1, and (∂KS/∂T)P = −0.015(1) GPaK−1, (∂G/∂T)P = −0.016(1) GPaK−1, respectively. The two data sets are consistent, and both also reveal the magnitude of the temperature derivative of the shear modulus to be greater than of the bulk modulus {|(∂G/∂T)P| > |(∂K/∂T)P|}, in contrast with data for anhydrous β-Mg2SiO4 from this study, as well as most previous high T studies of anhydrous Mg- and Mg-Fe-bearing wadsleyite. The new observation on (∂KS/∂T)P and (∂G/∂T)P has implications for assessing the olivine volume content of the mantle.
Comparison of the body wave seismic velocity contrasts (∆Vs = ∆VP = 4.6%) with the corresponding contrasts between the hydrous β-Mg2SiO4 phase from this study and the hydrous α-Mg2SiO4 (∆Vp(α-β) = 9.88% and ∆VS(α-β) = 8.70%) calculated for the 410-km depth by third-order finite strain technique yields 46–52% volume content in the Earth’s mantle. However, in comparison, the contrast for the hydrous β-Mg2SiO4 and anhydrous α-Mg(0.9Fe0.1)2SiO4 [19] yields ∆Vp(α-β) = 13.0% and ∆VS(α-β) = 14.70%, corresponding to a significantly lower olivine volume content (39.4–36%) for the mantle. The combined effect of OH and Fe on the high P and T elasticity of the wadsleyite and olivine phases need to be understood to improve the assessment of the olivine volume content of the Earth’s mantle.

Author Contributions

Conceptualization, G.D.G.; Methodology, G.D.G. and M.L.W.; Software, M.L.W.; Validation, G.D.G., M.L.W., and A.J.; Formal Analysis, G.D.G., M.L.W., A.J, L.D., and N.C.; Investigation, G.D.G., M.L.W., R.S.T., L.D., and A.J.; Resources, H.C., R.S.T., and N.C.; Writing—original draft preparation, G.D.G.; Writing—review and editing, G.D.G., N.C., A.J., M.L.W., L.D., H.C., and R.S.T.; Project administration, G.D.G., M.L.W., and H.C. All authors have read and agreed to the published version of the manuscript.

Funding

The National Science Foundation supported this research under grant EAR-1417024 to GDG. Use of the Advanced Photon Source, Argonne National Laboratory, was supported by the U.S. Department of Energy, Office of Science, Office of Basic Research, under contract No. DE-AC02-06CH11357. The use of the 6-BM-B beamline was supported by the Consortium for Materials Properties Research in Earth Sciences (COMPRES) under NSF cooperative agreement No. EAR-01-35554. COMPRES supported the cell assemblies under cooperative agreement No. EAR-1661511.

Acknowledgments

Gabriel Gwanmesia dedicates this manuscript to O.L Anderson, who served as the external member of his Ph.D. committee at Stony Brook University in 1991 when he defended his thesis on the high-pressure elasticity of wadsleyite and ringwoodite, for avocating his work and for the eminent and estimable academic “grandfather” that he exemplified. We thank Jim Quinn, Director of Laboratories, in the Materials Science and Chemical Engineering laboratory at Stony Brook University for the SEM examination of the samples. We thank Baosheng Li for the use of the Stony Brook High-Pressure facility for the sample synthesis. This is Mineral Physics Institute Publication No. 511.

Conflicts of Interest

The authors declare no conflicts of interest.

References

  1. Inoue, T.; Yurimoto, H.; Kudoh, Y. Hydrous modified spinel, Mg1.75SiH0.5O4: A new water reservoir in the mantle transition region. Geophys. Res. Lett. 1995, 22, 117–120. [Google Scholar] [CrossRef]
  2. Kohlstedt, D.L.; Keppler, H.; Rubie, D.C. The solubility of water in α, β, and γ phases of (Mg, Fe)2SiO4. Contrib. Mineral. Petrol. 1996, 123, 345–357. [Google Scholar] [CrossRef]
  3. Kudoh, Y.; Inoue, T. Mg-vacant structural modules and dilution of the symmetry of hydrous wadsleyite, β-Mg2−XSiH2X with 0.00 ≤ X ≤ 0.25. Phys. Chem. Miner. 1999, 28, 232–241. [Google Scholar]
  4. Smyth, J.R. β-Mg2SiO4: A potential host for water in the mantle? Am. Mineral. 1987, 72, 1051–1055. [Google Scholar]
  5. Deon, F.; Koch-Muller, M.; Rhede, D.; Gottschalk, M.; Wirth, R.; Thomas, S.M. Location and quantification of hydroxyl in wadsleyite: New insights. Am. Mineral. 2010, 95, 312–322. [Google Scholar] [CrossRef]
  6. Holl, C.M.; Smyth, J.R.; Jacobsen, S.D.; Frost, D.J. Effects of hydration on the structure and compressibility of wadsleyite, β-(Mg2SiO4). Am. Mineral. 2008, 93, 598–607. [Google Scholar] [CrossRef]
  7. Jacobsen, S.D.; Demouchy, S.; Frost, D.J.; Boffa-Ballaran, T.; Kung, J. A systematic study of OH in hydrous wadsleyite from polarized FTIR spectroscopy and single-crystal X-ray diffraction: Oxygen sites for hydrogen storage in the Earth’s interior. Am. Mineral. 2005, 90, 61–70. [Google Scholar] [CrossRef]
  8. Kudoh, Y.; Inoue, T.; Arashi, H. Structure and crystal chemistry of hydrous wadsleyite, Mg1.75SiHO0.5O4: Possible hydrous magnesium silicate in the mantle transition zone. Phys. Chem. Miner. 1996, 23, 461–469. [Google Scholar] [CrossRef]
  9. Smyth, J.R. A crystallographic model of hydrous wadsleyite (β-Mg2SiO4): An ocean in the Earth’s interior? Am. Mineral. 1994, 79, 1021–1024. [Google Scholar]
  10. Smyth, J.R.; Kawamoto, T. Wadsleyite II: A new high-pressure hydrous phase in the peridotite-H2O system. Earth Planet. Sci. Lett. 1997, 146, E9–E16. [Google Scholar] [CrossRef]
  11. Ye, Y.; Brown, D.A.; Smyth, J.R.; Panero, W.R.; Jacobson, S.D.; Chang, Y.Y. Compressibility and thermal expansion of hydrous ringwoodite with 2,5(3) wt.% H2O. Am. Mineral. 2012, 97, 573–582. [Google Scholar] [CrossRef]
  12. Bercovici, D.; Karato, S. Whole-mantle convection, and the transition zone water filter. Nature 2003, 425, 39–44. [Google Scholar] [CrossRef] [PubMed]
  13. Pearson, D.G.; Brenker, F.E.; Nestola, F.; Mcneill, J.; Nasdala, L.; Hutchison, M.T.; Matveev, S.; Mather, K.; Silversmit, G.; Schmitz, S.; et al. Hydrous mantle transition zone indicated by ringwoodite included within diamond. Nature 2014, 507, 221–224. [Google Scholar] [CrossRef] [PubMed]
  14. Khan, A.; Shankland, T.J. A geophysical perspective on mantle water content and melting: Inverting electromagnetic sounding data using laboratory-based electrical conductivity profiles. Earth Planet. Sci. Lett. 2012, 317, 27–43. [Google Scholar] [CrossRef]
  15. Gwanmesia, G.D.; Rigden, S.; Jackson, I.; Liebermann, R.C. Pressure dependence of elastic wave velocity for β-Mg2SiO4 and the composition of the Earth’s mantle. Science 1990, 250, 794–797. [Google Scholar] [CrossRef] [PubMed]
  16. Li, B.; Gwanmesia, G.D.; Liebermann, R.C. Sound velocities of olivine and beta polymorphs of Mg2SiO4 at Earth’s transition zone pressures. Geophys. Res. Lett. 1996, 23, 2259–2262. [Google Scholar] [CrossRef]
  17. Zha, C.S.; Duffy, T.S.; Mao, H.K.; Downs, R.T.; Hemley, R.J.; Weidner, D.J. Single-crystal elasticity of beta-Mg2SiO4 to the pressure of the 410 km seismic discontinuity in the Earth’s mantle. Earth Planet. Sci. Lett. 1997, 147, E9–E15. [Google Scholar] [CrossRef]
  18. Li, B.; Liebermann, R.C.; Weidner, D.J. P-V-VP-VS-T measurements on wadsleyite to 7 GPa and 873 K: Implications for the 410-km seismic discontinuity. J. Geophys. Res. 2001, 106, 30579–30591. [Google Scholar] [CrossRef]
  19. Liu, W.; Kung, J.; Li, B. Elasticity of San Carlos olivine to 8 GPa and 1073 K. Geophys. Res. Lett. 2005, 32, L16301. [Google Scholar] [CrossRef]
  20. Liu, W.; Kung, J.; Li, B.; Nishiyama, N.; Wang, Y. Elasticity of (Mg0.87Fe0.13)2SiO4 wadsleyite to 12 GPa and 1073 K. Phys. Earth Planet. Int. 2009, 174, 98–104. [Google Scholar] [CrossRef]
  21. Isaak, D.G.; Gwanmesia, G.D.; Falde, D.; Davis, M.G.; Triplett, R.S.; Wang, L. The elastic properties of β- Mg2SiO4 from 295 to 660 K and implications for the composition of the Earth’s upper mantle. Phys. Earth Planet. Int. 2007, 162, 22–31. [Google Scholar] [CrossRef]
  22. Isaak, D.G.; Gwanmesia, G.D.; Davis, M.G.; Stafford, C.S.; Stafford, A.M.; Triplett, R.S. The temperature dependence of Fe-bearing wadsleyite. Phys. Earth Planet. Int. 2010, 182, 107–112. [Google Scholar] [CrossRef]
  23. Katsura, T.; Mayama, N.; Shouno, K.; Sakai, M.; Yoneda, A.; Suzuki, I. Temperature derivatives of the elastic moduli of (Mg0.91Fe0.09)2SiO4 modified spinel. Phys. Earth Planet. Inter. 2001, 124, 163–166. [Google Scholar] [CrossRef]
  24. Mayama, N.; Suzuki, I.; Saito, T. Temperature dependence of elastic moduli of β-(Mg-Fe)2SiO4. Geophys. Res. Letts. 2004, 31, L019247. [Google Scholar] [CrossRef] [Green Version]
  25. Yusa, H.; Inoue, T. Compressibility of hydrous wadsleyite (β-phase) in Mg2SiO4 by high-pressure x-ray diffraction. Geophys. Res. Lett. 1997, 24, 1831–1834. [Google Scholar] [CrossRef]
  26. Yagi, T.; Uchiyama, Y.; Akaogi, M.; Ito, E. Isothermal compression curve of MgSiO3 tetragonal garnet. Phys Earth Planet Int. 1992, 74, 1–7. [Google Scholar] [CrossRef]
  27. Mao, Z.; Jacobsen, S.D.; Jiang, F.; Smyth, J.R.; Holl, C.; Frost, D.J.; Duffy, T.S. Single-crystal elasticity of wadsleyites, β-Mg2SiO4, containing 0.37–1.66 wt.% H2O. Earth Planet. Sci. Lett. 2008, 268, 540–549. [Google Scholar] [CrossRef]
  28. Mao, Z.; Jacobsen, S.D.; Jiang, F.; Smyth, J.R.; Holl, C.M.; Duffy, T.S. Elasticity of hydrous wadsleyite to 12 GPa: Implications for Earth’s transition zone. Geophys. Res. Lett. 2008, 35, L21305. [Google Scholar] [CrossRef]
  29. Buchen, J.; Marquardt, H.; Speziale, S.; Kwazoe, T.; Ballaran, T.B.; Kurnosov, A. High-pressure single-crystal elasticity of wadsleyite and seismic signature of water in the shallow transition zone. Earth Planet. Sci. Lett. 2018, 498, 77–87. [Google Scholar] [CrossRef]
  30. Mao, Z.; Jacobsen, S.D.; Frost, D.J.; McCammon, C.A.; Hauri, E.H.; Duffy, T.S. Effect of Hydration on the single-crystal elasticity of Fe-bearing wadsleyite to 12 GPa. Am. Mineral. 2011, 96, 1606–1612. [Google Scholar] [CrossRef]
  31. Kawai, N.; Endo, S. The generation of ultrahigh hydrostatic pressures by a split-sphere apparatus. Rev. Sci. Instrum. 1970, 41, 1178–1181. [Google Scholar] [CrossRef]
  32. Kawai, N.; Togaya, M.; Onodera, A. A new device for pressure vessels. Proc. Japan Acad. 1973, 49, 623–626. [Google Scholar] [CrossRef] [Green Version]
  33. Weidner, D.J.; Wang, Y.; Vaughan, M.T.; Ko, J.; Liu, X.; Yeganeh-Haeri, A.; Pacalo, R.E.; Zhao, Y. Characterization of stress, pressure, and temperature in SAM-85, a DIA-type high-pressure apparatus. In High-Pressure Research: Application to the Earth and Planetary Sciences; Syono, Y., Manghnani, M.H., Eds.; TERRA PUB, Tokyo/American Geophysical Union: Washington, DC, USA, 1992; pp. 13–17. [Google Scholar]
  34. Gwanmesia, G.D.; Liebermann, R.C.; Guyot, F. Hot-pressing and characterization of polycrystals of β-Mg2SiO4 for acoustic velocity measurements. Geophys. Res. Lett. 1990, 17, 1331–1334. [Google Scholar] [CrossRef]
  35. Gwanmesia, G.D.; Li, B.; Liebermann, R.C. Polycrystals of high-pressure phases of mantle minerals: Hot pressing and characterization of physical properties. In High-pressure Research: Application to Earth and Planetary Sciences; Syono, Y., Manghnani, M., Eds.; American Geophysical Union: Washington, DC, USA, 1992; Volume 117, p. 135. [Google Scholar]
  36. Gwanmesia, G.D.; Li, B.; Liebermann, R.C. Hot-pressing of polycrystals of high-pressure phases of mantle minerals in multi anvil apparatus. PAGEOPH 1993, 141, 467–484. [Google Scholar] [CrossRef]
  37. Dai, L.D.; Hu, H.Y.; Li, H.P.; Wu, L.; Hui, K.S.; Jiang, J.J.; Sun, W.Q. Influence of temperature, pressure, and oxygen fugacity on the electrical conductivity of dry eclogite, and geophysical implications. Geochem. Geophys. Geosyst. 2016, 17, 2394–2407. [Google Scholar] [CrossRef]
  38. Hu, H.Y.; Dai, L.D.; Li, H.P.; Hui, K.S.; Sun, W.Q. Influence of dehydration on the electrical conductivity of epidote and implications for high conductivity anomalies in subduction zones. J. Geophys. Res. 2017, 122, 2751–2762. [Google Scholar] [CrossRef]
  39. Paterson, M.S. The determination of hydroxyl by infrared absorption in quartz, silicate glass, and similar materials. Bull Mineral. 1982, 105, 20–29. [Google Scholar]
  40. Whitaker, M.L.; Baldwin, K.J.; Huebsch, W.R. DIASCoPE: Directly integrated acoustic system combined with pressure experiments- A new method for fast acoustic velocity measurements at high pressure. Rev. Sci. Instr. 2017, 88, 034901. [Google Scholar] [CrossRef]
  41. Weidner, D.J.; Wang, Y.; Vaughan, M.T. Yield strength at high pressure and temperature. Geophys. Res. Lett. 1994, 21, 753–756. [Google Scholar] [CrossRef]
  42. Liebermann, R.C.; Chen, G.; Li, B.; Gwanmesia, G.D.; Chen, J.; Vaughan, M.T.; Weidner, D.J. Sound velocity measurements in oxides and silicates at simultaneous high pressures and temperatures using ultrasonic techniques in multi-anvil apparatus in conjunction with synchrotron X-radiation determination of the equation of state. Rev. High-Press. Sci. Tech. 1998, 7, 75–78. [Google Scholar] [CrossRef]
  43. Li, B.; Chen, K.; Kung, J.; Liebermann, R.C.; Weidner, D.J. Ultrasonic measurement using the transfer function method. J. Phys. Condens. Matter. 2002, 14, 11337–11342. [Google Scholar]
  44. Kung, J.; Li, B.; Weidner, D.J.; Zhang, J.; Liebermann, R.C. Elasticity of (Mg0.83, Fe0.17)O ferropericlase at high pressure: Ultrasonic measurements in conjunction with X-radiation techniques. Earth Planet. Sci. Lett. 2002, 203, 227–566. [Google Scholar] [CrossRef]
  45. Li, B.; Kung, J.; Liebermann, R.C. Modern techniques in measuring elasticity of earth materials at high pressure and high temperature using ultrasonic interferometry in conjunction with synchrotron X-radiation in multi-anvil apparatus. Phys. Earth Planet Inter. 2004, 143–144, 559–574. [Google Scholar] [CrossRef]
  46. Gwanmesia, G.D.; Zhang, J.; Darling, K.; Kung, J.; Li, B.; Wang, L.; Neuville, D.; Liebermann, R.C. Elasticity of polycrystalline pyrope (Mg3Al2Si3O12) to 9 GPa and 1000 °C. Phys. Earth Planet. Int. 2006, 155, 179–190. [Google Scholar] [CrossRef]
  47. Gwanmesia, G.D.; Wang, W.; Heady, A.; Liebermann, R.C. Elasticity and sound velocities of polycrystalline garnet (Ca3Al2Si3O12) at simultaneous high pressures and high temperatures. Phys. Earth Planet. Int. 2014, 228, 80–87. [Google Scholar] [CrossRef]
  48. Niesler, H.; Jackson, I. Pressure derivatives of elastic wave velocities from ultrasonic interferometric measurements on jacketed polycrystals. J. Acoust. Soc. Am. 1989, 86, 1573–1585. [Google Scholar] [CrossRef]
  49. Decker, D.L. High-pressure equation of state for NaCl, KCl, and CsCl. J. Appl. Phys. 1971, 42, 3244–3329. [Google Scholar] [CrossRef] [Green Version]
  50. Sawamoto, H.; Weidner, D.J.; Sasaki, S.; Kumazawa, M. Single-crystal elastic properties of the modified-spinel (beta) phase of magnesium orthosilicate. Science 1984, 224, 749–751. [Google Scholar] [CrossRef]
  51. Nunez-Valdez, M.; Wu, Z.; Yu, Y.G.; Wentzcovitch, R.M. Thermal elasticity of (FexMg1−x)2SiO4 olivine and wadsleyite. Geophys. Res. Lett. 2013, 40, 290–294. [Google Scholar]
  52. Smyth, J.R.; Kawamoto, T.; Jacobsen, S.D.; Swope, R.J.; Hervig, R.J.; Hollway, J.R. Crystal structure of monoclinic hydrous wadsleyite [β-(Mg-Fe)2SiO4]. Am. Mineral. 1997, 82, 270–275. [Google Scholar] [CrossRef]
  53. Duffy, T.S.; Anderson, D.L. Seismic velocities in mantle minerals and the mineralogy of the upper mantle. J. Geophys. Res. 1989, 94, 1895–1912. [Google Scholar] [CrossRef] [Green Version]
  54. Irifune, T.; Isshiki, M. Iron-partitioning in a pyrolite mantle and nature of the 410-km seismic discontinuity. Nature 1998, 92, 702–705. [Google Scholar] [CrossRef]
  55. Jacobsen, S.D.; Jiang, F.; Mao, Z.; Duffy, S.D.; Smyth, J.R.; Holl, C.M.; Frost, D.J. Effects of hydration on the elastic properties of olivine. Geophys. Res. Lett. 2008, 35, L14303. [Google Scholar] [CrossRef]
  56. Mao, Z.; Jacobsen, S.D.; Jiang, F.; Smyth, J.R.; Holl, C.M.; Frost, D.J. Velocity crossover between hydrous and anhydrous forsterite at high pressures. Earth Planet. Sci. Lett. 2010, 293, 250–258. [Google Scholar] [CrossRef]
  57. Walck, M.C. The P-wave upper mantle structure beneath an active spreading center: The Gulf of California. Geophys. J. R. Astr. Soc. 1984, 76, 697–723. [Google Scholar] [CrossRef] [Green Version]
  58. Grand, S.; Helmberger, D. Upper mantle shear structure of North America. Geophys. J. R. Astr. Soc. 1984, 76, 339–438. [Google Scholar] [CrossRef] [Green Version]
  59. Le Fevre, L.V.; Helmberger, D.V. Upper mantle P velocity structure of the Canadian Shield. J Geophys. Res. 1989, 94, 17729–17765. [Google Scholar]
  60. Nolet, G.; Grand, S.P.; Kennett, B.L.N. Seismic heterogeneity in the upper mantle. J. Geophys. Res. 1994, 99, 23753–23766. [Google Scholar] [CrossRef]
  61. Nolet, G.; Wortel, M.J.R. Encyclopedia of Geophysics. James, D.A., Ed.; Van Nostrand Reinhold: New York, NY, USA, 1989; p. 775. [Google Scholar]
Figure 1. Scanning electron microscopy (SEM) micrographs of the cracked (a) and polished (b) surface of the hydrous β-Mg2SiO4 specimens. The average grain size of the specimen is about 2–5 μm.
Minerals 10 00209 g001
Figure 2. Fourier Transform Infrared (FTIR) absorption spectra for the hydrous β-Mg2SiO4 polycrystalline sample taken before and after the high P and T ultrasonic studies.
Minerals 10 00209 g002
Figure 3. Comparison of X-ray diffraction patterns for the hydrous wadsleyite taken at ambient conditions (open press) before and after the high P and T ultrasonic experiments.
Minerals 10 00209 g003
Figure 4. Pressure-temperature (P-T) path for the compression and decompression cycles, and the heating and data acquisition points in the ultrasonic experiments.
Minerals 10 00209 g004
Figure 5. Travel times of acoustic compressional (P) (a) and shear (S) (b) wave velocities as a function of pressure. Lines are linear regression to the data along the experimental isotherms.
Minerals 10 00209 g005
Figure 6. Elastic compressional (P) (a) and shear (S) (b) wave velocities as a function of pressure. The line is a linear regression to the data along the experimental isotherm.
Minerals 10 00209 g006
Figure 7. Elastic bulk (K) (a), and shear (G) (b) moduli as a function of pressure. The line is a linear regression to the data along the experimental isotherm.
Minerals 10 00209 g007
Figure 8. Elastic bulk (K) and shear (G) moduli at 300 K for hydrous (triangle) and anhydrous (diamond) β-Mg2SiO4 as a function of pressure. Open and filled symbols are data acquired on compression and decompression, respectively. Lines are linear fit to the compression data. Stars are Brillouin scattering single-crystal data [27]. Indicated are 5.3% and 8.6% decreases in Ks and Go, respectively, due to hydration of wadsleyite by 0.73%.
Minerals 10 00209 g008
Figure 9. Absolute temperature derivatives for the elastic bulk (K) and shear (G) moduli for Mg2SiO4 and (Mg, Fe)2SiO4 wadsleyite and inferred composition (orthosilicate content) of the mantle adapted from Figure 3 [15]. The heavy solid line represents calculations at a potential temperature of 1300 °C with a seismic velocity contrast for both P and S waves of 4.6% at the 410 km discontinuity. Vertical bars show the effect of changing the temperature by ±100 °C. The outlying solid lines represent the effect of a ±0.5% change in ∆VP or ∆VS, as indicated in the insert. The lines labeled orthosilicate content (percent) correspond to (δ∆VP) = ±0.5% at constant ∆VS (lines with short dashes with slope ~ 0) and to (δ∆VS) = ±0.5% at constant ∆VP (lines with long dashes with slope ~−3/4). Also shown are measured values of these parameters; star, from this study, for hydrous β-(Mg)2SiO4, (0.73 wt.% H2O); 1. the linear fit results to data (Equation (3)); 2. The finite strain result; triangle, anhydrous β-Mg2SiO4; 3. from this study; 4. [18]; 5. [19]; 6. [21]; diamond, anhydrous (Mg,Fe)2SiO4, 7. [20]; 8. [23]; 9. [24]; 10. [22].
Minerals 10 00209 g009
Table 1. Experimental ultrasonic and P-V-T data for hydrous wadsleyite from this study. Two- way travel times have 1σ of 0.2 ns (0.2%) for the P and 0.5 ns (0.1%) S waves. The uncertainties are length (0.1%), velocities about 1%, less than 1.5% in the derived moduli. Vo = 538.6 (2) and lo = 1072 mm.
P
(GPa)
T
(K)
V
3)
L
(mm)
ρ
(g/cc)
Tp
(µsec)
Ts
(µsec)
Vp
(km/s)
Vs
(km/s
L
(GPa)
K
(GPa)
G
(GPa)
0.01299538.61.0723.436
2.41299532.11.0683.4780.22520.38869.485.49312.7172.7105.0
2.28601537.01.0713.4460.22980.39789.325.38299.4166.299.9
2.09500535.71.0703.4550.22860.39469.365.42302.8167.3101.6
1.88400534.51.0693.4620.22780.39189.395.46305.1167.6103.2
1.69301533.41.0693.4700.22700.38949.415.49307.5168.2104.5
5.26600528.01.0653.5050.22200.38769.595.49322.6181.5105.8
5.04500526.91.0643.5120.22100.38549.635.52325.8182.9107.1
4.81400525.91.0643.5190.22040.38329.655.55327.7183.2108.4
4.59301525.01.0633.5250.22000.38109.665.58329.1182.8109.7
6.82600523.61.0623.5350.21840.38349.725.54334.3189.6108.5
6.61501522.51.0613.5420.21740.38129.765.57337.6191.2109.8
6.42400521.51.0613.5480.21700.37909.775.60339.0190.8111.1
6.19302520.61.0603.5550.21640.37709.805.62341.1191.3112.4
8.24601519.21.0593.5640.21540.37989.835.58344.6196.8110.8
8.04500518.11.0583.5720.21440.37769.875.61348.1198.4112.2
7.84398517.31.0583.5770.21400.37569.885.63349.6198.3113.5
7.61302516.41.0573.5840.21360.37409.905.65351.1198.4114.5
9.41601516.11.0573.5860.21300.37689.925.61353.1202.7112.8
9.23500515.11.0563.5930.21240.37489.955.64355.3203.2114.1
9.03401514.21.0563.5990.21180.37309.975.66357.6203.8115.3
8.80302513.51.0553.6040.21140.37149.985.68359.1204.0116.3
10.35601513.41.0553.6050.21120.37469.995.63359.8207.3114.4
10.17500512.71.0543.6100.21060.372810.015.66362.0208.0115.5
9.92400511.91.0543.6150.21020.371410.035.68363.6208.3116.5
9.74302511.21.0533.6200.20980.369810.045.70365.1208.4117.5
7.78601520.31.0603.5570.21640.38069.795.57341.2194.1110.3
7.55501519.71.0593.5610.21560.37889.835.59343.9195.3111.4
7.31401519.01.0593.5660.21520.37729.845.61345.3195.4112.4
7.06301518.31.0583.5700.21480.37549.855.64346.7195.4113.5
6.18601525.41.0633.5220.21960.38549.685.52330.2187.3107.2
5.89500524.51.0633.5290.21880.38329.715.55332.9188.2108.5
5.70400523.81.0623.5330.21820.38109.745.58334.8188.4109.8
5.46302522.91.0613.5390.21780.37949.755.60336.3188.5110.8
4.29591530.61.0673.4880.22400.39089.525.46316.3177.8103.9
4.05500529.81.0663.4930.22320.38869.555.49318.8178.6105.2
3.82401528.91.0653.4990.22240.38669.585.51321.3179.5106.3
3.58302527.91.0653.5060.22200.38429.595.54322.6179.0107.7
2.89600534.91.0703.4600.22760.39629.405.40305.6171.1100.9
2.65500534.11.0693.4650.22680.39369.435.43307.9171.6102.2
2.42400533.01.0683.4720.22600.39089.455.47310.3171.9103.8
2.18300531.81.0673.4800.22520.38869.485.49312.7172.7105.0
−0.14300538.91.0723.434
Table 2. Thermo-elastic properties of hydrous wadsleyite (0.73 wt.% H2O). a: Linear fit of entire data set to M (P,T) = Mo + (∂M/∂P)T(P − Po) + (∂M/∂T)P(T − To): M = Elastic modulus (K or G); b: third-order finite strain fit to entire data set; c: third-order finite strain fit to data set at the end of cooling cycles; d: linear regression of data set at the end of the cooling cycles. (1) This study. UI—ultrasonic interferometry; BS—Brillouin scattering; RUS—resonance ultrasound spectroscopy; RS—resonance sphere technique.
OH Content
wt.%
KSo
(GPa)
G
(GPa)
(∂Ks/∂P)T(∂G/∂P)T(∂KS/∂T)P×10−2
GPaK−1
(∂G/∂T)P×10−2
GPaK−1
MethodRef.
β-(Mg)2SiO4
0.73161.1(3) a
161.5(2) b
161.1(4)
161.6(9)
101.4(1) a
101.6 (2) b
101.6(2)
101.7(2)
4.93(4) a
4.84(2) b
4.89(7) c
5.03(1) d
1.73 (2) a
1.68(4) b
1.69(4) c
1.79(4) d
−1.5(1) a
−1.3(1) b
 
 
−1.6(1) a
−1.5(2) b
 
 
UI[1]
0.84160.3(7)105.3(6)4.1(1)1.4(1) BS[28]
0.00170.6(2) a
170.3(2) b
111.5(1) a
111.3(1) b
4.76(3) a
4.81(3) b
1.53(1) a
1.55(1) b
−1.7(1) a
−1.8(1) b
−1.60(3) a
−1.7(1) b
UI[1]
0.00170(2)115(2)4.3(2)1.4(2) BS[17]
0.00170(2)108(1)4.5(1)1.6(1) UI[16]
0.00173(1)113(1)4.2(1)1.5(1)−1.2(1)−1.7(1)UI[18]
0.00170.7(11)111.6(5)4.56(23)1.75(9)−1.29(7)−1.58(10)UI[19]
0.00170.2(19)113.9(7) −1.71(5)−1.57(3)RUS[21]
β-(Mg/Fe)2SiO4
Mg(0.87)Fe(0.13)175.4(7)108.0(4)4.11(11)1.56(5)−1.35(10)−1.44(8)UI[20]
Mg(0.91)Fe(0.09)165.70105.66 −1.6(3)−1.2(1)RS[23]
Mg(0.91)Fe(0.09)165.72(6)105.43(1) −1.75(3)−1.59(1)RUS[24]
Mg(0.92)Fe(0.08)170.8(1.2)108.9(4) −1.75(7)−1.55(6)RUS[22]

