Article

Spectroscopic and Crystal-Chemical Features of Sodalite-Group Minerals from Gem Lazurite Deposits

by
Nikita V. Chukanov
1,2,*,
Anatoly N. Sapozhnikov
3,
Roman Yu. Shendrik
3,
Marina F. Vigasina
2 and
Ralf Steudel
4
1
Institute of Problems of Chemical Physics, Russian Academy of Sciences, Chernogolovka, 142432 Moscow, Russia
2
Faculty of Geology, Moscow State University, Vorobievy Gory, 119991 Moscow, Russia
3
Vinogradov Institute of Geochemistry, Siberian Branch of Russian Academy of Sciences, 1a Favorskii St., 664033 Irkutsk, Russia
4
Institute of Chemistry, Technical University Berlin, D-10623 Berlin, Germany
*
Author to whom correspondence should be addressed.
Minerals 2020, 10(11), 1042; https://doi.org/10.3390/min10111042
Submission received: 5 November 2020 / Revised: 19 November 2020 / Accepted: 20 November 2020 / Published: 23 November 2020
(This article belongs to the Special Issue Vibrational (Infrared and Raman) Spectroscopy of Minerals)

Abstract

:
Five samples of differently colored sodalite-group minerals from gem lazurite deposits were studied by means of electron microprobe and wet chemical analyses, infrared, Raman, electron spin resonance (ESR) and UV-Visible spectroscopy, and X-ray diffraction. Various extra-framework components (SO42−, S2− and Cl anions, S3•−, S2•− and SO3•− radical anions, H2O, CO2, COS, cis- as well as trans- or gauche-S4 neutral molecules have been identified. It is shown that S3•− and S4 are the main blue and purple chromophores, respectively, whereas the S2•− yellow chromophore and SO3•− blue chromophore play a subordinate role. X-ray diffraction patterns of all samples of sodalite-group minerals from lazurite deposits studied in this work contain superstructure reflections which indicate different kinds of incommensurate modulation of the structures.

1. Introduction

The crystal structures of sodalite-group minerals and related compounds are based on the aluminosilicate framework (AlxSi1-xO2)x– built by alternating layers of six-membered rings of (Si,Al)O4 tetrahedra around the 3-fold axes, [0 0 z], [1/3 2/3 z], and [2/3 1/3 z] and hosting large cavities (so-called β-cages). The crystal-chemical diversity of these compounds is determined by the contents of extra-framework components including alkali and alkaline-earth cations (mainly, Na+, K+, Ca2+), additional anions and radical anions (Cl, F, OH, SO42−, S2−, S2•−, S3•−, SO4•−, NO3, CO32−, HCOO, AlF63–, etc.), and neutral molecules (H2O, CO2, Sn), as well as different kinds of framework distortions and modulations [1,2,3,4,5,6,7,8,9,10,11,12,13,14,15,16].
Metasomatic rocks enriched in blue sodalite-group minerals are used as a decorative stone with the general name “lapis lazuli” or “lazurite”. The latter name is also applied to minerals of the sodalite group containing sulfide sulfur.
Sodalite-group minerals from gem lazurite deposits have metasomatic origin and formed at temperatures below 600 °C [17]. The oldest Sar-e Sang deposit was discovered in ancient times in the Koksha valley, Badakhshan, Afghanistan, and now Afghan lapis lazuli is considered the best in the world. Its color varies from light blue and turquoise to deep blue and blue–violet. The most expensive stone is bright blue with a violet tint.
At present, five cubic sodalite-group aluminosilicates are distinguished. Their simplified general formula is A8[(Si,Al)12O24]X2–8 where A = Na+, Ca2+, K+; X = OH, Cl, F, SO42−, CO32−, H2O, CO2, and sulfide species. These minerals differ in the composition of the predominant extra-framework components at the A and X sites: Ca2+ and OH in bicchulite, Na+ and SO42 in haüyne, Na+ and SO42 + H2O in nosean, Na+ and Cl in sodalite, and a sulfide species in lazurite.
There are still discrepancies in the treatment of the nature of lazurite as a mineral species in different sources. The idealized formula of this mineral given in the list of minerals of the International Mineralogical Association [18] is Na3Ca(Si3Al3)O12S. According to the charge-balance requirement, sulfur in this formula corresponds to the S2− anion, which is not a blue chromophore. Based on chemical, structural and spectroscopic data of different samples, the following alternative simplified formulae of lazurite and lazurite-related minerals have been suggested: (Na,Ca)7-8[Al6Si6O24](SO4,S,Cl)2·H2O [19], (Na,Ca)8[Al6Si6O24](SO4,S)2 [20], Na8(Si6Al6O24)S2−·nH2O and Na7[Al6Si6O24]S3•−·H2O [21], and Na7Ca[Al6Si6O24](SO4)(S3•−)·H2O [8].
These examples show that there are significant variations of the contents of main extra-framework cations (Na+ and Ca2+), anionic species (SO42−, S2−, and S3•−), and water molecules in different samples treated as lazurite. Moreover, these minerals contain variable amounts of K+ [up to 0.26 cations per formula unit (pfu)] and CO2 molecules (up to 0.46 molecules pfu) [19,20,21]. Thus, the existence of a lazurite-related mineral with species-defining CO2 is not excluded.
Relative contents of sulfate and sulfide sulfur as well as contents of Ca and H2O in sodalite-group minerals from lazurite deposits of metasomatic origin vary in wide ranges, most samples being intermediate members of the haüyne–lazurite–nosean solid-solution system [17]. Typical haüyne contains about two Ca2+ cations pfu whereas in sulfide-rich lazurite samples Ca2+ content is usually below 1 pfu.
It is widely accepted that the blue color of lazurite is related to the presence of the trisulfide radical anion S3•− [20,22,23,24,25,26,27,28,29]. Even trace content of this chromophore may result in deep blue color of a sodalite-group mineral. Electronic transition in the visible region corresponds to an absorption maximum of S3•− in the range of 595–620 nm [28,30]. On the other hand, it was reported that there is a positive correlation between the intensity of a broad band with a maximum at about 600 nm and the concentration of another blue chromophore, SO3•− radical anion [24].
Planar cis- and trans-conformers of the chain-like tetrasulfide molecule which are the most stable forms of S4 absorb in the range of 500–590 nm and at ~625 nm, respectively, which corresponds to purple-red and blue-green color, respectively [31] (the latter value is theoretical one). Intermediate (gauche) conformer of S4 is instable in the gas phase, but this conformation could be realized in the sodalite cage as a result of steric hindrances. Based on density functional studies, absorption maxima at about 705 and 495 nm were predicted for gauche-S4 [32]. Red color can be also due to the presence of the stable cis-conformer of the planar S4•− radical anion [32]. Yellow, pale yellow, and orange colors may be related to S2•−, S22− and Sn2− (n > 2), respectively [28,30], whereas green color may be due to the simultaneous presence pairs of radical anions, S2•− and S3•−, or S2•− and SO4•− radical anion [30].
Vibrational (infrared and Raman) spectroscopy has proven to be an effective tool with which most anionic and neutral extra-framework groups in minerals of the sodalite group can be identified [21,28,30,31,32]. In particular, high-level methods of quantum chemistry have been applied to the calculation of spectroscopic parameters of the isolated S4 and S4•− species as well as tetrasulfur chromophores entrapped in sodalite cages [32]. The assignment of Raman bands of the S2•−, S3•−, and SO4•− radical anions in sodalite cages has been made previously [30] based on ESR, electronic, and vibrational spectra. Raman spectroscopy is a very sensitive tool, which makes it possible to detect very low amounts of S3•−. Additional data on the S-bearing extra-framework groups in these minerals can be obtained by means of ESR, UV-Visible, and XANES spectroscopy [8,23,24,30,31]. In particular, radical anions S2•− and S3•− can be detected by means of ESR, absorption spectroscopy in the UV-Vis range, and luminescence spectroscopy.
In this work, a combination of different spectroscopic methods was applied to the study of extra-framework anionic and neutral groups (mainly, S-bearing ones) in five samples of differently colored sodalite-group minerals from gem lazurite deposits. In addition, crystal-chemical features of these minerals related to the framework symmetry and modulation are discussed.

2. Materials and Methods

The samples LSh, MD, PH, and ZK were collected at the Malo-Bystrinskoe gem lazurite deposit, Eastern Siberia, Baikal Lake area, Irkutsk Oblast, Russian Federation. This deposit discovered in 1851 by G.M. Permikin is situated in the northern spurs of the Khamar-Daban ridge, on the western slope of the watershed of the Malaya Bystraya and Lazurnaya rivers. During the period of intensive mining of lapis lazuli in this area (from 1851 to 1872), it gave about 9/10 of the total mass of lazurite raw materials obtained in the Baikal region. Currently, the deposit is mothballed.
The KL sample was kindly provided by N.V. Vladykin. Its locality is unknown. Judging by the value of the modulation parameter of the crystal structure, it originates from the deposits of the Badakhshan lapis lazuli province. In this sample, deep blue anhedral and subhedral grains of a sodalite-group mineral are embedded in large colorless single-crystal calcite individuals (Figure 1). This mineral assemblage contains colorless prismatic diopside crystals.
The Baikal samples were taken from lazurite calciphyres which are coarse-grained, massive rocks consisting mainly of calcite, with subordinate diopside and lazurite, and minor pyrite, phlogopite, sodalite, nepheline, and bystrite. Calcite (white, gray, yellowish, with abundant gas–liquid inclusions) gives off a pungent smell of hydrogen sulfide. Diopside forms white, grayish or colorless transparent prismatic, partly flattened crystals. Pyrite occurs as separate crystals up to 1 mm across and their aggregates. Sodalite-group minerals form separate anhedral grains up to 5 mm across and granular aggregates. Their color is lilac (for the LSh sample, Figure 2), light blue (for the MD sample, Figure 3), blue (for the PH and KL samples), and dark blue (for the ZK sample, Figure 4).
The Hn7981 sample (used for comparison) is typical bright blue gem-quality haüyne (Figure 5) forming crystals up to 5 mm across in cavities of sanidinite from the Laach Lake volcano, Eifel paleovolcanic region, Germany. The associated minerals are sanidine, amphibole, and titanite.
Electron microprobe analyses of the samples from lazurite deposits were carried out with a JXA_8200 electron microprobe (Jeol, Tokyo, Japan) equipped with a high-resolution scanning electron microscope, an energy dispersion system (EDS) with SiLi detector with resolution of 133 eV, and five wave dispersion spectrometers (WDS); analyst: Lyudmila F. Suvorova. The chemical composition was measured with an electron microprobe that operated at an acceleration voltage of 20 kV, a current intensity of 10 nA, and a counting time of 10 s. The beam was scanned to 20 μm in order to decrease thermal damage of the samples. Under these conditions, the studied minerals are stable with respect to the beam effect. The following standards and analytical lines were used: pyrope (Si, Kα), albite (Al, Na, Kα), diopside (Ca, Kα), orthoclase (K, Kα), barite (S, Kα), and Cl-apatite (Cl, Kα). The contents of the elements were calculated using the ZAF procedure. The relative standard deviation did not exceed 1.3% for Al and Si; 2% for Na, S, and Ca; 3% for Cl and K, which indicates a rather low degree of chemical heterogeneity for all studied samples. The back-scattered images obtained by scanning sample areas did not reveal sulfide inclusions (FeS2, FeS) which could be a source of errors in the determination of sulfur. The electron microprobe analyses were used for the determination of the total sulfur content in the mineral. Sulfate sulfur was determined by conventional “wet” chemical analysis using acidic decomposition (analyst Galina A. Pogudina). The content of sulfide sulfur was calculated as the difference between the total and sulfate sulfur.
Electron microprobe analyses of the Hn7981 sample were carried out using a Tescan VEGA-II XMU electronic microscope (EDS mode, 20 kV, 400 pA; TESCAN, Brno, Czech Republic). Data reduction was carried out by means of the INCA Energy 450 software package (Oxford Instruments, Oxfordshire, UK). The size of the electron beam was 157–180 nm. The beam was scanned on an area 20 μm × 20 μm in order to minimise sample damage. The time of data acquisition was 50 s. The sample-to-detector distance was 25 mm. The standards used are: albite for Na and Si, sanidine for K, wollastonite for Ca, Al2O3 for Al, BaSO4 for S, CaF2 for F, and NaCl for Cl.
The contents of CO2 belonging to CO2 molecules in sodalite cages were determined from IR spectra using the technique described in [21]. H2O in the Hn7981 sample was determined by gas chromatography of the products of ignition in oxygen at 1200 °C with a Vario Micro Cubeanalyser (Elementar GmbH, Frankfurt, Germany).
In order to obtain infrared (IR) absorption spectra, powdered samples were mixed with dried KBr, pelletized and analyzed using an ALPHA FTIR spectrometer (Bruker Optics, Karlsruhe, Germany) in the range of 360–4000 cm−1 with a resolution of 4 cm−1. A total of 16 scans were collected for each spectrum. An IR spectrum of an analogous pellet prepared from pure KBr was used as a reference. The absorbance of the bands at 2341–2346 cm−1 was measured relative to the absorbance at 2500 cm−1. The absorbance of the band used as an internal standard was measured at the absorption maximum in the range of 656–668 cm−1; the common tangents to two deepest minima in the range of 500–830 cm−1 were used as baselines.
Raman spectra of randomly oriented samples were obtained using an EnSpectr R532 spectrometer based on an OLYMPUS CX 41 microscope (Enhanced Spectrometry, San Jose, USA) coupled with a diode laser (λ = 532 nm) at room temperature. The spectra were recorded in the range from 100 to 4000 cm−1 with a diffraction grating (1800 gr mm–1) and spectral resolution about 6 cm−1. The output power of the laser beam was in the range from 5 to 13 mW. The diameter of the focal spot on the sample was 5–10 μm. The backscattered Raman signal was collected with a 40× objective; signal acquisition time for a single scan of the spectral range was 1 s, and the signal was averaged over 50 scans. Crystalline silicon was used as a standard.
The X-ray diffraction study was carried out by the photo method on a single crystal (KFOR-4 camera, Burevestnik, Leningrad (St. Petersburg), USSR, CuKα radiation) and the powder diffraction method with an automatic powder diffractometer (D8 ADVANCE, Bruker, Berlin, Germany) equipped with a Göbel mirror. The powder X-ray diffraction patterns were obtained in step scan mode (in the 2θ range from 5 to 70°), using CuKα radiation, at an accelerating voltage of 40 kV, current of 40 mA, time per step of 1 s, and 2θ step of 0.02°. The calculations of interplanar distances and intensities of diffraction lines were performed using the computational software that was delivered with the diffractometer (DIFFRAC Plus Evaluation package EVA, Bruker AXS, Karlsruhe, Germany). The description of the modulated structure was carried out following a previously published scheme [33].
Diffuse-light optical absorption spectra were measured at room temperature with a Perkin-Elmer Lambda 950 spectrophotometer (Perkin-Elmer, Shelton, CT, USA) in an integrating sphere. For measurements, the samples were placed in a quartz test tube made of KU-1 glass, which is transparent in the range of 200–1300 nm. The light beam was completely concentrated on the sample. Other details of the measurement procedure are described in previous reports [34,35,36].
The photoluminescence spectra were measured with excitation by laser radiation with a wavelength of 405 nm. The luminescence signal was recorded using a Hamamatsu H6780-04 photo module (185–850 nm) operating in the photon counting regime equipped by a MDR-2 monochromator (LOMO, St. Petersburg, Russia) with a diffraction grating of 600 lines per mm, at a spectral slit width of 0.2 nm. The measurements at 77 K were carried out in a flooded nitrogen cryostat; the sample was attached to a cryofinger and the temperature was recorded using a thermocouple.
ESR spectra were recorded using a RE-1306 X-band spectrometer (KBST, Smolensk, Russia) with a frequency of 9.358 GHz. Powdered samples were placed in a quartz test tube. The measurements were carried out at room temperature and in a quartz cryostat at 77 K.

3. Results

3.1. Chemical Composition

Chemical data for the studied sodalite-group minerals are given in Table 1. Kinds and amounts of S-bearing extra-framework components were determined based on spectroscopic data (see below) and the charge–balance condition. Taking into account that the S3•− radical anion is an extremely strong blue chromophore, its contents were calculated only for the samples having bright blue to dark blue color.

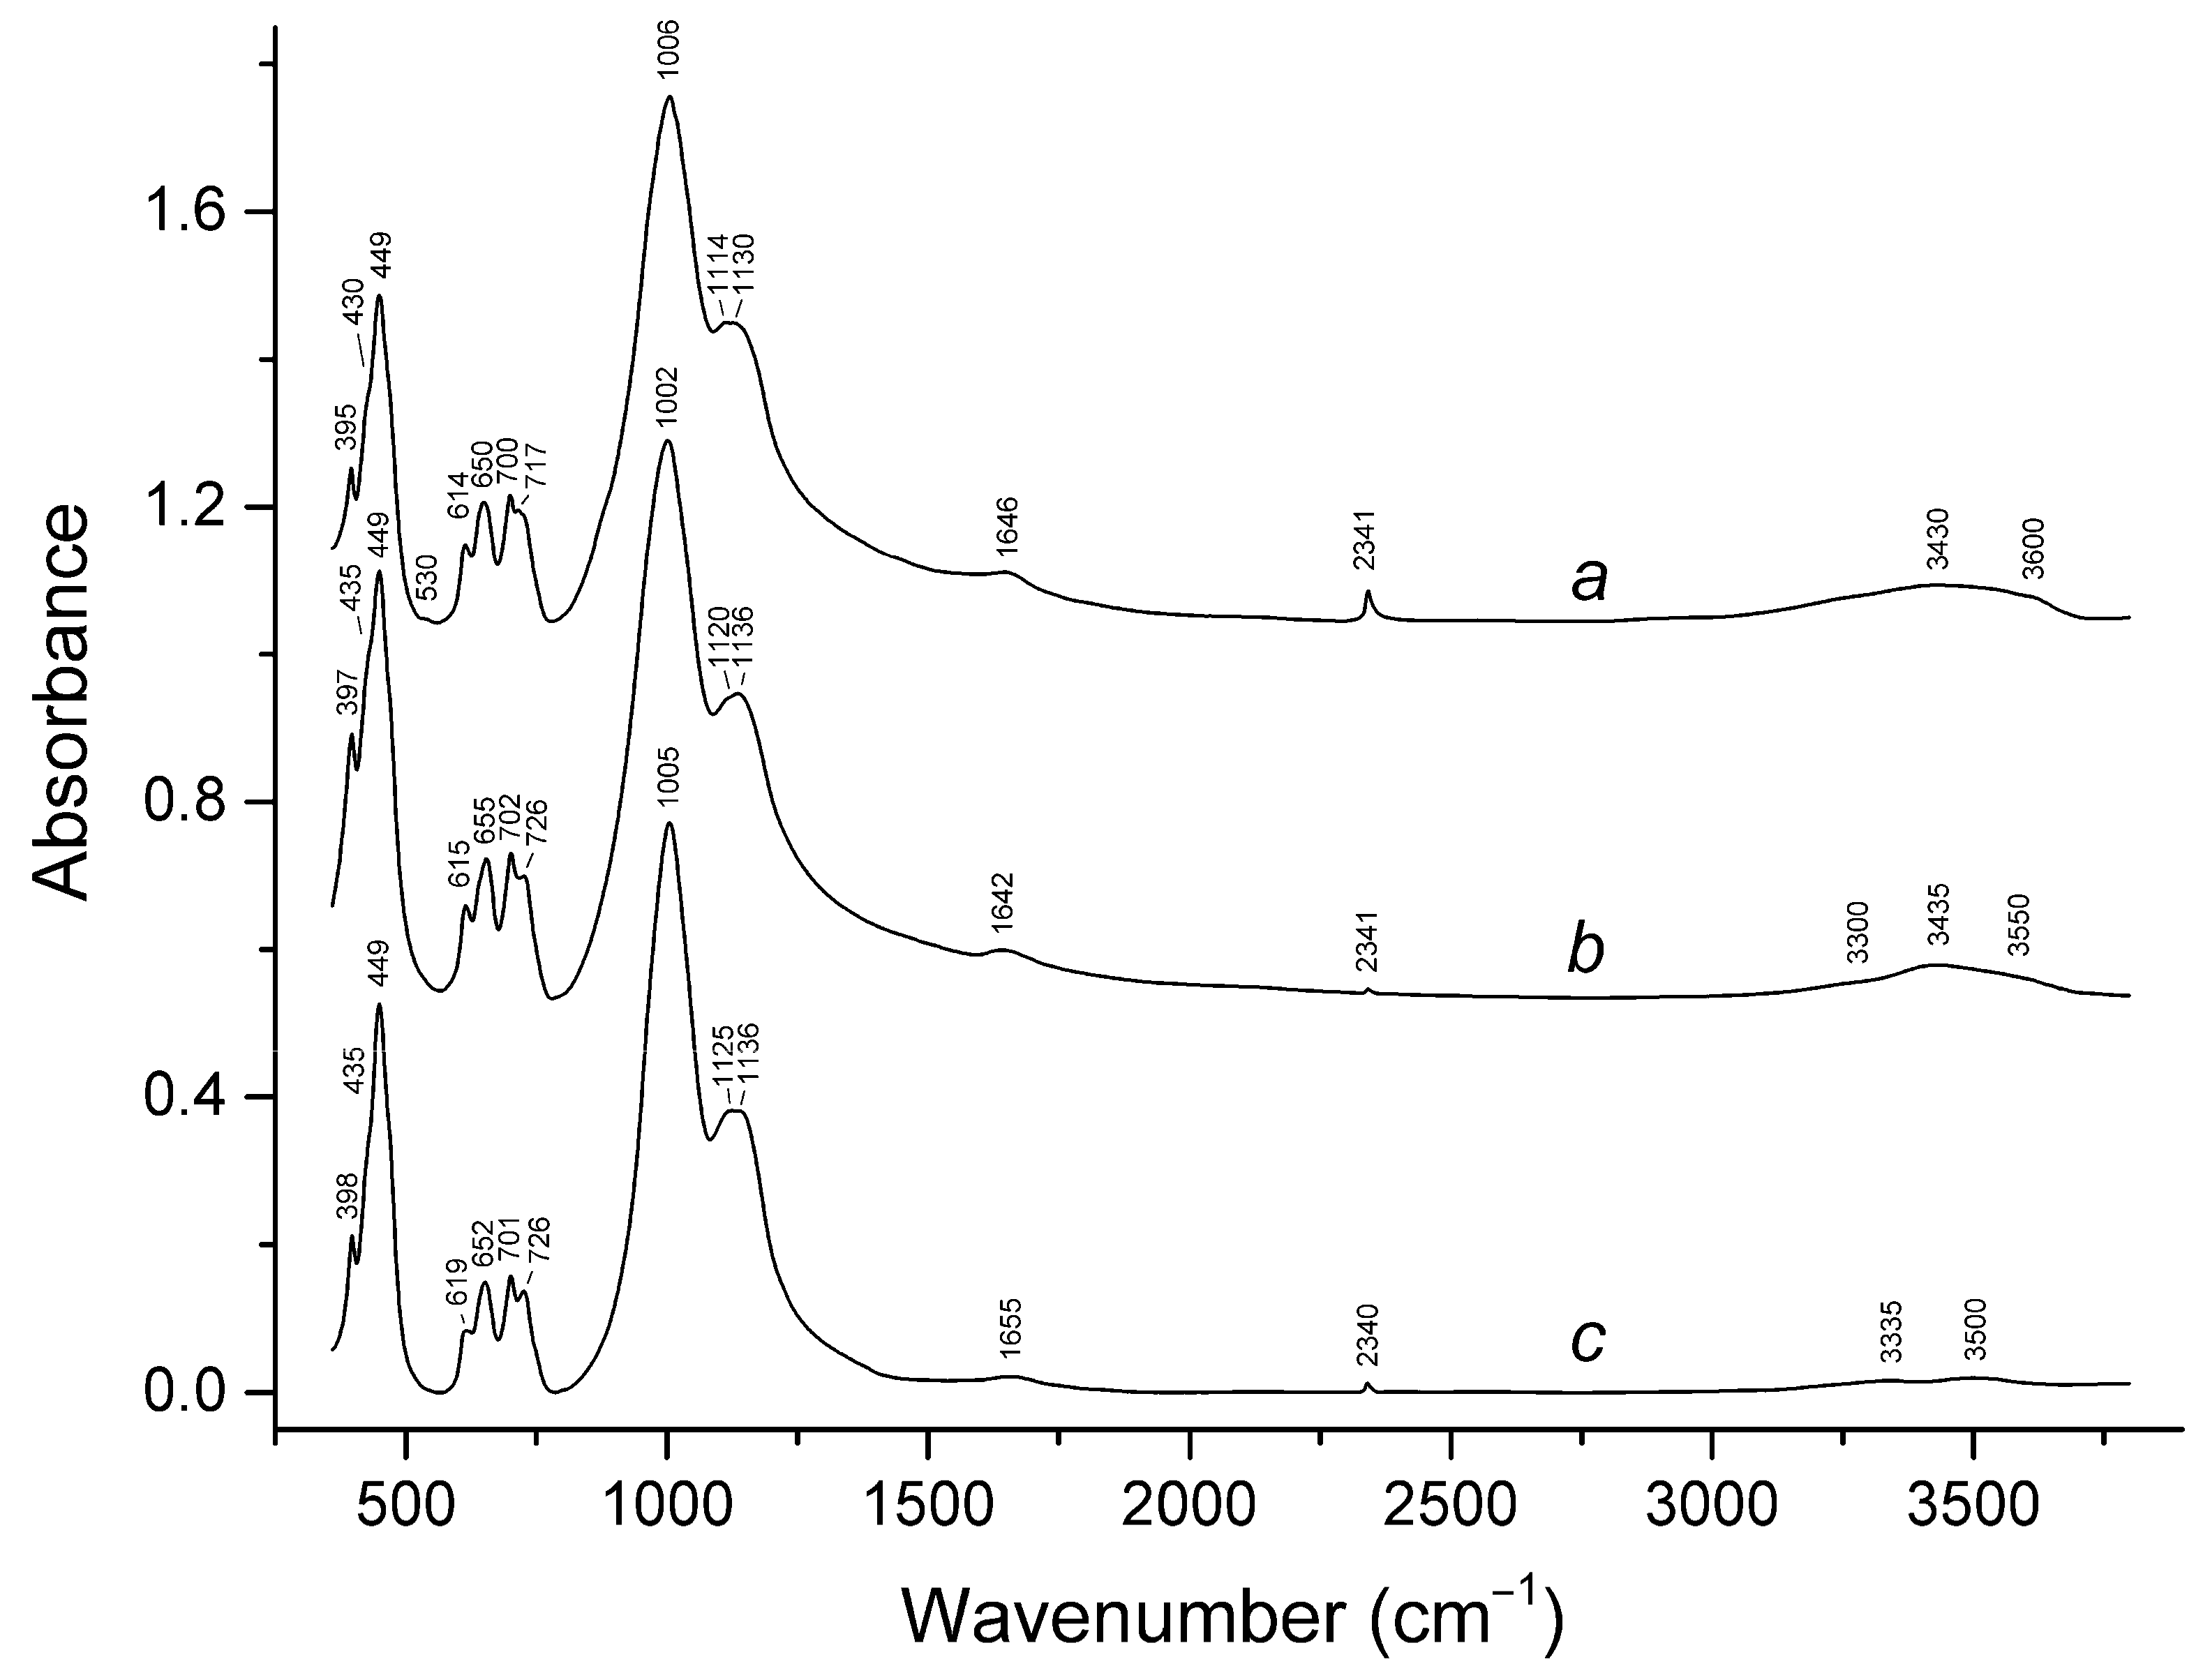
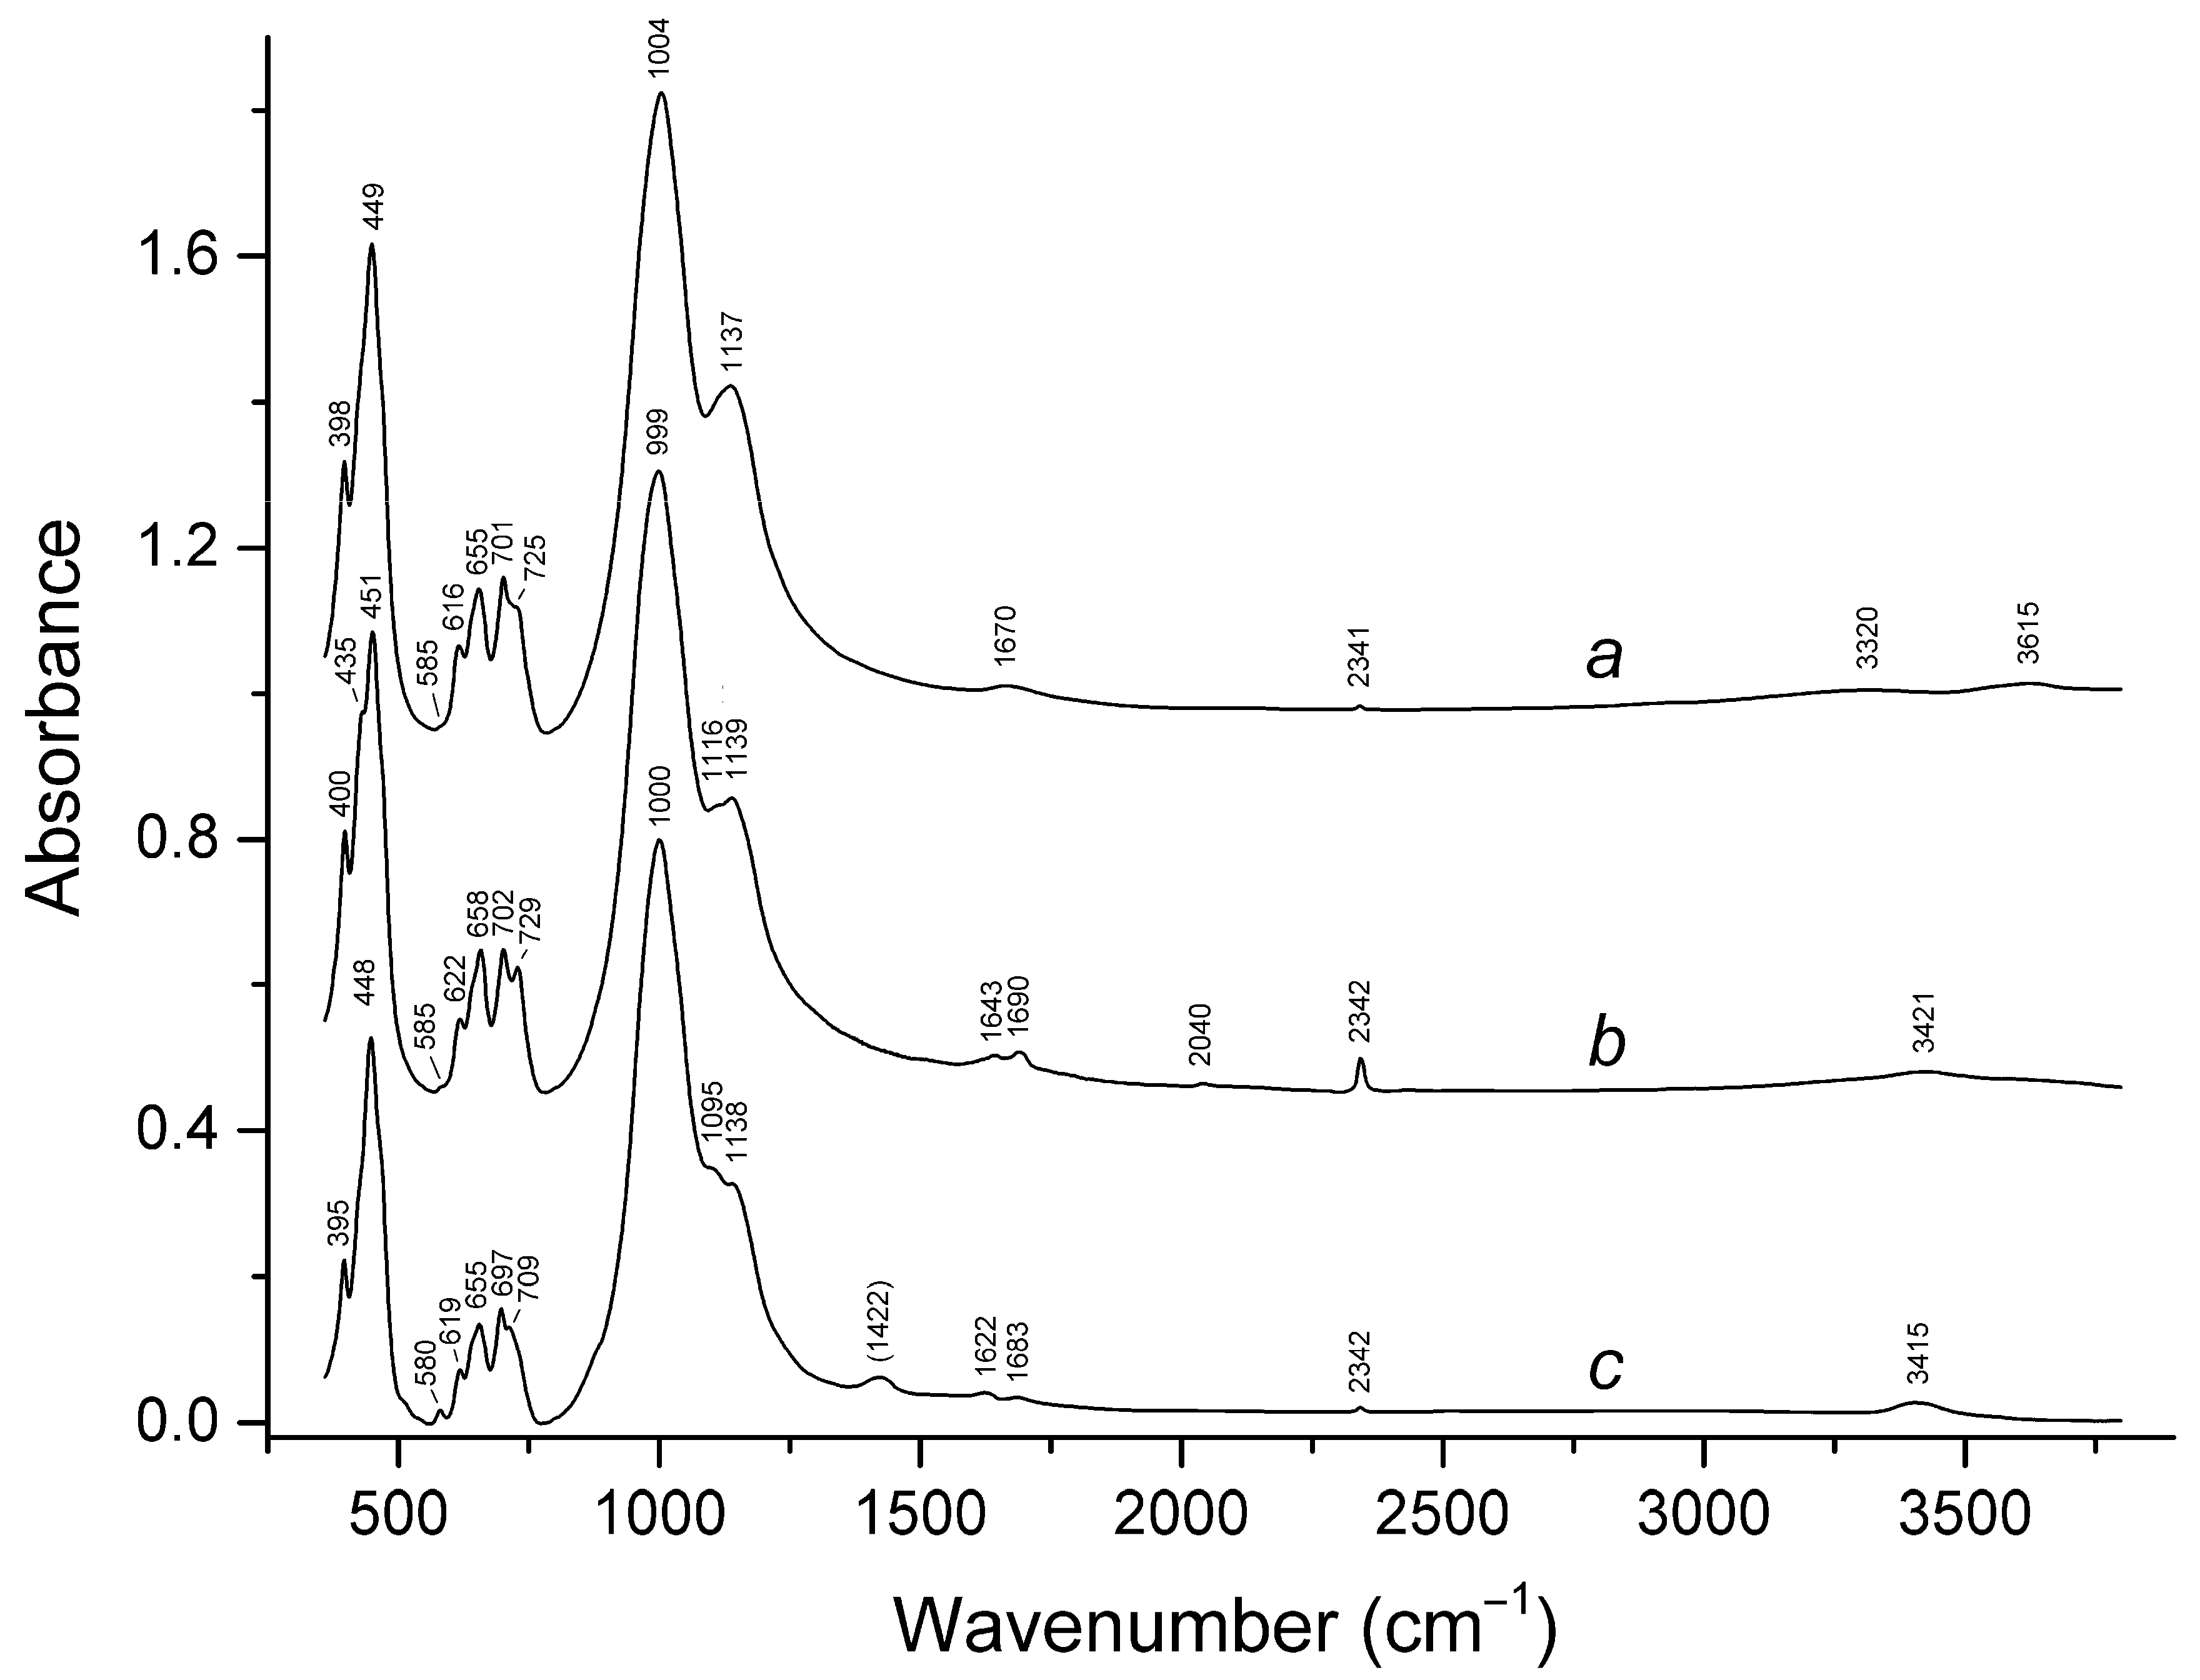
3.2. Infrared Spectroscopy

The IR spectra of the studied samples are given in Figure 6 and Figure 7. All of them contain bands of O–H stretching and H–O–H bending vibrations (in the ranges of 3300–3700 and 1620–1690 cm−1, respectively) which are due to the presence of H2O molecules (zeolitic water).
Characteristic IR bands of S-bearing groups which can occur in sodalite-group minerals are in the ranges of 1124–1142 cm−1 (asymmetric stretching vibrations of the SO42− group, the F23) mode), 610–650 cm−1 (bending vibrations of the SO42− group, the F24) mode), 583–587 cm−1 (antisymmetric stretching vibrations of the cis-conformer (C2v) of the chain-like S4•− radical anion, the B1 mode), 655–659 (antisymmetric stretching vibrations of the cis-conformer (C2v) of the linear S4 molecule, the B1 mode; shifts towards lower values in the presence of Cl), and 575–585 cm−1 (antisymmetric stretching vibrations of the S3•− radical anion, the ν3 mode-a weak band) [21,32,37,38,39,40].
Bands of bending and stretching vibrations of the SO42− group are partly overlapping with corresponding bands of the aluminosilicate framework. The IR spectra of the samples LSh, MD, and PH are very close to the spectrum of typical haüyne (the Hn7981 sample). All of them contain strong and distinct bands of S–O stretching vibrations in the range 1130–1137 cm−1. In the IR spectrum of the deep blue PH sample, a weak shoulder is observed at 585 cm−1, which indicates the presence of a trace amount of the S3•− radical anion. An analogous (but more distinct) shoulder is observed in the IR spectrum of the KL sample which is characterized by a lower intensity of the band of S−O stretching vibrations (at 1139 cm−1). The weakest band of S–O stretching vibrations (at 1138 cm−1) and the strongest and most distinct band of the S3•− radical anion (at 580 cm−1) are observed in the IR spectrum of the most sulfide-rich ZK sample with the idealized formula Na7Ca(Al6Si6O24)(SO4)S3•− ·H2O [8]. Earlier a distinct peak at 585 cm−1 was observed in the IR spectrum of a sulfate-depleted deep blue lazurite sample with the empirical formula (Na6.66K0.26Ca0.16)(Si6.44Al5.54Fe3+0.02O24)(S3)0.80(S2−,SO42−)0.35Cl0.18(CO2)0.22·1.13H2O from the Sar-e Sang deposit whereas in the IR spectrum of another deep blue lazurite sample with the empirical formula (Na6.38Ca1.22K0.12)(Si6.10Al5.86Fe3+0.04O24)(S2−,SO42−)1.30(S3)0.16(CO2)0.16·nH2O, this band is observed as an indistinct shoulder [21].
In IR spectra of most samples of sodalite-group minerals from lazurite deposits, a band of O–(Si,Al)–O bending vibrations in the range of 655–658 cm−1 is observed. In the IR spectrum of the LSh sample, this band is shifted towards 650 cm−1 which may be due to the presence of S4 molecules (based on high-level quantum chemical calculations, the expected wavenumber of the antisymmetric stretching mode of free cis-S4 (C2v) molecule is 655 cm−1, but this band can shift towards lower wavenumbers because of the transformation of this molecule to gauche-S4 in the sodalite cage: [32]). This assumption is in agreement with the Raman and electronic spectra (see below) as well as lilac color of this sample.
A shoulder at 530 cm−1 is observed in the IR spectrum of the LSh sample, but is absent in the spectra of other samples studied in this work. According to Raman and UV-Visible spectroscopic data (see below), this sample contains neutral S4 molecules. Based on this fact and taking into account results of quantum chemical calculations [32,41], this band was tentatively assigned to stretching vibrations of trans-S4 (C2h).
It is to be noted that the S2− anion does not have inner degrees of freedom and, consequently, its absorption bands could not be observed in the wavenumber range of 360–3800 cm−1.
The band at 1422 cm−1 in the IR spectrum of the ZK sample corresponds to calcite inclusions. A narrow and weak band at 2340–2342 cm−1 observed in the IR spectra of all studied samples is due to antisymmetric stretching vibrations of CO2 molecules [11,21,32]. This band is accompanied by a very weak isotope satellite at 2275–2279 cm−1 corresponding to 13C16O2. The samples LSh and KL are most CO2-rich.
The band at 2040 cm−1 observed in the IR spectrum of the KL sample is most probably due to the C–O stretching frequency of the COS molecule [42], which is to be expected in samples containing both sulfide sulfur and CO2. Noteworthy, a similar band (at 2044 cm−1) is present in the IR spectrum of lazurite with the highest content of carbon dioxide (0.44 CO2 molecules per formula unit) [21].

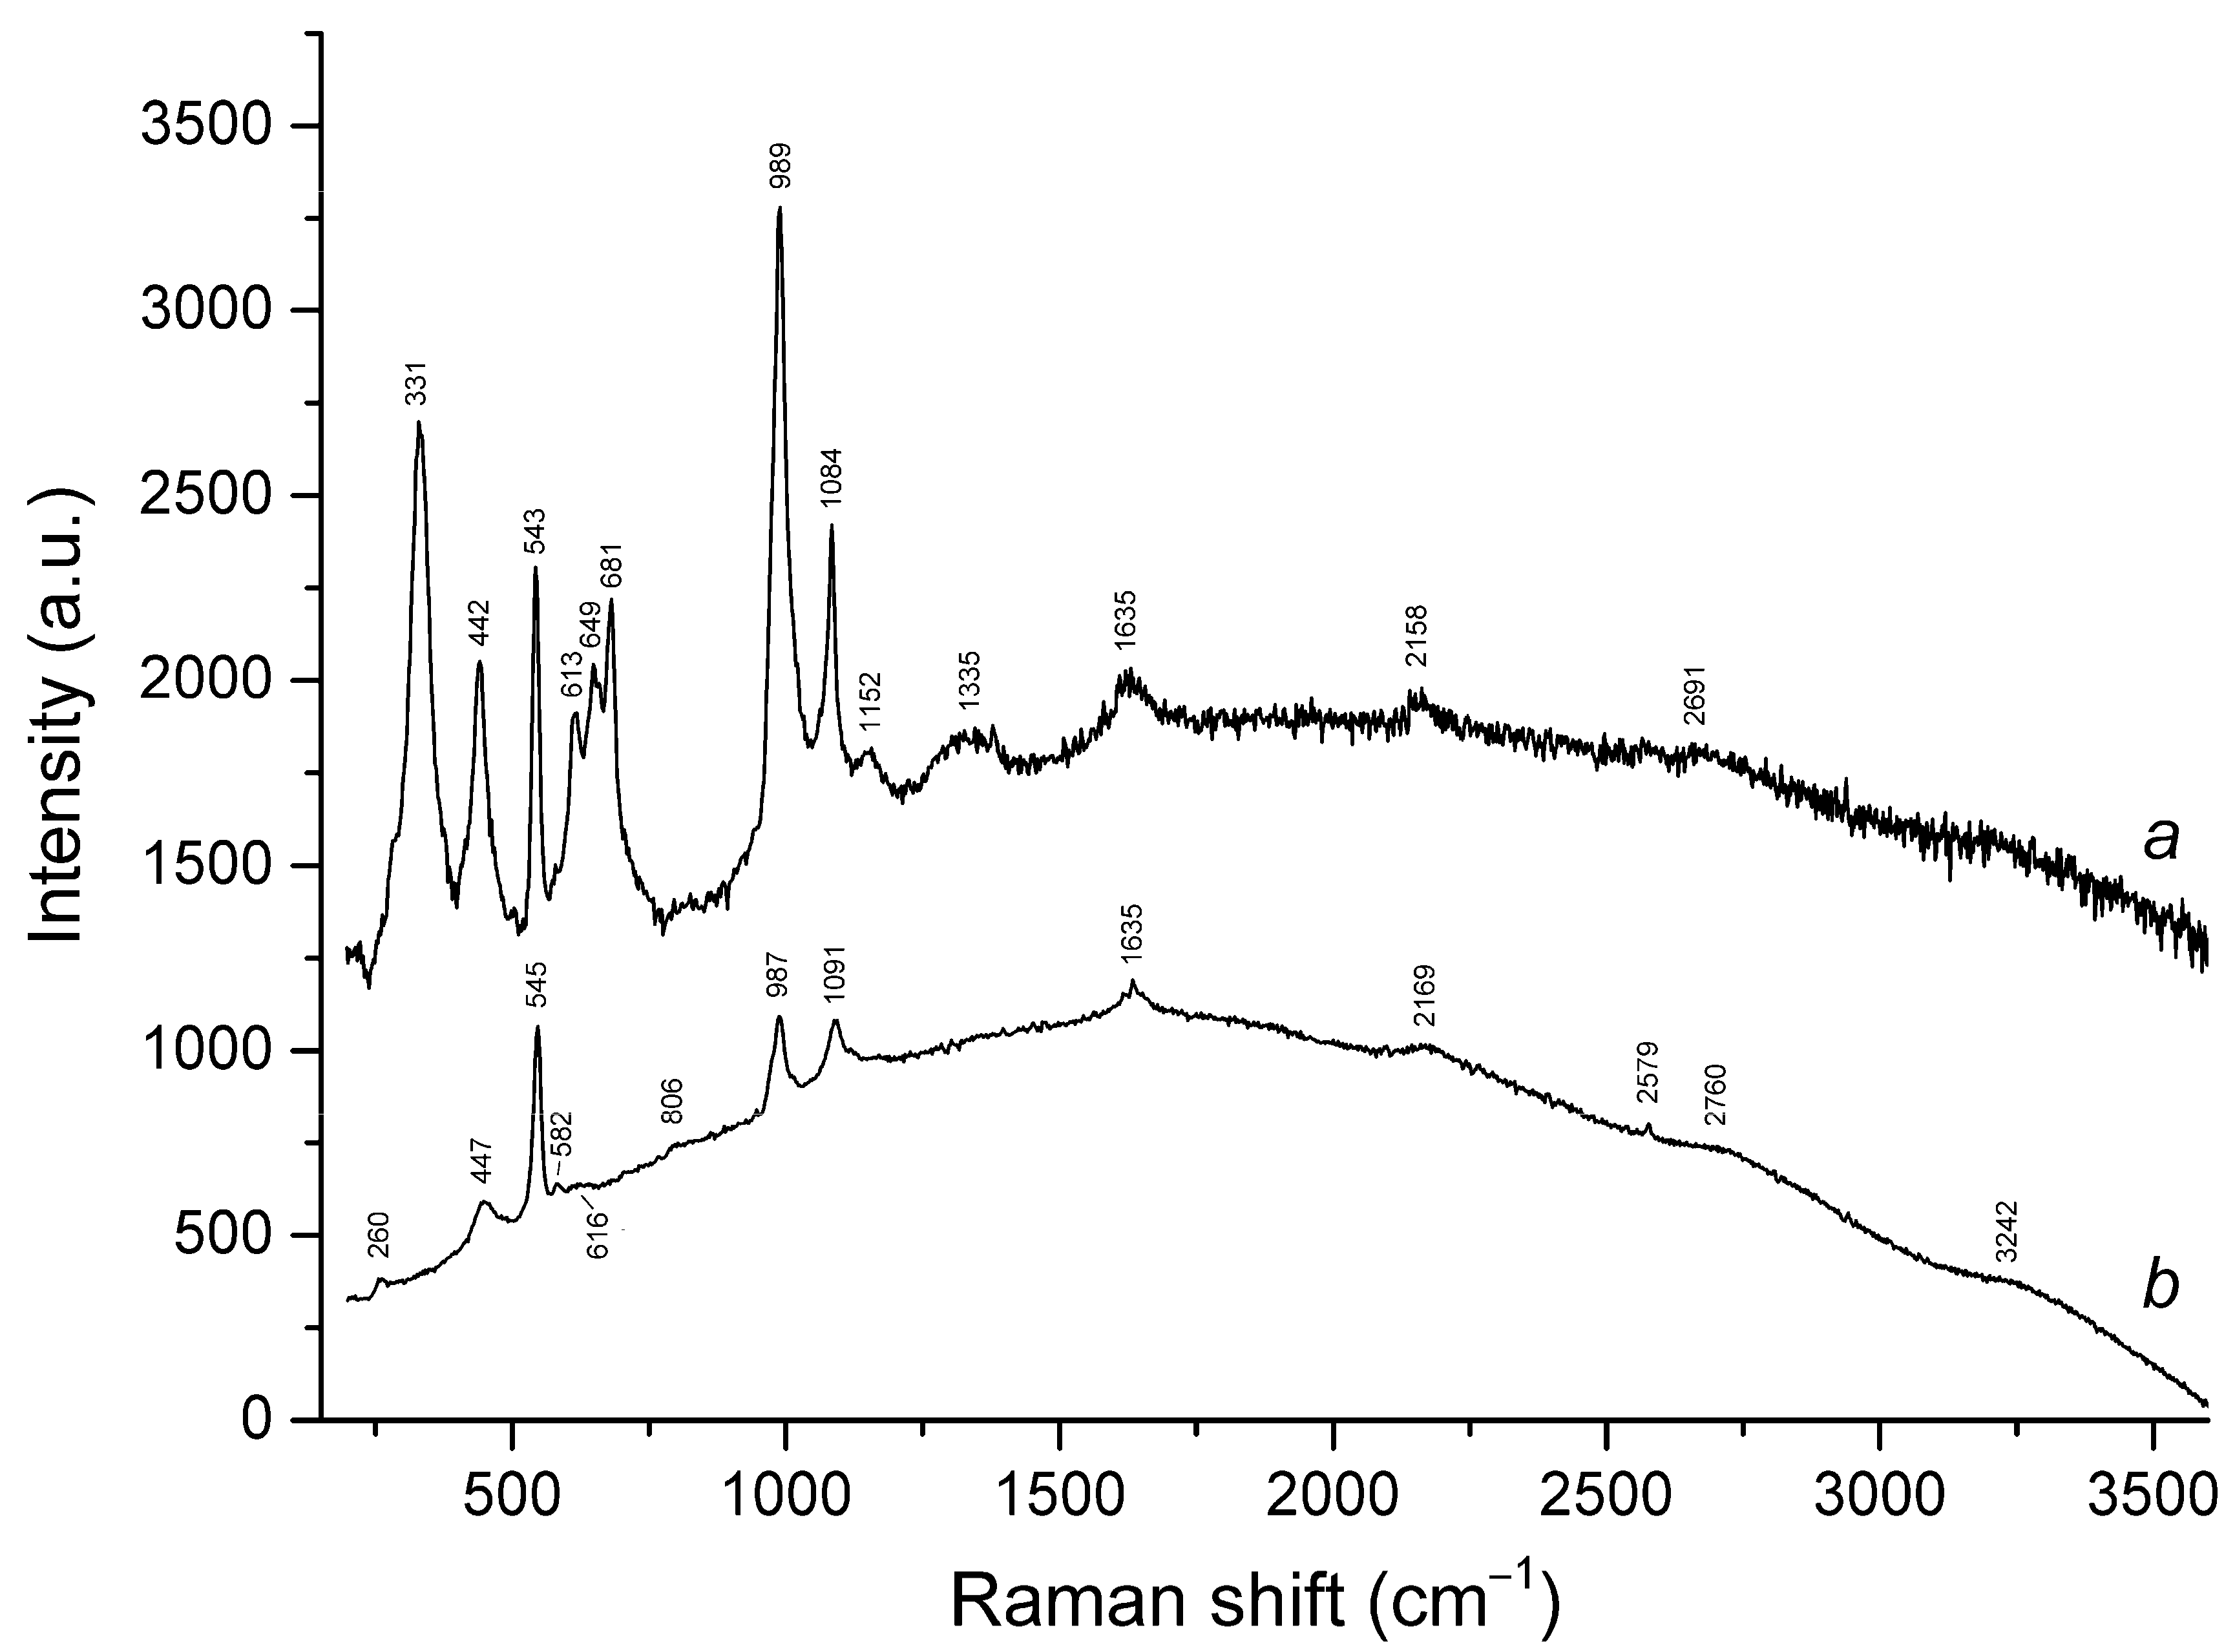
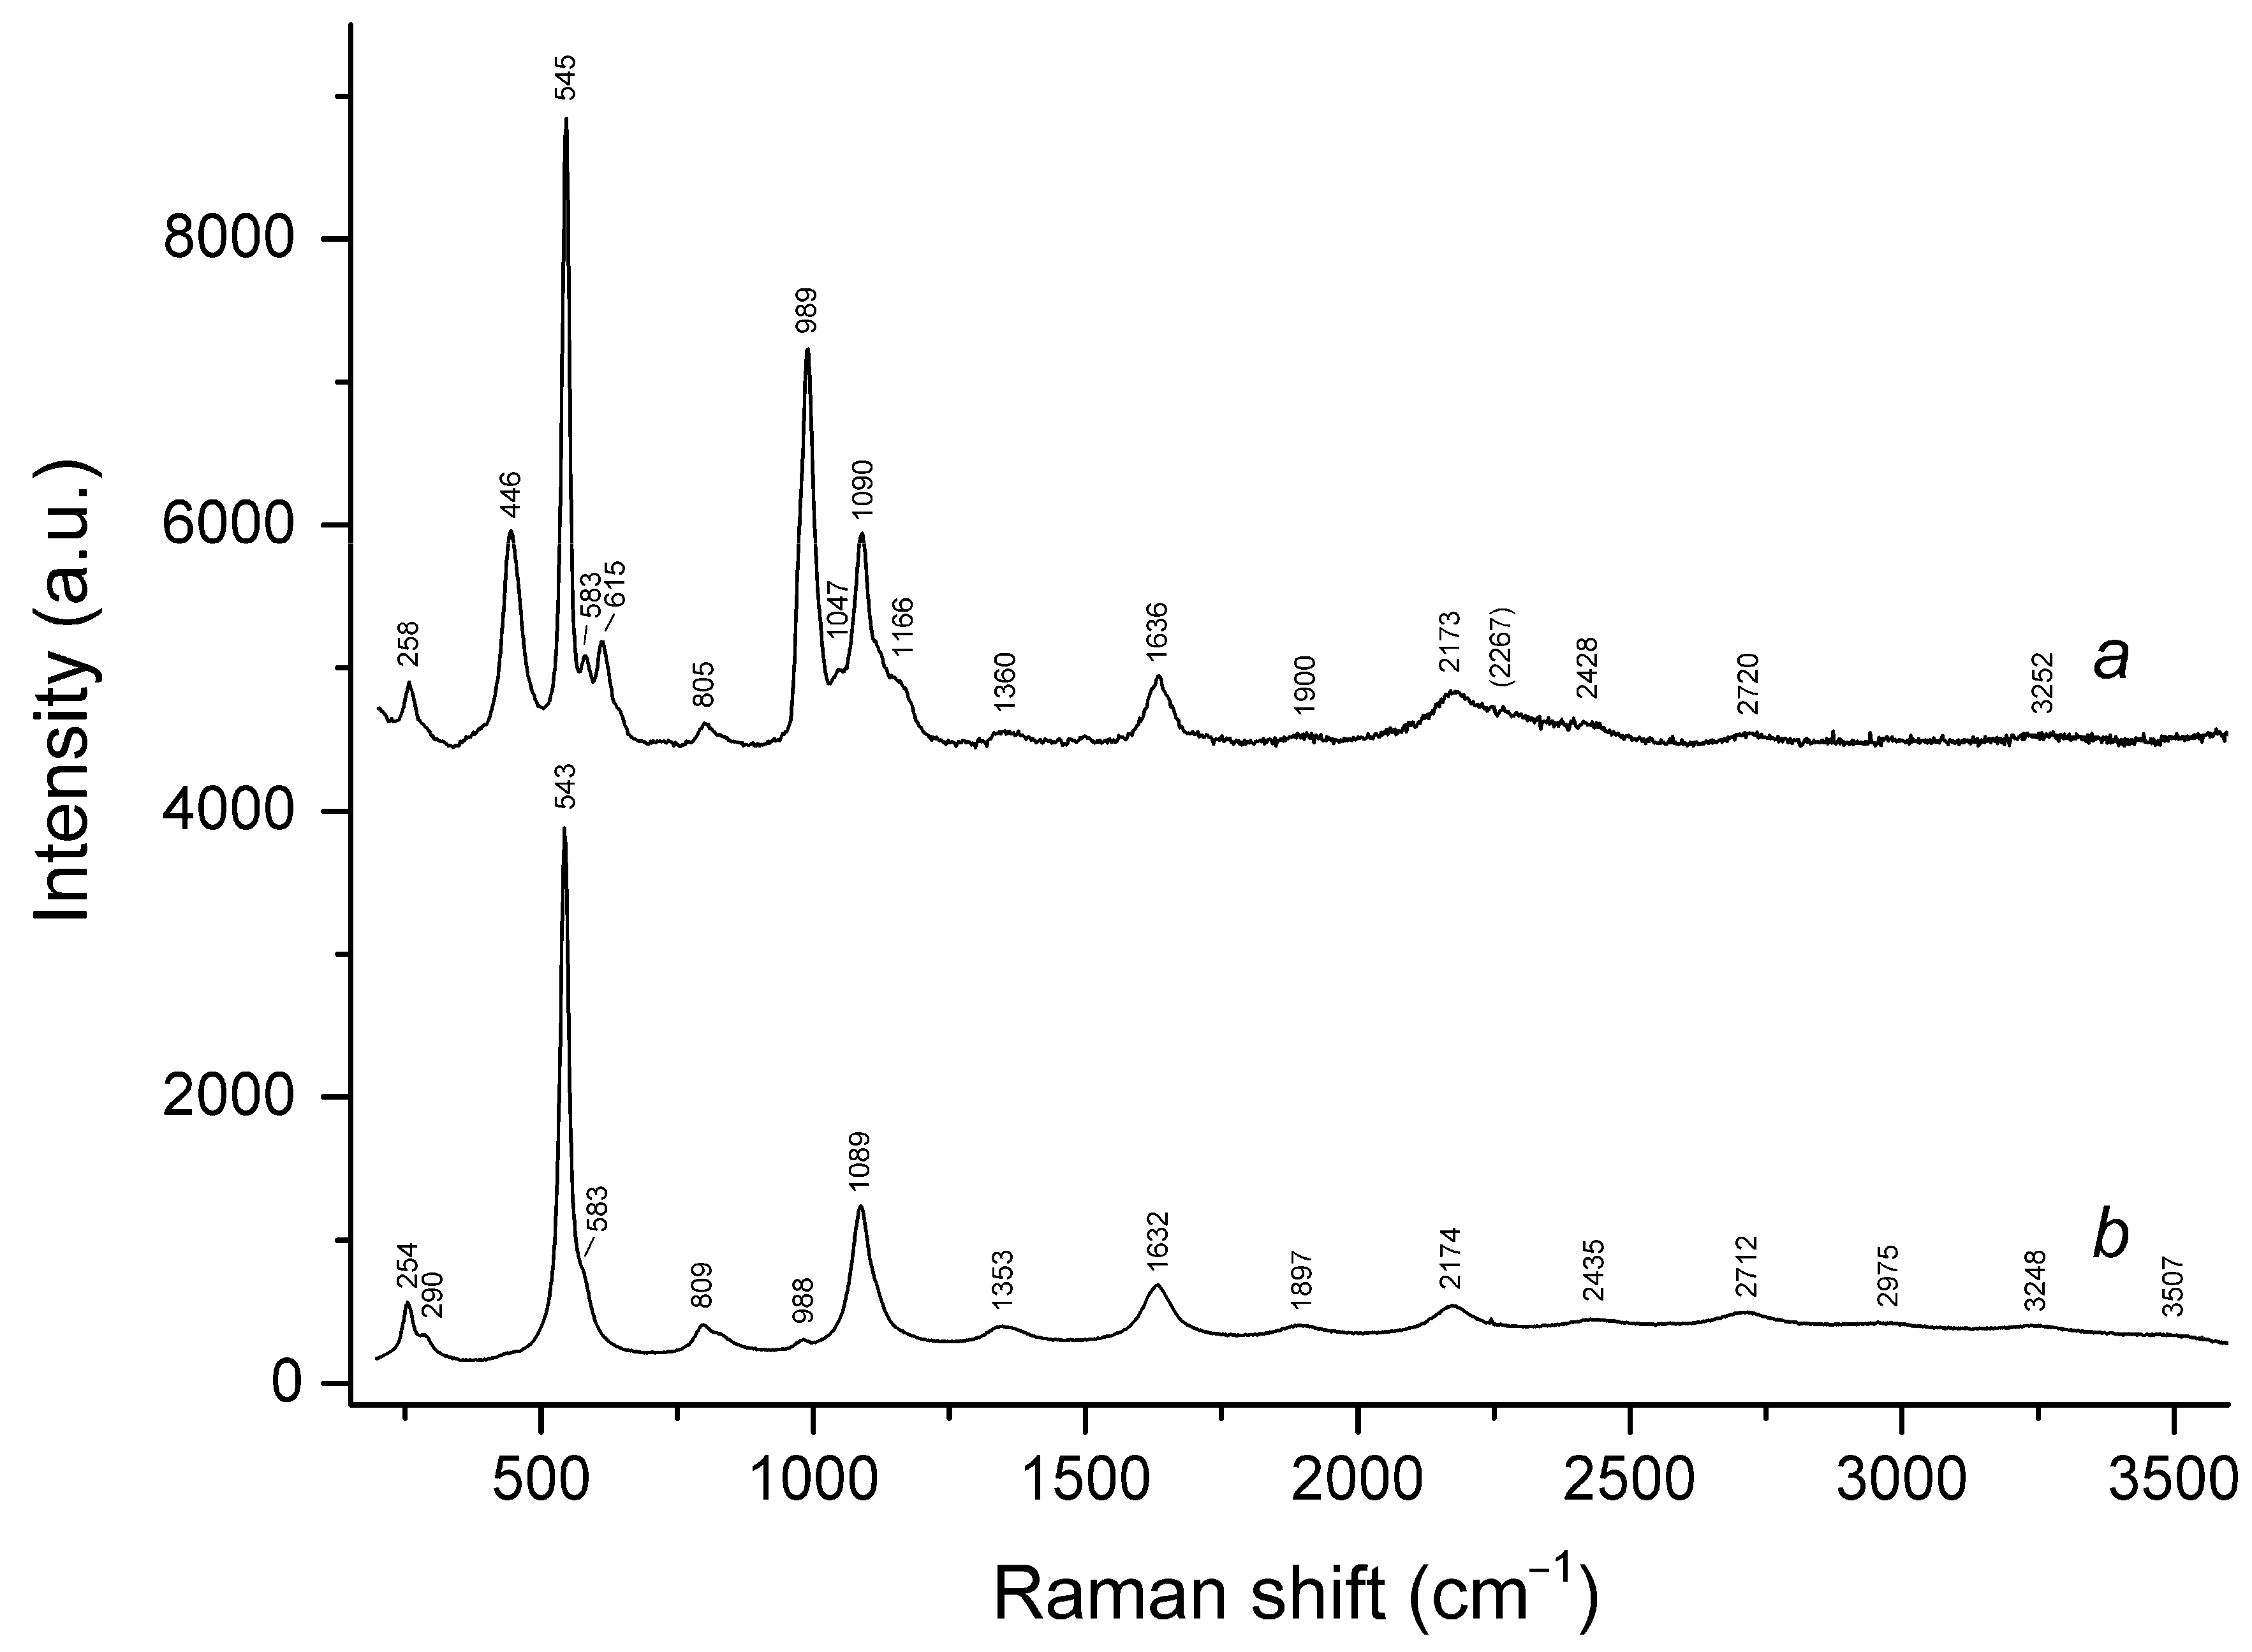
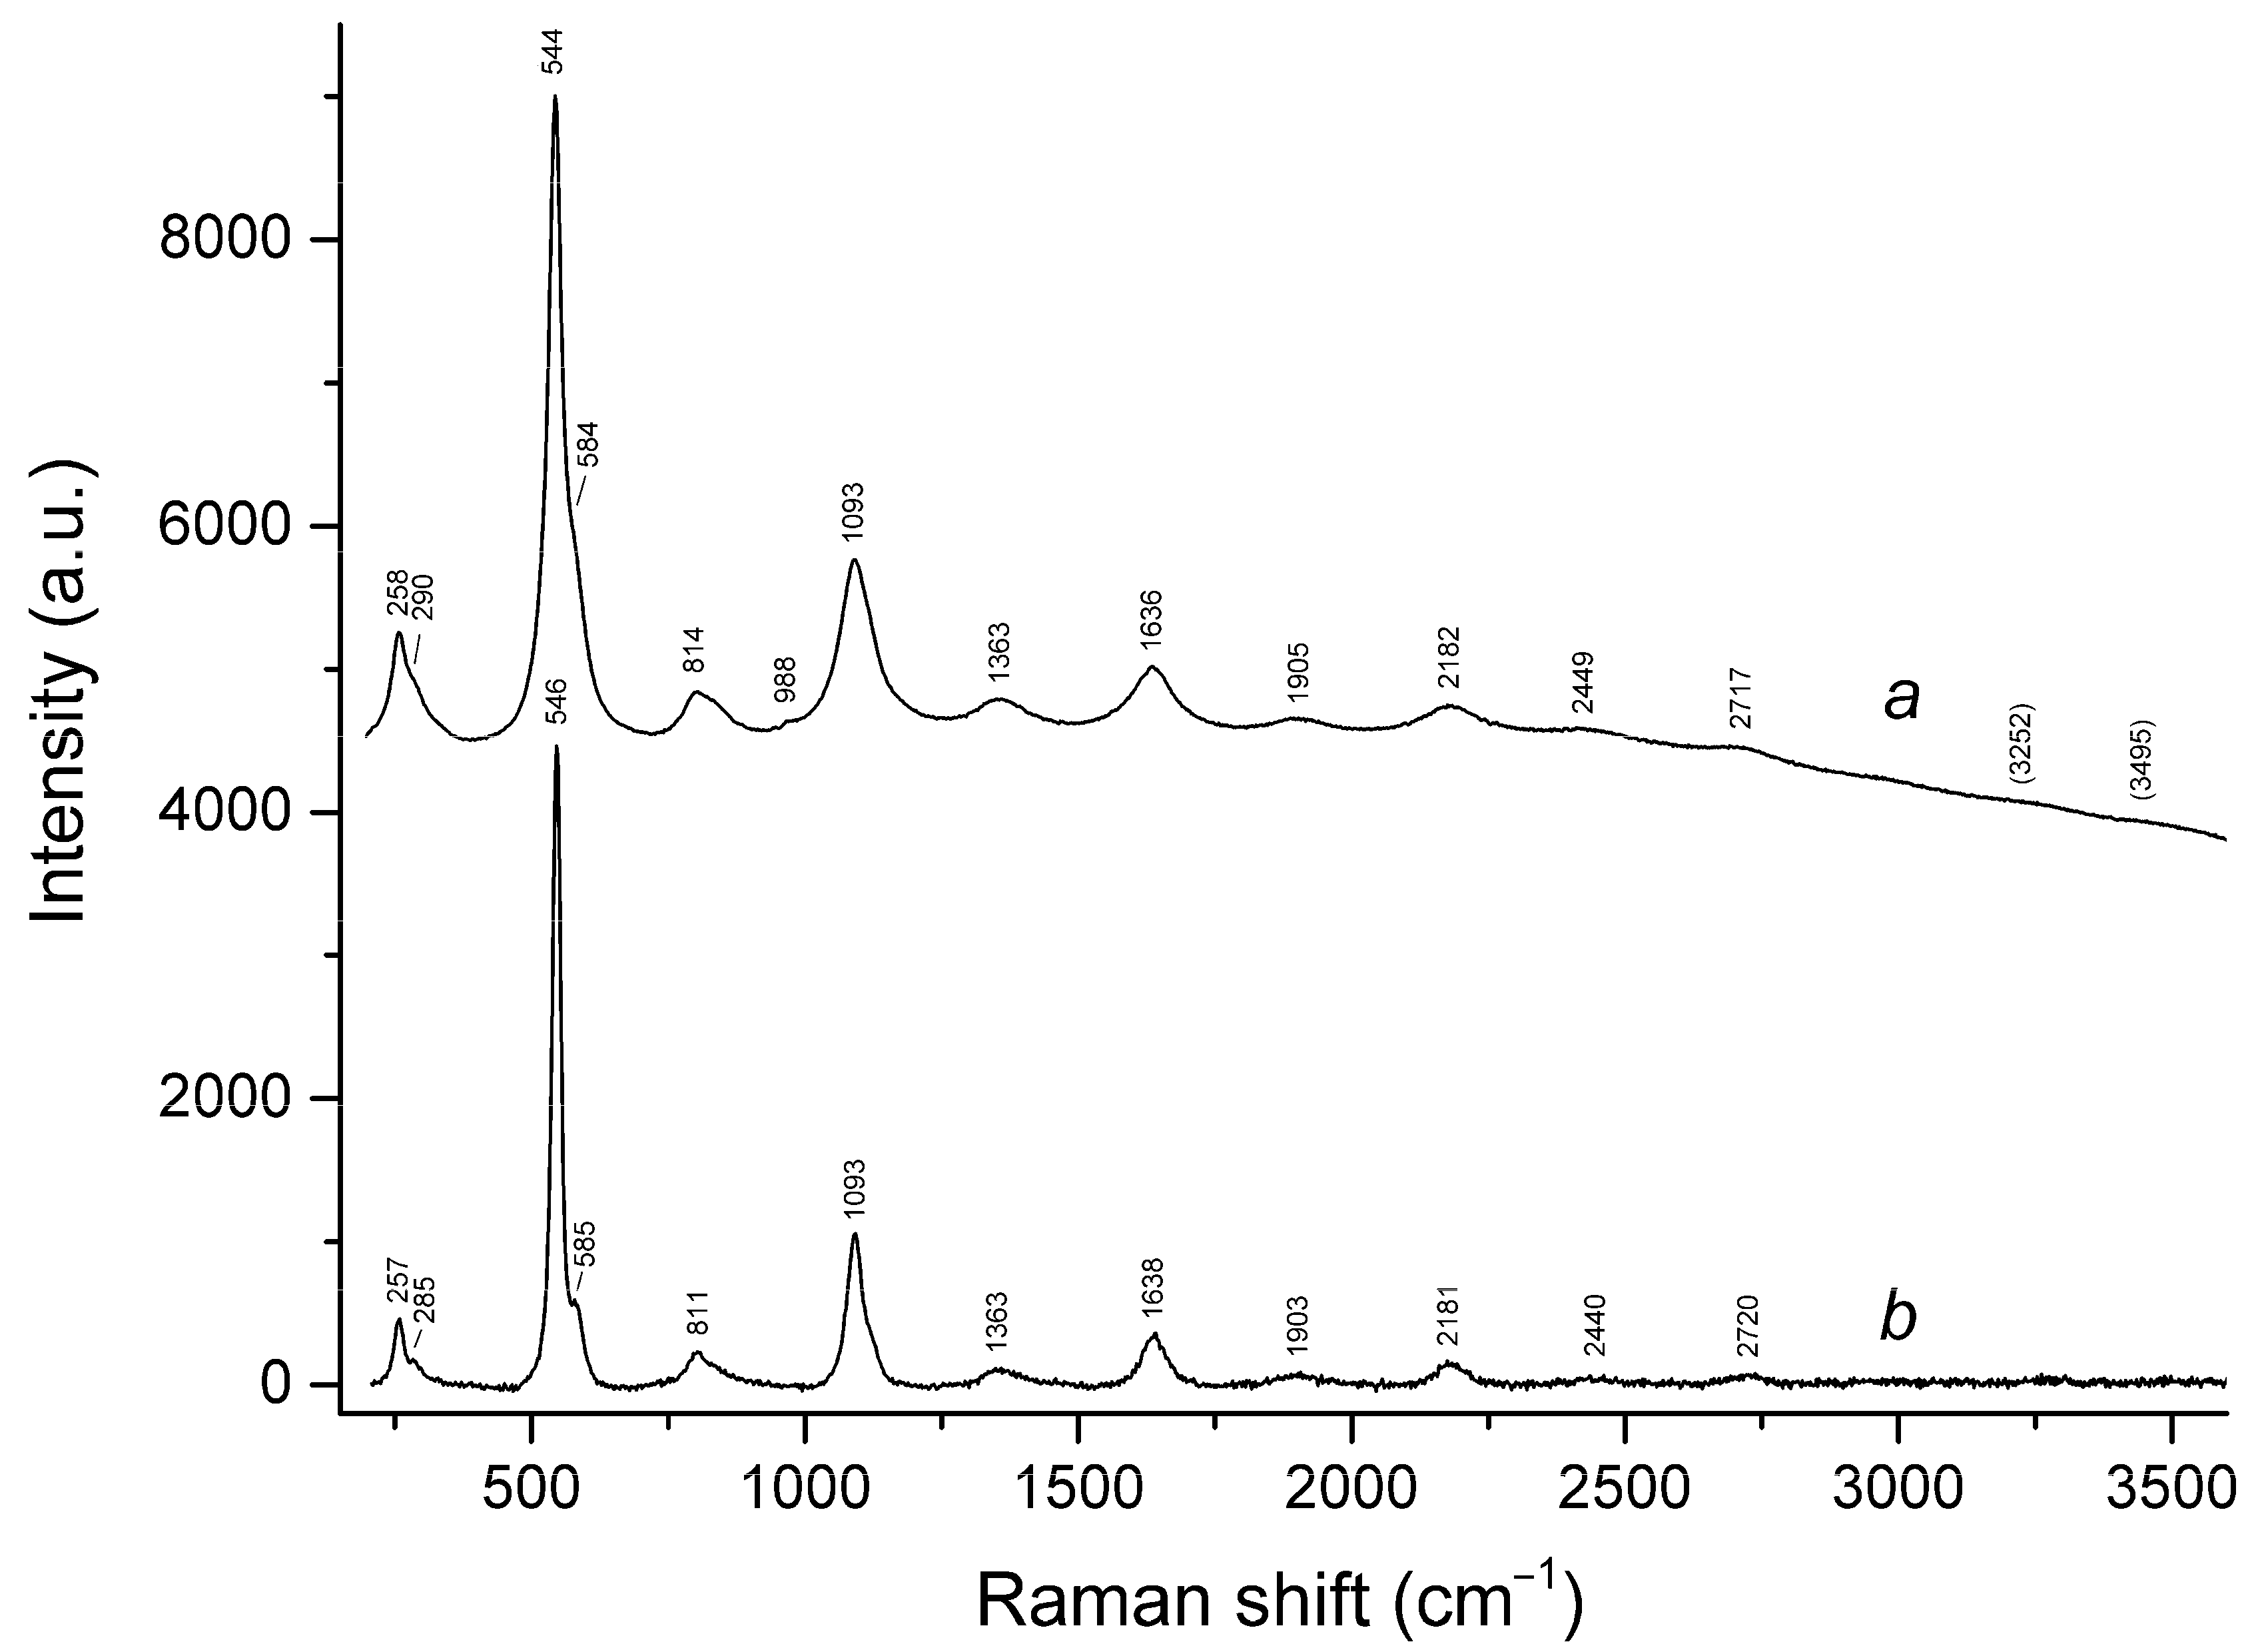
3.3. Raman Spectroscopy

Raman spectra of the samples studied in this work are given in Figure 8, Figure 9 and Figure 10. The SO4-rich LSh and MD samples show strong luminescence under laser beam (Figure 8), which is due to the presence of the S2•− radical anion (see below). The Hn7981 sample, which also contains S2•−, does not show luminescence because of the presence of significant amounts of the Fe3+ cations which are an effective luminescence quencher.
Another specific feature of the Raman spectrum of the LSh sample is the presence of the strong bands at 331 and 681 cm−1 which are absent in the Raman spectra of other samples and correspond to symmetric and antisymmetric stretching vibrations of the chain-like cis-S4 molecule [32]. It is to be noted that the LSh sample differs from other samples studied in this work by the position of the IR active band of the cis-S4 molecule in the range of 650–658 cm−1 (Figure 6).
The assignment of Raman bands in the samples studied in this work (Table 2) was made based on literature data [21,28,30,31,32,43,44]. In particular, it was taken into account that the S3•− radical anion (a blue chromophore) is characterized by a series of characteristic bands in the ranges of 245–265, 543–550, and 578–585 cm−1 (bending, symmetric stretching and antisymmetric stretching fundamentals, respectively) [21,30,44] as well as a series of rather strong bands of overtones and combination modes. The high intensities of overtones may be due to partial absorption of the laser light resulting in the Resonance Raman effect. It was also shown by means of quantum chemistry methods that fundamental modes of the most stable cis-conformer of free S4•− radical anion correspond to the Raman shifts of 277–286, 284–296, 583–587, and 609–610 cm−1 (the band at 583–587 cm−1 is IR active) [32]. Corresponding predicted ranges of wavenumbers for the free cis-S4 molecule are 319–334, 326–339, 655–659, and 684–688 cm−1 whereas for the nonplanar gauche-conformer of S4 in sodalite cage wavenumbers in the range 533–577 cm−1 are predicted [32]. The bands at 588–589 cm−1 in Raman spectra of green and blue lazurite have been assigned to stretching vibrations of the S2•− radical anion (a yellow chromophore) [30]. Analogous weak bands (at 580 and 605 cm−1) are observed in the Raman spectrum of yellow F-dominant sodalite-group mineral (Figure 11) with the empirical formula (Na5.86K0.82Ca0.10)(Si6.34Al5.66O24)F0.83Cl0.17[SO4,(S2•−)0.5]0.17(CO2)0.36·nH2O [21].
The ESR spectrum of the MD sample (see below) indicates possible presence of the SO3•− radical anion which is a blue chromophore, along with S3•− [30]. However, the strongest bands in the Raman spectrum of this sample correspond to SO42− and S3•−. According to a previous research [32], a weak indistinct feature at 510 CM–1 in the Raman spectrum of the LSh sample may be due to a minor admixture of gauche-S4•− in sodalite cages containing Cl.

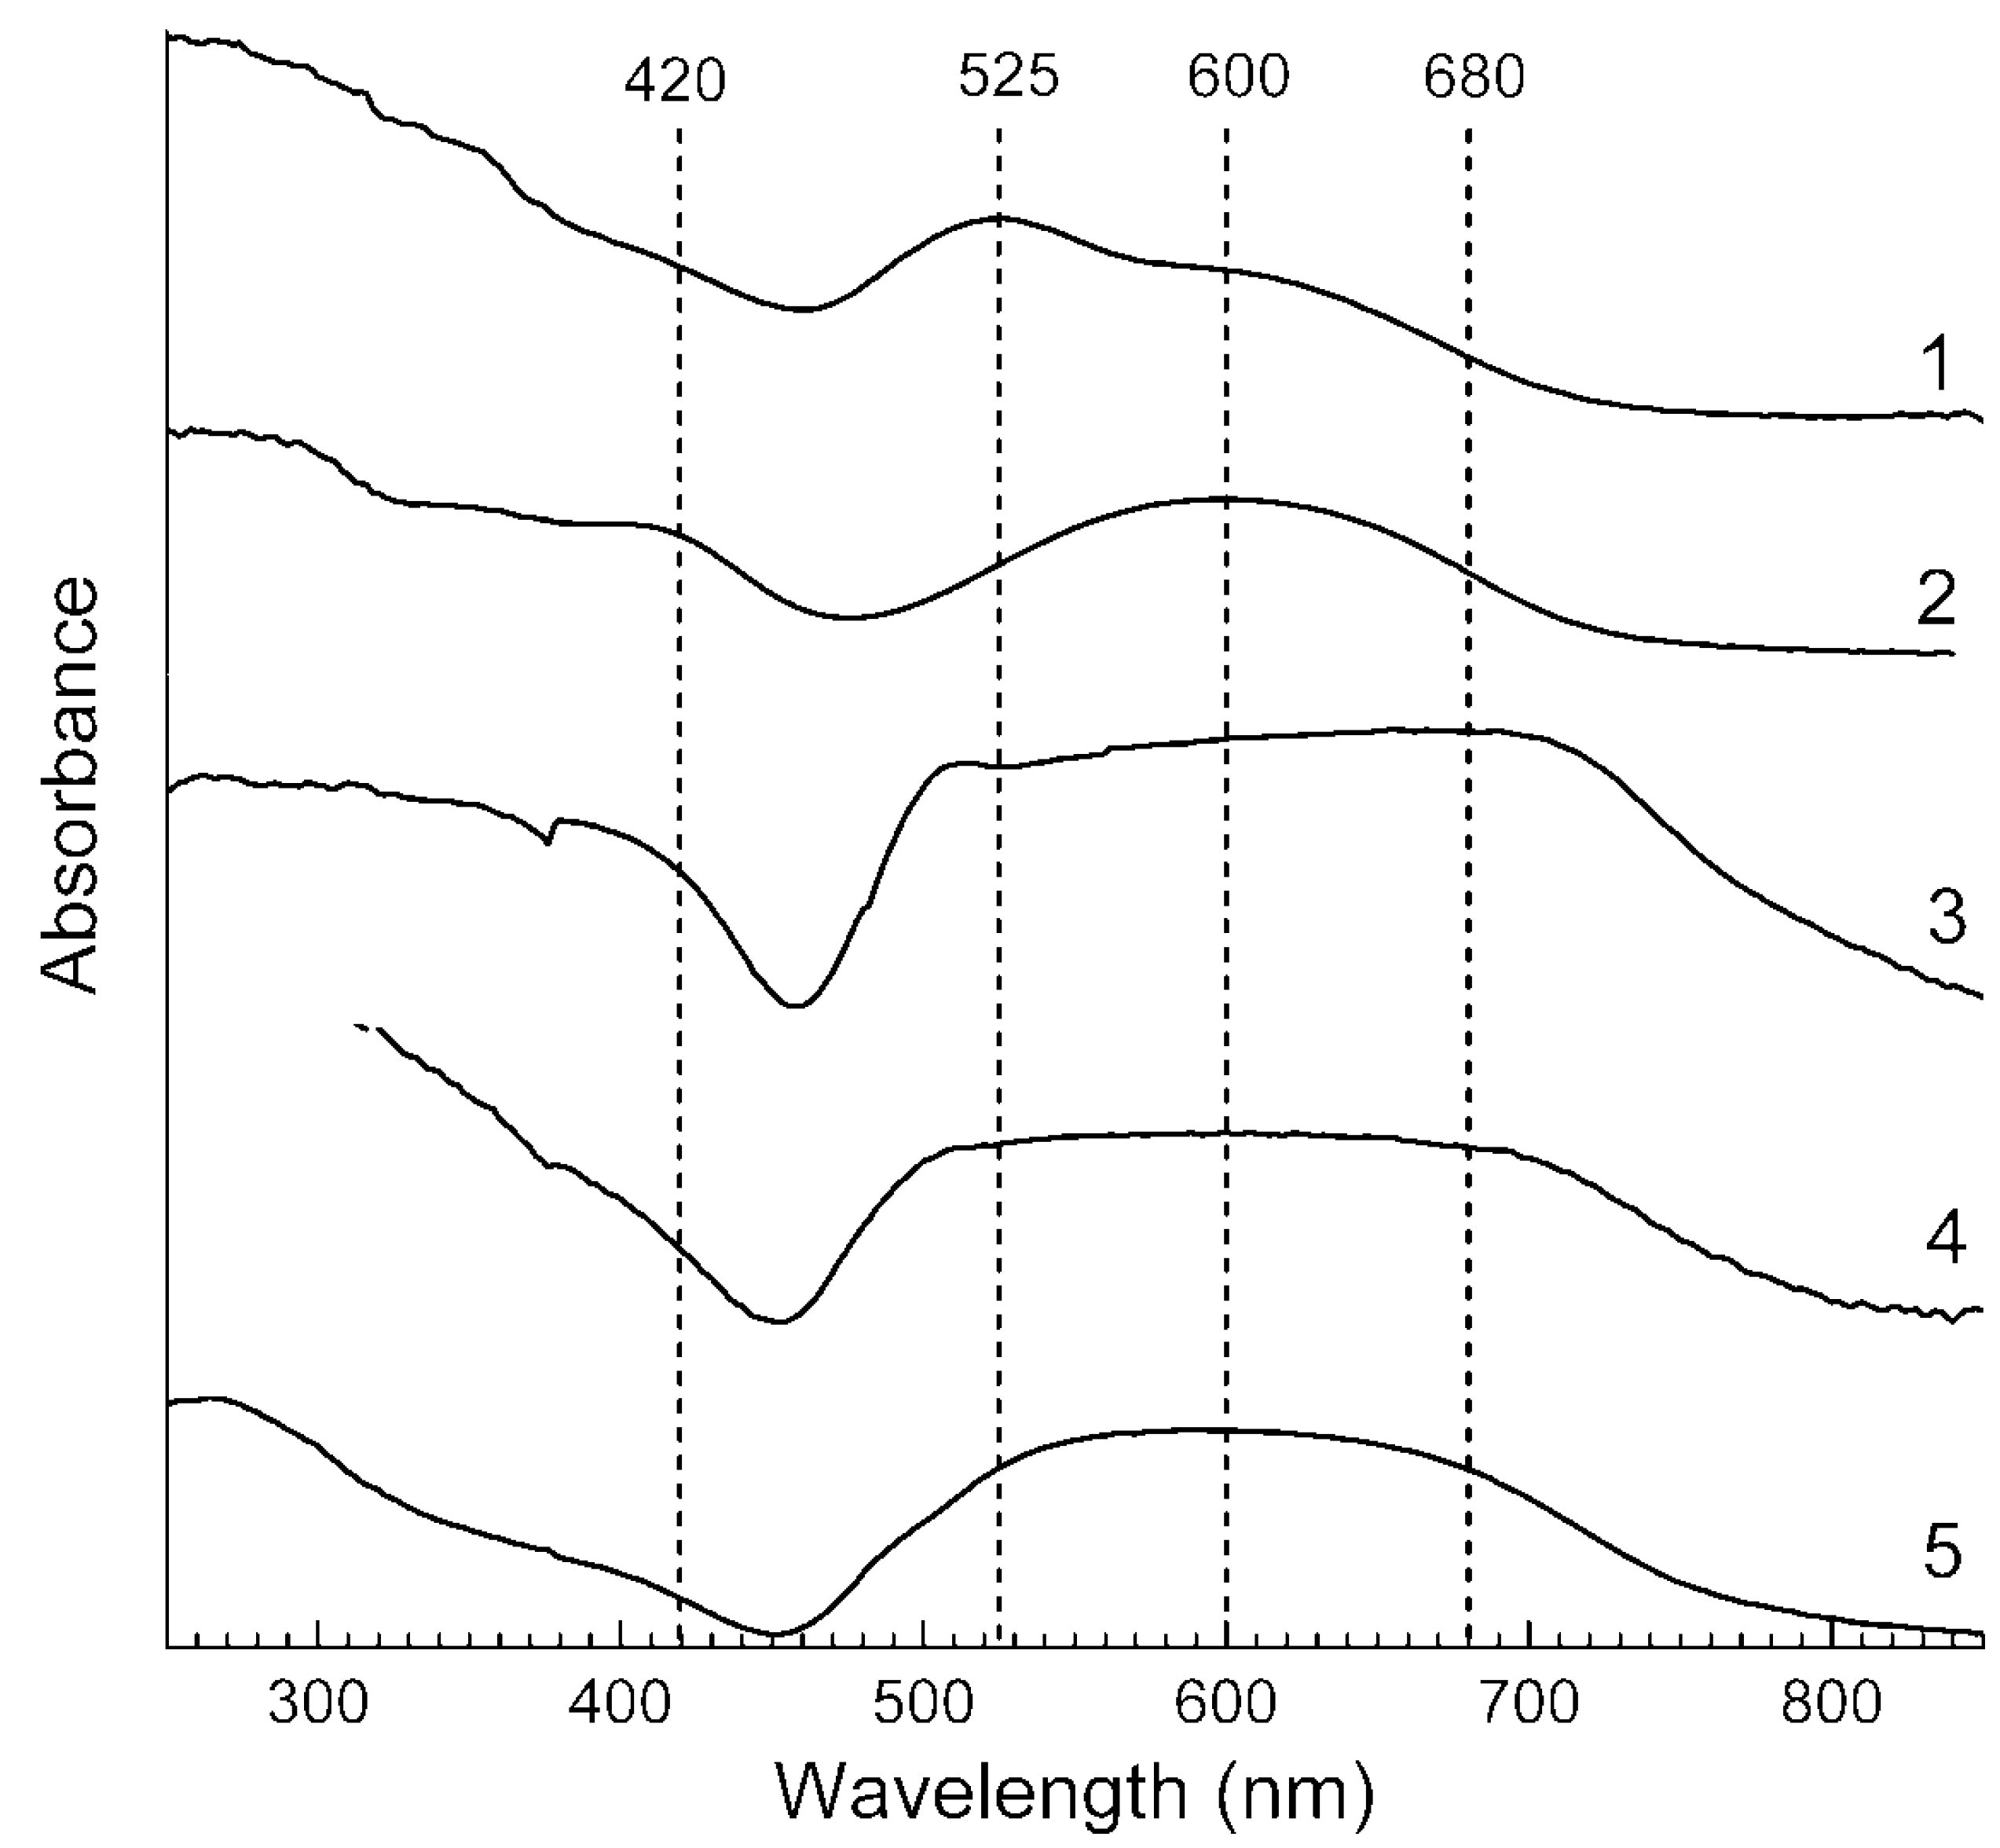
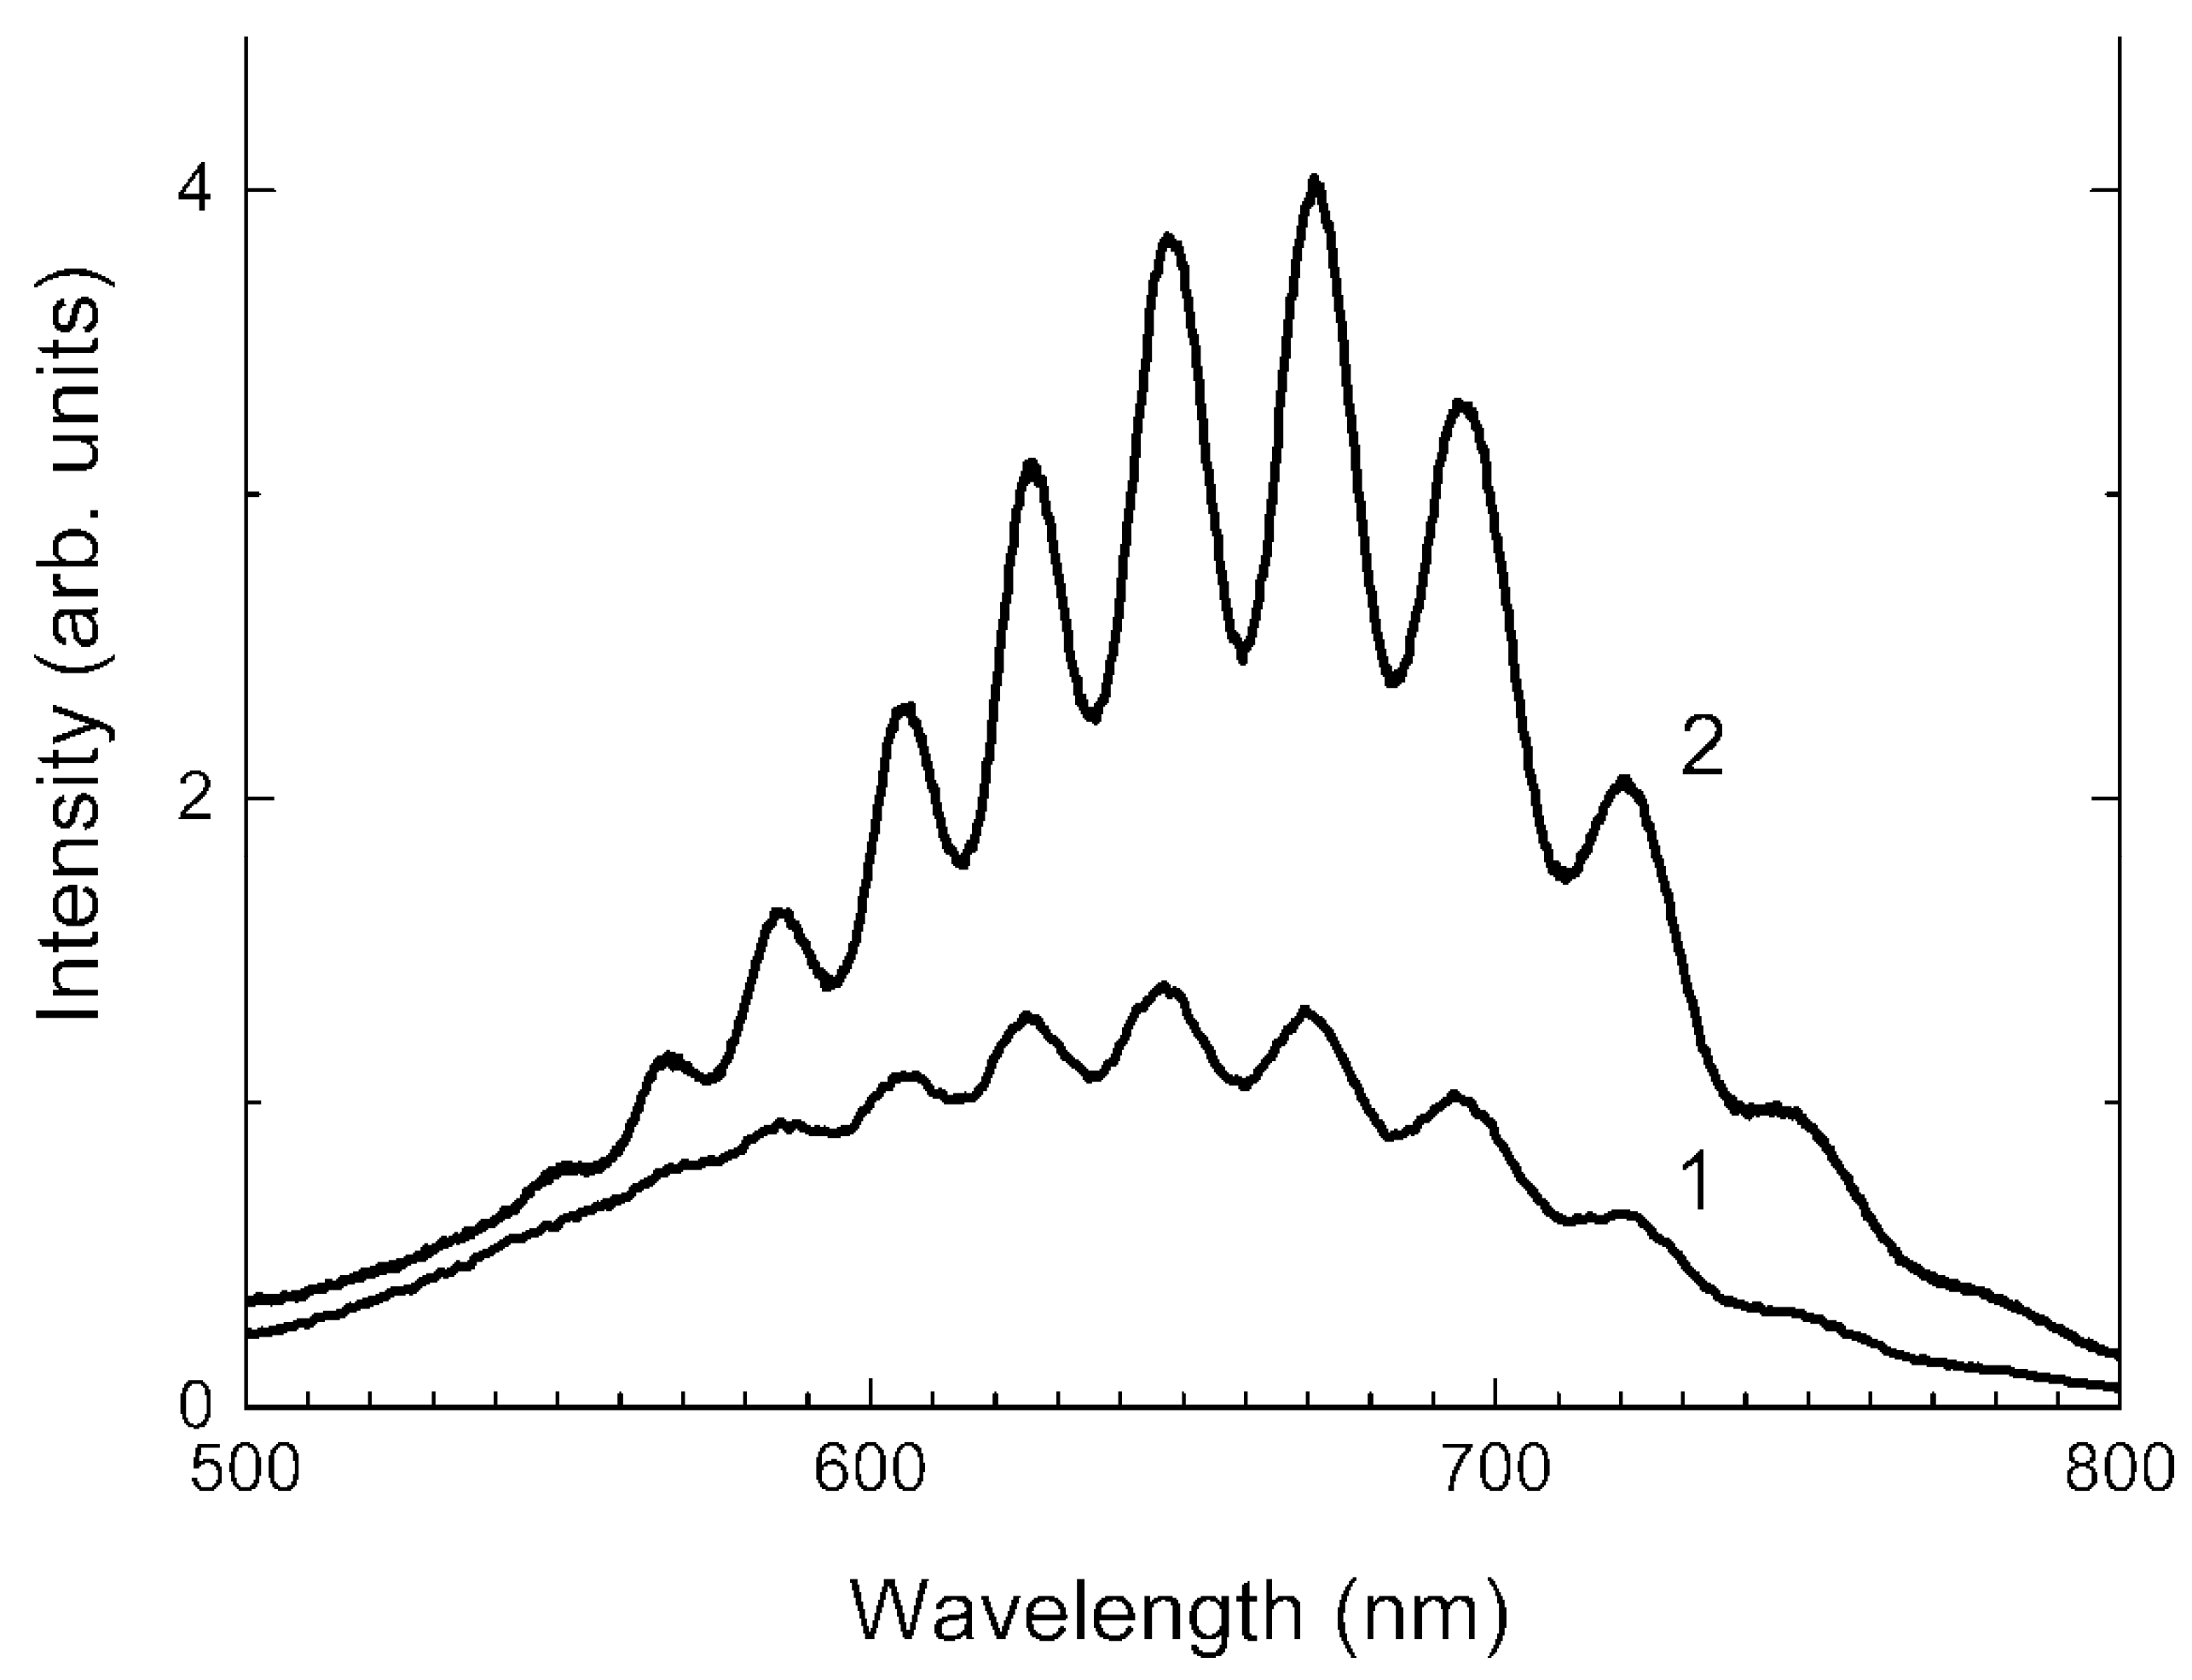
3.4. Absorption Spectra in the Range of 250–1000 nm

Diffuse-light optical absorption spectra of sodalite-group minerals from lazurite deposits in the visible and near UV ranges are given in Figure 12. In the absorption spectra of blue PH and KL samples, a broad table-like absorption band is observed in the 450–800-nm region. It obviously consists of several absorption bands, but it is impossible to resolve its structure even when measuring the absorption at a temperature of 77 K. In the wavelength range below 450 nm, a smooth rise is observed associated with the Urbach edge of the fundamental absorption of lazurite-related minerals. The spectrum of the ZK sample contains a broad absorption band with a maximum at about 600 nm. The width of this band at its half height (FWHM = 200 nm) is smaller than that in the spectra of the PH and KL samples (FWHM = 300 nm).
The absorption spectra of the LSh and MD samples have a more pronounced structure. In the spectrum of the LSh sample, two local absorption maxima can be distinguished at 525 and 600 nm. The absorption band at 525 nm can be associated with the S4 neutral molecule (the C2v conformer [32,41]). The absorption spectrum of the MD sample contains bands with distinct absorption maxima at 420 and 600 nm and a weakly pronounced maximum at 680 nm. Upon excitation with 420 nm radiation, the LSh and MD samples exhibit characteristic luminescence in the yellow-red region of the spectrum, 530–700 nm. The luminescence spectrum has a vibrational structure with a distance between the satellites of about 590 cm−1. When the sample is cooled to 77 K, the vibrational structure becomes more pronounced (Figure 13). The observed luminescence and absorption at 420 nm are associated with the S2•− centers [45].

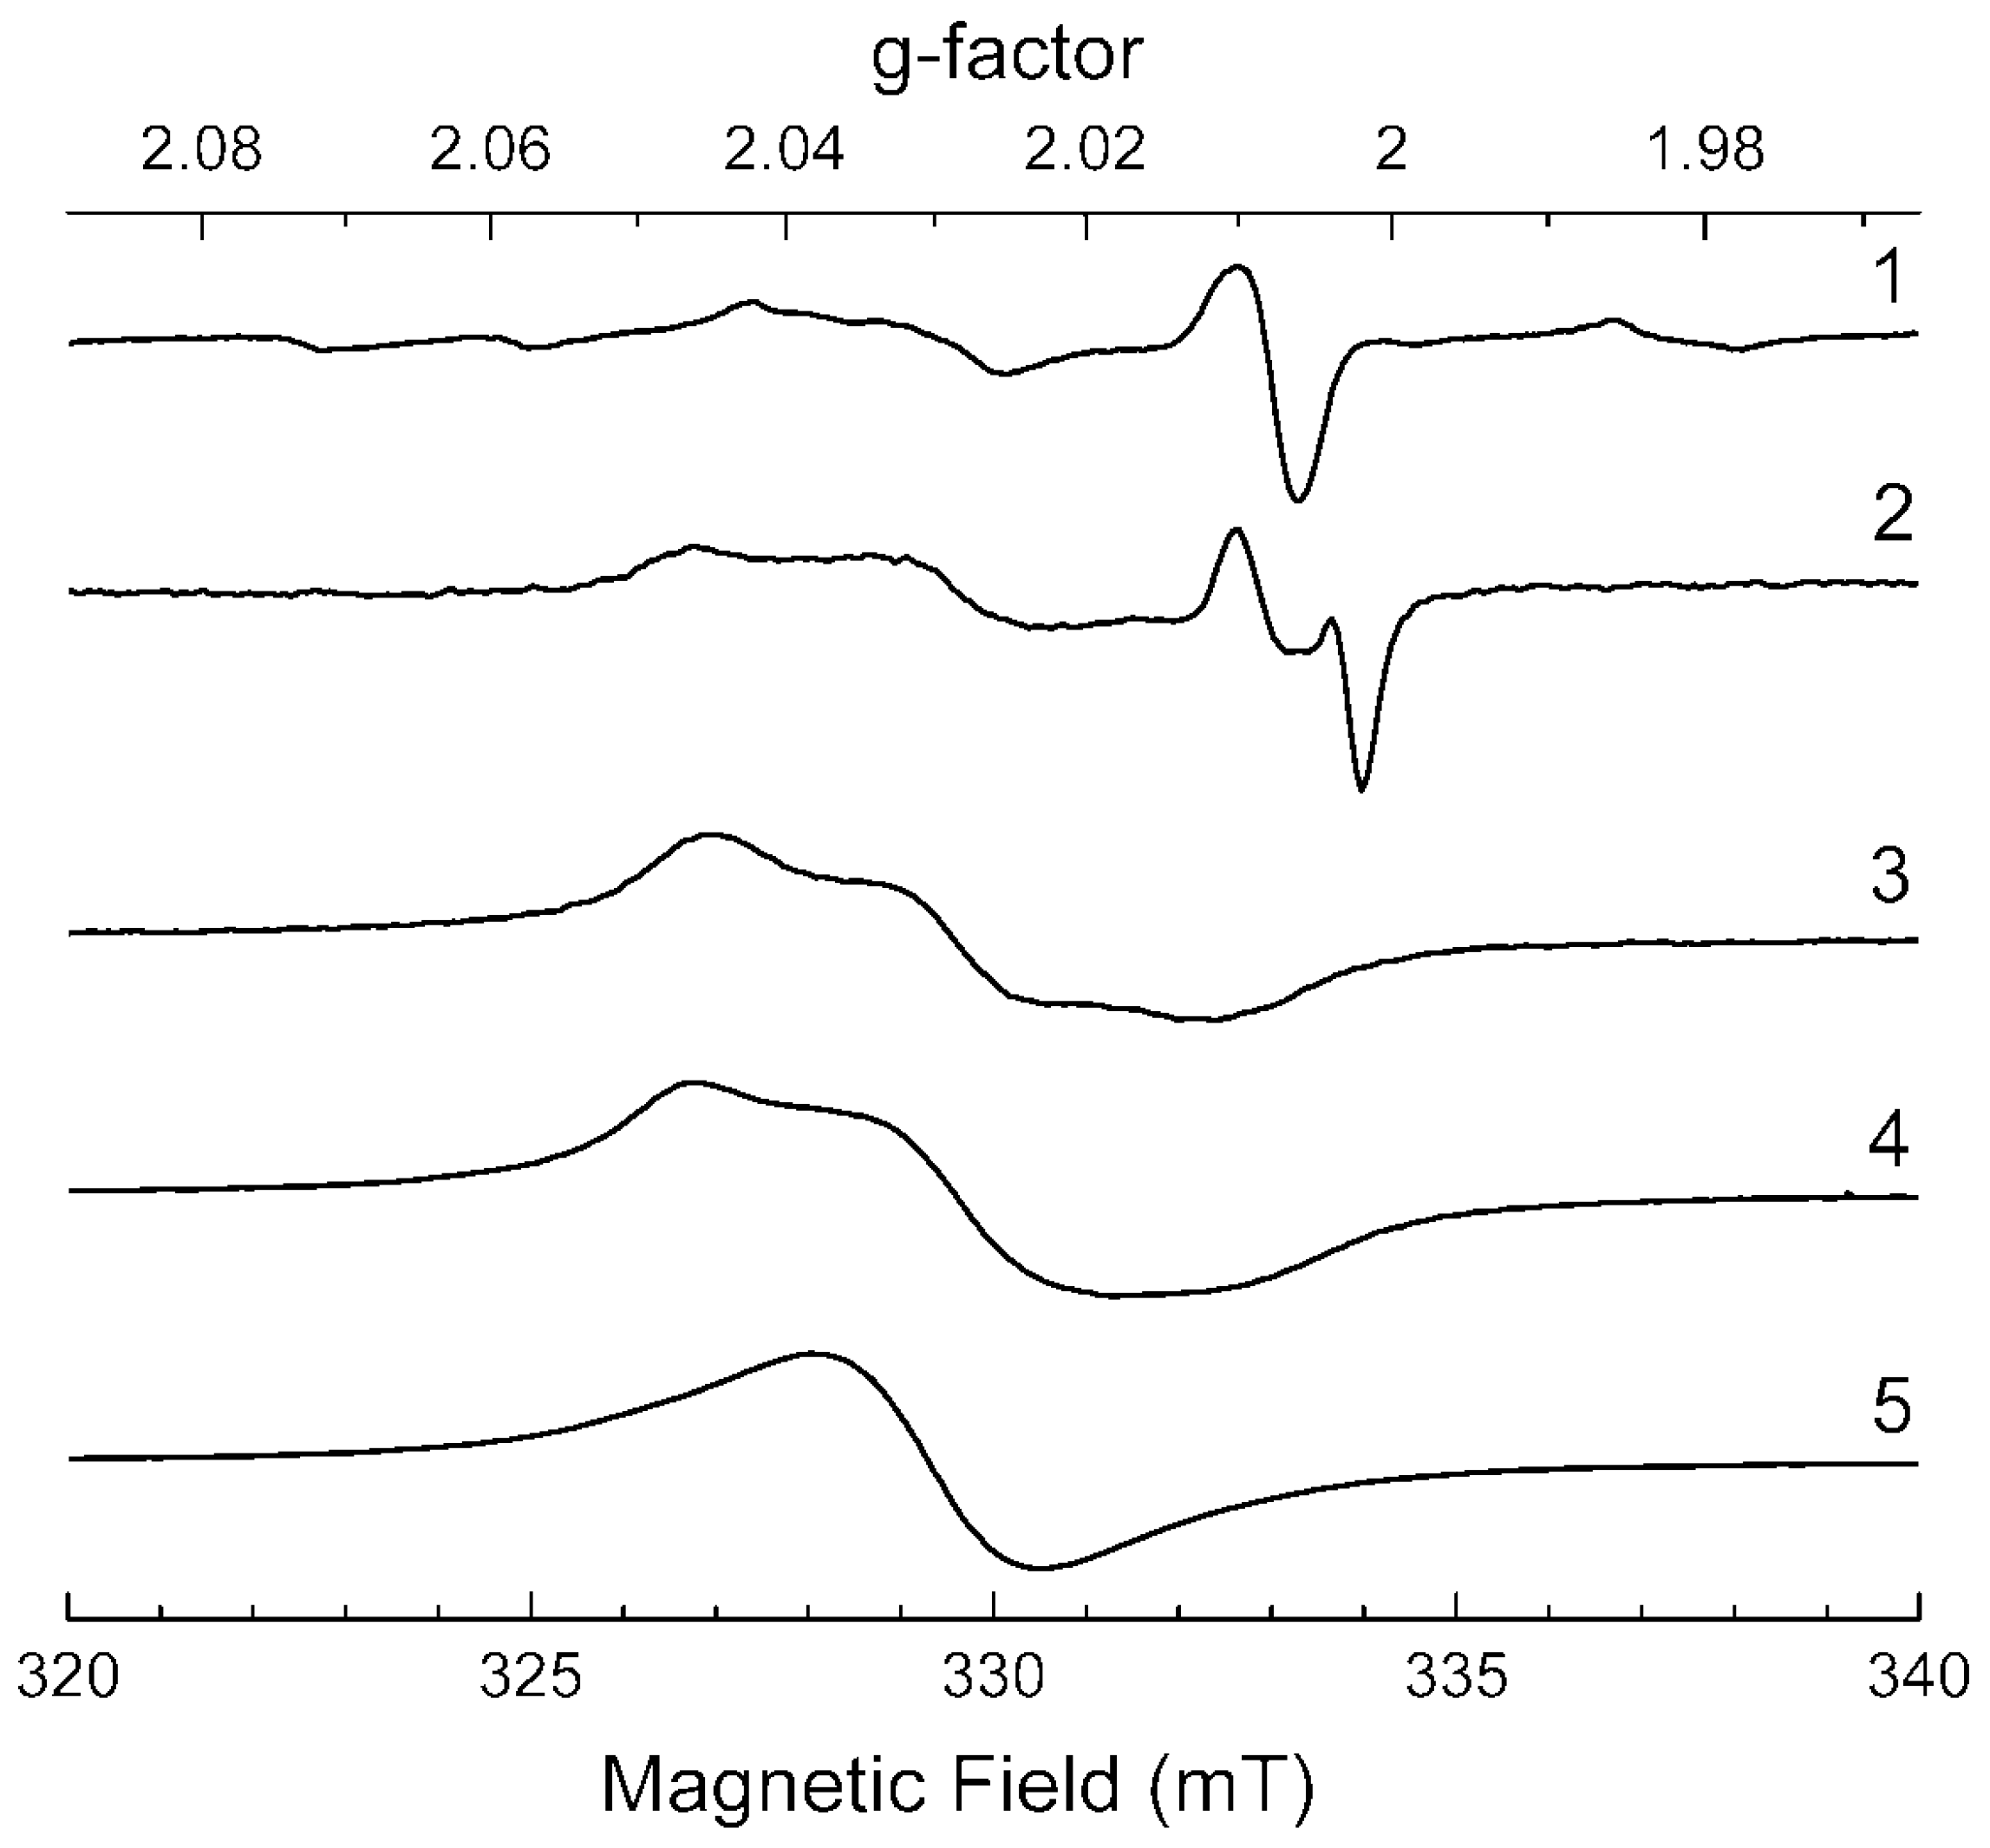
3.5. ESR Spectroscopy

The ESR spectra of the KL and PH samples have similar broad bands with the g-factors of 2.046, 2.030, and 2.012 (Figure 14). In the spectra of the samples cooled to 77 K, these bands are only slightly resolved. The observed ESR signal is typical of many samples of lazurite-related minerals and ultramarine and is associated with the S3•− radical anion [46]. The ESR spectrum of the ZK sample contains one broad band with a g-factor of 2.030. This signal is also associated with the S3•− centers [8,47]. It is noted [46] that the presence of a single isotropic band in the ESR spectrum of ultramarine samples with a high sulfur content is associated with the presence of the S3•− radical anions having the same local environment in sodalite cages. The observed structure of the ESR spectra of the PH and KL samples can be explained by different degree of distortion of S3•− radical anions due to their different local environments. This can also be responsible for the plateau-like absorption of the spectra of these samples in the visible region. The absorption with a maximum at 600 nm in the spectrum of the ZK sample corresponds to the transition from the ground state 2B1 of S3•− to the excited state, 2A2. The transition to the 2A1 state, which corresponds to a wavelength of 690 nm, is also possible. This transition may be related to the red edge in the absorption spectrum.
In the LSh and MD samples, the ESR signal is an order of magnitude weaker than in PH, KL, and ZK. A weak signal from S3•− centers is observed in the ESR spectrum of the LSh sample. In the ESR spectrum of the MD sample, this signal has a higher intensity, which also correlates with the absorption spectrum: the intensity of the band with a maximum at 600 nm in the spectrum of MD is higher than in the spectrum of LSh. Additionally, in both samples, absorption with a g-factor of 2.008 is observed, which may be due to the S2•− radical anion [48]. This assumption is confirmed by the luminescence spectra. In the ESR spectrum of the MD sample, one more band was recorded with a g-factor of 2.002. This signal is close to the signal of a free electron and can be associated both with an anion vacancy that has captured an electron [49] and with the SO3•− paramagnetic center [50]. This signal practically does not change during cooling.

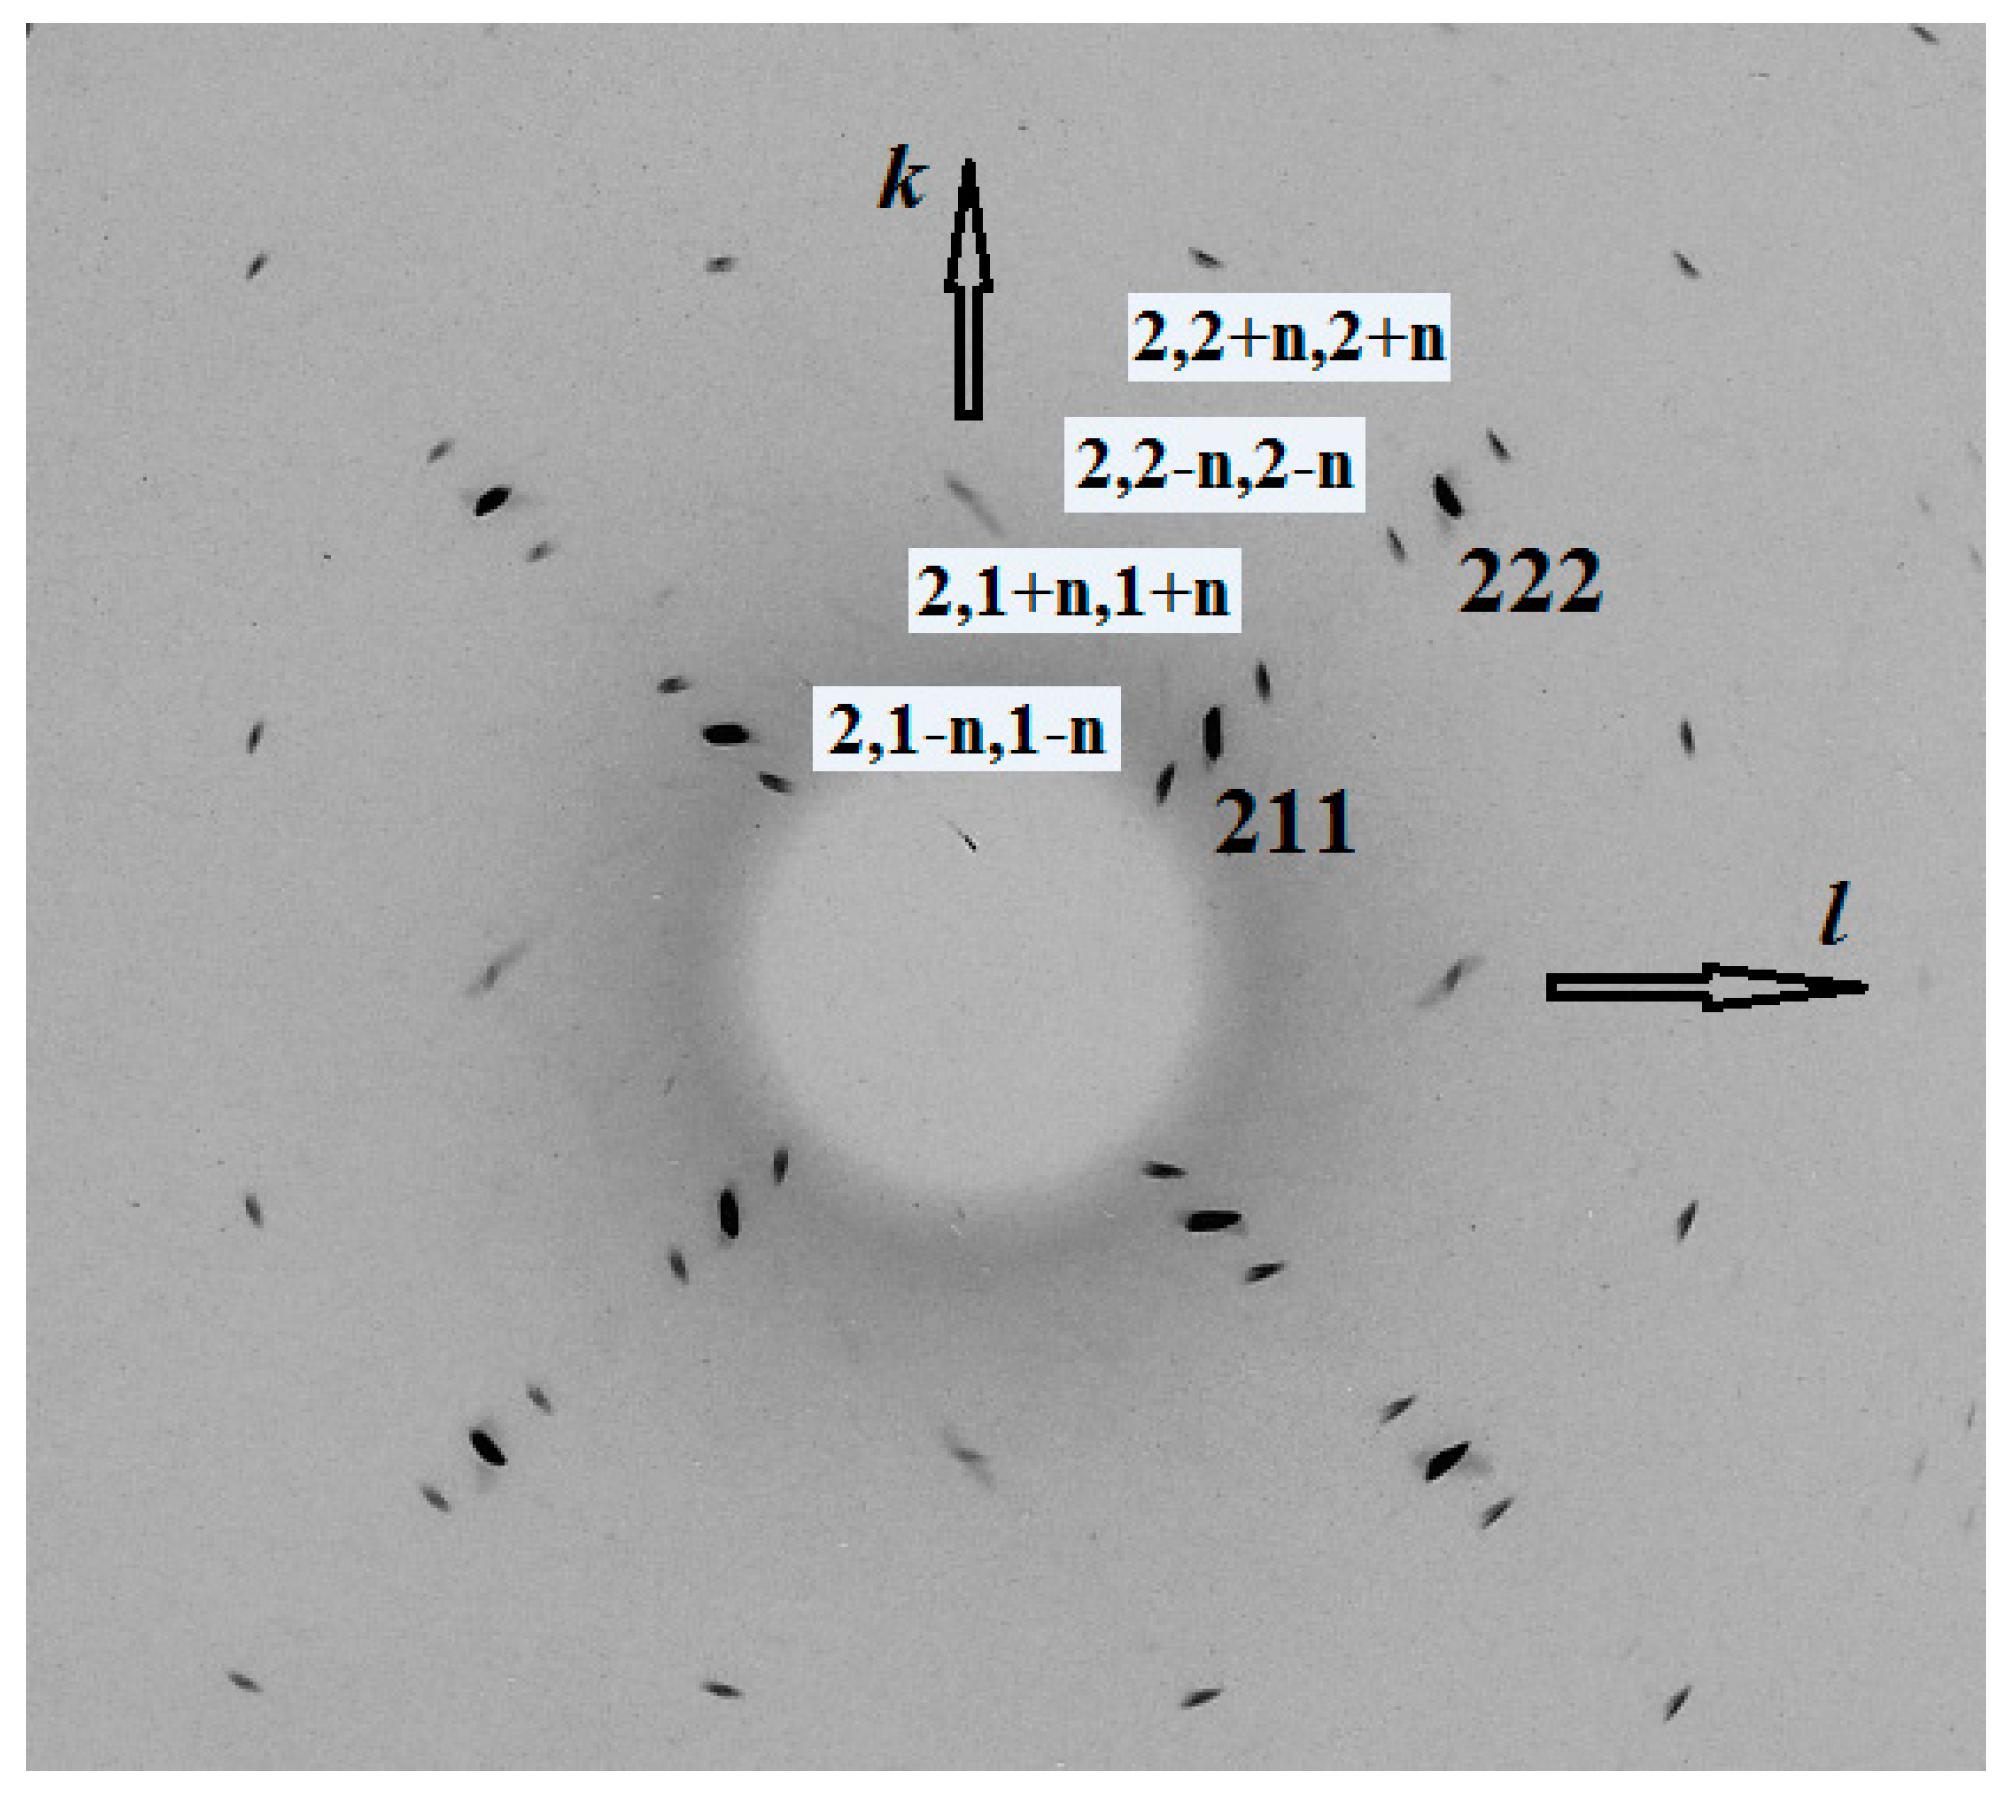
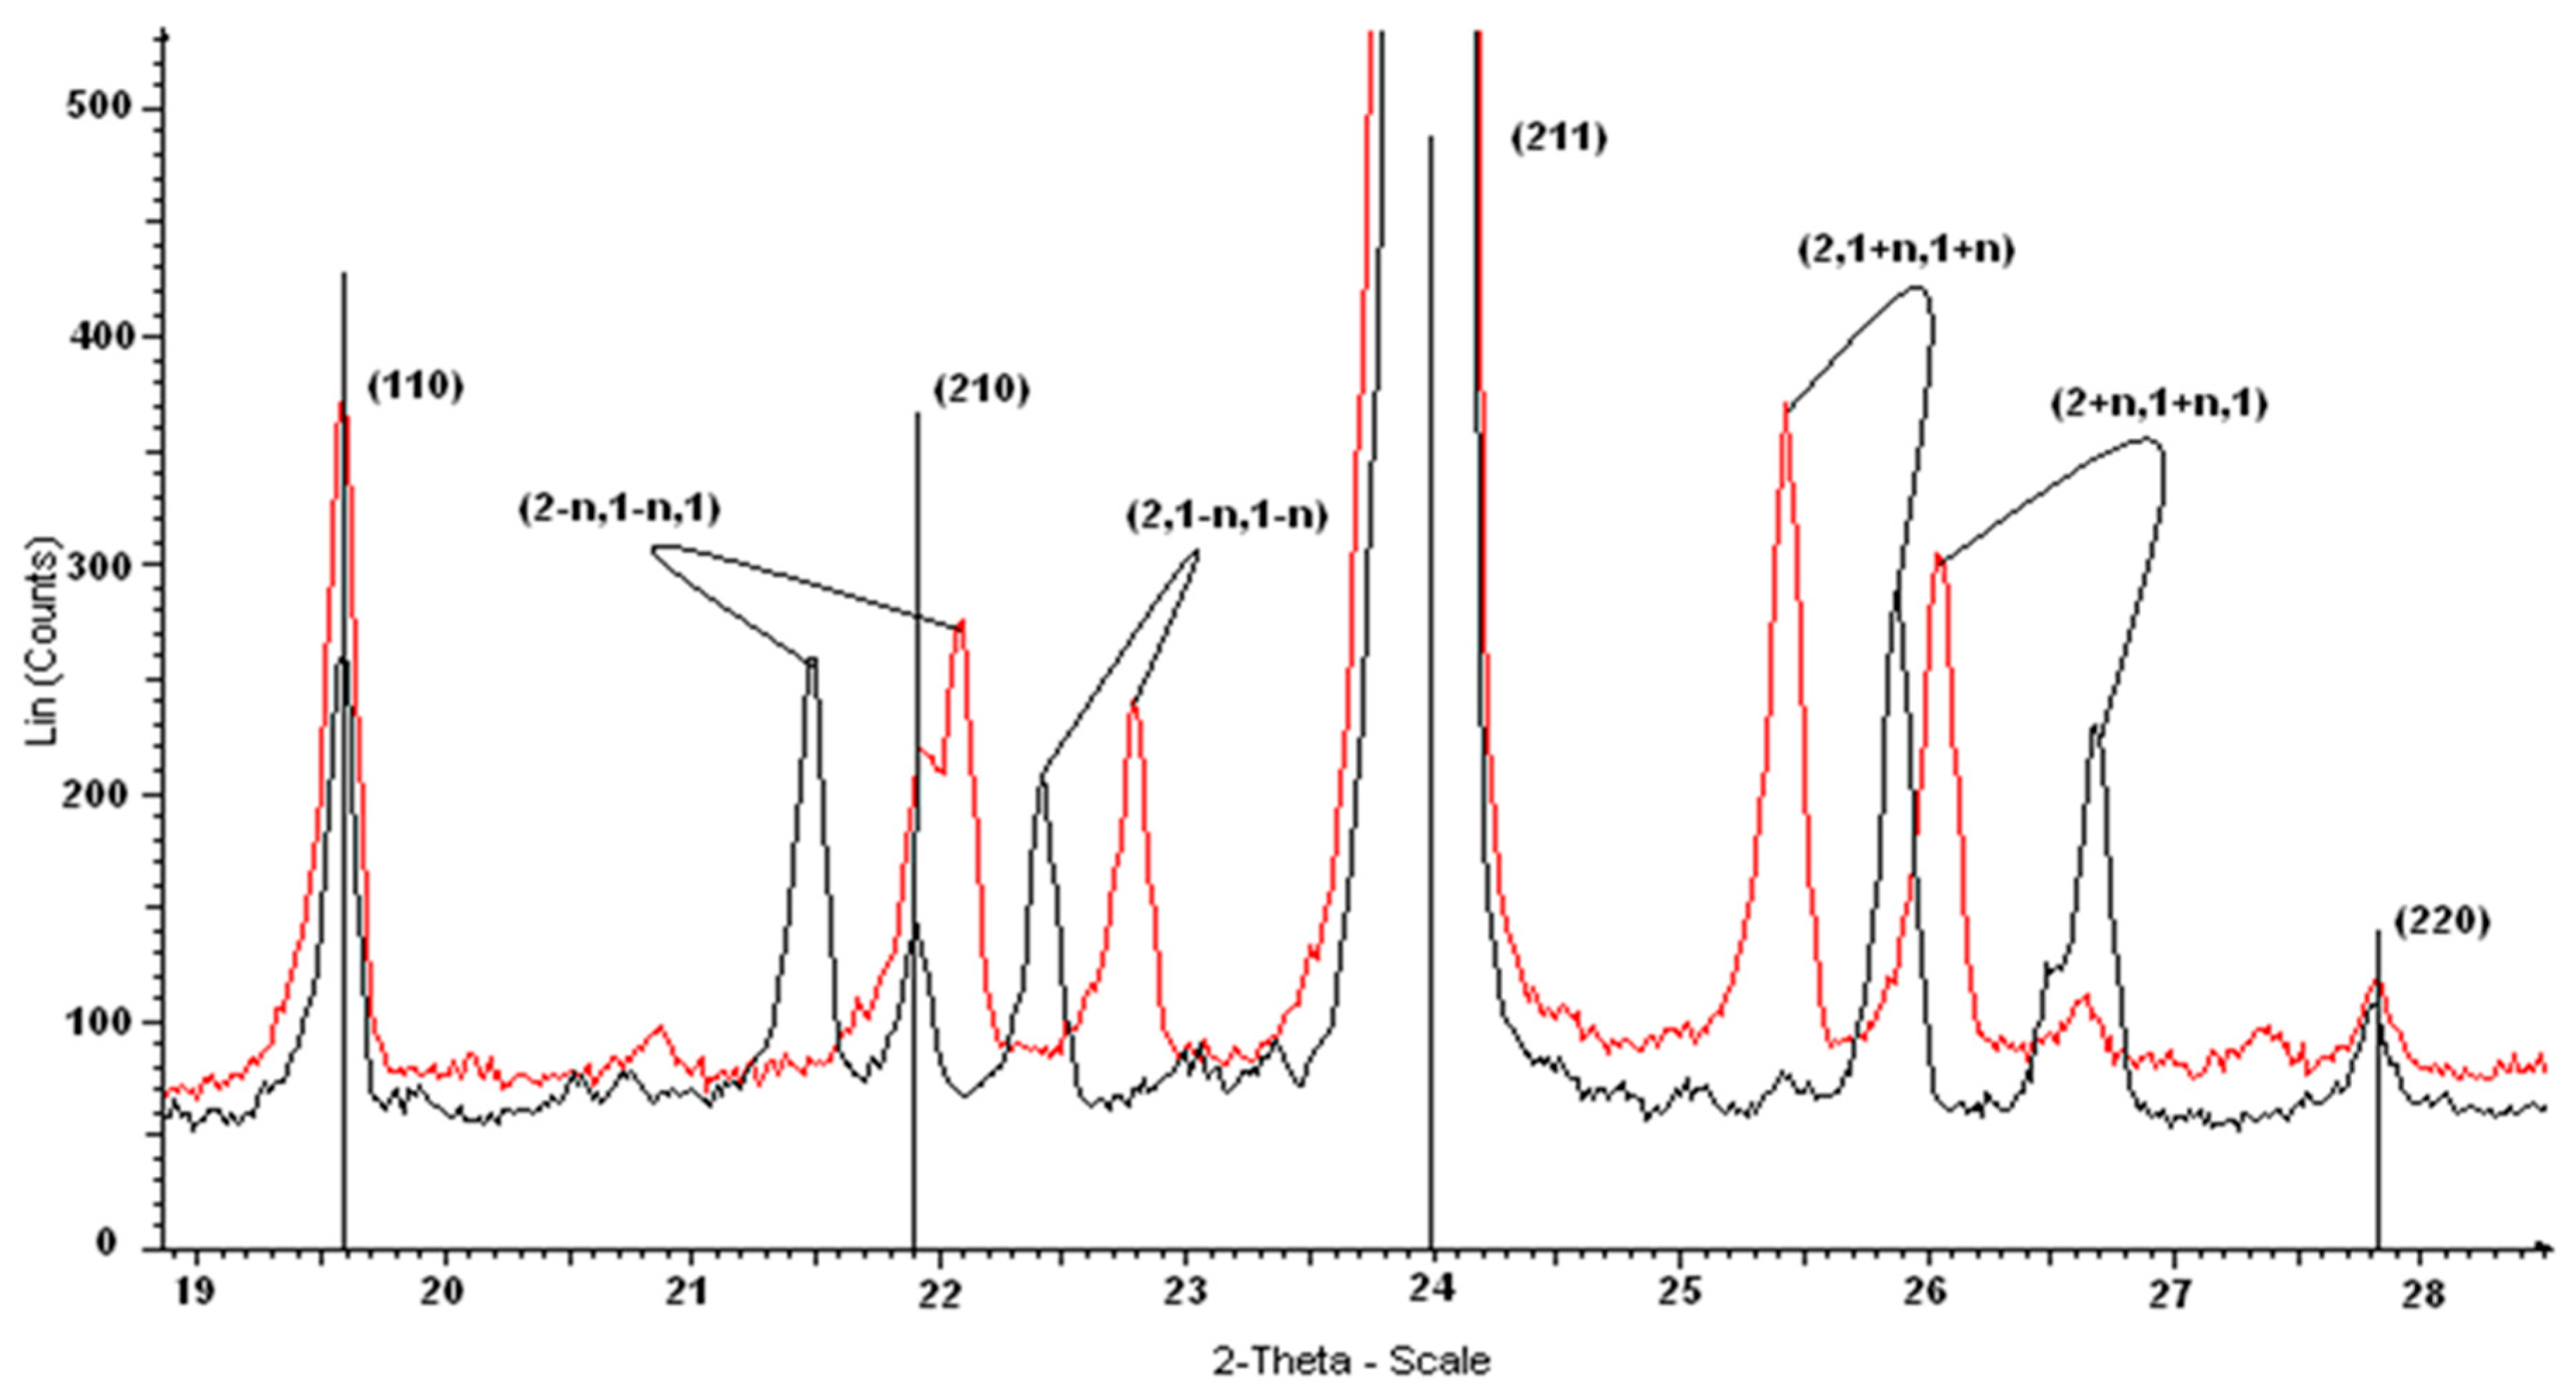
3.6. X-Ray Diffraction

The X-ray diffraction patterns of all samples of sodalite-group minerals from lazurite deposits studied in this work contain basic and superstructure reflections. Basic reflections correspond to cubic pseudo-cells and space group P-43n. Superstructure reflections observed as satellites of the basic reflections (Figure 15 and Figure 16) define the kind of incommensurate modulation which cannot be described by integer hkl indices, unlike commensurate modulation when X-ray diffraction pattern can be described by integer hkl indices of an unit cell with a cell parameter being multiple of the basic a parameter. The modulation parameter n is determined by the displacement of the satellite from the main reflection along the reciprocal lattice axis.
Analysis of powder diffraction patterns showed that the distribution pattern of satellites in the samples studied in this work is the same as in the previously studied lazurite from the Baikal Lake region and Afghanistan [51]. The only difference is in the value of the modulation parameter. The n parameters of the samples LSh, PH, and MD are close to each other and are equal to 0.218, 0.218, and 0.214, respectively. The samples KL and ZK are characterized by different n values, 0.164 and 0.147, respectively. The powder X-ray diffraction pattern of the ZK sample has been discussed in detail elsewhere [8]. Powder data for the samples MD and KL are given in Table 3 and Table 4. The calculated interplanar distances of the satellites (ds) were obtained from the modified quadratic form for cubic crystals: ds–2 = [(h ± n)2 + (k ± n)2 + l2]: a2 where a is the parameter of the cubic pseudo-cell calculated from the basic reflections; h, k, and l are the indices of the main reflection, near which a given satellite is located; n is the incommensurate modulation parameter.
The powder X-ray diffraction pattern of the MD sample (Table 3) contains superstructure reflections of two types, which correspond to commensurate and incommensurate superstructures. A small number of reflections of a commensurate superstructure are observed, lying between the rows of the main reflections, at equal distances from them (these reflections correspond to the d values of 4.859, 4.139, 3.862, 3.111, and 2.943 Å (Table 3). More than half of the total number of lines in the diffraction pattern of the MD sample are satellites corresponding to an incommensurate superstructure. A low value of the reliability index R = [Σ(|dmeasdcalc|)]P–1 = 0.002 Å (where P is the total number of satellites) indicates constancy of incommensurate displacement of all satellites from the main reflections.
In Table 4, three quarters of the total number of lines in the diffraction pattern of the KL sample are satellites. The value of the reliability index calculated using the value of the parameter of incommensurate modulation n = 0.164, refined from the powder X-ray diffraction pattern, is R = 0.001 Å. If the superstructure were considered as commensurate (n = 1/6), then the calculated value of R would be equal to 0.002 Å, which is twice as high as the above result. Thus, the superstructure in the KL sample is incommensurate.

4. Discussion

The empirical formulae of most sodalite-group minerals from gem lazurite deposits, being calculated under the assumption that all sulfur belongs to the SO42− anion, are not charge balanced. Excessive negative charge varies in wide ranges and can reach –3. Charge-balanced formulae can be obtained only involving polysulfide species (S2•−, S3•−, S4•−, S4), COS, or SO3•− radical anion. Application of a combination of spectroscopic methods makes it possible to identify the S-bearing species, which are most abundant in a given sample.
Following an established tradition, the name “lazurite” is usually applied to blue sulfur-bearing minerals of the sodalite group, or even to all sulfur-rich sodalite-group minerals from lapis lazuli deposits, independent of their color. However, according to the nomenclature of minerals accepted by the International Mineralogical Association [18], cubic members of the sodalite group with the idealized formulae Na6Ca2(Si6Al6O24)(SO4)2 and Na8(Si6Al6O24)(SO4)·H2O should be named haüyne and nosean, respectively. The border between these mineral species corresponds to the formula Na7Ca(Si6Al6O24)(SO4)1,5·nH2O where H2O is not a species-defining component whose content is variable. Thus, all samples studied in this work, except ZK whose idealized formula is Na7Ca[Al6Si6O24](SO4)(S3•−)·H2O [8], are varieties of haüyne with minor admixtures of anions other than SO42−. It is significant that sulfide-rich lazurite ZK associates with bystrite, which is the only cancrinite-group mineral containing sulfide sulfur as a species-defining component.
As noted above, the radical anion ion S3•− is considered by most researchers as the main cause of blue color of lazurite and related sodalite-group minerals. Our data confirm this conclusion.
Typical haüyne samples from effusive rocks have simple cubic structures without modulation. On the contrary, commensurate or incommensurate modulation is a specific feature of most sodalite-group minerals from gem lazurite deposits.
Numerous observations of special relationships between silicate minerals in samples from gem lazurite deposits situated in Afghanistan and Tajikistan show that most S3•−-rich and SO42−-depleted lazurite crystallized at the latest stages of metasomatism. In particular, this lazurite variety forms epitaxy on earlier cancrinite- and sodalite-group minerals or pseudomorphs after phlogopite (Figure 17, Figure 18 and Figure 19). The fact of epitaxy was established by us based on the cleavage direction. In mineral assemblages containing S3•−-rich lazurite ZK (earlier described in detail in [8]), grains of forsterite and pyroxene are corroded by lazurite, and some lazurite crystals formed as a result of recrystallization of an initial sodalite-group mineral.
Hypothetically, anionic and neutral extra-framework components (Cl, OH, F, AlF63–, SO42−, S2−, S3, CO32−, C2O42−, CO2, H2O, CH4 etc.) occurring in β-cages of minerals belonging to the sodalite and cancrinite groups could be used as important geochemical markers [21,22,23], and the SO42−/S3•− ratio may be an indication of oxygen and sulfur dioxide fugacities during mineral formation [23]. Based on this hypothesis, we can suppose that there are indications of a high activity of sulfur and low oxygen fugacity at latest stages of the formation of lazurite-bearing assemblages at these localities.

Author Contributions

N.V.C., A.N.S., and R.S. wrote the paper. N.V.C. obtained and interpreted the IR spectra and obtained a part of the chemical data. M.F.V. obtained and interpreted the Raman spectra. R.Y.S. obtained and interpreted the ESR and UV-Visible spectra. A.N.S. obtained X-ray diffraction data, and interpreted compositional and X-ray diffraction data. All authors have read and agreed to the published version of the manuscript.

Funding

This work was supported by the Russian Foundation for Basic Research, grant no. 18-29-12007-mk. A part of this work (IR spectroscopy and a part of chemical analyses) has been carried out in accordance with the state task, state registration number AAAA-A19-119092390076-7.

Acknowledgments

The optical absorption, luminescence and ESR spectra, and microprobe analysis were carried out using facilities of the Center for Collective Use (“Center for isotopic-geochemical investigations” at the Vinogradov Institute of Geochemistry SB RAS. The authors are grateful to N.B. Vladykin for the KL sample provided for the investigations.

Conflicts of Interest

The authors declare no conflict of interest.

References

  1. Taylor, D. The sodalite group of minerals. Contr. Mineral. Petrol. 1967, 16, 172–188. [Google Scholar] [CrossRef]
  2. Sahl, K.; Chatterjee, N.D. The crystal structure of bicchulite, Ca2[Al2SiO6](OH)2. Z. Krist. 1977, 146, 35–41. [Google Scholar] [CrossRef]
  3. Sahl, K. Refinement of the crystal structure of bicchulite, Ca2[Al2SiO6](OH)2. Z. Krist. 1980, 152, 13–21. [Google Scholar] [CrossRef]
  4. Uchida, E.; Iiyama, J.T. On kamaishilite, Ca2Al2SiO6(OH)2; A new mineral (tetragonal), dimorphous with bicchulite, from the Kamaishi mine, Japan. Proc. Jpn. Acad. 1981, 57B, 239–243. (In English) [Google Scholar] [CrossRef] [Green Version]
  5. Peterson, R.C. The structure of hackmanite, a variety of sodalite, from Mont St-Hilaire, Quebec. Can. Mineral. 1983, 21, 549–552. [Google Scholar]
  6. Hassan, I.; Grundy, H.D. The crystal structures of sodalite-group minerals. Acta Cryst. 1984, 40, 6–13. [Google Scholar] [CrossRef]
  7. Hassan, I.; Buseck, P. Cluster ordering and antiphase domain boundaries in hauyne. Can. Mineral. 1989, 27, 173–180. [Google Scholar]
  8. Sapozhnikov, A.N.; Tauson, V.L.; Lipko, S.V.; Shendrik, R.Y.; Levitskii, V.I.; Suvorova, L.F.; Chukanov, N.V.; Vigasina, M.F. On the crystal chemistry of sulfur-rich lazurite, ideally Na7Ca(Al6Si6O24)(SO4)(S3)nH2O. Am. Mineral. 2020. [Google Scholar] [CrossRef]
  9. Hassan, I.; Peterson, R.C.; Grundy, H.D. The structure of lazurite, ideally Na6Ca2(Al6Si6O24)S2, a member of the sodalite group. Acta Cryst. C 1985, 41, 827–832. [Google Scholar] [CrossRef]
  10. Gobeltz-Hautecoeur, N.; Demortier, A.; Lede, B.; Lelieur, J.P.; Duhayon, C. Occupancy of the sodalite cages in the blue ultramarine pigments. Inorg. Chem. 2002, 41, 2848–2854. [Google Scholar] [CrossRef]
  11. Bellatreccia, F.; Della Ventura, G.; Piccinini, M.; Cavallo, A.; Brilli, M. H2O and CO2 in minerals of the hauyne-sodalite group: A FTIR spectroscopy study. Mineral. Mag. 2009, 73, 399–413. [Google Scholar] [CrossRef]
  12. Fechtelkord, M. Structural study of Na8[AlSiO4]6(CO3)x(HCOO)2-2x(H2O)4x, 0.2 ≤ x ≤ 1, synthesized in organic solvents: Order and disorder of carbonate and formate anions in sodalite. Microporous Mesoporous Mater. 1999, 28, 335–351. [Google Scholar] [CrossRef]
  13. Gesing, T.M.; Buhl, J.C. Crystal structure of a carbonate-nosean Na8[AlSiO4]6CO3. Eur. J. Mineral. 1998, 10, 71–77. [Google Scholar] [CrossRef]
  14. Yakubovich, O.V.; Kotel’nikov, A.R.; Shchekina, T.I.; Gramenitskiy, E.N.; Zubkov, E.S. New representative in the sodalite structure type with extraframework anions [AlF6]3–. Crystallogr. Rep. 2011, 56, 190–197. [Google Scholar] [CrossRef]
  15. Gramenitskii, E.N.; Kotel’nikov, A.R.; Shchekina, T.I.; Yakubovich, O.V.; Devyatova, V.N.; Zubkov, E.S.; Suk, N.I.; Vigasina, M.F.; Kotel’nikova, Z.A. Composition, structure and conditions of formation of fluorine-containing sodalite (experimental data). Geochem. Int. 2018, 56, 521–534. [Google Scholar] [CrossRef]
  16. Hassan, I.; Grundy, H.D. The crystal structure of basic cancrinite, ideally Na8[Al6Si6O24](OH)2·3H2O. Can. Mineral. 1991, 29, 123–130. [Google Scholar]
  17. Ivanov, V.G.; Sapozhnikov, A.N. Lazurites of the USSR; Nauka: Novosibirsk, Russia, 1985. (In Russian) [Google Scholar]
  18. IMA List of Minerals. Available online: http://cnmnc.main.jp/ (accessed on 22 November 2020).
  19. Deer, W.A.; Howie, R.A.; Wise, W.S.; Zussman, J. Rock-Forming Minerals. Volume 4B. Framework Silicates: Silica Minerals. Feldspathoids and the Zeolites; The Geological Society: London, UK, 2004. [Google Scholar]
  20. Tauson, V.L.; Goettlicher, J.; Sapozhnikov, A.N.; Mangold, S.; Lustenberg, E.E. Sulfur speciation in lazurite-type minerals (Na,Ca)8[Al6Si6O24](SO4,S)2 and their annealing products: A comparative XPS and XAS study. Eur. J. Miner. 2012, 24, 133–152. [Google Scholar] [CrossRef]
  21. Chukanov, N.V.; Vigasina, M.F.; Zubkova, N.V.; Pekov, I.V.; Schäfer, C.; Kasatkin, A.V.; Yapaskurt, V.O. New aspects of the application of infrared and Raman spectroscopy to the characterization of extra-framework components in sodalite-group minerals. Minerals 2020, 10, 363. [Google Scholar] [CrossRef] [Green Version]
  22. Chivers, T.; Elder, P.J.W. Ubiquitous trisulfur radical anion: Fundamentals and applications in materials science, electrochemistry, analytical chemistry and geochemistry. Chem. Soc. Rev. 2013, 42, 5996–6005. [Google Scholar] [CrossRef]
  23. Tauson, V.L.; Sapozhnikov, A.N.; Shinkareva, S.N.; Lustenberg, E.E. Indicative properties of lazurite as a member of clathrasil mineral family. Doklady Earth Sci. 2011, 441, 1732–1737. [Google Scholar] [CrossRef]
  24. Platonov, A.N.; Tarashchan, A.N.; Belichenko, V.P.; Povarennikh, A.S. Spectroscopic study of sulfide sulfur in some framework aluminosilicates. Const. Prop. Miner. 1971, 5, 61–72. (In Russian) [Google Scholar]
  25. Samoilovich, M.I. An ESR study of sulfur-bearing radical ions in minerals. Geokhimiya 1971, 4, 477–483. (In Russian) [Google Scholar]
  26. Steudel, R. Inorganic polysulfides Sn2− and radical anions Sn•−. In Elemental Sulfur und Sulfur-Rich Compounds II. Topics in Current Chemistry; Steudel, R., Ed.; Springer: Berlin/Heidelberg, Germany, 2003; Volume 231. [Google Scholar]
  27. Climent-Pascual, E.; de Paz, J.R.; Rodríguez-Carvajal, E.; Suard, E.; Sáez-Puche, R. Synthesis and characterization of the ultramarine-type analog Na8-x[Si6Al6O24]·(S−2,S−3,CO3)(1–2). Inorg. Chem. 2009, 48, 6526–6533. [Google Scholar] [CrossRef] [PubMed]
  28. Steudel, R.; Chivers, T. The role of polysulfide dianions and radical anions in the chemical, physical and biological sciences, including sulfur-based batteries. Chem. Soc. Rev. 2019, 48, 3279–3319, 4338. [Google Scholar] [CrossRef]
  29. Evsyunin, V.G.; Sapozhnikov, A.N.; Kashaev, A.A.; Rastsvetaeva, R.K. Crystal Structure of Triclinic Lazurite. Crystallogr. Rep. 1997, 42, 938–945. [Google Scholar] [CrossRef]
  30. Ostroumov, E.; Fritsch, E.; Faulques, E.; Chauvet, O. Etude spectrometrique de la lazurite du Pamir, Tajikistan. Can. Mineral. 2002, 40, 885–893. (In French) [Google Scholar] [CrossRef] [Green Version]
  31. Eckert, B.; Steudel, F. Molecular spectra of sulfur molecules and solid sulfur allotropes. Top. Curr. Chem. 2003, 231, 31–97. [Google Scholar] [CrossRef]
  32. Rejmak, P. Computational refinement of the puzzling red tetrasulfur chromophore in ultramarine pigments. Phys. Chem. Chem. Phys. 2020. [Google Scholar] [CrossRef]
  33. Sapozhnikov, A.N. Modulated structure of lazurite from deposits in southwestern Pamir. Sov. Phys. Crystallogr. 1992, 37, 470–472. [Google Scholar]
  34. Sofich, D.; Tushinova, Y.L.; Shendrik, R.; Bazarov, B.G.; Dorzhieva, S.G.; Chimitova, O.D.; Bazarova, J.G. Optical spectroscopy of molybdates with composition Ln2Zr3(MoO4)9 (Ln: Eu, Tb). Opt. Mater. 2018, 81, 71–77. [Google Scholar] [CrossRef]
  35. Kaneva, E.; Shendrik, R.; Mesto, E.; Bogdanov, A.; Vladykin, N. Spectroscopy and crystal chemical properties of NaCa2[Si4O10]F natural agrellite with tubular structure. Chem. Phys. Lett. 2020, 738, 136868. [Google Scholar] [CrossRef]
  36. Kaneva, E.V.; Shendrik, R.; Radomskaya, T.A.; Suvorova, L.F. Fedorite from Murun Alkaline Complex (Russia): Spectroscopy and crystal chemical features. Minerals 2020, 10, 702. [Google Scholar] [CrossRef]
  37. Chukanov, N.V.; Chervonnyi, A.D. Infrared Spectroscopy of Minerals and Related Compounds; Springer: Cham, Switzerland, 2016; 1109p. [Google Scholar] [CrossRef]
  38. Clark, R.J.H.; Cobbold, D.G. Characterization of sulfur radical-ions in solutions of alkalipolysulfides in dimethylformamide and hexamethylphosphoramide and in solid-state in ultramarine blue, green, and red. Inorg. Chem. 1978, 17, 3169–3174. [Google Scholar] [CrossRef]
  39. Li, S.; Liu, M.; Sun, L. Preparation of acid-resisting ultramarine blue by novel two-step silica coating process. Ind. Eng. Chem. Res. 2011, 50, 7326–7331. [Google Scholar] [CrossRef]
  40. Chukanov, N.V. Infrared Spectra of Mineral Species: Extended Library; Springer-Verlag GmbH: Dordrecht, The Netherlands, 2014; 1716p, ISBN 9400771274. [Google Scholar]
  41. Wong, M.W.; Steudel, R. Structure and spectra of tetrasulfur S4—An ab initio MO Study. Chem. Phys. Lett. 2003, 379, 162–169. [Google Scholar] [CrossRef]
  42. Tubergen, M.J.; Lavrich, R.J.; McCargar, J.W. Infrared Spectrum and Group Theoretical Analysis of the Vibrational Modes of Carbonyl Sulfide. J. Chem. Ed. 2000, 77, 1637–1639. [Google Scholar] [CrossRef]
  43. Nakamoto, K. Infrared and Raman Spectra of Inorganic and Coordination Compounds, 4th ed.; A Wiley-Interscience Publication: New York, NY, USA, 1986. [Google Scholar]
  44. Ledé, B.; Demortier, A.; Gobeltz-Hautecœur, H.; Lelieur, J.-P.; Picquenard, E.; Duhayo, C. Observation of the ν3 Raman band of S3 inserted into sodalite cages. J. Raman Spectrosc. 2007, 38, 1461–1468. [Google Scholar] [CrossRef]
  45. Rolfe, J. Emission spectra of S2−, Se2−, and SeS ions in KI Crystals. J. Chem. Phys. 1968, 49, 4193–4197. [Google Scholar] [CrossRef]
  46. Goslar, J.; Lijewski, S.; Hoffmann, S.K.; Jankowska, A.; Kowalak, S. Structure and dynamics of S3− radicals in ultramarine-type pigment based on zeolite A: Electron spin resonance and electron spin echo studies. J. Chem. Phys. 2009, 130, 204504. [Google Scholar] [CrossRef]
  47. Pinon, V.; Levillain, E.; Lelieur, J. The S3– radical as a standard for ESR experiments. J. Magn. Reson. 1992, 96, 31–39. [Google Scholar] [CrossRef]
  48. Kowalak, S.; Jankowska, A.; Zeidler, S.; Wiećkowski, A.B. Sulfur radicals embedded in various cages of ultramarine analogs prepared from zeolites. J. Solid State Chem. 2007, 180, 1119–1124. [Google Scholar] [CrossRef]
  49. Vassilikou-Dova, A.B.; Lehmann, G. Paramagnetic defects in the mineral hauyne. Cryst. Res. Technol. 1990, 25, 525–529. [Google Scholar] [CrossRef]
  50. Barabas, M. The nature of the paramagnetic centres at g = 2.0057 and g = 2.0031 in marine carbonates. Intern. J. Radiat. Appl. Instrum. Part D Nucl. Tracks Radiat. Meas. 1992, 20, 453–464. [Google Scholar] [CrossRef]
  51. Sapozhnikov, A.N. Indication of additional reflections on lazurite debyegrams in connection with the study of modulation of its structure. Zapiski Vsesoyuznogo Mineral. Obs. 1990, 119, 110–116. (In Russian) [Google Scholar]
Figure 1. Grains of a deep blue sodalite-group mineral (the KL sample) in coarse-grained calcite. Field of view width: 6 mm. Photographer: Sergey V. Lipko.
Minerals 10 01042 g001
Figure 2. (a) Lilac haüyne (the LSh sample) forming rim around light gray fine-grained aggregate of earlier silicates, in association with lazurite (blue). Field of view width: 15 mm. Photographer: Sergey V. Lipko. (b) Imperfect crystals of an analogous sample from the Tultuy gem lazurite deposit, Baikal Lake area. Field of view width: 6 mm. Photographer: Nikita V. Chukanov.
Minerals 10 01042 g002
Figure 3. Light blue haüyne (the MD sample) in calciphyre, in association with pyrite (yellow, with metallic luster). Field of view width: 15 mm. Photographer: Sergey V. Lipko.
Minerals 10 01042 g003
Figure 4. Grains of lazurite (dark blue, the ZK sample) in association with bystrite, ideally Na7Ca(Al6Si6O24)S52−Cl (orange–yellow) and diopside (light gray) in calciphyre. Field of view width: 22 mm. Photographer: Tatiana A. Radomskaya.
Minerals 10 01042 g004
Figure 5. Crystals of haüyne (blue) in association with titanite (orange) and amphibole (black) on sanidinite. The Hn7981 sample. Field of view width: 8 mm. Photographer: Nikita V. Chukanov.
Minerals 10 01042 g005
Figure 6. Infrared absorption spectra of the haüyne samples (a) LSh, (b) MD, and (c) Hn7981.
Minerals 10 01042 g006
Figure 7. Infrared absorption spectra of the minerals belonging to the haüyne–lazurite solid-solution series: (a) PH, (b) KL, and (c) ZK.
Minerals 10 01042 g007
Figure 8. Raman spectra of (a) LSh and (b) MD.
Minerals 10 01042 g008
Figure 9. Raman spectra of (a) Hn7981 and (b) PH.
Minerals 10 01042 g009
Figure 10. Raman spectra of (a) KL, and (b) ZK.
Minerals 10 01042 g010
Figure 11. Twin of the F-dominant, S2•−-bearing sodalite-group mineral from the In den Dellen (Zieglowski) pumice quarry, Eifel, Germany. Field of view width: 0.5 mm. Photographer: Marko Burkhardt.
Minerals 10 01042 g011
Figure 12. UV-Vis absorption spectra of: 1—LSh; 2—MD; 3—PH; 4—KL; 5—ZK.
Minerals 10 01042 g012
Figure 13. Photoluminescence spectra of the MD sample under 405-nm excitation measured at room temperature (curve 1) and 77 K (curve 2).
Minerals 10 01042 g013
Figure 14. Room-temperature ESR spectra of: 1—LSh; 2—MD; 3—PH; 4—KL; 5—ZK.
Minerals 10 01042 g014
Figure 15. The (2kl) single-crystal X-ray diffraction photograph of the MD sample. Reflections corresponding to cubic pseudo-cell parameters and satellites are indicated.
Minerals 10 01042 g015
Figure 16. Fragments of the powder X-ray diffraction patterns of the samples KL (upper curve) and MD (lower curve). The (1 1 0), (2 1 0), (2 1 1), and (2 2 0) reflections of these samples (indicated by vertical lines) have close d values because of close values of their cubic pseudo-cell parameters. Satellites having identical hkl indices with n ≠ 0 (those shown with curves) do not coincide because of different values of the n parameter (0.164 and 0.218, respectively).
Minerals 10 01042 g016
Figure 17. Epitaxy of S3•−-rich and SO42−-depleted lazurite on a haüyne crystal from a metasomatic rock composed of calcite, forsterite, diopside, and pyrite. Sar-e Sang gem lazurite deposit, Afghanistan. Field of view width: 3 cm. Photographer: Nikita V. Chukanov.
Minerals 10 01042 g017
Figure 18. Epitaxy of S3•−-rich and SO42−-depleted lazurite (deep blue) on afghanite crystals. Field of view width: 3.5 cm. The sample originates from the Sar-e Sang gem lazurite deposit, Badakhshan, Afghanistan. Photographer: Nikita V. Chukanov.
Minerals 10 01042 g018
Figure 19. Partial pseudomorphs of S3•−-rich and SO42−-depleted lazurite after phlogopite crystals in marble. Ladgvardara gem lazurite deposit, Tajikistan. Field of view width: 2 cm. Photographer: Nikita V. Chukanov.
Minerals 10 01042 g019
Table 1. Chemical composition of sodalite-group minerals.
SampleLShMDHn7981PHKLZK
ColorLilacLight blueLight blueBright blueDeep blueDark blue
Contents of components (wt%)
Na2O17.6118.0915.0618.0520.0119.94
K2O0.250.131.420.020.200.43
CaO7.816.849.846.915.184.56
Al2O326.8627.3526.0727.3528.2528.02
SiO232.4933.0132.2532.9134.2033.48
CO2 a0.620.100.210.090.620.13
SO313.7812.4313.89 b13.898.678.08
S0.060.11No data1.312.345.07
Cl0.170.500.340.280.710.13
−O=(Cl,S)−0.04−0.12−0.08−0.07−0.07−0.33
Total99.6198.44100.08 c100.74100.11100.71 d
Formula coefficients calculated on Al + Si + Fe = 12 atoms per formula unit and unit-cell parameter a (Å)
Na6.396.455.526.456.906.97
K0.060.030.350.010.050.10
Ca1.571.351.991.360.990.88
Al5.925.935.815.945.925.96
Si6.086.076.106.066.086.04
C0.150.020.050.020.150.03
SO41.931.721.971.561.161.09
S0.020.04No data0.450.781.70
Cl0.070.160.110.090.210.04
a9.0769.067No data9.0719.0669.087
Excess of negative charge in the empirical formula calculated on [(SO4)2−, S2−]
−0.32−0.43−0.10−0.88−1.07−2.77
Kinds and amounts (pfu) of S-bearing extra-framework components determined based on spectroscopic data (see below) and the charge-balance condition
SO42−1.781.351.911.561.161.09
SO3•− 0.37
S2−0.02 0.120.05
S2•− 0.020.03
S3•− 0.030.220.55
S40.03 0.09
a CO2 contents corresponding to CO2 molecules in sodalite cages determined from the IR spectra. b All sulfur is given as SO3. c The total sum includes 0.61 wt.% of Fe2O3 and 0.88 wt.% of H2O which corresponds to 0.09 Fe3+ cations and 0.6 H2O molecules per formula unit, respectively. d The total sum includes 1.2 wt.% of H2O which corresponds to 0.72 H2O molecules per formula unit.
Table 2. Raman bands of sodalite-group minerals and their assignment.
SampleAssignment
LShMDHn7981PHKLZK
Raman Shift (cm−1)
260sh260w258254w258257S3•− bending (ν2)
290sh290sh285wCombination of low-frequency lattice modes
331s cis-S4 symmetric stretching (ν1 − A1)
442s447446s 441s SO4 bending and/or
δ[O–Si(Al)–O]
543s545s545s543s544s546sS3•− symmetric stretching (ν1) (possibly, overlapping with the stretching band of gauche- or trans-S4)
582w583w584sh584sh585shS3•− antisymmetric stretching (ν3) (possibly, overlapping with the stretching band of S2•−)
613616w615 SO4 bending (ν4 − F2)
649 trans-S4 or gauche-S4 symmetric stretching (ν1 − A1)
681s cis-S4 antisymmetric stretching (ν3 − E)
806w805809814811S3•− combination mode (ν1 + ν2)
989s987s989s988w988w SO4 symmetric stretching (ν1 − A1)
1047w Framework stretching vibrations ?
1084s1091s1090s1089s1093s1093sS3•− overtone (2 × ν1) [possibly, overlapping with SO4•− stretching band (ν3 − F2)]
1152w SO4 asymmetric (ν3 − F2) mode [possibly, overlapping with S2•− overtone (2 × ν1)]
1160sh1166sh S2•− overtone (2 × ν1)
1335br cis-S4 antisymmetric stretching (2 × ν3)
1360135313621363S3•− combination mode (2ν1 + ν2)
163516351636163216361638S3•− overtone (3 × ν1)
1900w18971905w1903S3•− combination mode (3 × ν1 + ν2)
2158w21692173217421822181S3•− overtone (4 × ν1)
2267sh Assignment is ambiguous
242824342449w2440wS3•− combination mode (4 × ν2 + ν1)
2579w S–H stretching ?
2691w cis-S4 antisymmetric stretching (4 × ν3)
2760br2720w2712w2717w2720S3•− overtone (5 × ν1)
2975w S3•− combination mode (5 × ν1 + ν2)
3242br3252br3249w3251w S3•− overtone (6 × ν1)
3647br35073495w H2O stretching
Note: w—weak band, s—strong band, sh—shoulder, br—broad band.
Table 3. Powder X-ray diffraction data of the MD sample.
h, k, l *dmeas (Å)dcalc (Å)I (%)h, k, l *dmeas (Å)dcalc (Å)I (%)
1 1 06.426.4113.53 + n, 3, n2.0602.0603.8
1 + n, 1, n5.725.714.44 + n, 1 + n, 12.0152.0162.5
2–0.5, 1–0.5, 14.8594.8473.43 3 21.93281.93313.3
2 0 04.5384.5345.84 2 21.84871.85082.2
2 − n, 1 − n, 14.1394.1344.54 + n, 2 − n, 21.81441.81541.9
2 1 04.0584.0553.65 1 0, 4, 3, 11.77811.77827.6
2, 1 − n, 1 − n3.9613.9624.24, 3 + n, 1 − n1.74821.74661.8
2–0.5, 1 + 0.5, 13.8623.8662.95 + n, 1 − n, 01.71881.71971.6
2 1 13.7033.7021005 2 11.65531.65542.8
2 + n, 1 − n, 13.5513.55134 − n, 4, n1.64461.64492
2, 1 + n, 1 + n3.4403.4414.54 − n, 3 − n, 31.62531.62581.6
2 + n,1 + n,13.3393.3394.34 4 01.60281.60297.2
2 2 03.2033.2063.24 − n, 3 + n, 31.55511.55963.8
2–0.5, 2 + 0.5, 03.1113.1102.94 4 21.51091.51123.5
2 + 0.5, 1 + 0.5, 12.9432.9422.96 1 11.47101.47094.3
3 1 02.8682.86713.94 + n, 4, 2 + n1.45861.45841.7
2, 2 − n, 2 − n2.8162.8144.25, 4 − n, 1 + n1.41991.41931.7
3 + n, 1 − n, 02.7322.7402.75 4 11.39881.39911.6
2 2 22.6182.61725.96 − n, 2, 2 + n1.39261.39271.6
2 + n, 2 + n, 22.4412.4413.86 2 21.36691.36695.4
3 2 12.4232.4237.96 3 11.33711.33692.2
4 0 02.2672.2676.94 4 41.30851.30873.5
4 − n, 1 + n, 12.2112.2113.37 1 01.28251.28232.2
4, 1 − n, 1 − n2.1832.1842.67, 2 − n, 1 − n1.24791.24771.4
4 1 12.1372.13716.17 2 11.23391.23393.7
3 + 2n, 2 + 2n, 12.0922.1002.77, 2 + n, 1 + n1.21841.21851.4
* Simple symbols (1 1 0 etc.) denote the indices of basic reflections; symbols containing ±0.5 (2–0.5, 1–0.5, 1 etc.) refer to the powder diffraction lines of commensurate superstructure; symbols (h ± n, k ± n, l), containing n (the incommensurate modulation parameter), refer to the lines of incommensurate superstructure (satellite reflections). Note: the cubic sub-cell parameter a = 9.067(2) Å, n = 0.214.
Table 4. Powder X-ray diffraction data of the KL sample.
h, k, l *dmeas (Å)dcalc (Å)I (%)h, k, l *dmeas (Å)dcalc (Å)I (%)
1 1 06.436.4112,65 − n, 2 + n, 11.68171.68130.9
1 + n, 1, n5.895.881,25, 2 − n, 1 + n1.66361.66270.8
2 0 04.5384.5334,45 2 11.65541.65512.8
2 − n, 1 − n, 14.0304.0253.34 − n, 4, n1.63461.63491.9
2, 1 − n, 1 − n3.9053.9012.95 + n, 2 − n, 11.62741.62720.8
2 1 13.7043.7011004 4 01.60241.60258.9
2, 1 + n, 1 + n3.5033.5004.65, 3 − n, n1.57651.57630.8
2 + n, 1 + n, 13.4213.4183.74 + n, 4, n1.56911.56952.1
2 2 03.2073.2051.44 3 3, 5 3 01.55441.55473.8
3, 1 − n, n2.9072.9071.35, 3 + n, n1.53181.53150.8
3 1 02.8692.86712.76 0 0, 4 4 21.51081.51094
3, 1 + n, n2.8172.8141.34 + n, 3 + n, 31.50331.50371
2, 2 − n, 2 − n2.7672.7663.15 + n, 3 + n, 01.49701.49700.8
2 2 22.6182.61727.65 − n, 3, 2 + n1.48871.48890.8
3, 2 − n, 1 − n2.5082.5071.25 3 21.47041.47066
2 + n, 2 + n, 22.4822.4803.95, 3 + n, 2 − n1.46381.46331
3 2 12.4242.4237.34 + n, 4 + n, 21.45771.45771
3 + n, 2 − n, 12.3912.3900.95 + n, 3, 2 − n1.45151.45090.9
3, 2 + n, 1 + n2.3392.3381.15, 3 + n, 2 + n 1.43881.43891
3 + n, 2, 1 + n2.3142.31315 + n, 3 + n, 21.42081.42150.8
4 0 02.2672.2666.25, 4 − n, 1 + n1.41411.41450.8
4 − n, 1 − n, 12.2382.2371.15 4 11.39881.39881
4 − n, 1 + n, 12.1942.1942.66 − n, 2 + n, 21.38621.38661.3
4, 1 − n, 1 − n2.1742.1731.26 2 21.36651.36666
4 1 12.1372.13716.86 + n, 2 − n, 21.34551.34601.6
4 − n, 2, n2.0942.0961.36 3 11.33661.33661.9
4 + n, 1 − n, 12.0792.07846 + n, 2 + n, 21.32641.32690.9
4 + n, 1 + n, 12.0442.0432.24 4 41.30811.30854
3 − n, 3 − n, 22.0232.02615 − n, 5, n1.30271.30280.7
3, 3 − n, 2 − n2.0062.00615 − n, 4, 3 + n1.28981.28980.8
3 3 21.93331.93272.77 1 0, 5 5 01.28191.28201.8
4 − n, 2 + n, 21.87331.874117, 1 + n, n1.27701.27720.8
3, 3 + n, 2 + n1.86221.86251.26, 4 − n, n1.27251.27260.7
3 + n, 3 + n, 21.84921.84981.37 − n, 2 − n, 11.26761.26800.6
4 − n, 3, 1 − n1.83441.83461.16 − n, 4 + n, 01.26451.26450.6
4, 3 − n, 1 − n1.82281.82241.46 4 01.25671.25710.8
4, 3 − n, 1 + n1.79911.79880.97, 2 − n, 1 − n1.24411.24441.2
4 3 11.77761.77789.17 2 11.23341.23364.4
4, 3 + n, 1 − n1.75431.75410.87, 2 + n, 1 + n1.22181.22201.2
4, 3 + n, 1 + n1.73361.73301.26 4 21.21121.21140.9
4 + n, 3, 1 + n1.72291.72271.17 + n, 2, 1 + n1.20411.20420.7
5 − n, 2, 1 + n1.69221.69080.8
* Simple symbols (1 1 0 etc.) denote the indices of basic reflections; symbols (h ± n, k ± n, l), containing n, refer to the lines of incommensurate superstructure (satellite reflections). Note: the cubic sub-cell parameter a = 9.065(1) Å, n = 0.164.
Publisher’s Note: MDPI stays neutral with regard to jurisdictional claims in published maps and institutional affiliations.

