1. Introduction
Owing to an environment constructed by the IoT, the combination of a wide range of wireless sensing networks, and various smart devices, network domains, and network-linked objects have been extended to include objects in real life to form a gigantic network [
1]. Consequently, the relevant information derived from the intelligent-object can be applied to commercial activities. The IoT is not merely an expansion of the Internet or communication networks. Through the ability to link objects, information that is more meaningful can be collected. Hence, when the IoT is combined with the precise positioning function of smart mobile devices, smart location-based personalized information can be obtained, which will eventually subvert traditional business operations.
The wave of digital mobile lifestyle has encompassed the world. The development of smart mobile devices leads to a drastic shift in consumer lifestyles and brings new contents and service applications. Consumers have moved their channels for obtaining knowledge, information, services, and commodities from physical sources to the internet, and from the internet to mobile devices [
2]. This shows that the mobility-, convenience-, and location-based features of smart mobile devices can better stimulate immediate purchases and have evolved into an indispensable channel for commerce.
Due to increasingly fierce competition between enterprises, the product and sales-oriented Marketing 1.0 marketing practice in the past has evolved to Marketing 2.0 [
3], which emphasizes on customer needs and product differentiation. In other words, businesses have focused on product sales and making profit in the past and rarely considered the actual demands of consumers. Enterprises are now in an uncertain market environment. In processing product sales, customers’ demands must be taken as a top priority. In order to conduct focused marketing, key customers must be found. Utilizing information technology, product promotion information can be effectively transmitted to customers via precise positioning.
With the gradual maturing of smart networking technology, increase in transmission speed, increase in the popularity of smart mobile devices and the gradual maturing of wireless communication technology under the IoT environment. If businesses can employ smart mobile devices and wireless sensing precise positioning to mobilize commodity advertising, immediate advertising visual impression and instant availability of commodity promotions will stimulate consumers’ desire for immediate purchase. Consumer purchase rate and transaction opportunities are bound to increase. In recent years, mobile apps have enabled personalized user applications. In addition to communication, mobile internet and smart mobile devices are now applied to entertainment, social interaction, financial transactions, and shopping, among other applications. The existing business model is thoroughly revolutionized, and the e-commerce model has evolved towards value-added mobile commerce services.
The objectives of this study are stated as follows: (1) The context aware module of the IoT is used to provide a location-based service which is more suitable to meet consumers’ needs; (2) The use of the iBeacon sensor positioning for retail application is proposed; (3) The technology acceptance model (TAM) is used as a framework, with the addition of incentive theory viewpoints to discuss the effects of various external stimuli to consumers, and the acceptability and willingness to use store apps.
In this study, TAM is used as a framework, and incentive theory viewpoints are used for some external variables. The framework is able to shed light on whether consumers’ usage behavior is affected by various external stimuli through the indirect influence on perceived usefulness and perceived ease of use. The results of the data analysis show that all facets of this study had good reliability levels, internal consistency, and construct validity. The model validation results show that external variables indirectly influence behavioral intention through perceived usefulness. The investigation of behavioral intention is used to understand users’ acceptance and using willingness of the store app which can help narrow the gap between stores and consumers, and help improve operations. The research results revealed that the external variables of convenience, information, entertainment, and interactive incentives indirectly affect consumers’ behavioral intention through perceived usefulness.
2. Related Works
2.1. Internet of Things (IoT)
The IoT concept was based on Radio Frequency Identification (RFID) technology and was proposed in Massachusetts Institute Technology. Through RFID technology, all objects were interconnected via a network, and smart identification and management could be implemented [
1]. In the era of the Internet, people can interconnect and obtain information via the network. Through the combinational use of network and various wireless communication sensing networks, objects can now communicate with each other through the Internet environment [
1].
The IoT is not a new technology and is actually a very broad concept [
1]. Things are made intelligent through the implantation of various micro-sensing chips in them. A wireless network is used to connect those intelligent things to the Internet. Hence, the information of things can be shared to implement dialogue between people and things, and communication between things. In this way, the things people interact with in their daily lives can automatically report their states. The things also automatically communicate with other things and people. The idea is to make real-life things communicate with each other in the virtual world. In this way, the state of “interconnected things” is attained.
The operation of the IoT is mainly divided into a three-layer structure: the perceived layer, the network layer, and the application layer [
4]. These layers are described below: (1) The lowest layer is the perceived layer. The main task of the perceived layer is to identify objects and to collect the information of various heterogeneous sensing data; (2) The middle layer is the network layer. The network layer is mainly used to conduct the transmission and processing of information being collected in the perceived layer; (3) The top layer is the application layer. This layer combines the societal and real life usage requirements to create an intelligent application system. A sub-layer between the network layer and the application layer that is called the “Application Support Layer” is mainly responsible for providing various types of platforms to connect various transmission networks and application services.
2.2. Context Aware
Schilit and Theimer defined context awareness as a mobile user application that can perceive and respond to changes in the user’s environment [
5]. In other words, it can take corresponding response measures to adapt to the ever-changing environment based on changes in the environment of the user in action (e.g., time, location). Yürür et al. argued that a context-aware system could provide relevant information or services to the user with the relevance based on the user’s objective [
6]. In other words, since people move around, the user’s geographical location will constantly change. Furthermore, the demands of users usually will be altered with changes in the environment, and will take corresponding response measures to adapt to the constantly changing environment.
Schiller and Voisard have pointed out that there are two kinds of behavior in context awareness [
7]: (1) Active context awareness: when the user’s contextual factors have been received by the system, the system will automatically change the context service provided by the system according to the contextual factors at that time; (2) Passive context awareness: the user actively proposes demands on the contextual factors that he is interested in, and then the system provides information according to the user’s requests.
The context-aware message lifecycle consists of four phases. The context acquisition phase is responsible for the acquisition of the source of the perceived messages. The context modeling phase builds models for the collected perceptual messages and shows that it has perceived the message contents. The context reasoning phase conducts context analysis processing on the perceived messages using relevant techniques. Finally, in the context dissemination phase, the context information service is released to users that require or are interested in the information [
8].
2.3. Mobile Commerce
Zhang et al. believed that mobile commerce was the use of mobile devices to link to wireless networks for business activities, which allows users to capture messages instantaneously, without being restricted by time and place [
9]. Furthermore, it possesses unique advantages such as immediacy, popularity, positioning, and personalization, among other characteristics. Jara et al. proposed that the special feature of mobile commerce is wireless linkage [
3]. Many enterprises have used wireless equipment to detect various sensing devices that resemble mobile personal devices to capture all kinds of data in the users’ environment. The data was then transmitted to their equipment via wireless technology, in the hope of developing a new mode of environmental perception.
Mobile commerce can be regarded as a subset or extension of e-commerce [
10]. It means that the old e-commerce model is applied to mobile devices for business purposes. Using location-based and mobile positioning technology, the location information of mobile end-users is obtained, so that mobile devices can accurately identify the user’s location. Mobile commerce can take advantage of this to allow users to receive and transmit relevant local information instantly [
2], and through the tracking and positioning features, merchants can provide consumers regional information that meets their individual needs and the relevant services [
2].
2.4. Incentive Theory
The incentive theory viewpoint maintains that incentive is the stimulus that satisfies individual needs. It has the role of stimulating or inducing an individual to head towards the target [
11]. Stimuli that people want to obtain or are attracted to may be regarded as the incentive. Incentive theory emphasizes the important role of external stimuli-induced motivation and maintains that incentive can evoke certain behavior and guide behavior [
11].
2.5. Technology Acceptance Model (TAM)
Based on the TRA (Theory of Reasoned Action) with some modifications, Davis et al. abandoned the ideas of subjective norm and normative beliefs and the motivation to comply, and instead proposed to add in two important facets: Perceived Usefulness (PU) and Perceived Ease of Use (PEU) [
12]. Moreover, external variables were added to extend the acceptance of the system in question. The model is called the TAM [
12]. It is used to explain, predict, and diagnose the attitude and behavioral intention patterns of users facing new technologies. Since TAM is highly interpretive in the adoption of new technology, it is widely used in studies of consumer acceptance of new technology.
In TAM, there are two important beliefs; perceived usefulness and perceived ease of use. It is assumed that the influences of the external variables that affect users’ behaviors in IT acceptance are exerted through the two beliefs of perceived usefulness and perceived ease of use. Furthermore, the actual usage behavior of the system is produced by combining the two beliefs with usage attitude and usage behavioral intention.
3. The Application of the IoT and iBeacon on Precision Position Marketing
This section introduces the combination of the IoT and iBeacon. Real application examples are provided for explanation.
3.1. Context Applications of the IoT and iBeacon
Since the IoT is built upon the internet, it can combine wireless networks and iBeacon communication sensing to exchange and communicate information, and enable intelligent identification, positioning, and management for effective advertisement and location-based promotion. This study explores the use of iBeacon wireless sensors inside and outside the stores. When a consumer holds a smartphone into the sensing range of iBeacon, the smartphone’s app will trigger a series of actions after it detects the iBeacon signal.
When retailers who directly face the consumers are incorporated with location-based services and mobile commerce, iBeacon can provide them with purchase guidance and navigation capabilities via consumer micro-location technology, and provide services pertaining to personalized information demands. In other words, using users’ locations to proactively promote store discount messages and discount coupons to induce actual purchasing, will bring about real effectiveness in guiding customers for the merchants. When a consumer establishes a purchase list in a smart device app, as long as the consumer enters the store, the smartphone will inform the location of each item, saving shopping time and improving efficiency. Consumer bonus points will also be automatically stored in the phone. The app also reminds users about bonus point exchange services, and provides an interesting and innovative shopping experience. iBeacon is able to detect the number of visitors in each area of the shop, as well as track the time visitors stayed in an area and also their purchases. This data can be used as a reference for the placement of products and the purchase of new goods. Furthermore, through integration with members’ historical consumption records, different product messages can be promoted according to consumers’ spending habits to achieve precise positioning service marketing of personalized service.
The high extent of integration of the IoT and iBeacon can be widely and effectively utilized in a variety of different contexts. The physical stores are transformed as a location for having an experience for the customers. They can provide the most appropriate services at consumers’ locations and have profound business application value.
3.2. Case Study
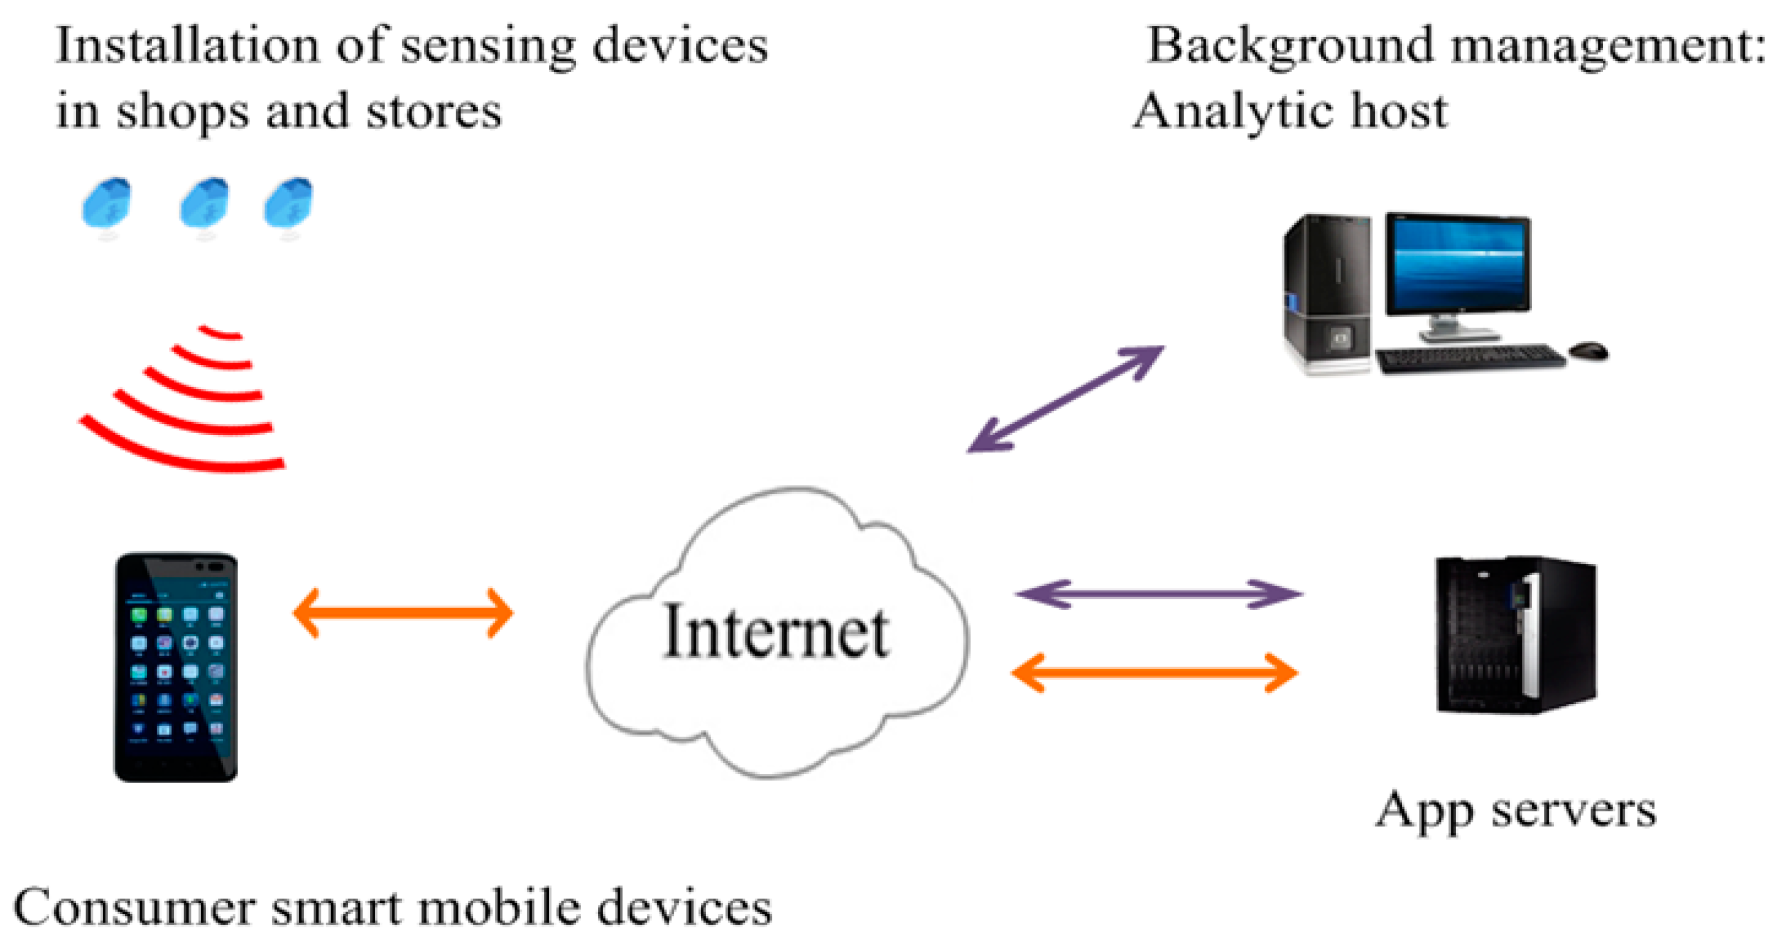
In this section, a case study of an electronics retailer store with built in iBeacon and smart mobile device shopping applications in the context perception module of the IoT are discussed. The example helps us understand the acquisition and feedback of sensing device information in the IoT. The architecture of the mobile commerce application system in the IoT, as shown in
Figure 1, has the following system functions:
- (1)
Description of the application system
The consumer smart mobile device application logs in to the interactive app developed by the store and validates identification, and consequently turns on the Bluetooth system.
The app scans the sensing device’s ID, and transmits the sensing device ID back to the app server.
In accordance with the background management, the app service server transmits the setup configuration of the corresponding sensing device ID to the smart mobile device.
Meanwhile, in accordance with the background management analysis, the app service server updates the information setting and transmits it to the app on the smart mobile device.
The sensing device ID is continuously transmitted back to the app service server, which records the customer’s behavior tracking records in the store area.
- (2)
Application system functions
Front-end interface: The customer’s smart mobile device app interface where they log in to the interactive app developed by the store and turn on the Bluetooth system. The functions include information reception and inquiry; store navigation and product recommendations; activity participation; checkout payment; and customer satisfaction survey.
Sensing Devices: The functions include positioning; sensing customers’ behavioral patterns and information feedback.
Back-end Management: Analytic host.
Maintaining members’ basic information, including updating and maintaining membership information; maintenance of membership rewards; maintaining the merchandise purchase records; and maintaining the behavioral tracking records.
Maintaining the transmitted messages, including navigational information and recommended information.
Maintaining marketing activities, including promotional merchandise information; bargain commodity information; and rewards activity information.
Back-end server: app services, including: send activity messages to app, customer identification, and customer action tracking record.
In the IoT environment, cloud-computing technology can be used as an assisting resource, such as for resource storage, data analysis, and computing technology. In the IoT, consumers use intelligent mobile device apps to receive the sensing information service in the stores. They are described as follows:
- (1)
Customer section: When a customer arrives at the entrance of a store, they can use the smart mobile device app to activate the sensing functions, through location-based personalized context perception or store customer analysis, the customer will be guided to the store’s product areas, recommend products, or encouraged to participate in store activities.
- (2)
Enterprise/store section: Provides app web page services for mobile commerce, such as the provision of sensing information of the sensing devices, inquiry service, after-sales service, and customer satisfaction survey. In the IoT, all these can be used as context-perception web page service messages and as the source of feedback information. The customers’ feedback information can be used to adjust product strategy, or as the basis to improve retail services, thereby improving the company’s operations and management.
- (3)
Shop entrance: Sensing devices are installed at the store entrance to identify the customers, and to send store activity information, such as membership identification, current accumulated bonus points, store promotions, and so forth, to them.
- (4)
Store area: In each store area, context-sensing devices are installed to obtain consumer-sensing information. Location-based personalized needs are used to guide customers to various product areas. Commodities are recommended according to customer’s personal consumption record. Using the sensing devices, customers’ behavior records are sent back to the back-end app server to for customer relationship management and analysis.
- (5)
At the checkouts: When customers purchase products, they can use smart mobile devices to pay, which can become a source of sensing information. Customers can be classified according to the characteristics of the goods purchased and the amount spent.
From the examples in this section, the applications of sensing devices and information feedback in the IoT are introduced. The context perception module conducts analysis and processing of the sensed information, and then provides relevant sensed information to customers. Location-based personalized recommendation of products can be given to customers. The sensing devices will record customer behavior patterns and purchased products.
Furthermore, the behavior patterns of customer will be transmitted back to the back-end server to maintain the member database in the back-end by the sensing devices. Customer behavior is used as a reference for future merchandise purchasing and the sending of promotional messages, in order to implement customer relationship management and analysis.
4. Study Method
This study investigated consumers’ behavioral intentions in using information technology. Technology acceptance mode and incentive theory are used as a research framework and a questionnaire survey method is used for data collection. Later on, quantitative statistics and analysis of the questionnaire data are conducted.
4.1. Reearch Structure
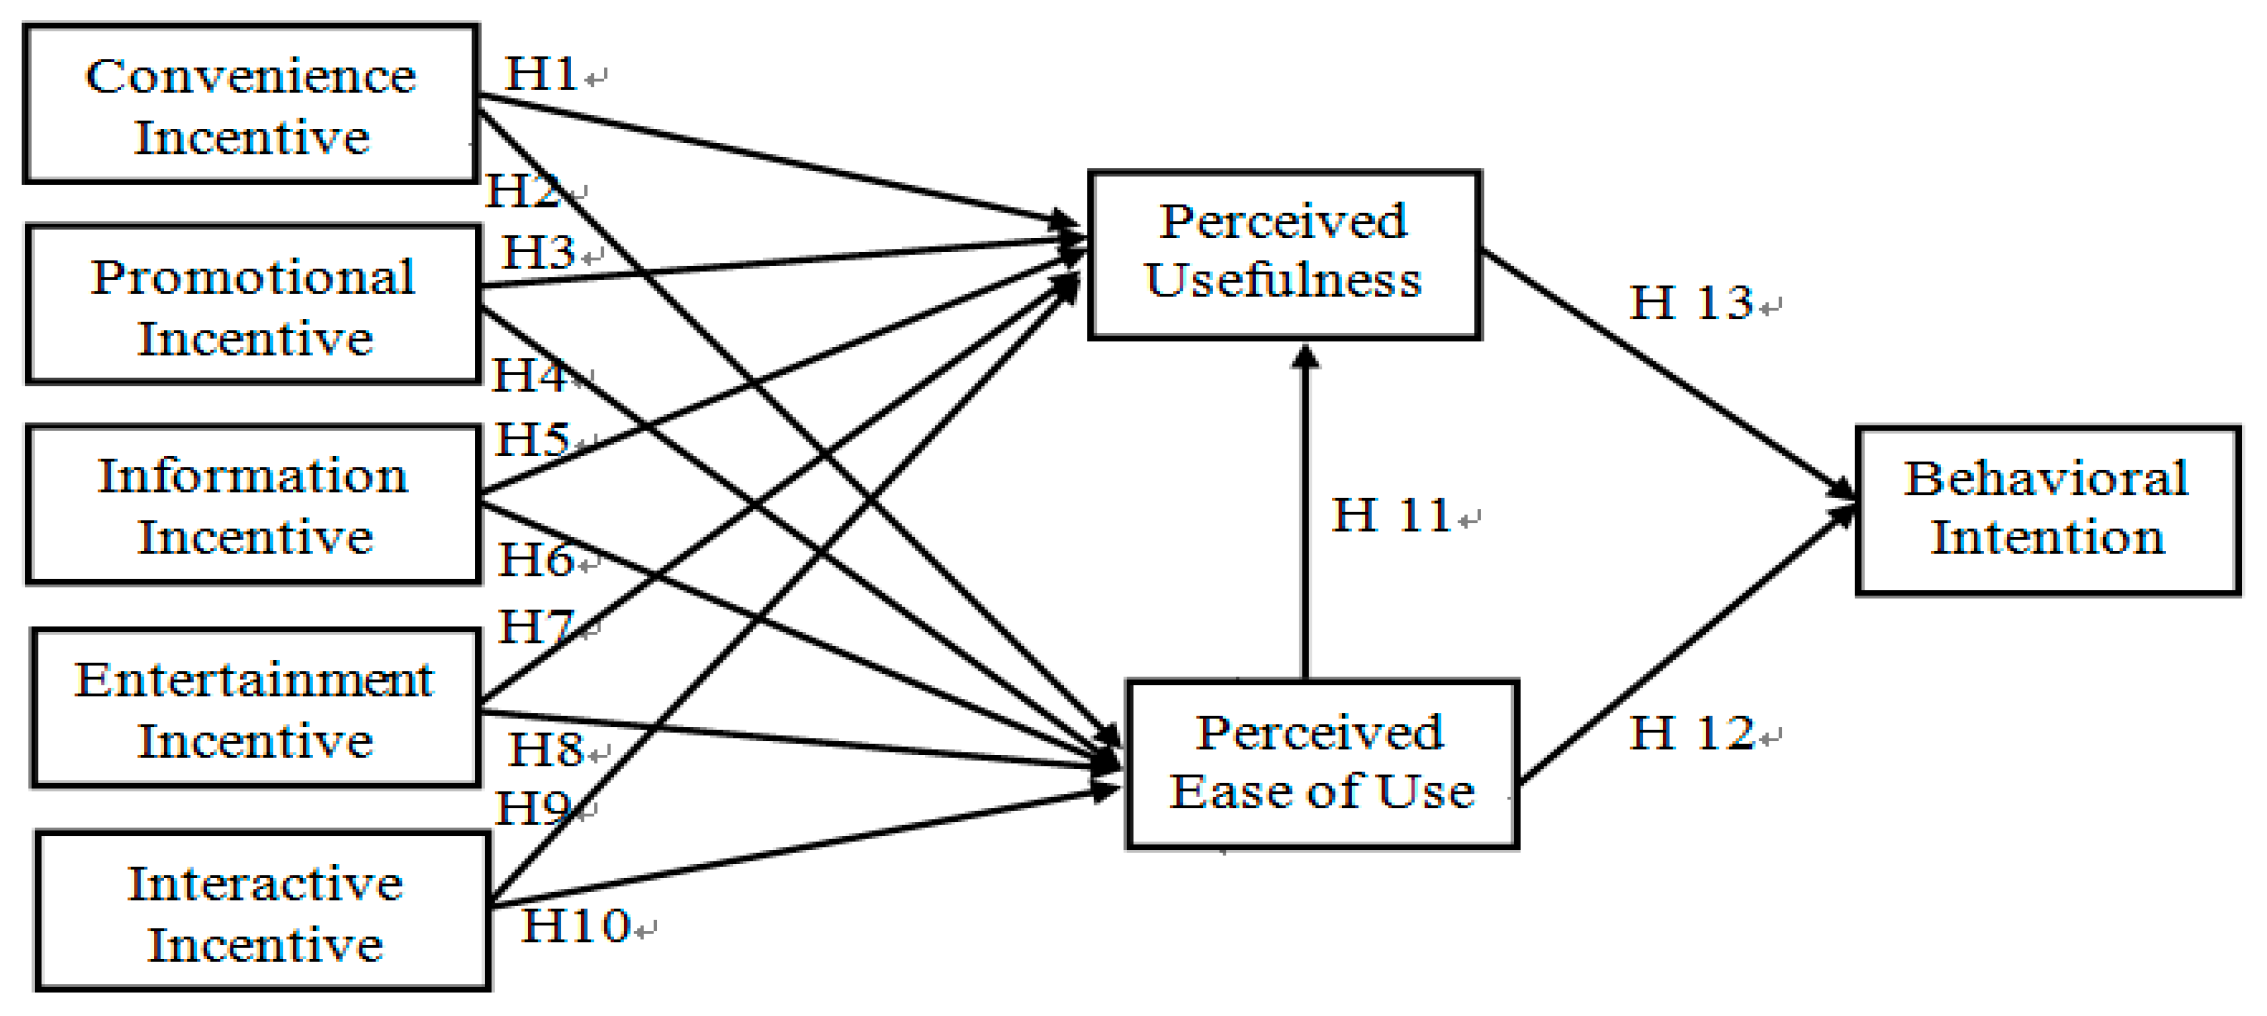
Davis et al.’s TAM is used as the framework in this study. Incentive theory is used to model the external variables that influence consumers to understand the effects on consumers’ behavioral intention under the stimulation of incentives [
12]. The framework is shown in
Figure 2.
4.2. Study Hypothesis
The hypothesis in this study is based on the integration of the objectives, literature research, and research framework of this study. The following hypotheses and explanations are proposed.
4.2.1. Relationship between Convenience Incentive, and Perceived Usefulness and Ease of Use
Cantallops and Salvi believe that the more convenience a product or service provider can add, the more consumers will focus on their products and services, and increase their willingness to buy and use [
13]. A positive relationship between perceived usefulness and perceived ease of use can be seen. Consequently, this study proposes the following hypotheses:
Hypothesis 1 (H1). Convenience incentive has a significant effect on perceived usefulness.
Hypothesis 2 (H2). Convenience incentive has a significant effect on perceived ease of use.
4.2.2. A Study of the Relationship between Promotion Incentive and Perceived Usefulness & Perceived Ease of Use
Schultz and Robinson argued that promotion is a direct incentive or inducement for agents, distributors or customers to create immediate sales results [
14]. Hence, promotion incentive has a positive relationship between perceived usefulness and perceived ease of use. This study proposes the following hypotheses:
Hypothesis 3 (H3). Promotion incentive has a significant effect on perceived usefulness.
Hypothesis 4 (H4). Promotion incentive has a significant effect on perceived ease of use.
4.2.3. A Study of the Relationship between Information Incentive and Perceived Usefulness & Perceived Ease of Use
When a visitor receives the information, they may pay special attention to the quality of the information contents, as the quality of the information content can help them make good purchasing decisions. Hence, information incentive has a positive relationship between perceived usefulness and perceived ease of use. This study proposes the following hypotheses:
Hypothesis 5 (H5). Information incentive has a significant effect on perceived usefulness.
Hypothesis 6 (H6). Information incentive has a significant effect on perceived ease of use.
4.2.4. A Study of the Relationship between Entertainment Incentive and Perceived Usefulness & Perceived Ease of Use
Tsai believes that through the establishment of an entertaining experience, it will certainly bring more fun and satisfaction to consumers [
15]. Hence, entertainment incentive has a positive relationship with perceived usefulness and perceived ease of use. This study proposes the following hypotheses:
Hypothesis 7 (H7). Entertainment incentive has a significant effect on perceived usefulness.
Hypothesis 8 (H8). Entertainment incentive has a significant effect on perceived ease of use.
4.2.5. A Study of the Relationship between Interactive Incentive and Perceived Usefulness & Perceived Ease of Use
In a commercial environment, interaction refers to the integration of rich contents, active messages, and communication, and creates a compelling consumer experience [
16]. Hence, interactive incentive has a positive relationship with perceived usefulness and perceived ease of use. This study proposes the following hypotheses:
Hypothesis 9 (H9). Interactive incentive has a significant effect on perceived usefulness.
Hypothesis 10 (H10). Interactive incentive has a significant effect on perceived ease of use.
4.2.6. A Study of the Relationship between Perceived Ease of Use and Perceived Usefulness & Behavioral Intention
When the operation of mobile technology devices is simple and easy to use, it will increase the user’s perceived usefulness in new technology, and increase the willingness to use. Hence, perceived ease of use has a positive relationship with perceived usefulness and behavioral intention. This study proposes the following hypotheses:
Hypothesis 11 (H11). Perceived ease of use has a significant effect on perceived usefulness.
Hypothesis 12 (H12). Perceived ease of use has a significant effect on behavioral intention.
4.2.7. A Study of the Relationship between Perceived Usefulness & Behavioral Intention
The higher the usefulness of a particular system as perceived by the user, the more positive the attitude the user will have towards the system [
17]. Hence, perceived usefulness has a positive relationship with behavioral intention. This study proposes the following hypotheses:
Hypothesis 13 (H13). Perceived usefulness has a significant effect on behavioral intention.
4.3. Study Objects, Questionnaire Design and Distribution
The study objects were set as the shops with iBeacon sensors installed and the users who had downloaded the app. The questionnaire was designed for consumers who use the TK-3C Golden Legend app. The paper-based questionnaires were distributed, and the survey was conducted using Convenience Sampling. The 210 questionnaires were collected during the survey period. After manual and lie checking, 21 invalid questionnaires were excluded, leaving 189 valid samples. The effective questionnaire rate was 90%.
The facets in this study are designed according to the research structure of the questionnaire contents. The source of the questionnaires used is based on the relevant studies, which had been verified in the past. Every facet had 8 questions and been slightly modified to fit the situation of this study. Lie checking is added to eliminate invalid questionnaires. The content of the questionnaires is analyzed by scholars specialized in relevant research subjects and who have questionnaire design experience. The content validity of the questionnaires is checked according to the topic meaning, topic order, and legibility of the questionnaires, and is revised according to suggestions. The questionnaires are measured using the 5-point Likert scale and the respondents are asked to select their opinions on the items (1 for strongly disagree, 5 for strongly agree).
5. Data Analysis
Based on the statistical results of the questionnaire survey data, this section will explain the narrative statistical analysis, reliability and validity analysis, and verification of the research model of this study.
5.1. Narrative Statistical Analysis
In this study, basic data analysis is conducted on the valid questionnaire samples. There were more males (n = 104, 55%) than females (n = 85, 45%) among the respondents. The age distribution ranged from 18 to 39 years old and the majority is between 18 and 29 years old. The major marital status is unmarried (n = 101, 53.4%). The major education level is university level (n = 135, 71.4%). Their professions are mainly in the service sector (n = 84, 44.4%) and in the military, police, government, and education sectors (n = 33, 17.5%), followed by the information industry sector (n = 21, 11.1%). The majority had monthly average incomes between $30,001 and $40,000 (n = 78, 41.3%), followed by $40,001 and $50,000 (n = 28, 14.8%). The majority had monthly average expenditure of between $5,001 and $10,000 (n = 64, 33.9%), followed by $10,001 and $20,000 (n = 60, 31.7%).
5.2. Reliability and Validity Analysis
In this section, reliability analysis and factor analysis are described. In this study, SPSS version 22 statistics software are used as data analysis tools.
5.2.1. Reliability Analysis
In questionnaire reliability testing, the reliability of the scale is tested by using Cronbach’s α value proposed by Hair et al. to measure the internal consistency of each facet [
18]. If α is larger than 0.7, the scale had high reliability. The reliability of the questionnaire is acceptable. As shown in
Table 1, the Cronbach’s α values for all the study facets ranged from 0.713 to 0.953. They all attained Cronbach’s α value criterion of 0.7. Hence, all facets of this study have good reliability level and each facet has high internal consistency.
5.2.2. Factor Analysis
In this study, a Bartlett’s Sphericity Test is performed firstly. The test result is 5947.683 (Sig. = 0.000 < 0.05) in Chi-square value, approaching 0.00, and it reaches the significance level. This means that the items have a strong correlation between each other and the data are suitable for factor analysis. Furthermore, the result of Kaiser–Meyer–Olkin (KMO) test is 0.855. This means that each question has a high common variance, and the variations are very low in uniqueness. The results have shown that the samples are suitable for explorative factor analysis. In this study, exploratory factor analysis is used. Principal component analysis is used for factor extract. The maximum variation method is used for axis rotation. According to the analysis results, the non-discriminatory questions or questions with factor loading of less than 0.5 are deleted.
In measuring scale construct validity, the most commonly used method is factor analysis. In the same factor facet, the higher the factor loading (more than 0.5 as standard) in each question, the better the convergent validity. If the questionnaire question was not in the factor facet, the factor loading (less than 0.5 as standard) would be smaller, and it would possess a higher differentiation in validity.
In measuring scale construct validity, the most commonly used method is factor analysis. In this study, the cross-loading scale for each facet shows that all factor loadings of all questions are greater than 0.5 and the other non-facet factor loadings are less than 0.5. Hence, the cross-loading analysis for each facet has reached the standard proposed by Chin [
19]. The above Factor analysis results prove that the study questionnaire has a good construct validity.
From
Table 2, the cross-loading scale for each facet shows that all factor loadings of all questions are greater than 0.5 (numerals in boldface) and the other non-facet factor loadings are less than 0.5. Hence, the cross-loading analysis for each facet has reached the standard proposed by Chin [
19]. The above analysis results prove that the study questionnaire has a good construct validity.
5.3. Research Model Validation
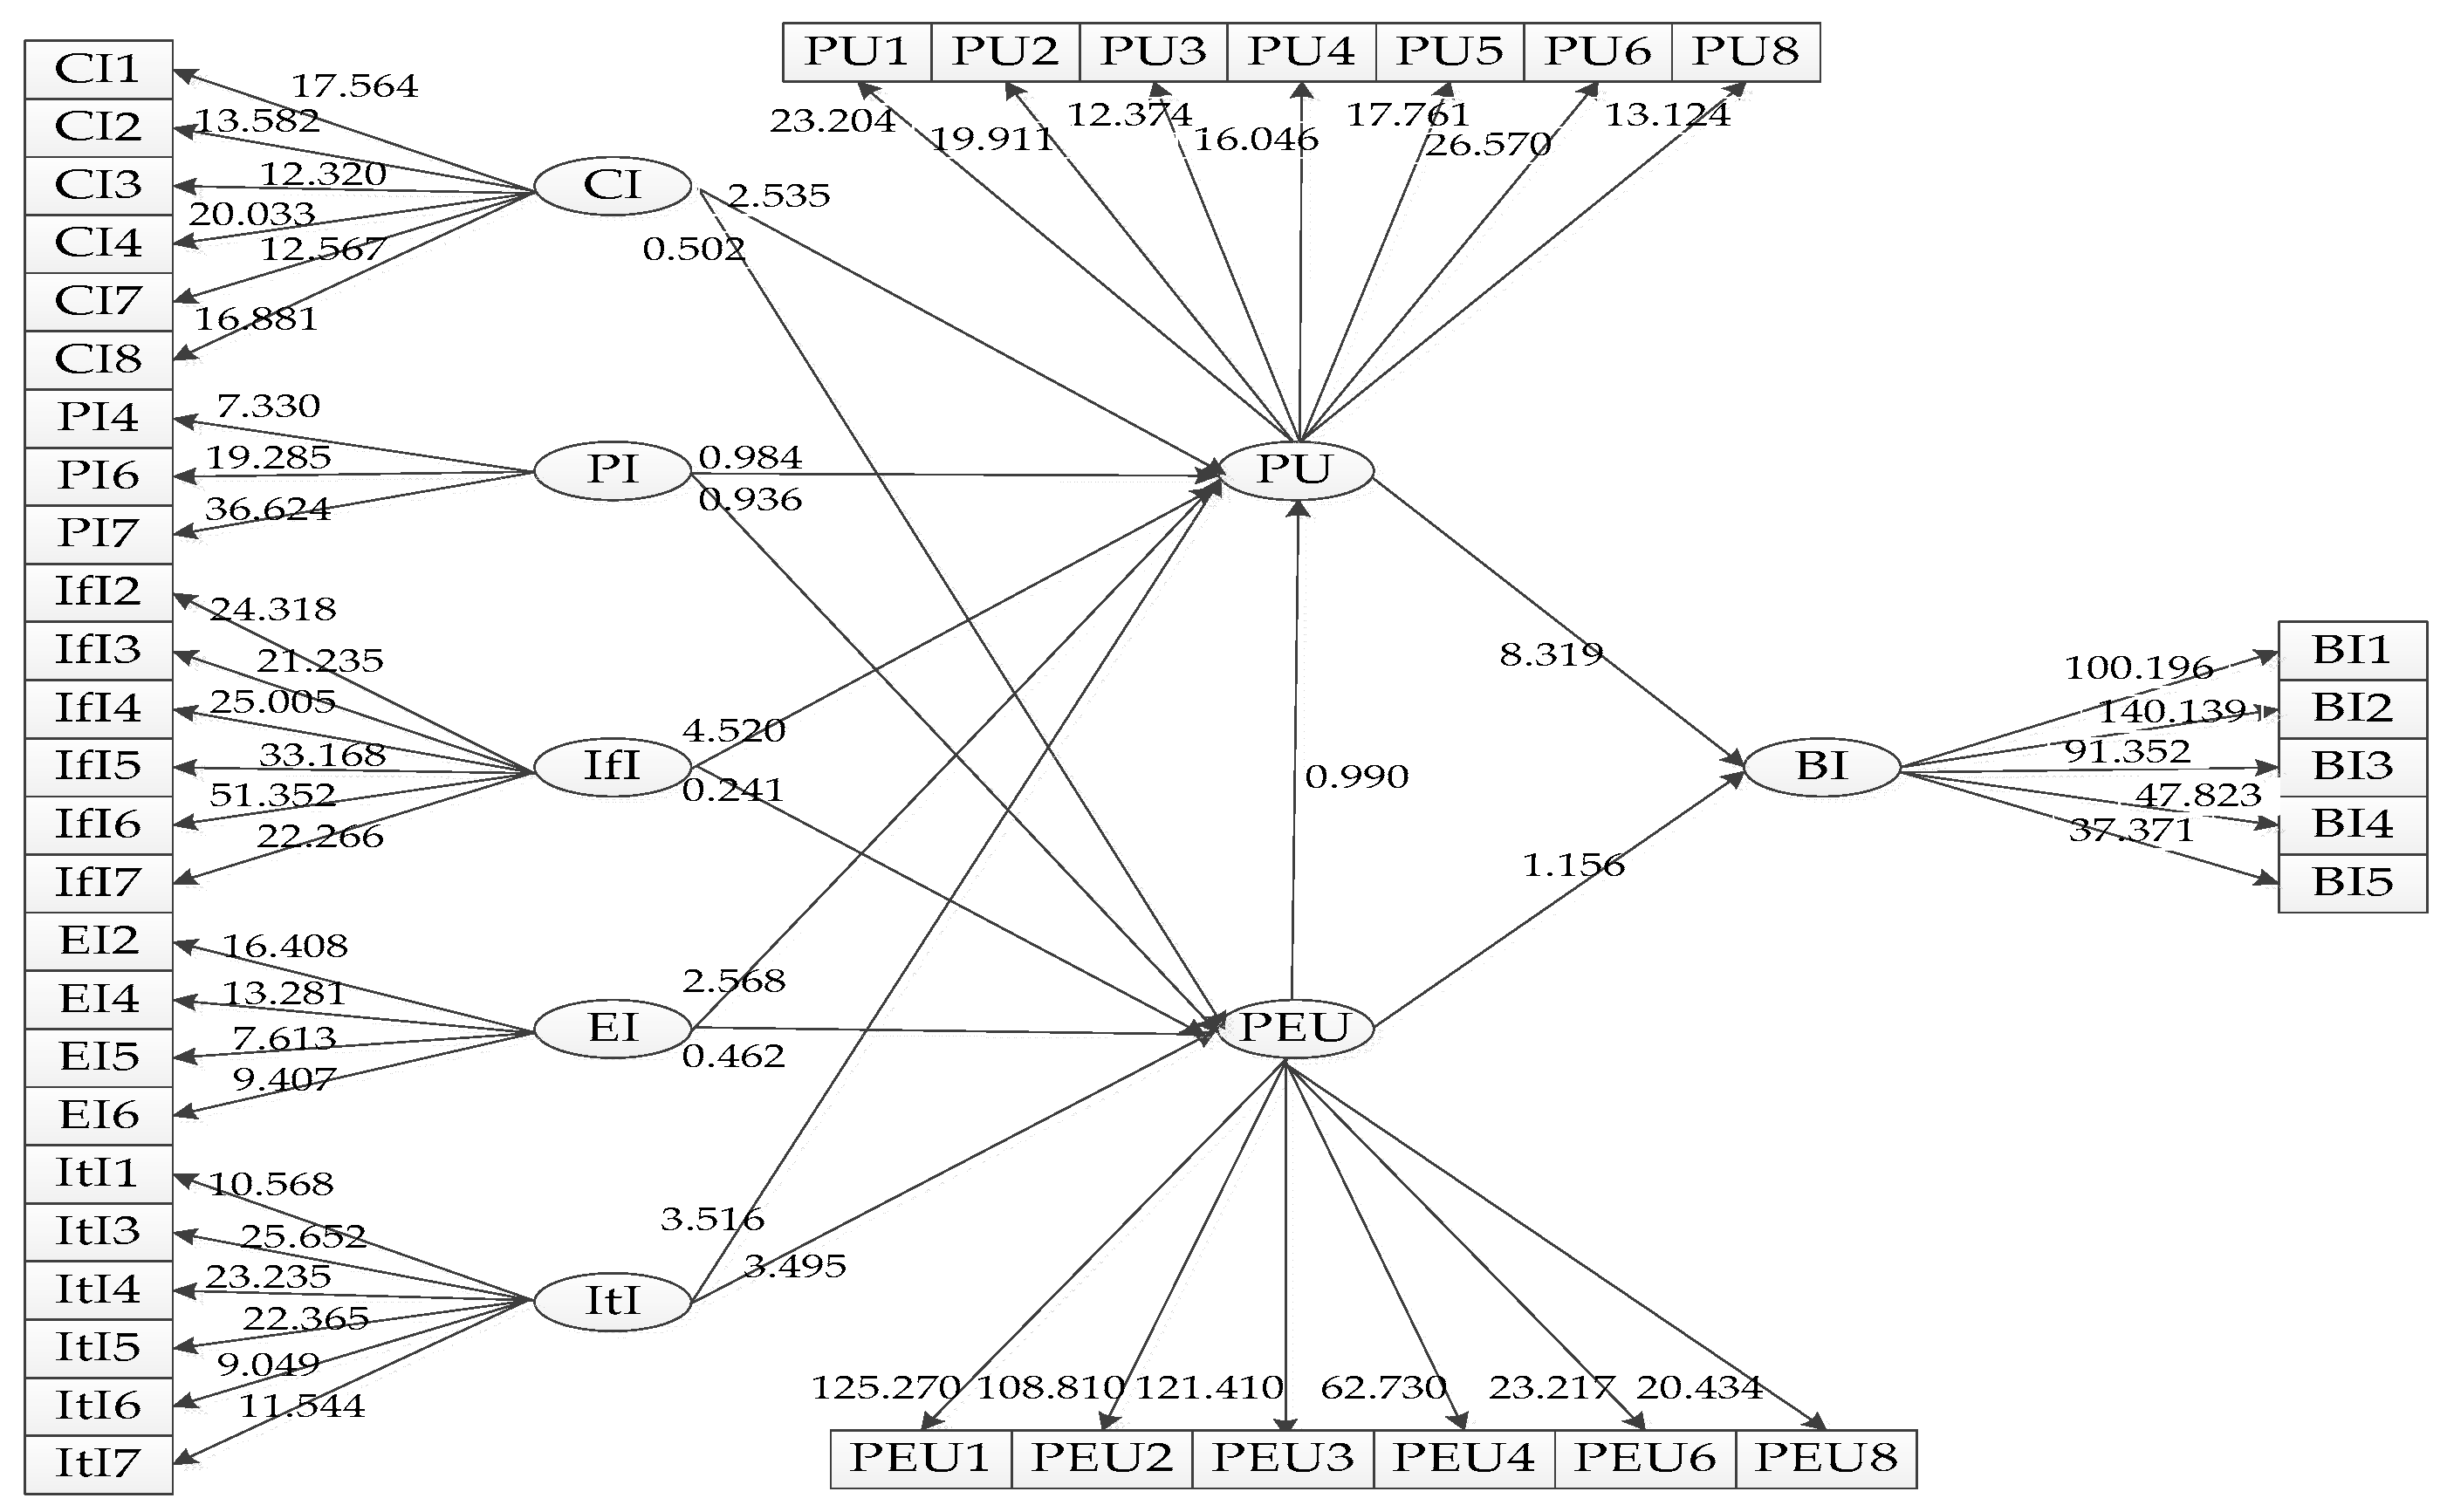
The verification of the significance of the model structural paths is done through the Smart Partial Least Squares (PLS) version 2.0 software. The verification of the structural model is done using the PLS method of Structural Equation Modeling (SEM). It measures the causal relationship between structural facets. PLS is one of the structural equation analysis method, and it is used to verify the path coefficient in the structural model. The path coefficient represents the related intensity and direction between factors, and a two-tailed t-test (t-value > 1.96, p < 0.05) is used as verification for the significance level of the model hypotheses.
In the parameter estimation of Smart PLS, the bootstrapping method is used for analysis. Resampling of samples is used to estimate the distribution of statistical amounts. The settings for resampling are based on the suggestion of Chin [
19]. To verify the significance of the estimated values of model structural paths, the resampling number is set to 500.
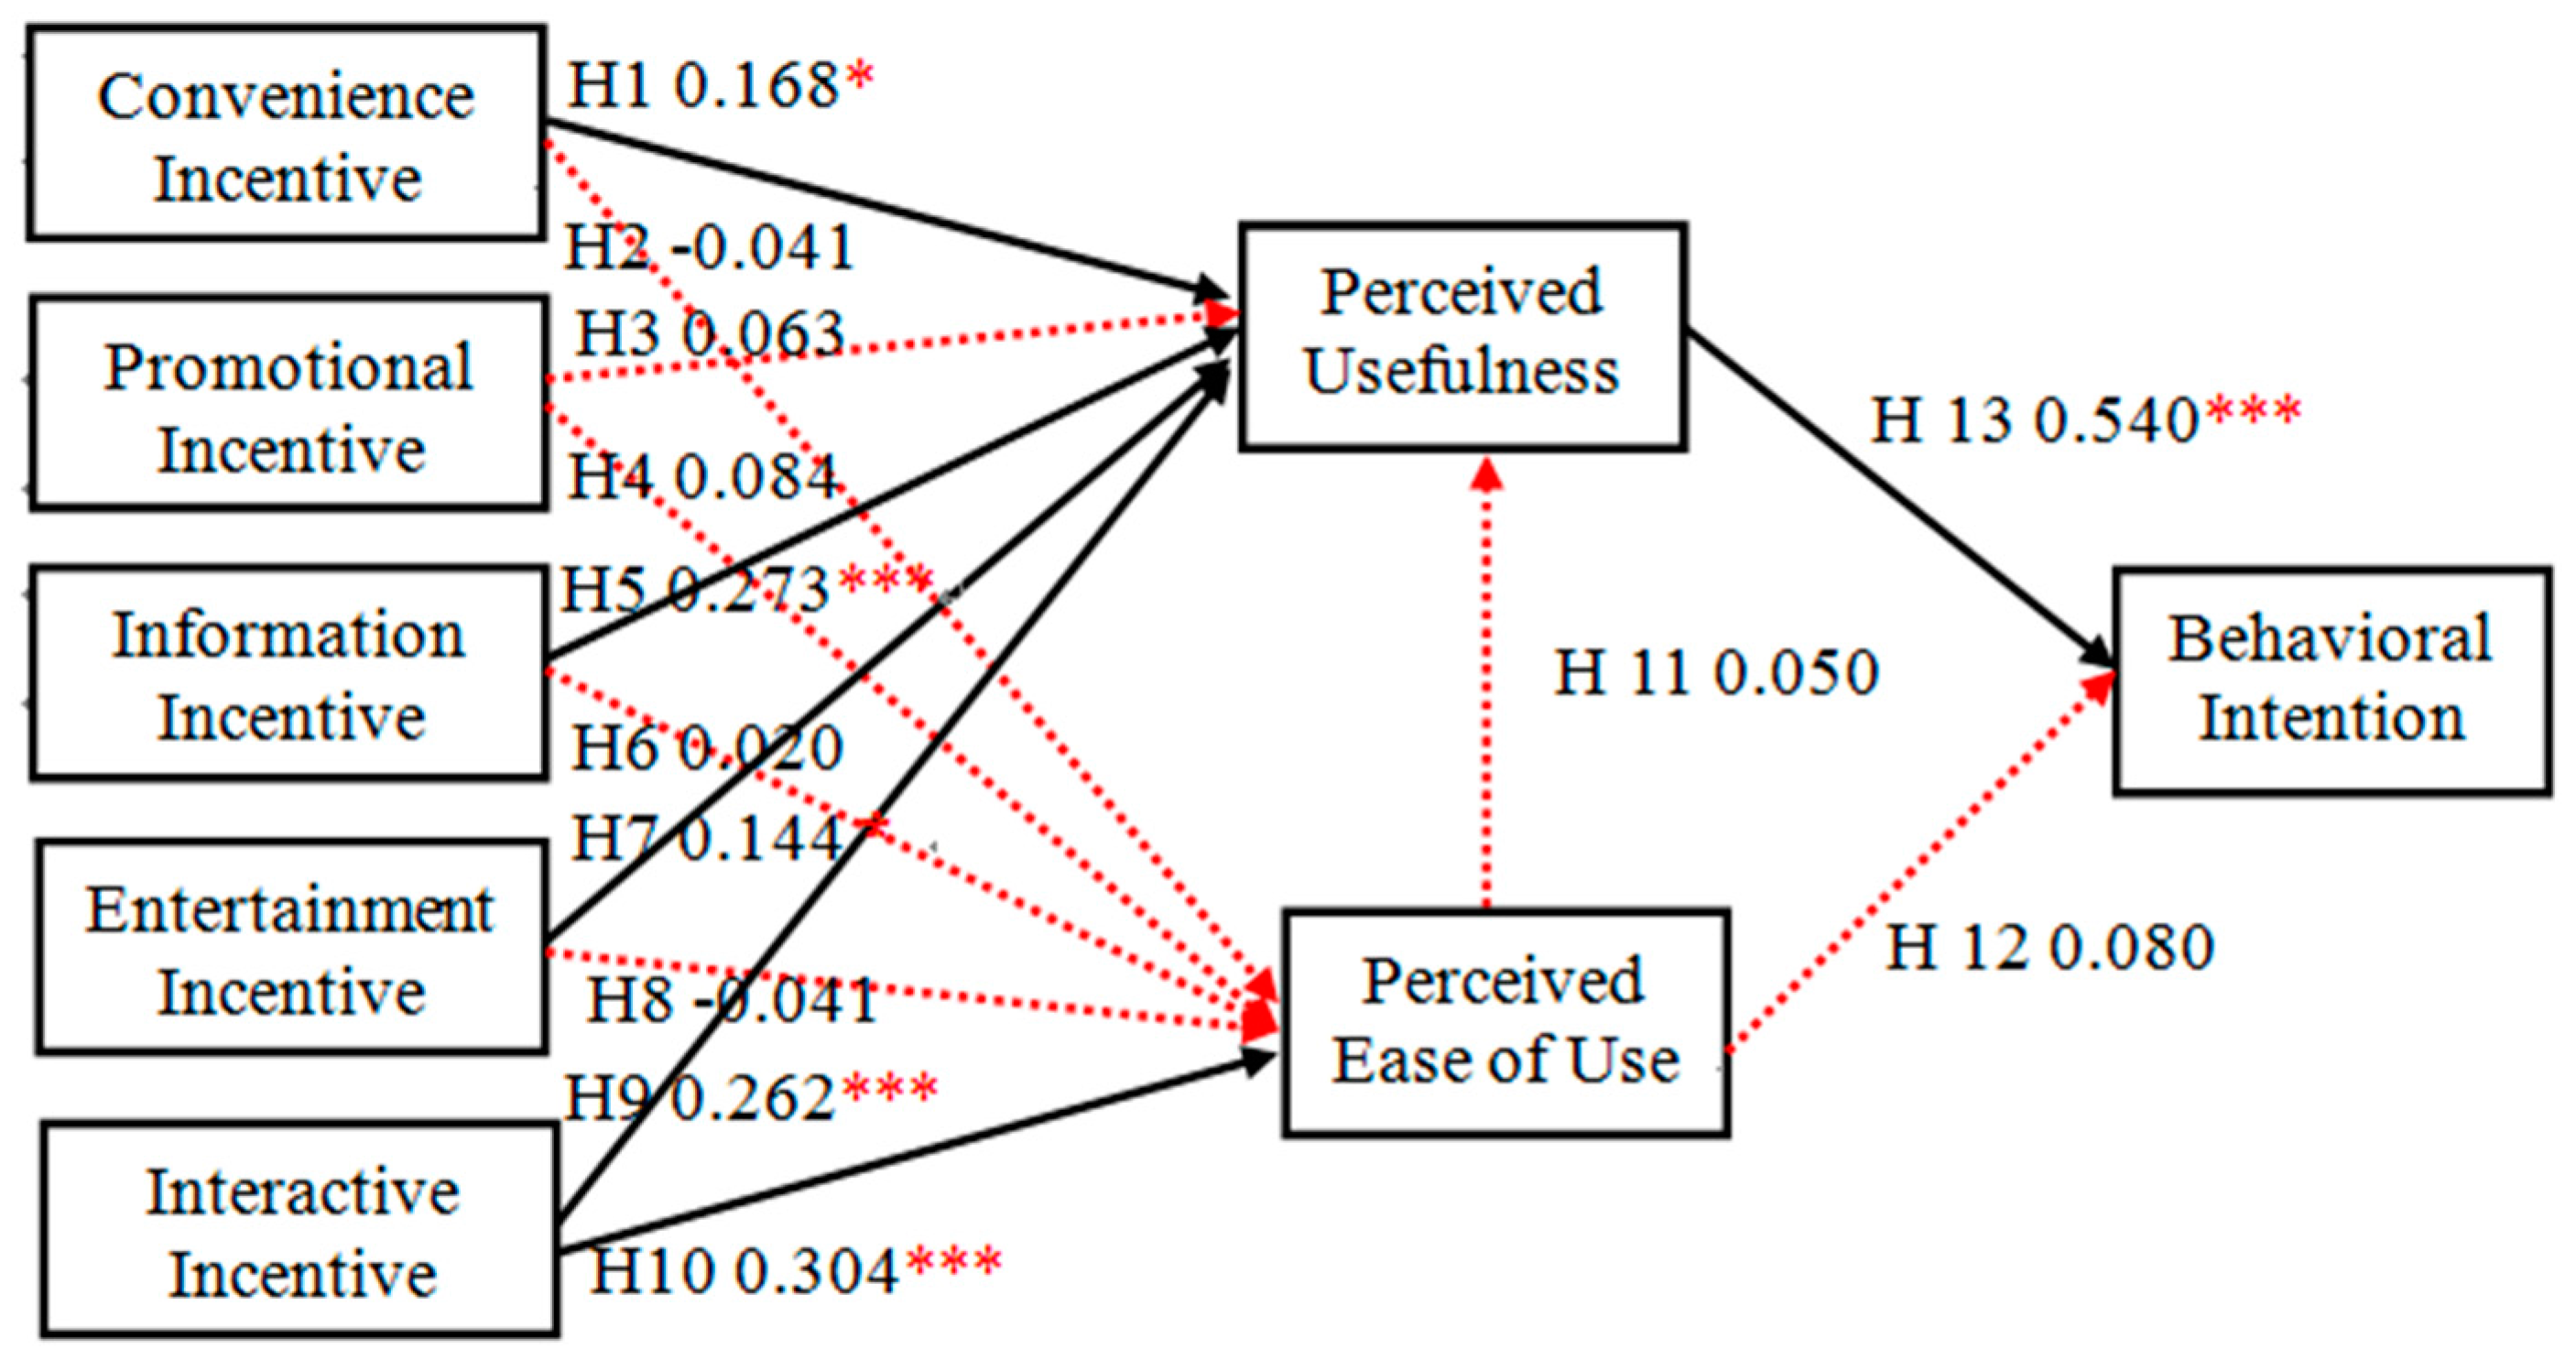
The digits next to the linear model represent the path coefficient (β), the solid line represents significance, and the dashed line represents insignificance, respectively. The path coefficient shows the extent of influence of the independent variable on the dependent variable. When
t-value > 1.96, the
p < 0.05 significant level is marked with *. When
t-value > 2.58, the
p < 0.01 significant level is marked with **. When
t-value > 3.29, the
p < 0.001 significant level is marked with ***. These represent a significant level of causality between facets [
19]. Study mode verification is shown in
Figure 3 and the structural mode path coefficient is shown in
Figure 4.
6. Study Results and Findings
6.1. Hypothesis Verification Results
The results of validation show that convenience, information, entertainment, and interactive incentives all have a positive effect on perceived usefulness. In addition, the perceived usefulness has a positive effect on behavioral intention. As to the influence of convenience, promotion, information, entertainment, and interactive incentives on the perceived ease of use, only interactive incentive has significant effect. However, the behavioral intention does not affect indirectly via perceived ease of use. The summary is shown in
Table 3.
6.2. Supported by Verification
The six hypotheses supported by validation, namely, H1, H5, H7, H9, H10, and H13 are described.
- (1)
Convenience incentive has a significant positive relationship with perceived usefulness: From the results of this study, it is found that convenience incentives had a positive relationship with perceived usefulness. It seems that consumers consider the convenience provided by store apps to be very important. This is in line with what Cantallops and Salvi pointed out: the more convenience a provider added into his product or service, the greater the consumer’s attention to the product or service, and the willingness to purchase and use are also increased [
13].
- (2)
Perceived usefulness has a significant positive relationship with behavioral intention: The results of this study have shown that perceived usefulness has a very positive correlation with behavioral intention, which is in accordance with the TAM proposed by Davis et al. [
12].
- (3)
Information incentive has a significant positive relationship with perceived usefulness: From the results of this study, it is found that information incentive has a significant positive relationship with perceived usefulness. When users received some information, they paid special attention to the quality. Good information quality could help them make good purchase decisions.
- (4)
Entertainment incentive has a significant positive relationship with perceived usefulness: From the results of this study, it is found that entertainment incentives have a significant positive relationship with perceived usefulness. Businesses could use apps to interact with consumers and an emotional link can be achieved by creating a fun shopping experience.
- (5)
Interactive incentive has a significant positive relationship with perceived usefulness and perceived ease of use: From the results of this study, it is found that interactive incentive had a positive significant relationship with perceived usefulness and perceived ease of use. If information devices are easy to use then the user would actively use the technology. The user would feel better about the technology, and would have a more positive attitude towards it [
20].
6.3. Not Supported Via Verification
The seven hypotheses that have not been supported by verification, namely H2, H3, H4, H6, H8, H11, and H12 are discussed.
- (1)
Promotion incentive has an insignificant relationship with perceived usefulness: From the results of this study, it is found that promotion incentive did not affect perceived usefulness to a level of significance; hence, the hypothesis did not hold. In an economic downturn, stores frequently launch promotional activities, such as discount coupons, lucky draws, gifts, and so on. For consumers, these did not necessarily offer substantial benefits. Furthermore, the use of discount coupons required additional consumption or had some other restrictions. Hence, promotion incentives are not necessarily useful for customers.
- (2)
Convenience, promotion, information, and entertainment incentives have an insignificant relationship with perceived ease of use: From the results of this study, it is found that convenience, promotion, information, and entertainment incentives affect perceived ease of use to a level of significance; hence, the hypothesis did not hold. It is also obvious that users’ willingness to use reduces if the information integrity, query convenience, promotional offers, and entertainment experience provided by store apps is lacking or if the app user interface is difficult to use.
- (3)
Perceived ease of use has an insignificant relationship with perceived usefulness and behavioral intention: From the results of this study, it is found that perceived ease of use did not affect perceived usefulness and behavioral intention to a level of significance; hence, the hypothesis did not hold. Evidently, users felt that the user interface of the store app is not intuitive and the functions are complex and difficult to understand. The design of the user interface had plenty of room to be improved.
7. Conclusions
The sensor layer under the IoT architecture has the characteristics of identifying objects and receiving & transmitting sensing messages. Through positioning and tracking technology, retailers can grasp customers’ relevant store activity information. Through context perception, they can initiatively distribute proper promotional messages, product recommendations, and coupons to different counters and areas to increase the effectiveness of mobile advertising, so as to achieve location-based precise positioning marketing.
The investigation of behavioral intention is to understand users’ acceptance of and willingness to use the store app, which can help narrow the gap between stores and consumers, and help improve operations. The study results revealed that the external variables of convenience, information, entertainment, and interactive incentives indirectly affect consumers’ behavioral intentions through perceived usefulness. As to the influence of convenience, promotion, information, entertainment, and interactive incentives on the perceived ease of use, only interactive incentive is significant, yet it does not indirectly affect behavioral intention through perceived ease of use.
The research model revealed that six hypotheses are supported, suggesting that the external variables affecting consumers’ use of apps are mediated by perceived usefulness and affected users’ behavioral intention. Consequently, companies could use external incentives to stimulate consumers into perceiving the usefulness of apps, thus enhancing positive attitude for usage and affecting subsequent behavioral intention.
According to the results of the research, seven hypotheses were rejected. The main reason for this was that external variables that influenced consumers’ usage of apps were not mediated by perceived usefulness and affected user’ behavioral intention. It is clear that while consumers shopped, difficulty in using the app interface lowered consumers’ willingness to use. For further study in the future, a controlled experiment may be used to investigate the cause–effect relation among external variables, difficulties in using the app, and user’s behavioral intentions.


